
 ?Mathematical formulae have been encoded as MathML and are displayed in this HTML version using MathJax in order to improve their display. Uncheck the box to turn MathJax off. This feature requires Javascript. Click on a formula to zoom.
ABSTRACT
The European Higher Education Area and the US National Academies of Science, Engineering, and Medicine have called on higher education to support interdisciplinary learning. The National Academies recommend evaluating interdisciplinary education against relevant criteria, but beyond listing student majors, institutions cannot easily quantify interdisciplinarity in education. The Rao-Stirling diversity index, which incorporates measures of cognitive distance, is used to quantify the interdisciplinarity of research. This study extends the use of the Rao-Stirling diversity index to the context of higher education to: (1) determine whether it provides a more nuanced measure of interdisciplinarity than number of majors, and (2) to examine patterns in interdisciplinarity across 79 student teams in Georgia Tech’s Vertically Integrated Projects Program (N = 1218). The analysis employed cognitive distances developed in a previous study. Distributions of diversity indexes and enrollment by major were examined across the program, along with visualizations for 4 teams. Results show the Rao-Stirling diversity index provided a more comprehensive measure of team interdisciplinarity, and it indicated higher interdisciplinarity in more teams and in comparatively smaller teams than the number of majors would imply. Indexes across the program were examined graphically and explored through regression. Results indicated that higher interdisciplinarity was associated with smaller team size, implying a possible need for additional support for these teams. The utility of the index in quantifying the interdisciplinarity of teams and in revealing a previously unknown pattern confirm its usefulness within the context of higher education. Limitations, implications for research and practice, and future directions are discussed.
Introduction
Technological and societal challenges facing the world continue to grow in complexity, and solutions to increasingly complex problems require collaboration between multiple disciplines (King Citation2010; Rousseau, Zhang, and Hu Citation2019). Grand-scale problems include climate change, epidemics, energy, poverty, and social unrest, but smaller-scale problems also require expertise from multiple fields (National Academies of Sciences, Engineering, and Medicine Citation2021, Citation2022b). The National Academies in the United States have thus called on colleges and universities to support interdisciplinary education and training for students and researchers (National Academies of Sciences, Engineering, and Medicine Citation2005, Citation2022a). In the 47-country European Higher Education Area, ministers of education maintain that to contribute to the wider needs of society, college graduates require inter- and transdisciplinary skills (European Education Area Citationn.d.; European Higher Education Area Citation2012; Jæger Citation2021)
The National Academies recommend that interdisciplinary education be evaluated against relevant criteria, such as the number of students from the general population (i.e. from outside the instructor’s department) and the mix of students (National Academies of Sciences, Engineering, and Medicine Citation2005). However, beyond tallies of students by major or college, no measures of interdisciplinarity have been developed for education. In a review of ninety-nine studies on interdisciplinary education in engineering, Van den Beemt et al. found that more attention should be placed on assessment, but ‘measuring the interdisciplinarity of a project or course result is likely to be a major challenge’ (Van den Beemt et al. Citation2020, 522). If an indicator of interdisciplinarity could be developed, either a universal measure or one specific to an institution, it would be of use in educational research, assessment, and program evaluations that seek to understand/improve and report on interdisciplinary education.
Potential utility of a metric
An indicator of interdisciplinarity could enhance research on interdisciplinary education. Liechty et al. assessed the transdisciplinary orientation (attitudes and behaviors) of graduate students in transdisciplinary and monodisciplinary programs (Liechty et al. Citation2022). They found doctoral students with dissertation co-advisors from different departments showed higher transdisciplinary orientations than monodisciplinary students. However, they did not consider the effect of similarity/dissimilarity in co-advisors’ fields, nor differences between individual students’ undergraduate and graduate fields of study. If there were metrics for these differences, the degree of interdisciplinarity could have been considered in the analysis.
Braßler and Schultze studied innovation in monodisciplinary and interdisciplinary student teams, with two to three majors on each interdisciplinary team. The authors found differences in team performance for mono and interdisciplinary teams, but they did not consider differences between interdisciplinary teams. The study involved eleven majors. A team with psychology and physics students would span a greater cognitive distance than a team with physics and mechanical engineering students, all majors in the study, yet they were handled within the binary of mono- and interdisciplinary. As Rafols observed, ‘There is more diversity in a project including cell biology and sociology than in one including cell biology and biochemistry’ (Citation2014, 173). If there were metrics to measure the interdisciplinarity of student teams, the effect of degree of interdisciplinary on outcomes could be considered.
Kolmos et al. identify the need to differentiate between different types of interdisciplinary student project teams, because student experiences and outcomes differ by the degree of disciplinary similarity and team structure (Kolmos et al. Citation2024). They propose a two-axis typology to classify student project teams, with interdisciplinarity along one axis and team structure (number of subteams) on the other. Within their typology, Kolmos et al. identify three general levels of interdisciplinarity: projects drawing students from a single discipline, representing less interdisciplinarity; projects with students from two or more disciplines within the same faculty/college, representing narrow interdisciplinarity; and projects with students from more than one faculty/college, representing broad interdisciplinarity.
Their approach is a notable step forward because it eliminates the mono/interdisciplinary binary. While the typology provides a framework, its categorical nature yields three challenges. The first is that the three levels of interdisciplinarity cannot account for differences across a single faculty/college. For example, a team with civil engineering and computer engineering students would span a greater cognitive distance than a team with computer engineering and electrical engineering students, but both would be categorized as narrowly interdisciplinary because they draw students from the same faculty/college.
The second challenge is that the typology cannot account for the balance of majors within a team. If a five-student team consisted of four students from computer science and one from sociology, the team’s work would be largely shaped by practices and epistemologies from computer science. To account for balance between majors, a numeric measure would be needed.
The third challenge is that the typology uses organizational structures as a proxy for cognitive distance, but structures vary by institution. While Science and Engineering is a single faculty at Aalborg University, the University of Strathclyde has a Faculty of Science and a Faculty of Engineering (Aalborg University Citationn.d.; University of Strathclyde Citationn.d.). There are also variations in how individual programs are sorted within institutions – computer science can be housed in a College of Arts and Sciences (University of Georgia Citationn.d.), a School of Engineering (Massachusetts Institute of Technology Citationn.d.), a Faculty of Technology and Society (Malmö University Citationn.d.), or in a faculty/college of its own (Georgia Institute of Technology Citationn.d.; Saint Petersburg Electrotechnical University Citationn.d.).
While there are no quantitative measures of interdisciplinarity within educational contexts, metrics and systems have been developed to measure interdisciplinarity in research (Rousseau, Zhang, and Hu Citation2019). We propose bridging the gap between studies of interdisciplinary research and undergraduate education by extending use of the Rao-Stirling diversity index to higher education. Building on Kolmos et al.’s typology, the Rao-Stirling diversity index would provide finer-gained detail. This would enable interdisciplinary project programs to understand the range and nature of their student teams; could be incorporated in assessments of student learning, which Kolmos et al. found differ by disciplinary similarity/difference; and could be used to report program scope and reach to administrators and sponsors.
The purpose of this study was to apply the Rao-Stirling diversity index to a large number of interdisciplinary student teams at a single institution to answer two research questions:
How does the Rao-Stirling diversity index compare with simpler metrics of interdisciplinarity, such as number of majors or number of colleges?
Are there patterns in diversity indexes for student teams across the program being examined?
The Rao-Stirling diversity index
The Rao-Stirling diversity index used in studies of interdisciplinary research draws on methods used in ecology where it is known as the distance-weighted Simpson diversity (Rafols Citation2014). The variety of disciplines maps to the concept of species richness in ecology, and the balance between disciplines corresponds to the ecological concept of evenness, or proportions from each species. The Rao-Stirling diversity index also includes the relative distance between disciplines (Porter and Rafols Citation2009), which in ecology is referred to as distance weighting.
Rousseau et al. emphasize the difference between measurement and evaluation of interdisciplinarity (Rousseau, Zhang, and Hu Citation2019). Evaluation requires consideration and assessment of goals, processes, and outcomes, whereas a measure is a simple metric (Klein Citation2008). This study focuses only on the simpler of the two.
The Rao-Stirling index can be expressed as Equation 1, where dij represents the distance between categories i and j; pi and pj represent the proportion of units (students) from categories i and j; and the summation is done over half of the matrix (i > j) (Stirling Citation2007).
(1)
(1) Imbalance in the proportion of students from each field yields a lower index, representing less balance in integration of ideas from the underrepresented field.
Because the index is based on proportions and distances, it is independent of team size. For example, if one team had 5 computer scientists and 7 biologists, and another team had 10 computer scientists and 14 biologists, the teams’ diversity indexes would be equal.
The minimum diversity index would be zero for a team composed of a single discipline, and near zero for a team with members from very similar disciplines. The maximum diversity index would depend on the ranges used in the distance measure and the number of disciplines on the team. If distances were allowed to range from 0-1, and if all disciplines on a hypothetical team were very different from each other (d ≈ 1), a team with 20 disciplines and equal proportions of members from each (p = 1/20) would have a Rao-Stirling diversity index of 0.48. A team with 100 disciplines and equal proportions from each would have an index of 0.50. Although teams with 20 and 100 disciplines are not realistic, these values provide an upper limit for consideration in analysis.
Measures of interdisciplinarity are not absolute because categorizations and distance measure development can yield very different results (Adams, Loach, and Szomszor Citation2016; Rafols Citation2021). Leading researchers in the field have reframed the use of interdisciplinary measures: Instead of being metrics that are applied to programs by outsiders, measures of interdisciplinarity should be participatory and interactive (Marres and de Rijcke Citation2020; Rafols Citation2021). Instead of using the measures to judge and potentially penalize programs, they should be used with and by program directors and coordinators.
A spectrum of terms are used to describe degree of integration of ideas and practices from different disciplines: cross-disciplinary, multidisciplinary, interdisciplinary, transdisciplinary, etc. (Klein Citation2017). The Rao-Stirling diversity index quantifies disciplinary diversity, but the degree of integration across disciplinary lines (cross/multi/inter/trans) would vary by context. When applied to a student project team in which methods and ideas from multiple fields are integrated to solve a problem (as in both Kolmos et al. and the present study), the index would represent the team’s interdisciplinarity. Kelly coined the terms wide and narrow to describe differences in degree of interdisciplinarity (Kelly Citation1996). In this discussion, interdisciplinarity is described as higher or lower, following conventions in studies of interdisciplinary research (Glänzel and Debackere Citation2022).
Disciplinary distances
The Rao-Stirling diversity index requires distance measures, which in this context are measures of cognitive distance. Distance values were developed in a prior study, and they were based on degree programs at the Georgia Institute of Technology, a public Research I institution in the southeast United States (Sonnenberg-Klein, Coyle, and Saigal Citation2023) and member of the Association of American Universities (an association for leading research universities in the US and Canada). The institution has a STEM emphasis, but it also offers degrees in the humanities, liberal arts, and business.
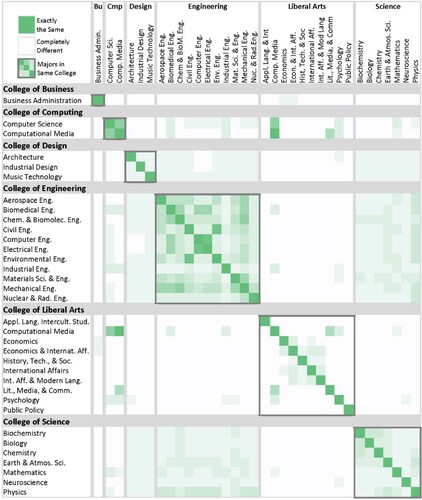
The distance measure was based on two equally weighted components: similarity by curricular overlap; and similarity by organizational structures that reflect overlap (fully equivalent courses that can be substituted for each other, or options for within-major electives). The composite distance measure was scaled to d = 0 for identical majors (darkest shade of green in ) and d = 1 for completely unrelated majors (white in ). For a full explanation of the development of the distance measure, please see Sonnenberg-Klein, Coyle, and Saigal (Citation2023).
Figure 1. Heat map of disciplinary distances.
A limitation and strength of the distance measure is that it is generic. In a small study, individual student’s programs of study could be analyzed, but across a large program it would be labor-intensive. While a generic measure makes the method more accessible, it does not reflect programs of study unique to each student on a given team, which makes the resulting indexes approximations.
Another limitation is that the current measure is specific to Georgia Tech, which is a liberal education institution in the United States. Liberal education is considered a uniquely American model in which students take courses from a variety of departments outside their majors (Godwin Citation2015). Beyond campus-wide requirements in the humanities, social sciences, and natural/physical sciences, degree programs typically require additional courses from other departments. Because only a portion of the measure is related to institutional structures, and that portion is tied to course equivalencies and within-major electives, similar patterns would be expected among peer institutions with liberal education systems. While most institutions outside the United States are career-focused (Godwin Citation2015), relative similarities/differences between fields would be expected outside the United States, and future investigations in different institutional contexts are planned.
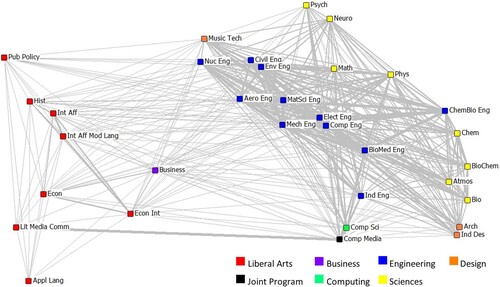
The distance measure is imperfect. While the global map clusters disciplines by college as would be expected (), the similarities between majors in the College of Liberal Arts are very small (). When a program is less prescriptive, as in the liberal arts, it yields less overlap with other majors. As a result, with this distance measure, teams that include liberal arts students will yield higher diversity indexes than teams composed of students from more prescriptive majors.
Figure 2. Visualization of cognitive distances between majors, developed in previous study. Figure adapted from (Sonnenberg-Klein, Coyle, and Saigal Citation2023) with permission.
Context
The analysis was conducted on enrollments in the Vertically Integrated Projects (VIP) Program at Georgia Tech. VIP is a form of undergraduate research as well as a specific case of project-based learning in which large student teams are embedded in long-term faculty projects. Vertical integration refers to the inclusion of students of different academic ranks (2nd year, 3rd year, etc.) as well as graduate students, postdoctoral scholars, and faculty. Projects are expected to last a minimum of three to five years, although most evolve with faculty research and operate indefinitely. When projects end or are placed on hold, returning students are allowed to continue but new students are not accepted, resulting in teams that decline to zero enrollment after a few semesters.
VIP is offered as a course (module), and teams meet for 50 min each week in the fifteen-week semester. Instructors attend these weekly meetings, and subteams often meet outside of class. Sessions are led like research group meetings, with members reporting on progress/problems and identifying tasks for the coming week. Students earn 1–2 credits per semester (approximately half of the credits of a typical course). Students can participate for multiple semesters, and the low credit level enables students to do so without exceeding the number of electives available in most degree programs. (The effect of curricular policies on enrollment is discussed below.) When students return for 2nd, 3rd and subsequent semesters, they take on additional leadership and technical responsibilities (Sonnenberg-Klein Citation2023), which enables faculty to lead larger teams than otherwise possible.
Team composition is shaped by multiple factors. First, teams are established by faculty request. Majors sought by the instructor are listed in online team descriptions, but students from any major can apply to any team. Students are selected to maintain a balance of majors needed for the project, and to maintain a balance of academic ranks (year in school). A student from a major unrelated to the project may be accepted to a team if they show interest. Alternatively, an instructor may turn a student away if their field of study is not closely related enough.
Team size is set by instructors, with a program-defined minimum of 8–10 students. This ensures enough students return the following semester to maintain continuity. In Fall 2020, the semester analyzed in the study, the average team size was 15 (although the average is steadily increasing, with 25 in Spring 2024). Some teams are large, with over 50 students, and they are typically led by multiple instructors, and/or graduate students lead subteams that support their research. In these very large teams, subteams operate almost as individual teams, but with strong connections with fellow subteams.
Team composition is also shaped by curricular policies (Sonnenberg-Klein, Abler, and Coyle Citation2018). Some departments allow VIP credits to fulfill required course sequences, capstone requirements, or to count as in-major or technical electives, which leads to higher enrollment than in other majors. In some cases, departments specify which teams can be used to fulfill degree requirements, shaping enrollment for approved and non-approved teams. Some departments only allow VIP credits to count as free electives, typically leading to lower enrollment.
A notable difference between VIP teams and those in Kolmos et al. is the nature of collaboration across disciplinary lines. In Kolmos et al., some projects were tied to learning outcomes in separate courses, which limited coupling across disciplinary lines. In contrast, VIP is not associated with specific learning outcomes, leading to high interaction across disciplinary lines. Within their teams, on average, students interact more often with students from other majors than with students from their own (Sonnenberg-Klein et al. Citation2017). Because this implies close coupling, the teams are referred to as interdisciplinary instead of cross- or multidisciplinary.
Materials and methods
Data
The sample frame consisted of 80 interdisciplinary VIP teams (N = 1231) at Georgia Tech in Spring 2020. Courses for the semester began in January, prior to COVID-related interruptions. Class rolls were obtained for the 80 teams. Thirteen individuals were excluded from the sample. Eleven were excluded because they were transient students, with no majors listed in class rolls. One team with two students was excluded because both were from the same major, which would yield a diversity index of zero, which would have little meaning in the analysis.
This left a sample of 79 teams and 1218 students. After the exclusions, team sizes ranged from 2 to 62 students, with a median of 14 and a mean of 15. The number of majors on each team ranged from 2 to 9, with a median and mean of 5 majors per team. The sample included students from 33 of the institution’s 36 undergraduate majors. The three majors not represented (Applied Physics; Discrete Mathematics; and Global Economics and Modern Languages) were similar to majors in the sample (Physics; Mathematics; and Economics). Nearly half of students were from the College of Engineering (48%), where the VIP Program was initially established. A little more than one-third were from the College of Computing (37%), where VIP can be used to fulfill a three-semester design sequence. The remaining students were from the College of Science (8%), Ivan Allen College of Liberal Arts (3%), College of Design (1%), Scheller College of Business (1%), and programs jointly administered by multiple units (2%). The imbalance across colleges was due in part to the composition of the institution, which is STEM-focused, and to how degree programs do and do not incentivize VIP participation (Sonnenberg-Klein, Abler, and Coyle Citation2018).
Methods
With the distance measure and class rolls, Excel was used to calculate the Rao-Stirling diversity index for each of the 79 teams. Relationships between diversity index, team size and number of majors were explored graphically, and multiple linear regression was done in SPSS.
Three sets of theoretical Rao-Stirling diversity index maximums were calculated for theoretical teams with varying numbers of majors. In each set of maximums, proportions of students from each major were held equal. In one set of theoretical maximums, the distances between majors were set to the maximum possible value of 1. While this an unlikely scenario, it provided a mathematical point of reference. In the second set of maximums, distances used in the analysis were used. As additional majors were added from the pool of yet unused majors, they were selected to maximize each index. Because 85% of students in the sample were from the College of Engineering and the College of Computing, a third set of maximums was calculated for theoretical teams composed of students from these two colleges only.
As recommended in studies on interdisciplinary research, science overlay maps were generated (Carley et al. Citation2017; Rafols Citation2014). UCINet was used to convert the distance measure matrix into NetDraw readable files, and NetDraw was used to generate the global map () and overlay maps. In the overlay maps, node size represented the number of students from the major on the team, and node positions were based on the global map.
Limitations
A limitation of the study is that the distance measure is specific to Georgia Tech. Because a large portion of the curricular overlap is rooted in knowledge domains and epistemologies, comparable similarities/dissimilarities between majors would be expected at other institutions. The distance measure is also generic. While this makes it easier to apply, it does not reflect programs of study unique to each student. The distance measure is also imperfect, with less overlap between majors in the liberal arts and other fields, which may or may not be valid.
The second part of the study examined patterns across the program, but these patterns may not be generalizable to other courses or programs. For example, VIP is voluntary for both instructors and students, which affects student enrollment and faculty engagement. Team composition also varies by project, with projects, desired majors, and team size defined by instructors. Because of this, team VIP team compositions may vary more than in courses designed to serve specific majors.
Results
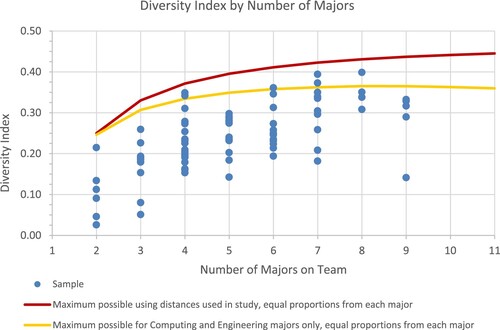
Diversity indexes for the 79 teams ranged from 0.03 to 0.40 (M = 0.24, SD = 0.08) ((b)). Indexes were plotted by number of majors alongside maximum possible values for majors in the study (red line) and maximum possible values for majors in computing and engineering (yellow line) ().
Figure 3. Distributions of two measures of interdisciplinarity: Number of majors, and Rao-Stirling diversity index: (a) Teams by Size and Number of Majors (b) Teams by Size and Diversity Index.
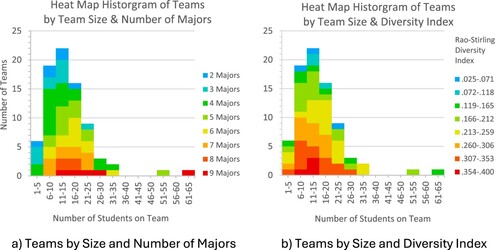
Figure 4. Diversity index by number of majors.
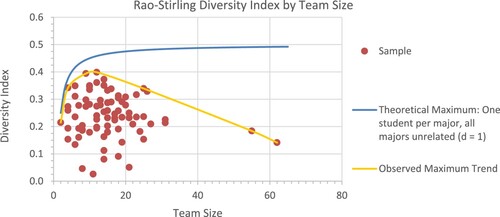
Indexes were also plotted by team size along with maximum possible values if all students within each team were from different majors, and if all majors were entirely unrelated (d = 1) (). Note that the maximum is not realistic, because it would require 60 unrelated majors for a team of 60 students. In , the maximum observed diversity index (yellow line) seemed to decrease with team size. Because diversity index is based on majors and proportions, correlation with team size was not anticipated.
Figure 5. Diversity index by team size.
To examine the relationship between team size and diversity index while accounting for number of majors, indexes were plotted by team size and color-coded by number of majors (). The resulting plot implied a negative trend by team size. Using SPSS, the seemingly negative correlation was further investigated with multiple linear regression. Regression assumes linear relationships between dependent and independent variables, but the relationship between diversity index and number of majors was clearly nonlinear (). To account for this, a transformed variable was used in place of the number of majors. It was equal to the number of majors minus 0.06 times the number of majors squared. Diversity index was regressed on team size and transformed number of majors.
Figure 6. Rao-Stirling diversity index by team size and number of majors. Note: Number of majors on teams ranged from 2 to 9. For clarity, only three groupings are shown.
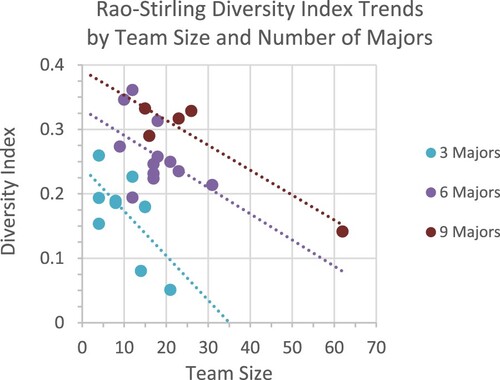
Assumptions for multiple regression were tested. Team size and transformed number of majors were not strongly correlated (R = 0.35). The Durbin-Watson test indicated independence of observations (d = 2.39). A plot of standardized residuals and predicted values showed no pattern, indicating homoskedasticity. A p–p plot indicated residuals were normal, and a maximum Cook’s distance of 0.26 indicated that there were no outliers.
The regression model was statistically significant (F(2, 76) = 64.29, p < .001, R2 = 0.63). Unstandardized predictors showed that on average, diversity index decreased by .004 with each additional student (B = −0.004, t = −5.70, p < .001). Standardized predictors showed that transformed number of majors was a stronger predictor for diversity index (β = 0.830) than team size (β = −0.426).
Overlay maps
To aid in the interpretation of diversity indexes, overlay maps were generated for four teams, each with seven majors ( and ). Node size represented the number of students, and node location was based on the global map. Thicker lines represent greater similarity.
Figure 7. Overlay maps for four VIP teams, each with 7 majors: (a) Patagonia (b) Living Dynamical Systems (c) IOT in Health (d) Concussion Connect.
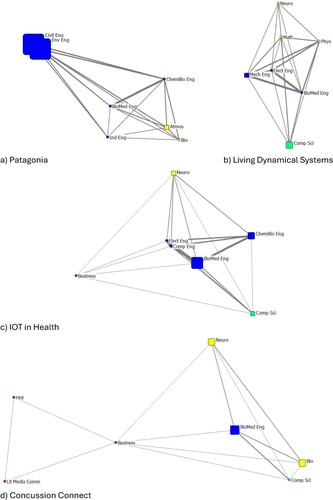
Table 1. Team composition and diversity indexes for four teams.
Discussion
Nations around the world recognize the interdisciplinary nature of complex problems, from regional issues to global challenges. To inform research administrators and sponsors, evaluators have developed metrics to quantify the interdisciplinarity of research. While nations around the world call for interdisciplinary education, similar metrics have not been developed for or applied to educational contexts. Instead, evaluations and assessments typically involve a binary of mono- and interdisciplinary.
Kolmos et al. identify the need to differentiate between different types of interdisciplinary student project teams, because they found student experiences and outcomes differ by the degree of similarity between student majors as well as team structure (Kolmos et al. Citation2024). Their typology provides a framework for conceptualizing interdisciplinary student project teams.
We propose extending on Kolmos et al.’s work by quantifying the interdisciplinarity of student project teams with the Rao-Stirling diversity index, which is used in the study of interdisciplinary research. Using previously developed distance measures, this study applied the Rao-Stirling diversity index to 79 interdisciplinary student teams at a single institution to determine how the index compares with simpler metrics of interdisciplinarity, such as number of majors or number of colleges, and to examine patterns in diversity indexes across the program.
Interpreting indexes
Before addressing the research questions, it is worth first interpreting indexes alongside overlay maps and enrollment tables. Numerically, (1) balance between number of students from each major on a team, and (2) high cognitive distance between majors yield higher diversity indexes. Of the four teams in , the Patagonia team had the lowest index. A large proportion of the team’s students were from two closely related majors: Civil Engineering and Environmental Engineering ((a)). The imbalance in enrollment and the similarity between Civil and Environmental Engineering yielded an index of 0.18. While this was the lowest of the four selected teams, it fell in the mid-range of the full sample (yellow in (b)).
The Concussion Connect team had the highest of the four indexes, at 0.37. The overlay map shows greater cognitive distances than in the three other teams, with students from all 6 colleges on the campus ((d)). This placed the index in the highest range of the full sample (red in (b)). A more even distribution across the majors would have yielded an even higher index.
The maps for the two remaining teams show interesting patterns. Visually, the IOT in Health team ((c)) seems to span larger cognitive distances than the Living Dynamical Systems team ((b)), but the IOT team had a lower diversity index (0.26) than Living Dynamical Systems (0.34). This illustrates how the index incorporates balance in number of students from each major. With a single student from a very different major, as with the business student on the IOT team, the knowledge and practices from that student’s field would be less likely to be heavily incorporated into the team’s work than if there were a more even balance in number of students by field. While the Living Dynamical Systems team spans shorter disciplinary distances, the team had more balance between fields.
Diversity index vs simpler metrics
To compare Rao-Stirling diversity indexes with simpler measures, distributions across the program were examined along with enrollment tables for the four teams in . Because the index incorporates cognitive distances between majors, teams with the same number of majors can yield different indexes, as in the table. Instead of number of majors, the number of colleges might capture aspects of cognitive distance, as suggested by Kolmos et al. However, the IOT in Health team had students from 4 colleges and a diversity index of 0.26, while the Living Dynamical Systems team had students from 3 colleges and a higher diversity index of 0.34.
Across the program, diversity indexes and number of majors also show slightly different distributions (). In (b), diversity indexes were divided into 8 equally spaced ranges, so the heat maps could be compared. Two differences are notable. First, when the Rao-Stirling diversity index is used to represent interdisciplinarity, more teams show high interdisciplinarity (18 teams in red and dark orange) than when number of majors is used as an indicator (9 teams in red and dark orange). The second difference is the centering of high interdisciplinarity in the two heat maps by team size. When number of majors is used as an indicator of interdisciplinarity ((a)), highly interdisciplinary teams (orange and red) occur at and to the right of the histogram peak. When the Rao-Stirling index is used to indicate interdisciplinarity ((b)), the highly interdisciplinary teams are centered on the histogram peak. Together, these differences indicate that when the Rao-Stirling diversity index is used to represent the interdisciplinarity of teams, it shows high interdisciplinarity in more teams than the number of majors would indicate, as well as greater interdisciplinarity in small to medium teams.
Diversity index and team size
Because the Rao-Stirling diversity index is based on proportions and cognitive distances, team diversity indexes were not expected to correlate with team size. However, visual inspection implied and multiple linear regression confirmed a negative correlation with team size. In , the observed maxima (yellow line) clearly departs from the theoretical maxima (blue line) as team size increases. Indexes were expected to increase with number of majors. When number of majors were the same, as in , the negative correlation with team size was notable.
When interpreting this relationship, it is important to consider causality. In the VIP Program, team size is set by instructors. New teams usually begin with 8–10 students. As instructors become comfortable mentoring their teams, and as returning students take on additional leadership responsibilities, most teams grow in size. However, high interdisciplinarity may limit team growth. Managing, mentoring, and grading students from a wide range of majors may be more challenging than when students are from related fields. Kolmos et al. found students in interdisciplinary teams struggled more in the teams that spanned larger cognitive distances, with broadly interdisciplinary teams requiring more scaffolding than narrowly interdisciplinary teams (Kolmos et al. Citation2024). Within VIP, if smaller team size among highly interdisciplinary teams is indicative of greater burden on instructors or greater obstacles for students, these burdens/obstacles may negatively affect student growth and long-term faculty-engagement. If so, then additional support for highly interdisciplinary teams may be needed. This might include providing teaching assistants for highly interdisciplinary teams, or incentives for instructors to find co-instructors from other departments, which could also enhance faculty research.
Conclusion
This study proposes use of the Rao-Stirling diversity index to quantify interdisciplinarity in educational contexts. In this analysis, the index provided a more comprehensive measure of interdisciplinarity than number of majors or number of colleges. The index also indicated higher interdisciplinarity in more teams and in comparatively smaller teams than number of majors would imply. Examination of Rao-Stirling diversity indexes across the VIP Program revealed a previously unrecognized pattern – that highly interdisciplinary teams tend to be smaller, and that very large teams tend to be disciplinarily narrow. This may indicate that highly interdisciplinary teams require additional support.
In the broader context of higher education, the Rao-Stirling diversity index can eliminate the mono/interdisciplinary binary in research on interdisciplinary education (Braßler and Schultze Citation2021; Liechty et al. Citation2022). It would enable interdisciplinary programs to understand the range and nature of their student project teams, could be used to interpret assessments of student learning, and could be used to report program scope and reach to administrators and sponsors. The index could be employed to study and report on collaborations in maker-spaces, interdisciplinary capstone project teams, or student clubs. In addition to being shaped by distance measures, index values would be shaped by program structure, such as which students are allowed, encouraged, incentivized, or required to participate; and the degree to which the balance of majors is controlled by instructors or programs. Although measures of interdisciplinarity are not absolute, within a well-defined system, the index could provide relative measures and meaningful insight (Adams, Loach, and Szomszor Citation2016; Marres and de Rijcke Citation2020; Rafols Citation2021).
The Rao-Stirling diversity index relies on a measure of distances between student majors. Distances in this study were based on degree requirements at a single institution. To be of use to a wide user-base, global measures of cognitive distance could be developed with input from curriculum developers across the represented disciplines. Alternatively, researchers, evaluators and program coordinators could define/develop distance measures to fit their research/evaluation/reporting needs.
When interpreting interdisciplinarity, program purpose should be considered. The goal of the VIP Program is not to achieve the highest possible interdisciplinarity. The program serves two purposes: to support faculty research and creative endeavors, and to support student disciplinary and professional development in projects in which they are actively interested. A team that is more (or less) interdisciplinary than another is not better (or worse).
Acknowledgements
The VIP model is not unique to Georgia Tech. VIP Programs are in place at over 50 colleges and universities in the United States, Europe, South America, the Middle East, Asia, Africa, and Oceana with institutions connected through the VIP Consortium.
Disclosure statement
No potential conflict of interest was reported by the author(s).
Additional information
Funding
References
- Aalborg University. n.d. “Faculties at Aalborg University.” Aalborg University. Accessed May 23, 2024. https://www.en.aau.dk/about-aau/organisation/faculties.
- Adams, J., T. Loach, and M. Szomszor. 2016. Digital Research Report: Interdisciplinary Research - Methodologies for Identification and Assessment [Report]. Digital Science. https://doi.org/10.6084/m9.figshare.4270289.v1
- Braßler, M., and M. Schultze. 2021. “Students’ Innovation in Education for Sustainable Development—A Longitudinal Study on Interdisciplinary vs. Monodisciplinary Learning.” Sustainability 13 (3): Article 3. https://doi.org/10.3390/su13031322.
- Carley, S., A. L. Porter, I. Rafols, and L. Leydesdorff. 2017. “Visualization of Disciplinary Profiles: Enhanced Science Overlay Maps.” Journal of Data & Information Science 2 (3): 68–111. https://doi.org/10.1515/jdis-2017-0015
- European Education Area. n.d. “Relevant and High-quality Higher Education.” Accessed March 9, 2022. https://education.ec.europa.eu/node/1526.
- European Higher Education Area. 2012. Bucharest Communiqué.
- Georgia Institute of Technology. n.d. “College of Computing.” Accessed May 23, 2024. https://www.cc.gatech.edu/.
- Glänzel, W., and K. Debackere. 2022. “Various Aspects of Interdisciplinarity in Research and How to Quantify and Measure Those.” Scientometrics 127 (9): 5551–69. https://doi.org/10.1007/s11192-021-04133-4.
- Godwin, K. A. 2015. “The Worldwide Emergence of Liberal Education.” International Higher Education 79: Article 79. https://doi.org/10.6017/ihe.2015.79.5835.
- Jæger, K. 2021. “New-Style Higher Education: Disciplinarity, Interdisciplinarity and Transdisciplinarity in the EHEA Qualifications Framework.” Higher Education Policy 34 (1): 155–74. https://doi.org/10.1057/s41307-018-00126-w.
- Kelly. 1996. “Wide and Narrow Interdisciplinarity.” The Journal of General Education 45 (2): 95–113.
- King, C. J. 2010. “The Multidisciplinary Imperative in Higher Education.” Center for Studies in Higher Education Research & Occasional Paper Series, CSHE.11.10, 7.
- Klein, J. T. 2008. “Evaluation of Interdisciplinary and Transdisciplinary Research: A Literature Review.” American Journal of Preventive Medicine 35 (2): S116–S123. https://doi.org/10.1016/j.amepre.2008.05.010.
- Klein, J. T. 2017. “Typologies of Interdisciplinarity: The Boundary Work of Definition.” In The Oxford Handbook of Interdisciplinarity, edited by R. Frodeman, 21–34. Oxford University Press.
- Kolmos, A., J. E. Holgaard, H. W. Routhe, M. Winther, and L. Bertel. 2024. “Interdisciplinary Project Types in Engineering Education.” European Journal of Engineering Education 49 (2): 257–82. https://doi.org/10.1080/03043797.2023.2267476.
- Liechty, J. M., A.-S. Keck, S. Sloane, S. M. Donovan, and B. H. Fiese. 2022. “Assessing Transdisciplinary Scholarly Development: A Longitudinal Mixed Method Graduate Program Evaluation.” Innovative Higher Education 47 (4): 661–81. https://doi.org/10.1007/s10755-022-09593-x.
- Malmö University. n.d. “Faculties and Departments | Malmö University.” Accessed May 23, 2024. https://mau.se/en/about-us/faculties-and-departments/.
- Marres, N., and S. de Rijcke. 2020. “From Indicators to Indicating Interdisciplinarity: A Participatory Mapping Methodology for Research Communities in-the-Making.” Quantitative Science Studies 1 (3): 1041–55. https://doi.org/10.1162/qss_a_00062.
- Massachusetts Institute of Technology. n.d. “Schools & Departments | MIT - Massachusetts Institute of Technology.” Accessed May 23, 2024. https://www.mit.edu/education/schools-and-departments/.
- National Academies of Sciences, Engineering, and Medicine. 2005. Facilitating Interdisciplinary Research. Washington, DC: The National Academies Press.
- National Academies of Sciences, Engineering, and Medicine. 2021. Human-AI Teaming: State-of-the-Art and Research Needs. https://doi.org/10.17226/26355
- National Academies of Sciences, Engineering, and Medicine. 2022a. Imagining the Future of Undergraduate STEM Education: Proceedings of a Virtual Symposium. Edited by K. Brenner, A. Beatty, & J. Alper. The National Academies Press.
- National Academies of Sciences, Engineering, and Medicine. 2022b. Integrating Serious Illness Care into Primary Care Delivery: Proceedings of a Workshop. https://doi.org/10.17226/26411
- Porter, Alan L., and Ismael Rafols. 2009. “Is Science Becoming more Interdisciplinary? Measuring and Mapping Six Research Fields Over Time.” Scientometrics 81 (3): 719–745. http://dx.doi.org/10.1007/s11192-008-2197-2
- Rafols, I. 2014. “Knowledge Integration and Diffusion: Measures and Mapping of Diversity and Coherence.” In Measuring Scholarly Impact, edited by Y. Ding, R. Rousseau, and D. Wolfram, 169–90. Switzerland: Springer International Publishing.
- Rafols, I. 2021, February 9. “Measuring’ Interdisciplinarity: From Indicators to Indicating.” Integration and Implementation Insights. https://i2insights.org/2021/02/09/measuring-interdisciplinarity/.
- Rousseau, R., L. Zhang, and X. Hu. 2019. “Knowledge Integration: Its Meaning and Measurement.” In Springer Handbook of Science and Technology Indicators, edited by Y. Ding, R. Rousseau, and D. Wolfram, 69–94. Switzerland: Springer International Publishing.
- Saint Petersburg Electrotechnical University. n.d. “Faculty of Computer Science and Technology.” Accessed May 23, 2024. https://etu.ru/en/study/faculties/faculty-of-computing-technologies-and-informatics/.
- Sonnenberg-Klein, J. 2023. “Leadership Growth over Multiple Semesters in Vertically Integrated Project (VIP) Courses.” IEEE Transactions on Education 67 (3). https://doi.org/10.1109/TE.2023.3344314.
- Sonnenberg-Klein, J., R. T. Abler, and E. J. Coyle. 2018, June. “Correlation between Academic Credit-use Policies and Student Persistence in Vertically Integrated Project (VIP) Courses.” 2018 ASEE Annual Conference & Exposition. 2018 ASEE Annual Conference & Exposition, Salt Lake City, Utah. https://doi.org/10.18260/1-2–30227
- Sonnenberg-Klein, J., R. T. Abler, E. J. Coyle, and H. H. Ai. 2017, June 24. “Multidisciplinary Vertically Integrated Teams: Social Network Analysis of Peer Evaluations for Vertically Integrated Projects (VIP) Program Teams.” 2017 ASEE Annual Conference & Exposition. 2017 ASEE Annual Conference & Exposition, Columbus, Ohio. https://doi.org/10.18260/1-2–28697
- Sonnenberg-Klein, J., E. J. Coyle, and K. Saigal. 2023, June 25. “How ‘Multidisciplinary’ Is It? Measuring the Multidisciplinarity of Classes and Student Teams. 2023 ASEE Annual Conference & Exposition. 2023 ASEE Annual Conference & Exposition. https://peer.asee.org/how-multidisciplinary-is-it-measuring-the-multidisciplinarity-of-classes-and-student-teams.
- Stirling, A. 2007. “A General Framework for Analysing Diversity in Science, Technology and Society.” Journal of The Royal Society Interface 4 (15): 707–19. https://doi.org/10.1098/rsif.2007.0213.
- University of Georgia. n.d. “Computer Science—B.S. | Franklin College of Arts and Sciences.” Accessed May 23, 2024. https://franklin.uga.edu/majors-degrees/computer-science-bs.
- University of Strathclyde. n.d. “Faculties | University of Strathclyde.” Accessed May 23, 2024. https://www.strath.ac.uk/workwithus/strathclydeglobaltalentprogramme/faculties/.
- Van den Beemt, A., M. MacLeod, J. Van der Veen, A. Van de Ven, S. van Baalen, R. Klaassen, and M. Boon. 2020. “Interdisciplinary Engineering Education: A review of vision, teaching, and support.” Journal of Engineering Education 109 (3): 508–55. https://doi.org/10.1002/jee.20347.