
Abstract
The study analyses determinants of child outcomes in a cohort of children who participated in the Free Pre-School Year. Child outcomes are measured through a before-and-after assessment of children using the Early Development Instrument. The sample comprises 448 children in 70 early years centres. There are three main findings. First, children with more or better skills at the beginning of the study period tended to have more or better skills at the end of this period, and vice versa, indicating that the broad parameters of a child's progress during the Free Pre-School Year have already been set by the child's development during previous years. Second, child and family characteristics are the largest set of measured influences on child outcomes by comparison with the pre-school system, with social class being the single biggest influence. Third, there were significant skill gaps between children at the start of the Free Pre-School Year which remained unchanged or widened during the year. The main conclusion is that the measures required to improve child outcomes in pre-school need to extend well beyond the confines of the early years sector to include all influences, especially family and social class influences, on child development and need to begin at the start of the child's life.
Introduction
The Free Pre-School Year was introduced in Ireland in 2010 and entitles every child between 3 years 2 months and 4 years 7 months to a year of free pre-school education. The ‘school year’ is defined as 3 hours per day, 5 days per week, and 38 weeks per year (183 days in total). The objective of the programme is ‘to benefit children in the key developmental period by providing a Free Pre-School Year in the year before they start primary school’ (www.dcya.ie). In 2012/2013, the Free Pre-School Year was delivered by approximately 4300 early years providers to around 66,000 children (Department of Children and Youth Affairs Citation2012, 66–67). Ireland spends about 0.4% of GDP on early years and early education services (covering all children aged 0–6) compared to the OECD average of 0.7% of GDP.
This study is one of the first to analyse child outcomes in a cohort of children who participated in the Free Pre-School Year. As such, it is not an evaluation of the Free Pre-School Year per se but offers a preliminary exploration of the extent to which Ireland may have a successful pre-school system. For the purposes of this study, a successful pre-school system is one which improves outcomes for all pre-school children while simultaneously narrowing the gap in outcomes between children. This definition is informed by internationally recognised approaches to the assessment of school systems, especially in the OECD (Citation2012, 15–17, Citation2010b, 27), and by experts in early child development (Shonkoff and Phillips Citation2000, 6). It is also the goal of early years education as stated by the Department of Education and Skills: ‘Provide a quality inclusive school and early years education system with improved learning outcomes’ (Department of Education and Skills Citation2011, 6) [emphasis added]. It is also the implicit understanding in the Government's vision (2011–present) which expresses Irish society's commitment to every child: ‘that growing up in Ireland means you have the best start in life available anywhere in the world’ (Minister for Children and Youth Affairs Citation2012, viii).
Underpinning the study's perspective is a moral vision that every child, without exception, has a natural potential to do well and to flourish; by extension, children who face adversity need extra care and education to help them develop and grow to their full potential. But this perspective also has an economic rationale since investment in early years provides a good return to public funds in terms of the lifetime benefits to individuals and society relative to the opportunity cost (or ‘opportunity lost’) of not making this investment. The strength of the economic argument, as Nobel Laureate James Heckman (Citation2011) has shown, rests more on the benefits to disadvantaged children since that is where the biggest economic gains and cost savings arise. With this understanding, our analysis focuses on both the overall level of outcomes in this cohort of children as well as changes in the gap in outcomes between children.
It is well established that pre-school education produces beneficial and lasting effects on children, but only if it is high quality. This is accepted by all authoritative reviews of the landmark studies in this field (Pianta et al. Citation2009; Alberts Citation2011; Heckman, Pinto, and Savelyev Citation2013). However, this evidence alone does not prove that the Free Pre-School Year is an effective intervention and, as one review noted, ‘there is no evidence whatsoever that the average preschool program produces benefits in line with what the best programs produce’ (Pianta et al. Citation2009, 49–50). That is why ongoing systematic evaluation of the Free Pre-School Year is essential to ensure that its effectiveness is proven rather than presumed.
The study comes at a time when the early years sector in Ireland, defined as the care and education of children aged 0–6, has experienced significant development in four main areas (Frawley Citation2014; Neylon Citation2014): (i) publication in 2006 of Síolta (National Quality Framework for Early Childhood Education) and in 2009 of Aistear (National Early Childhood Curriculum Framework); (ii) introduction in 2010 of the Free Pre-School Year; (iii) selective implementation of Síolta and Aistear, including the Síolta Quality Assurance Programme (Síolta QAP), as well as other initiatives to improve quality in early years services through the Prevention and Early Intervention Programme and its successor the Area-based Childhood Programme, plus the National Early Years Access Initiative (NEYAI); and (iv) introduction in 2014 of the Better Start Quality Development Service for early years services and the National Policy Framework for Children and Young People (2014–2020).
A variety of terms are used to refer to the care and education of children under the age of 6, such as ‘early years’, ‘pre-school’, and ‘childcare’. In Ireland, the sector is officially known by the term ‘early childhood care and education’ (ECCE), a term also used by UNESCO. By contrast, the preferred term in OECD and EU publications is ‘early childhood education and care’ (ECEC). There is also a preference in Ireland for the term ‘pre-school’ rather than the OECD term ‘pre-primary’, although ‘infant classes’ (itself a uniquely odd term) in Irish primary school are effectively ‘pre-primary’ (Lewis and Archer Citation2013, 16) but not ‘pre-school’. In keeping with these differences in terminology, while also contributing to its perplexity, the Free Pre-School Year is also known by its more formal title ECCE Programme. Whether or not these different terms denote any difference in philosophical or pedagogical perspective or have any policy and practice implications is a matter of speculation, but some reform and standardisation of the language might be timely. Adopting a pragmatic perspective, the term ‘early years’ rather than ‘childcare’ is used but also the term ‘pre-school’ depending on the context.
Methods
This is a cohort study of child outcomes in pre-school. It is based on a before-and-after assessment of a sample of children who participated in the 2012/2013 Free Pre-School Year; assessments were carried out by staff towards the beginning of the pre-school year (wave 1) and, again, after an interval of about 7 months (wave 2). The study is informed by the bioecological model of human development which emphasises the immediate and wider societal influences on child development as well as the contribution of the child's own characteristics to its development (Bronfenbrenner and Morris Citation2006). This approach guided the selection of both outcome variables and explanatory variables.
The research design was shaped by the fact that the study's main purpose was to evaluate NEYAI, a 3-year initiative (2011–2014) with a fund of €5.25 m to support quality improvements in the early years sector. NEYAI comprised 11 projects covering different aspects of child and parent well-being for children aged 0–6. Given that NEYAI was made up of diverse projects, it was decided to focus on a cohort of children who participated in the Free Pre-School Year since this cohort was common to all NEYAI projects. Finding a matched comparison group for NEYAI was also a challenge because the option of randomly allocating projects to intervention and comparison groups was not available since NEYAI projects were selected prior to the evaluation. It was decided that Síolta QAP (2010–2013) was the most promising comparison group for NEYAI since Síolta is the nationally accepted quality standard for all early years services in Ireland. A total of 136 early years centres participated in Síolta QAP (Department of Education and Skills Citation2013, 22) of which 21 agreed to participate in this study; of the latter, two-thirds were validated as having reached the standard (35%) or had submitted portfolios for validation (31%) and one-third (35%) may submit in the future. The design therefore involved a cohort of children in the Free Pre-School Year who attended centres which participated in two different types of quality improvement programme.
Outcome variables
In this study, the term ‘child outcome’ refers to the level of a child's development in areas that are central to normal and healthy development: physical health and well-being; social competence; emotional maturity; language and cognitive development; communication skills and general knowledge. These outcomes were measured using the Early Development Instrument (EDI), an instrument that is now used extensively in many countries to assess the development of children around the ages of 4–5 (details at the Offord Centre for Child Studies, McMaster University, Hamilton, Ontario, www.offordcentre.com).
The EDI comprises over 100 tasks and the child's performance on each task was assessed by the staff member who worked directly with the child (see for illustrations of these tasks). The EDI is essentially a measure of the skill required to perform the ordinary tasks of living and learning which are appropriate to a child of this age group. These skills are increasingly referred to as ‘character skills’ and ‘cognitive skills’ and a re-analysis of the long-term outcomes of pre-school and similar programmes has concluded that character skills predict later-life outcomes with ‘the same, or greater, strength’ as cognitive skills (Heckman and Kautz Citation2013, 88) while also showing that ‘high-quality early childhood programs have lasting and beneficial effects on character skills’ (Heckman and Kautz Citation2013, 89; see also Moffitt et al. Citation2011, 2693).
Table 1. Domains, sub-domains, and sample items in Early Development Instrument.
A growing number of studies have established that the EDI has good internal and test–retest reliability as well as external validity (Forget-Dubois et al. Citation2007; Janus and Offord Citation2007; Forer and Zumbo Citation2011; Guhn et al. Citation2011; Guhn and Goelman Citation2011; Hymel, Le Mare, and McKee Citation2011; Janus, Brinkman, and Duku Citation2011). Early studies of the instrument indicated that: ‘The EDI's psychometric properties have proven to be acceptable’ (Janus and Offord Citation2007, 18; Janus et al. Citation2007). The Language and Cognitive domain of EDI has convergent validity with the Peabody Picture Vocabulary Test, a widely used test of children's receptive vocabulary and often taken as a proxy for child intelligence (Janus, Brinkman, and Duku Citation2011, Table 3; Hymel, Le Mare, and McKee Citation2011). An Australian study has shown that ‘the EDI at age 5 is strongly and consistently associated with standardized tests of literacy and numeracy at ages 8, 10 and 12’ (Brinkman et al. Citation2013, 704).
Given that the EDI is normally used for children attending primary school – mainly 4–5-year-olds and not with children aged less than 3 years 8 months – and is normally completed by teachers rather than early years professionals, the study team made the decision to use the EDI after consultation with the instrument's lead author (Magdelena Janus). The vast majority of children (95%) in our sample were aged 3 years 10 months at wave 1 and therefore above the lower threshold for using the EDI (3 years 8 months). In addition, sample scores at wave 2 were consistently higher than at wave 1 which implies the scale is measuring progress in child development in each EDI domain. The data also show that girls have consistently higher scores at waves 1 and 2 as found in all other studies (Williams et al. Citation2013, 63). These findings suggest that our dataset is internally consistent while also broadly in line with the age/gender pattern of EDI scores in other samples.
Other considerations also informed the decision to use the EDI for this study: (i) it can be compiled by the child's educator rather than external specialists or observers; (ii) there is no comparable global measure of child development for this age range of children; (iii) it is used extensively in Canada, Australia, and other countries, including Ireland (Curtin et al. Citation2013; Doyle Citation2012; Doyle, Finnegan, and McNamara Citation2012; Doyle and McNamara Citation2011); (iv) the main focus of the study is on changes in overall EDI scores between waves 1 and 2 rather than the performance of children relative to national population norms.
The EDI was piloted in two early years centres which were not part of the study, and it was found that staff could complete the instrument without specific training. That is because EDI items are specific, worded simply, and designed to be answerable by any adult familiar with the child such as a parent, teacher, or early years professional.
Explanatory variables
Data were collected on a range of explanatory variables covering: (i) child characteristics, (ii) family and social system characteristics, and (iii) pre-school system characteristics. These data were collected through, respectively, a Child Questionnaire, a Parent Questionnaire, and a Staff Questionnaire. Child and Staff Questionnaires were completed online in about 30–40 minutes each – at a website specially designed for this purpose – www.neyai-evaluation.ie – by early years professionals in each centre, excluding administrative and support staff. The Parent Questionnaire was completed by trained interviewers using a face-to-face interview with the child's mother which took place in the home or early years centre, or elsewhere if that was the mother's preference. All concepts were measured using standardised instruments which have been tried and tested, many of them also used in the Growing Up in Ireland (GUI) National Longitudinal Study of Children (Murray et al. Citation2011). A report on the concepts and measurements used in each questionnaire, as well as the full results of the study, are available (McKeown, Haase, and Pratschke Citation2014a, Citation2014b, Citation2014c).
The Child Questionnaire, which was completed by the staff member who worked directly with the child, collected data on the child's age, gender, and Non-English-Speaking Background (NESB), in addition to the EDI.
The Parent Questionnaire collected data on three core aspects of the family: social class, mother's well-being, and parent–child relationship. The concept of social class denotes the family's resources (material, social, and cultural) and comprises mother's education, occupation, and financial problems but also includes two other resources which are relevant to child development, notably the home learning environment and child's diet. Mother's well-being is based on four observed aspects of the person: self-esteem, life satisfaction, optimism, and positive affect. The parent–child relationship was based on how each parent relates to the child along three dimensions: conflict, dependency, and stress.
The Staff Questionnaire collected data on the background characteristics of staff (age, gender, and ethnicity), personal well-being, qualifications, experience in the early years sector, perceptions of work and workplace, staff–child and staff–parent relationships, and perceived quality of childcare centre.
Sample
The study is based on a sample of 448 children drawn from 70 early years centres which participated in the Free Pre-School Year and which also participated in a quality improvement programme, either NEYAI (49 centres) and Síolta QAP (21 centres). The sample of children was randomly selected from a list of all pre-school children in these centres. Parental consent was obtained for each child to participate in the study and for the parent to be interviewed. The sample includes children and parents from different social backgrounds but, on average, they were more disadvantaged by comparison with the national population as measured by the parents’ education and degree of financial difficulty in making ends meet. The majority of centres were community-based providers, in both NEYAI (75%) and Síolta QAP (87%), unlike the generality of early years centres in Ireland which are private (74%); community-based providers also tend to be located in less-advantaged areas.
The sample of staff was based on all early years professionals in the selected centres but excluding staff in administration or support services. A total of 747 staff completed the Staff Questionnaire. This is equivalent to three quarters (76%) of all early years staff in those centres which is a relatively high response rate. Of the 747 staff who completed the Staff Questionnaire, 201 also completed the Child Questionnaire. Staff in NEYAI and Síolta QAP had somewhat higher levels of education compared to the early years sector as a whole, at Level 6 (41% compared to 37%) and Levels 7 and 8 (19% compared to 13%), but lower compared to the national population, at Levels 7 and 8 (26%) ().
Table 2. Highest level of education of professional staff in early years sector and in Ireland.
There are approximately 4300 early years centres in Ireland, more than all first-level schools (3300) and second-level schools (723) combined. This study covers nearly 2% of these (70). The number of children in the Free Pre-School Year in Ireland in 2012 was around 66,000. This study covers less than 1% of these (448), over half in NEYAI (258), the remainder in Síolta QAP (190). Similarly, the estimated number of staff employed in the early years sector in Ireland is 21,000. This study covers nearly 4% of these staff (747) with about three quarters in the NEYAI sample (543) and one quarter in the Síolta QAP sample (204).
Ethical considerations
The main ethical and legal considerations in the study involved obtaining parental consent and protecting the right of children, parents, and staff to privacy and confidentiality, as enshrined in the Data Protection Acts 1988 and 2003. With this in mind, the signed consent of each parent was obtained by early years staff before each child was assessed and before the parent's contact details were passed over to the study team in order to arrange and carry out the parent interview. The parent consent form explained the nature and purpose of the study and guaranteed that the parent's and child's privacy and confidentiality would be protected at all times. Staff consent was implied once a centre agreed to participate in the study and was further implied when staff completed the Staff and Child Questionnaires. In addition to consent, the study ensured privacy and confidentiality by using numerical identifiers on all questionnaires; no names or other personal identifiers were written on any of the questionnaires. All data collection, data entry, and data storage were based on these numerical identifiers so that personal information was never collected and stored with the research data, making it anonymous. All data derived from the questionnaires were stored on password-protected computers used exclusively by the study team.
Data analysis
Data analysis involved four related components. First, descriptive statistics were generated which compared data from wave 1 and wave 2 in order to estimate the change in children's EDI scores during the Free Pre-School Year. Second, cross-tabulations, correlations, and ANOVA were carried out to identify associations between the outcome variable (children's EDI scores) and a range of potential explanatory variables; only explanatory variables which showed a statistically significant bivariate relationship with the outcome variable were considered for the subsequent multivariate analysis. Third, latent variable analysis was carried out on the physical, social, and emotional domains of the EDI. This revealed that these constitute a single latent concept which we refer to as social and emotional skills; this analysis is summarised in . The domain of language and cognitive skills is treated as a separate construct. Fourth, structural equation modelling (SEM) was used to estimate the statistically significant influences on: (i) social and emotional skills and (ii) language and cognitive skills. These models, summarised in and , were estimated using EQS 6.1 Structural Equation Modelling Software, and are well-fitting models judged by a range of fit indices and diagnostic tests [CFI (Comparative Fit Index) equal to or greater than 0.95 and an SRMR (Standardised Root Mean Square Residual) equal to or less than 0.07]. The models include two types of explanatory variables: multi-dimensional latent constructs (notably social class, mother's well-being, parent–child relationship, and staff commitment summarised in ) which are represented by the oval shape, and individual constructs (notably child's age, gender and NESB; NEYAI/Síolta QAP; duration of childcare) which are represented by the rectangular shape. The results are expressed as standardised coefficients which indicate the unique influence of each variable when all other influences are taken into account. A simplified synopsis of all results is presented in .
Figure 1. Measurement model for social and emotional skills. Note: Factor loadings are unstandardised and constrained to be equal across waves 1 and 2. *Statistically significant (p < .05).
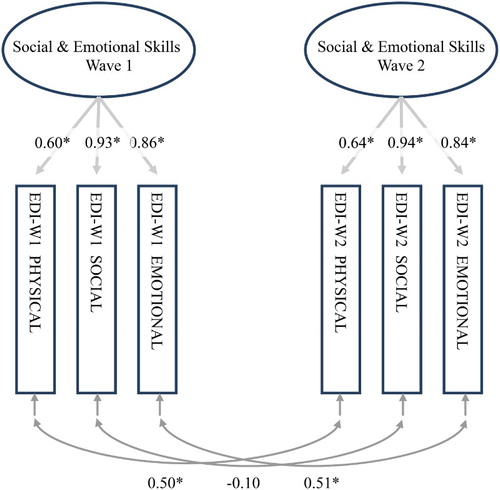
Figure 2. Structural equation model of influences on children's social and emotional skills. (i) Childcare = duration of childcare prior to Free Pre-School Year. (ii) NESB = Non-English-Speaking Background. (iii) Support = Parent's Support Network. (iv) Negative Affect = Staff Negative Affect. W1, Wave 1. W2, Wave 2. *Statistically significant (p < .05). Notes: χ2 = 578 (363 df); CFI = 0.95; SRMR = 0.05; RMSEA = 0.04.
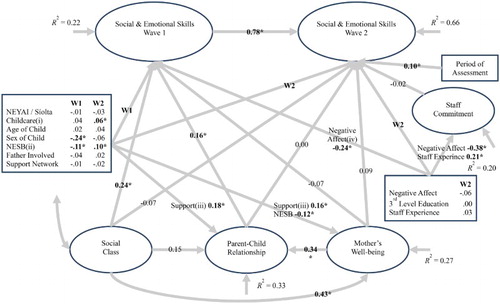
Figure 3. Structural equation model of influences on children's language and cognitive skills. (i) Childcare = duration of childcare prior to Free Pre-School Year. (ii) NESB = Non-English-Speaking Background. (iii) Support = Parent's Support Network. (iv) Negative Affect = Staff Negative Affect. W1 = Wave 1. W2 = Wave 2. *Statistically significant (p < .05). Notes: χ2 = 578 (363 df); CFI = 0.95; SRMR = 0.05; RMSEA = 0.04.
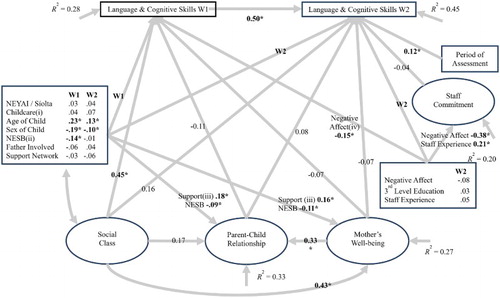
Figure 4. Measurement models for latent concepts used in analysis.
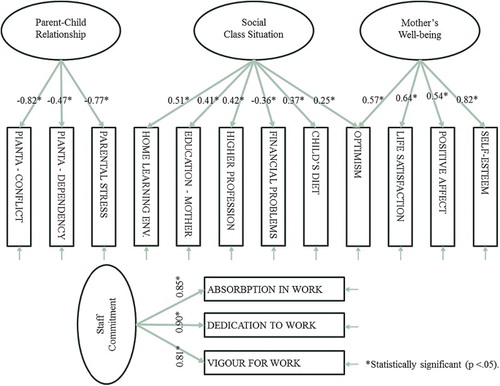
Figure 5. Summary of influences on child outcomes during Free Pre-School Year. NESB = Non-English-Speaking Background. Arrows denote the direction of influence.
Overall, the amount of variance explained (denoted by R2) at wave 1 is 22% in social and emotional skills and 28% in language and cognitive skills, similar to that found in other studies (Melhuish et al. Citation2001, 25). A substantially larger amount of variance in wave 2 scores is explained (66% for social and emotional skills, 45% for language and cognitive skills) on account of the relative stability of scores over time. The amount of variance explained at wave 1 – the time when children entered the Free Pre-School Year – draws attention to the fact that relatively little is known about what influenced the child's development up to that point. This is due to the absence of data from earlier stages of the child's life, particularly ‘person characteristics’ of the child and parents (Bronfenbrenner and Morris Citation2006, 810–813) as well as the ‘proximal processes’ (Bronfenbrenner and Morris Citation2006, 797–798) which connect them. Comprehensive data of this type are difficult to collect and, for that reason, is rarely collected, even in well-funded longitudinal studies. As Bronfenbrenner observed: ‘Most developmental research treats the cognitive and socio-emotional characteristics of the person as dependent variables; that is, as measures of developmental outcomes. Far less often are such characteristics examined as precursors and producers of later development’ (Bronfenbrenner and Morris Citation2006, 810).
Limitations
The sample was based on centres participating in two quality improvement programmes – NEYAI and Síolta QAP – which are not representative of centres, children, or staff in the Free Pre-School Year. This means that the results cannot be extended directly to the wider population of children participating in the Free Pre-School Year. Other limitations with the research design should also be noted. First, the effective sample of 448 children, with matched data on parents and staff, is relatively small when considering the range of influences on which data were collected, thus limiting the power to identify statistically significant relationships. Second, there is no ‘control group’ of children, staff, or centres to evaluate the impact of the Free Pre-School Year on this cohort of children – or indeed the impact of NEYAI or Síolta QAP – by comparison with ‘doing nothing’. The reason for this is simple: in order to establish a ‘control group’ a process of random allocation is necessary and this was precluded by the way these programmes were set up. Third, most of the data used in the evaluation are based on self-report by parents and staff as well as staff assessments of children. This is an appropriate and tried-and-tested method of measurement, particularly where it involves instruments whose validity and reliability have been well established, as in this study. Nevertheless, these instruments cannot provide the type of insight and independent perspective that comes from direct expert observation of quality in an early years setting, such as observing the interactions between staff and children within each setting, but this would have required a much larger research budget. Finally, data on parents were collected from mothers only and were based on the consideration that, since only one parent could be interviewed, for consistency this should be the mother, particularly since one-parent households are more likely to be headed by a mother. This is a well-established convention but the consequence of excluding fathers is recognised in terms of not giving visibility to their role in the lives of children and families bearing in mind that a growing body of research shows that fathers and mothers ‘influence their children in similar rather than dissimilar ways’ (Lamb and Tamis-Lemonda Citation2004, 10–11; see also McKeown, Ferguson, and Rooney Citation1998; McKeown Citation2001a, Citation2001b).
Results
There are three core findings of the study. First, children's social and emotional skills and, to a lesser extent, their language and cognitive skills are relatively stable over time, as indicated by the correlation between scores at waves 1 and 2 (.78 and .50, respectively). This means that children with more or better skills at the beginning of the study period tended to have more or better skills at the end of this period, whilst those with weaker skills at the beginning tended to remain in a weaker position at the end of the study period. This happens because the broad parameters on a child's progress during the Free Pre-School Year, in this cohort of children, have already been set by the child's development during the previous 3–4 years.
Second, child characteristics (notably age, gender, and NESB) as well as family and social system characteristics (notably social class) are the largest measured influences on child development in this cohort of children. Specifically, social class is the single biggest influence on the child's skills at wave 1, both social and emotional skills (.24) and language and cognitive skills (.45). The pre-school system also influenced child outcomes, but to a considerably lesser extent. The results in and indicate that the amount of time spent by a child in an early years centre prior to wave 1 is a statistically significant influence on the child's progress in social and emotional skills (.06); there is also a positive influence on progress in language and cognitive skills but it is just below the threshold of statistical significance (.07). This is an important result and shows that the amount of time spent in an early years centre, prior to the Free Pre-School Year, had a small but beneficial effect, proportional to the time spent there. On average, these children spent more than twice as long in an early years centre prior to the Free Pre-School Year (15 months) compared to the time spent in the Free Pre-School Year (7 months).
The finding that child and family characteristics are much larger influences on child development compared to early years services is not surprising and is consistent with established theory and evidence. Child and family influences are present from the child's birth whereas the Free Pre-School Year, for example, represents about 3% of the child's entire waking life up to that point. This does not imply that early years services are not important, and indeed have particular importance for children whose development may be vulnerable precisely because of family and social circumstances. However, it does imply that in order to understand what happens during the Free Pre-School Year, based on the experience of this cohort of children, requires one to look at all significant influences on child outcomes and not just those in the pre-school system. Further analysis also revealed that the amount of time spent by a child in an early years centre prior to the Free Pre-School Year was positively correlated with social class, which suggests that children from more advantaged social class backgrounds may also have stronger skills, possibly because they spend more time in an early years centre. This finding has wider significance since the association between social class and uptake of early years services has also been found in the 3-year-old cohort of the GUI (Williams et al. Citation2013, 95) and in the 15-year-old cohort who participated in Ireland's PISA 2012 assessments (Perkins et al. Citation2013, xvi; see also OECD Citation2010a, 98, Citation2013a, Citation2013b).
Third, the study found significant gaps between the skills of children at wave 1, both in social and emotional skills and in language and cognitive skills. For the most part, these gaps remained unchanged during the Free Pre-School Year (since the direction of the coefficient is the same at wave 1 and wave 2) or even widened (since the size of the coefficient increased between wave 1 and wave 2); the only exception to this pattern is NESB children, discussed below. Given that a successful pre-school system is one which improves outcomes for all pre-school children, while simultaneously narrowing the gap in outcomes between children, this is an important result. As indicated, the economic rationale for investment in early years services rests on improving overall child outcomes, especially for disadvantaged children, plus the additional benefits of ‘closing the gap’ in outcomes between children. This does not imply that the Free Pre-School Year may not have been a good investment for this cohort of children, or that it may not have a positive impact on disadvantaged children, since that cannot be determined from this study. However, it suggests that, as currently organised, the Free Pre-School Year did not contribute significantly to reducing the gaps in skills within this cohort of children.
It is important to see these findings in the wider context of research on school systems generally and not just pre-school systems. Within that wider field of research, much of the variance in child outcomes across school systems generally is explained by attributes of the child and the child's background rather than school systems, as in this study. This emerges clearly from international studies such as PIRLS and TIMMS (Cosgrove and Creaven Citation2013, 217) and PISA (OECD Citation2010a, 27). In light of this, the finding in this study that no attribute of the pre-school system – apart from duration in an early years centre prior to the Free Pre-School Year – is associated with better outcomes for children is not as surprising as might first appear. It is also worth recalling that ‘absence of evidence is not evidence of absence’ which in this context means that, just because significant impacts of the pre-school system were not been identified does not mean they do not exist; it only means that the study was unable to detect them, possibly due to the small sample size or the absence of direct observation of quality in the pre-school settings. This also underlines why the study's limitations, enumerated above, need to be borne in mind.
One additional finding is worth noting. A substantial minority of children in the sample (15%) were from NESB backgrounds. This is not unexpected given that in 2010, for example, there were 75,000 children born in Ireland with over 20% of them to mothers not themselves born in Ireland (CSO Citation2012b, 24). In this study, a child is defined as NESB where the mother's first language is not English (excluding mothers whose first language is Irish). Children with NESB had weaker social and emotional skills (−.11) and weaker language and cognitive skills (−.14) at wave 1, similar to a finding in the GUI cohort of 3-year-old children (Williams et al. Citation2013, 65). However, the gap in social and emotional skills narrowed during the Free Pre-School Year (.10) but the differential in language and cognitive skills remained unchanged (−.01). It is clear therefore that significant progress was made by NESB children in their social and emotional skills, pointing to a strong integrative effect of the Free Pre-School Year for this cohort of children, while also pointing to residual language and cognitive difficulties associated with this background.
Implications
The introduction of a universal Free Pre-School Year in 2010 is widely regarded as a success since the vast majority of parents (around 95%) have been enrolling their eligible children. One of the consequences of that decision is that it is no longer possible to assess the impact of the Free Pre-School Year by comparison with doing nothing or doing something different, since it would be extremely difficult to draw a matched sample of children who do not attend the Free Pre-School Year. The present study therefore cannot directly assess the impact of the Free Pre-School Year. It is true that the decision to introduce a Free Pre-School Year is well supported by evidence, much of it cited in the introduction to this article, which shows that pre-school education produces beneficial and lasting effects on children, but only if it is high quality, multi-year, and preferably accompanied by additional support services for vulnerable families. As is well known, the existing Free Pre-School Year is not a multi-year programme, it does not meet the same standards of quality found in landmark studies of effective pre-school programmes such as Perry and Abecedarian (Heckman and Kautz Citation2013, 44–47; see also Heckman, Pinto, and Savelyev Citation2013), and additional support services for vulnerable families are not a routine part of the programme.
A robust finding of the study is that social class is the single biggest influence on the skills of this cohort of children at the start of the Free Pre-School Year and, by implication, on their progress during that year. As a result, class-related disparities in skills were already well established before the Free Pre-School Year started and remained comparatively stable throughout this period. In light of this finding, it is worth drawing attention to the concept and measurement of social class used in the study since it represents an extension of conventional measures of poverty and disadvantage to reflect more adequately the multifaceted nature of social class and how child poverty affects child development (CSO Citation2012c; Department of Children and Youth Affairs Citation2012). Child poverty means lacking any of the resources necessary for child development which are social, cultural as well as material. It is obvious that a family's financial resources are important (including the education and employment of parents) but, as numerous studies have shown, so too is the home learning environment (Hart and Risley Citation1995, Citation2003; Melhuish et al. Citation2008; Melhuish Citation2010, 67; Cosgrove and Creaven Citation2013, 201; Curtin et al. Citation2013, 6; Fernald, Marchman, and Weisleder Citation2013, 234; Williams et al. Citation2013, 64–65) and the child's diet (Williams et al. Citation2009, 63, Citation2013, 37) and as well as the quality of interactions within the family. Poverty in this wider understanding gives rise to disparities in social and emotional skills and language and cognitive skills that were evident in this study when children started the Free Pre-School Year. Understanding the pervasive influence of social class on child outcomes therefore is an essential step towards improving outcomes for children. It is also an essential step in developing services for children – including the targeting of services at children in vulnerable families right from the start of the child's life – and needs to take full account of the impact which lack of resources (in this wider sense) has on child development.
A further strength of the concept of social class presented here is its inter-generational character. The child's environment is simultaneously the parent's environment. That is why mother's education, occupation, and financial difficulties are integral parts of the shared family environment. This inter-generational aspect helps to explain why children with weaker skills are more likely to have parents who also have weaker skills. By implication, it suggests that improving outcomes for children will also involve improving the levels of education, employability, and incomes of vulnerable parents.
The findings of the study, which are consistent with a larger body of international and Irish evidence on pre-school and school systems, suggest that the Free Pre-School Year in 2012/13 did not have the capacity to significantly reduce class-related disparities in this cohort of children. That is because child development is incremental, which implies that early advantages (and disadvantages) tend to be reproduced and even reinforced by universal interventions alone. It is likely that considerable staff skills will be required to address these disparities as well as additional complementary initiatives which are targeted at more vulnerable families. That is also the conclusion of a recent review of early childhood programmes in the USA:
The consistently replicated finding that parent characteristics typically explain a greater proportion of the variance in child outcomes than the measured impacts of program variables highlights the need for new intervention strategies that focus more explicitly on strengthening the capabilities of parents and other caregivers. The concept of a two-generation approach to children and families experiencing significant adversity is thus particularly ripe for creative rethinking that moves beyond a simple call for enhanced coordination among the “silos” that separate child-focused and adult-focused services. In short, the need for innovation is compelling and the potential generativity of an expanded definition of evidence that includes advances in the developmental sciences is enormous. (Shonkoff and Fisher Citation2013, 1636)
It is easily forgotten that the Free Pre-School Year, although it comes relatively early in the life of a child, is not early in terms of child development. That is why, as observed in a recent edition of Science, ‘age 4 cannot be characterized as “early” with respect to brain development’ (Shonkoff Citation2011, 983). This supports the case for earlier intervention, particularly where a child's family circumstances are not conducive to normal healthy development. It also underlines why improving child outcomes and reducing socially generated gaps in child outcomes cannot be the sole responsibility of Ireland's early years system, even if it has a substantial and potentially more important role to play.
Given that the economic case for pre-school is typically built on landmark studies which show a return on investment from high-quality, multi-year, pre-school programmes, the results of this study suggest that the Free Pre-School Year will deliver the economic returns found elsewhere if, but only if, the investment is sufficient to produce a similar high-quality, multi-year, pre-school programme with additional targeting of resources at more vulnerable families. In other words, all the evidence indicates that further investment and improvement is required to create a more successful early years system in Ireland in order to improve outcomes for all children while simultaneously narrowing the gap in outcomes between children.
Future research
The Expert Advisory Group on the Early Years Strategy (Citation2013, 19) noted the absence of comprehensive data on quality in early years services in Ireland and made a recommendation to: ‘carry out a baseline audit of the quality of early care and education services immediately’. It is worth adding that there is also an absence of comprehensive data on the outcomes of pre-school and early years services generally and, since quality is the means to better outcomes, both research gaps need to be filled simultaneously. In other words, the measurement of quality should be linked to the measurement of outcomes, particularly for children in the Free Pre-School Year.
Taking a wider perspective on the evidence-base that is required to support the development of early years services, it is clear that continuous national assessment of the Free Pre-School Year is essential. This will require a much larger sample than this study, one which is representative of the entire population in question, and a longitudinal design over a longer period. In addition to collecting new data, there is also need to do further analysis of existing datasets like GUI. Specifically, a full SEM analysis of the GUI infant cohort – based on a merged dataset of over 8000 children at age 9 months (wave 1), 3 years (wave 2), and 5 years (wave 3) – would generate evidence and insight on all influences on child outcomes, including the role of early years services; this could be done with greater robustness and precision than has been possible with the relatively small sample used in this study.
Acknowledgements
The authors acknowledge the funding partners which supported the study as part of the National Early Years Access Initiative (2011–2014): Atlantic Philanthropies, Mount Street Club Trust, Department of Children and Youth Affairs, Department of Education and Skills, Pobal. The comments of an advisory committee to the study are acknowledged: Tony Crooks, Marjorie Smith, Áine Hyland, Bernie McDonnell, and Gail Birkbeck. The authors also acknowledge comments by the editor and referees on an earlier draft of the article.
Disclosure statement
No potential conflict of interest was reported by the authors.
Notes on contributors
Kieran McKeown created the study, wrote the research manual, designed the questionnaires and sampling procedures, supervised data collection and wrote the reports including this article.
Trutz Haase advised on sampling procedures, managed data collection and datasets, carried out statistical analysis and advised on the interpretation of results.
Jonathan Pratschke carried out statistical analysis, advised on the interpretation of results and contributed to writing the reports. All authors read and approved the final manuscript.
References
- Alberts, B. 2011. “Getting Education Right.” Science 333: 919. doi: 10.1126/science.1212394
- Brinkman, S., T. Gregory, J. Harris, B. Hart, S. Blackmore, and M. Janus. 2013. “Associations Between the Early Development Instrument at Age 5, and Reading and Numeracy Skills at Ages 8, 10 and 12: A Prospective Linked Data Study.” Child Indicators Research 6: 695–708. doi: 10.1007/s12187-013-9189-3
- Bronfenbrenner, U., and P. Morris. 2006. “The Bioecological Model of Human Development.” In Handbook of Child Psychology, Vol. 1: Theoretical Models of Human Development, edited by R. M. V. Lerner, W. Damon, and R. M. S. Lerner, 793–828. Hoboken, NJ: Wiley.
- Cosgrove, J., and A. M. Creaven. 2013. “Understanding Achievement in PIRLS and TIMMS.” In National Schools, International Contexts: Beyond the PIRLS and TIMSS Test Results, edited by E. Eivers, and A. Clerkin, 201–227. Dublin: Educational Research Centre.
- CSO. 2012a. Census 2011 Results: This Is Ireland. Highlights from Census 2011, Part 2, June. Dublin: Stationery Office.
- CSO. 2012b. Report on Vital Statistics 2010, November. Dublin: Stationery Office.
- CSO. 2012c. Survey of Income and Living Conditions in 2010, March. Dublin: Stationery Office.
- Curtin, M., J. Madden, A. Staines, and I. Perry. 2013. “Determinants of Vulnerability in Early Childhood Development in Ireland: A Cross-Sectional Study.” BMJ Open 3: e002387. doi:10.1136/bmjopen-2012-002387
- Department of Children and Youth Affairs. 2012. State of the Nation's Children – Ireland 2012, December. Dublin: Government Publications.
- Department of Education and Skills. 2011. Statement of Strategy 2011–2014. Dublin: Department of Education and Skills.
- Department of Education and Skills. 2013. Final Report on the Development and Implementation of the Síolta Quality Assurance Programme, Early Years Education Policy Unit. Dublin: Department of Education and Skills.
- Doyle, O. 2012. Report on Children's Profile at School Entry 2008–2011. March, Geary WP2011/08. Dublin: UCD Geary Institute.
- Doyle, O., S. Finnegan, and K. McNamara. 2012. “Differential Caregiver and Teacher Ratings of School Readiness in a Disadvantaged Community.” European Early Childhood Education Research Journal 20 (3): 371–389. doi: 10.1080/1350293X.2012.704761
- Doyle, O., and K. McNamara. 2011. “Breaking the Cycle of Deprivation: An Experimental Evaluation of an Early Childhood Intervention. Barrington Lecture 2011–12.” Journal of the Statistical and Social Inquiry Society of Ireland XLI: 92–111.
- Expert Advisory Group on the Early Years Strategy. 2013. Right from the Start: Report of Expert Advisory Group on the Early Years Strategy. Dublin: Government Publications.
- Fernald, A., V. A. Marchman, and A. Weisleder. 2013. “SES Differences in Language Processing Skill and Vocabulary are Evident at 18 Months.” Developmental Science 16 (2): 234–248. doi: 10.1111/desc.12019
- Forer, B., and B. Zumbo. 2011. “Validation of Multilevel Constructs: Validation Methods and Empirical Findings for the EDI.” Social Indicators Research 103 (2): 231–265. doi: 10.1007/s11205-011-9844-3
- Forget-Dubois, N., J. P. Lemelin, M. Boivin, and G. Dionne. 2007. “Predicting Early School Achievement with the EDI: A Longitudinal Population-Based Study.” Early Education and Development 18 (3): 405–426. doi: 10.1080/10409280701610796
- Frawley, D. 2014. “Combating Educational Disadvantage Through Early Years and Primary School Investment." Irish Educational Studies 33 (2): 155–171. doi: 10.1080/03323315.2014.920608
- Guhn, M., and H. Goelman. 2011. “Bioecological Theory, Early Child Development and the Validation of the Population-Level Early Development Instrument.” Social Indicators Research 103 (2): 193–217. doi: 10.1007/s11205-011-9842-5
- Guhn, M., B. Zumbo, M. Janus, and C. Hertzman. 2011. “Validation Theory and Research for a Population-Level Measure of Children's Development, Wellbeing, and School Readiness.” Social Indicators Research 103 (2): 183–191. doi: 10.1007/s11205-011-9841-6
- Hart, B., and T. Risley. 1995. Meaningful Differences in the Everyday Experience of Young American Children. Baltimore, MD: Brookes Publishing.
- Hart, B., and T. Risley. 2003. “The Early Catastrophe: The 30 Million Word Gap by Age 3.” American Educator Spring: 4–9. http://www.aft.org//sites/default/files/periodicals/TheEarlyCatastrophe.pdf
- Heckman, J. 2011. “The Economics of Inequality: The Value of Early Childhood Education.” American Educator Spring: 31–36.
- Heckman, J., and T. Kautz. 2013. Fostering and Measuring Skills: Interventions That Improve Character and Cognition. NBER Working Paper 19656, Cambridge, MA: National Bureau of Economic Research.
- Heckman, J., R. Pinto, and P. A. Savelyev. 2013. “Understanding the Mechanisms Through Which an Influential Early Childhood Program Boosted Adult Outcomes.” American Economic Review 103 (6): 2052–2086. doi: 10.1257/aer.103.6.2052
- Hymel, S., L. Le Mare, and W. McKee. 2011. “The Early Development Instrument (EDI): An Examination of Convergent and Discriminant Validity.” Social Indicators Research 103 (2): 267–282. doi: 10.1007/s11205-011-9845-2
- Janus, M., S. Brinkman, and E. Duku. 2011. “Validity and Psychometric Properties of the Early Development Instrument in Canada, Australia, United States, and Jamaica.” Social Indicators Research 103 (2): 283–297. doi: 10.1007/s11205-011-9846-1
- Janus, M., S. Brinkman, E. Duku, C. Hertzman, R. Santos, M. Sayers, and J. Schroeder. 2007. The Early Development Instrument: A Population-based Measure for Communities. A Handbook on Development, Properties, and Use. Hamilton, ON: Offord Centre for Child Studies.
- Janus, M., and D. Offord. 2007. “Psychometric Properties of the Early Development Instrument (EDI): A Teacher-Completed Measure of Children's Readiness to Learn at School Entry.” Canadian Journal of Behavioural Science 39 (1): 1–22. doi: 10.1037/cjbs2007001
- Lamb, M. E., and C. S. Tamis-Lemonda. 2004. “The Role of the Father: An Introduction.” In The Role of the Father in Child Development, edited by M. E. Lamb, 1–31. 4th ed. Hoboken, NJ: John Wiley and Sons.
- Lewis, M., and P. Archer. 2013. “Features of Policy and Provision.” In National Schools, International Contexts: Beyond the PIRLS and TIMSS Test Results, edited by E. Eivers and A. Clerkin, 13–32. Dublin: Educational Research Centre.
- McKeown, K. 2001a. “Families and Single Fathers.” Administration: Journal of the Institute of Public Administration 49 (1): 3–24. http://kieranmckeown.ie/wp-content/uploads/2013/03/17.-Families-and-single-fathers.pdf
- McKeown, K. 2001b. Fathers and Families: Research and Reflection on Key Questions. Dublin: Department of Health and Children. http://kieranmckeown.ie/wp-content/uploads/2013/03/16.-Fathers-and-families-....pdf
- McKeown, K., H. Ferguson, and D. Rooney. 1998. Changing Fathers? Fatherhood and Family Life in Modern Ireland. Cork: Collins Press. http://kieranmckeown.ie/wp-content/uploads/2013/03/10.-Changing-Fathers-Summary.pdf
- McKeown, K., T. Haase, and J. Pratschke. 2014a. A Study of Child Outcomes in Pre-School: Evaluation of National Early Years Access Initiative & Síolta Quality Assurance Programme, Main Report, May, Dublin: Pobal. http://kieranmckeown.ie/wp-content/uploads/2014/05/72.-Summary-Report-on-Child-Outcomes-in-Pre-School-Evaluation-of-NEYAI-S%C3%ADolta-QAP.pdf
- McKeown, K., T. Haase, and J. Pratschke. 2014b. A Study of Child Outcomes in Pre-School: Evaluation of National Early Years Access Initiative & Síolta Quality Assurance Programme, Summary Report, May, Dublin: Pobal. http://kieranmckeown.ie/wp-content/uploads/2014/05/72.-Summary-Report-on-Child-Outcomes-in-Pre-School-Evaluation-of-NEYAI-S%C3%ADolta-QAP.pdf
- McKeown, K., T. Haase, and J. Pratschke. 2014c. A Study of Child Outcomes in Pre-School: Evaluation of National Early Years Access Initiative & Síolta Quality Assurance Programme, Technical Report, May, Dublin: Pobal. http://kieranmckeown.ie/wp-content/uploads/2014/06/76.-Technical-Report-on-Evaluation-of-the-Learning-Community-in-the-National-Early-Years-Access-Initiative.pdf
- Melhuish, E. 2010. “Why Children, Parents and Home Learning are Important.” In Early Childhood Matters: Evidence from the Effective Pre-School and Primary Education Project, edited by K. Sylva, E. Melhusih, P. Sammons, I. Siraj-Blatchford, and B. Taggart, 44–69. Oxford: Routledge.
- Melhuish, E. C., M. B. Phan, K. Sylva, P. Sammons, I. Siraj-Blatchford, and B. Taggart. 2008. “Effects of the Home Learning Environment and Preschool Center Experience upon Literacy and Numeracy Development in Early Primary School.” Journal of Social Issues 64 (1): 95–114. doi: 10.1111/j.1540-4560.2008.00550.x
- Melhuish, E., K. Sylva, P. Sammons, I. Siraj-Blatchford, and B. Taggart. 2001. The Effective Provision of Pre-School Education Project, Technical Paper 7: Social/Behavioural and Cognitive Development at 3–4 Years in Relation to Family Background. London: Institute of Education/DfES.
- Minister for Children and Youth Affairs. 2012. “Foreword.” In Statement of Strategy of Department of Children and Youth Affairs, March. Dublin: Government Publications.
- Moffitt, T. E., L. Arseneault, D. Belsky, N. Dickson, R. J. Hancox, H. L. Harrington, R. Houts, et al.. 2011. “A Gradient of Childhood Self-Control Predicts Health, Wealth, and Public Safety.” Proceedings of the National Academy of Sciences of the United States of America 108 (7): 2693–2698. doi: 10.1073/pnas.1010076108
- Murray, A., C. McCrory, M. Thornton, J. Williams, A. Quail, L. Swords, E. Doyle, and E. Harris. 2011. Growing Up in Ireland National Longitudinal Study of Children: Design, Instrumentation and Procedures for the Child Cohort, Technical Report No 1. Dublin: Office of the Minister for Children and Youth Affairs.
- Neylon, G. 2014. “An Analysis of Irish Pre-school Practice and Pedagogy Using the Early Childhood Environmental Four Curricular Subscales.” Irish Educational Studies 33 (1): 99–116. doi: 10.1080/03323315.2014.888237
- OECD. 2010a. PISA 2009 Results: Overcoming Social Background – Equity in Learning Opportunities and Outcomes (Volume II). Paris: OECD.
- OECD. 2010b. PISA 2009 Results: What Makes a School Successful? – Resources, Policies and Practices (Volume IV). Paris: OECD.
- OECD. 2012. Equity and Quality in Education: Supporting Disadvantaged Students and Schools. Paris: OECD.
- OECD. 2013a. What Students know and can do? Student Performance in Mathematics, Reading and Science (Volume I). Paris: OECD.
- OECD. 2013b. What Makes a School Successful? Resources, Policies and Practices (Volume IV). Paris: OECD.
- Perkins, R., G. Shiel, B. Merriman, J. Cosgrove, and G. Moran. 2013. Learning for Life: The Achievements of 15-Year-Olds in Ireland on Mathematics, Reading Literacy and Science in PISA 2012. Dublin: Educational Research Centre.
- Pianta, R. C., W. S. Barnett, M. Burchinal, and K. R. Thornburg. 2009. “The Effects of Preschool Education: What We Know, How Public Policy Is or Is Not Aligned With the Evidence Base, and What We Need to Know.” Psychological Science in the Public Interest 10 (2): 49–88. doi: 10.1177/1529100610381908
- Pobal. 2013. Pobal Annual Survey of the Early Years Sector 2012, May. Dublin: Pobal.
- Shonkoff, J. P. 2011. “Protecting Brains, Not Simply Stimulating Minds.” Science 333: 982–983. doi: 10.1126/science.1206014
- Shonkoff, J. P., and P. A. Fisher. 2013. “Rethinking Evidence-Based Practice and Two-Generation Programs to Create the Future of Early Childhood Policy.” Development and Psychopathology 25: 1635–1653. doi: 10.1017/S0954579413000813
- Shonkoff, J. P., and D. A., Phillips, eds. 2000. From Neurons to Neighbourhoods: The Science of Early Childhood Development. Washington, DC: National Academy Press.
- Williams, J., S. Greene, E. Doyle, E. Harris, R. Layte, S. McCoy, C. McCrory, et al. 2009. Growing Up in Ireland: National Longitudinal Study of Children – The Lives of Nine Year-Olds. Dublin: Department of Children and Youth Affairs.
- Williams, J., A. Murray, C. McCrory, and S. McNally. 2013. Growing Up in Ireland: National Longitudinal Study of Children Development From Birth To Three Years, Report 5. Dublin: Department of Children and Youth Affairs.