
ABSTRACT
While Ireland has the highest level of participation in higher education (HE) in Europe, it also has one of the widest participation gaps between disabled and non-disabled young people. Using a large-scale longitudinal dataset, we assess how disabled young people compare with non-disabled peers in accessing a range of post-school educational pathways. Extending the effectively maintained inequality perspective to disability research, our results highlight important qualitative differences in disabled people’s trajectories. Ultimately, we find greater progression to Further Education and Training, and lower participation in Level 8 degrees in universities, all else being equal. Entry to HE is lower among those with socio-emotional difficulties, even after controlling for key characteristics, while attendance among young people with an intellectual disability or specific learning difficulty is mediated by academic performance. The results highlight the importance of school attendance, engagement and achievement during the primary and early secondary years, and parental expectations, raising important implications for inclusive education. The multiple challenges facing disabled young people in Ireland are evident, reflecting the direct and indirect impact of socio-economic disadvantage, at family, school and community levels. Stronger linkages across the tertiary landscape and stronger HE transition supports, particularly for young adults with socio-emotional/psychological difficulties, are needed.
Introduction
While social stratification research has produced rich evidence internationally on social inequalities shaping educational outcomes, there has been a neglect of childhood disability in stratification research (Carroll, McCoy, and Mihut Citation2022; Chatzitheochari and Platt Citation2019). This paper charts the educational trajectories at 20 of children identified with disabilities in the mid-primary years. Examining a large-scale dataset with non-disabled peers as a basis of comparison, we make a contribution to disability studies that largely rely on small-scale samples (Shifrer Citation2013; Chatzitheochari and Platt Citation2019) and assess the role of individual, family and school context factors in shaping how disabled children fare as they progress through primary and secondary education and into a diversity of post-school educational pathways. In keeping with the social model of disability, we use the term ‘disabled young people’ rather than ‘people with disabilities’, reflecting the idea that those with impairments often face disabling barriers socially constructed by policies, practices and procedures which are not inclusive (Shaw Citation2021). In common with other recent research (Chatzitheochari and Platt Citation2019; McCoy et al. Citation2016b), a distinction between special educational needs and disability is not meaningful for this analysis of educational transitions. Our paper considers whether being identified at 9 as disabled is associated with worse post-secondary educational outcomes, and also whether type of impairment matters in understanding the educational trajectories of young people.
Inequality in post-secondary education
There has been relatively little focus on understanding how disability and socioeconomic factors (particularly family resources and school context) shape post-school educational outcomes, particularly in Europe. Much of the focus has been on inequalities in compulsory education, with a few notable exceptions. In the UK context, Chatzitheochari and Platt (Citation2019) find that disability differentials in transition to academic upper secondary education and to university are largely the result of primary effects, reflected in differences in school performance between disabled and non-disabled young people. They also find evidence for secondary effects, with similarly achieving disabled young people less likely to pursue full-time academic upper secondary education compared to their non-disabled peers. Educational expectations play an important role at crucial transitions in the English educational system.
In terms of school education, Growing Up in Ireland (GUI) data have provided important insights into educational gaps between social groups in Ireland. Recent research in Ireland has focussed on disproportionality in terms of understanding Special Educational Needs (SEN) diagnosis (McCoy, Shevlin, and Rose Citation2020; McCoy, Quail, and Smyth Citation2014a; Cahill Citation2021). In terms of disproportional representation and diagnoses, Banks, Shevlin, and McCoy (Citation2012) highlight the connection between social, emotional and behavioural difficulties and socio-economically disadvantaged young people and communities. They also reveal a gender disparity in diagnosis, with boys from economically vulnerable families more likely to be diagnosed. On the other hand, the public waiting list for an educational psychologist’s assessment can stretch to years in some areas. As such an assessment is often necessary to receive supports, the ability to pay for private assessments has been shown to exacerbate inequality in Ireland and elsewhere (Kenny, McCoy, and Mihut Citation2020).
School context also matters, and researchers have repeatedly documented how exclusionary practices in school enrolment have marked the education system in Ireland (Doyle, Muldoon, and Murphy Citation2020; Cahill Citation2021). Cahill (Citation2021) also highlights evidence for segregation based on diagnosis, most particularly in relation to special class provision for children with ASD, with a far larger percentage of schools with designated disadvantaged (DEIS) status having ASD classes in comparison to non-DEIS settings (see NCSE Citation2020). He highlights a trend over time. ‘By taking an intersectional perspective, then these connections and experiences become more accentuated as it appears that social class has a significant impact upon how students with special educational needs are received, admitted to, and taught in post-primary school contexts’ (4–5).
While the social profile of disability has been demonstrated (see for example, McCoy et al. Citation2016a), we have little understanding of whether this translates into access to higher education (HE). An evaluation of the main access programme to support disabled students (DARE) (Byrne et al. Citation2013) suggests greater representation among more affluent young people. Similarly in Scotland, there has been a considerable rise in the number of students with dyslexia enrolling in HE, who are more likely to be male and to be middle class (Riddell, Tinklin, and Wilson Citation2005); dyslexic students are a relatively socially advantaged group on a number of dimensions (Riddell and Weedon Citation2014).
Regarding post-school education, in Ireland as elsewhere most attention has focused on family resources/social class (see for example, McCoy et al. Citation2014b), with only a few studies assessing how disabled young people from different backgrounds fare in their educational pathways. Scanlon and Doyle (Citation2021) for example show high levels of progression to further education through providers such as the National Learning Network or training and employment within adult day services and rehabilitation centres for school leavers with intellectual disabilities. Internationally, research shows how disabled people face architectural, virtual, bureaucratic, educational, and social barriers both to access and in their path through higher education (González et al. Citation2021). Much of the research is based on small-scale qualitative studies; for example, Thompson (Citation2013) explores how SES and disability shape the college experience of New York City students with learning disabilities. Socioeconomic differences are linked to variation in students’ college choice, accessing evaluations, requesting accommodations and receiving supplementary supports.
One important exception is the US National Longitudinal Transition Study 2 (NLTS2), the only nationally representative study of secondary students with disabilities in the US with postsecondary outcome data (Newman, Trainor, and Javitz Citation2022). Disabled young people from low SES households are less likely to enrol in postsecondary education (Newman et al. Citation2011). These findings have been attributed to ‘education inequalities that limit opportunity for some and are associated with a life of poverty for many’ (Hughes Citation2013, 39). Wagner, Newman, and Javitz (Citation2014) find the relationship between socioeconomic status, and college attendance among disabled young people is mediated by parental expectations. Doren, Gau, and Lindstrom (Citation2012) found that parental expectations significantly predicted levels of autonomy, and autonomy predicted a number of postschool educational outcomes for disabled young people. Kim and Baker (Citation2021) also show that students’ transition goals did not accurately reflect their educational aspirations, illustrating the ways in which structural factors can systematically complicate the relationships between college expectations and actual matriculation for disabled young people. Parental expectations have been highlighted in the Irish context; such expectations are a significant influence on children’s academic outcomes and partly explain the effects of disability status on academic development in secondary education (McCoy et al. Citation2016b).
Research questions
Using GUI data across four waves we address the following questions:
Are disabled young people less likely to progress to HE in Ireland?
Are there qualitative differences in post-secondary education pathways, in terms of course level and sector, and non-completion, for disabled and non-disabled young people?
To what extent are disability differentials driven by primary effects measured by prior achievement, and secondary effects measured by educational expectations?
Are there meaningful differences between disabled young people and non-disabled young people on key socioeconomic factors like household economic vulnerability, DEIS school attendance and parental education? What role do these differences play in differing post-school outcomes?
Education policy
In Ireland, students gain entry to HE through the Central Applications Office system, which operates on a numerus clausus basis. The DARE scheme offers reduced points places to school leavers who, as a result of having a disability, have experienced additional educational challenges in second-level education (Nic Fhlannchadha Citation2018, 13), with year-on-year increases in the number of successful applicants. AHEAD have identified that the number of disabled new entrants in HE in Ireland has grown from 0.7% in 1994 to 6.3% in 2019/2020 (AHEAD Citation1994, Citation2019; Carroll et al. CitationForthcoming). However, evidence suggests the DARE programme targets a less diverse profile of applicant than the typical HE applicant; applicants attending DEIS schools remain under-represented (Byrne et al. Citation2013). DARE was redefined for new entrants from 2016, to address the identified bias towards applicants who could afford to pay privately for documentation, by widening the eligibility criteria. However, Nic Fhlannchadha (Citation2018) found evidence that disabled students were doubly disadvantaged by experiencing socioeconomic disadvantage (7), applicants from ‘other’ schools (the majority of which are fee-paying schools) remain somewhat more likely to be deemed eligible for DARE (6).
In terms of FET, 7.3% of all learners enrolled in FET in 2019 had at least one type of disability, with the largest share of the learners aged under 25 reporting a difficulty with learning or remembering, a psychological disability or an intellectual disability. For learners under 25 years old who reported a disability, the greatest numbers were enrolled in PLC programmes, followed by the Youthreach Programme, and the majority were following Level 4 or lower programmes (Carroll et al. CitationForthcoming).
The Fund for Students with Disabilities (FSD) provides a range of supports, including academic, IT, personal support, and transport through the disability support services, to disabled students upon transition to FET and HE. However, a failure to increase the budget of the FSD in line with the increased number of disabled students in HE has been noted (Rath Citation2021), while McCoy et al. (Citation2010) find disabled students are much less likely to be engaged in part-time work and therefore have a greater reliance on State and family support. Rath (Citation2021) and McCoy et al. (Citation2010) have documented a policy emphasis on increasing the number of disabled students and providing for their academic supports, with little demonstratable policy provision evident for their wider social engagement within HE (Rath Citation2021, 35).
Finally, the EU sets clear targets on HE attainment levels and gaps in attainment between groups, including those with basic activity difficulties and LHPAD (people limited in work activity because of a longstanding health problem and/or a basic activity difficulty). The Europe 2020 strategy aimed to increase the share of the population aged 30–34 having completed tertiary education, including among those with a basic activity difficulty and a limitation in work caused by a LHPAD. While Ireland has the highest level of HE participation in Europe, the largest gaps in tertiary education attainment between persons aged 30–34 with and without work limitations or basic activity difficulties were observed in Belgium and Ireland (Eurostat Citation2018). Most recently, the 2021 Council resolution on ‘a strategic framework for European cooperation in education and training towards the European education area and beyond (2021-2030)’, includes a strong focus on equity and inclusion, highlighting the importance of paying special attention to learners who face overlapping disadvantages (Council of the European Union Citation2021).
Theoretical framework
Given our focus on quantitative and qualitative dimensions of (post-secondary) education, we draw on effectively maintained inequality (EMI) to understand the dynamics of inequality for disabled young people from different social backgrounds. Lucas (Citation2001) hypothesised that key resource differences and behavioural patterns allow an EMI pattern to emerge and continue even as participation in HE becomes a mass phenomenon. First, information is differentially allocated, advantaging those of higher socioeconomic positions. In schools, two types of students have more information than their peers: (a) those whose parents are socioeconomically advantaged (and thus were more likely than other parents to have navigated later stages of the education process) and (b) those who take advanced courses of study (such as higher level school courses or more prestigious post-school courses), for whatever reason, regardless of their socioeconomic background. While these categories partially overlap, socioeconomically disadvantaged children by definition typically do not have the benefit of the parental resource noted above.
We propose applying EMI to understand disadvantage experienced by disabled young people as they progress through compulsory education and into post-secondary pathways. Qualitative differences at the same level of education represent a persistent barrier to greater equality in the Irish context (Byrne and McCoy Citation2017), with distinct inequalities emerging through key school (from lower- to upper secondary level and advanced programme take-up) and post-school transitions. For the transition from school to third level, they highlight the qualitative distinction in the type of post-compulsory educational institution entered, distinguishing between those attending universities; institutes of technology (IT) and other third-level institutions (colleges); as well as those who do not make the transition to tertiary education. Applying EMI in the US context (Andrew Citation2017) showed how low- and high-socioeconomic status (SES) students with high academic achievements display a greater probability of moving forward through the system. However, high-SES students are more likely to do so by attending more selective institutions at entry and, consequently, are more likely to complete a bachelor’s degree at such institutions – high-SES students have greater institutional reach given similar academic achievements. Greater protection from low achievements and greater boosts from high achievements are both important for translating high-SES students’ educational advantage into better post-education outcomes, thus effectively maintaining pre-existing inequality.
In the Irish context, expansion in post-compulsory educational participation comprised larger increases in ‘second-tier’ IT sector places (388% between 1980 and 2004) relative to ‘first-tier’ university places (174% over the same period) (McCoy and Smyth Citation2011, 247). Our study identifies a qualitative distinction between HE programmes provided at National Framework of Qualifications Level 8Footnote1 (honours degree programmes) compared to Level 6 and 7 (ordinary degree or advanced/higher certificate) offered at ITs, and between HE and FET. Earlier research has highlighted that disabled young people are more likely to plan to attend FET, rather than HE, largely because they are more likely to experience forms of vulnerability that are important in shaping these outcomes (Carroll, McCoy, and Mihut Citation2022). We assess the transitions of disabled young people on a like for like basis, taking account of individual and family resources, school context and individual agency, to reveal the extent of social stratification in post-school pathways.
Methodology
Growing Up in Ireland (GUI)
Our secondary analysis utilises four waves of Cohort ’98 data from the GUI study. It is a large-scale nationally representative longitudinal study tracking the development of children living in Ireland since the age of 9 in 2007. The initial GUI 98 cohort sample comprised 8570 nine-year-old children (representing one in seven 9-year-old children) who were randomly selected through 910 primary schools. The selected children were subsequently followed up at age 13 (wave 2), 17/18 (wave 3) and 20 (wave 4) in 2018/2019. The GUI study adopts a fixed panel design, so by 20 years of age the sample represents the children/young people and their families who were resident in Ireland at 9 years of age and who were still living in Ireland by 20 years old. In total, 4729 young people participated in the study across all four waves. To account for differential response or attrition at waves 2, 3 and 4, the data were statistically adjusted to ensure that they were representative of the population of young people. For details of this procedure see McNamara et al. Citation2021.
The GUI study adopts Bronfenbrenner and Morris’s bioecological theory (Citation2006) as the underlying conceptual framework which emphasises the multifaceted and multi-layered nature of the influences on development over the lifetime of Cohort ‘98 (O’Mahony et al. Citation2021). The rich data allows us to identify disabled children at 9 years old, drawing on information from multiple informants, and to explore how disabled children compare with non-disabled peers as they progress through primary and secondary education and into a diversity of post-school educational pathways.
Variable description
Outcome variables
We examine two main outcome variables, drawing on young peoples’ reports on whether they registered or completed further or higher education, or a training programme. The first outcome is a binary measure of whether they entered or completed HE. To assess the nature of post-secondary educational trajectories, a six-category variable was constructed to distinguish those who attended a Level 8 programme (in a University or IT), those who enrolled on Level 6 or Level 7 programmes, those who enrolled on FET programmes (and did not progress to HE), those who left their course before completion, and those who did not participate in further or higher education.
Individual characteristics
As independent variables, gender and the disability type at 9 are included as individual student characteristics. In the multinomial model we include a binary variable indicating whether the child had a disability at 9 years. Following recent research (McCoy, Shevlin, and Rose Citation2020; Carroll, McCoy, and Mihut Citation2022), we draw on three sources to identify disabled children at 9 years of age. Teachers are asked to identify four main disability types – physical, speech, learning and emotional/ behavioural disabilities. Information from parents allows us to add children not identified by teachers but identified by their parent as having a specific learning difficulty, communication or co-ordination disorder. The Strengths and Difficulties Scale (SDQ) is used as a third source to include children with mental health or emotional/psychological difficulties. Children who were identified by their parents as having hampered daily activities, slow progress, or where parents were concerned about their ability to talk or make speech sounds, as well as the children who were not captured in the four main disability types, are categorised as ‘other’.
Where children have multiple disabilities, we classified them according to the disability which was likely to be most consequential, on average, for their school performance. For instance, if a child had both a general learning/intellectual and physical disability, they were classified as having a general learning/intellectual disability. Consistent with national (McCoy et al. Citation2016a) and international research (Van der Veen et al. 2010 in the Netherlands, Hills et al. 2010 in the UK, as cited in McCoy et al. Citation2016b), we find 21% of 9-year-olds with at least one of four disability categories, including 8% with general learning/intellectual disabilities, 6% with emotional or behavioural disabilities, 5% with specific learning disabilities and 2% with physical disabilities.
Academic achievement
GUI includes multiple measures of student academic achievement across all four waves. At wave 1 we include a binary variable to distinguish lower and higher performers based on teacher reported academic performance of the child on a range of subjects relative to other children in his/her class. Additionally, we include Drumcondra reasoning test scores to measure academic performance at wave 2, and a binary variable of whether the student achieved at least 9 higher-level honours (i.e. achieved an A, B or C) in the Junior Certificate, as a measure of academic performance at wave 3.
School engagement
School engagement has been shown to be an important predictor of children’s academic development and attachment to school (McCoy and Banks Citation2012). It was measured from responses to the question ‘How do you feel about school in general’ with the options based on a five-point Likert scale varying from ‘I like it very much’ to ‘I hate it’ at wave 2. Positive engagement includes children responding that they liked school, and negative engagement includes those indicating that they disliked school. Children’s self-reported conflict level with their teacher is included to assess the quality of the interaction. It was measured from childrens’ responses to questions asking how often they were given out to [rebuked] by a teacher for misbehaving in class or for untidy work, or were praised by a teacher for good work. We also include school attendance, which is often considered a correlate of children’s academic performance (Roby Citation2004), measured by the teacher-reported number of school days the child had missed for the school year at wave 1. Attendance has been shown to be a particularly important mediator of academic outcomes for disabled young people (Champaloux and Young Citation2015).
Family resources
Parental education and household economic vulnerability are included to capture the child’s home and family characteristics. Parental education is defined as the highest educational attainment of the primary caregiver, constructed as a binary variable differentiating parents with or without a university degree based on wave 1 data. Economic vulnerability across all four waves is a composite measure based on latent class analysis and comprises income poverty, household joblessness, and financial strain (Whelan et al. Citation2015). The number of books in the home at age 9 is included as a measure of social and cultural capital to account for the achievement-directed investments during middle childhood (McCoy, Quail, and Smyth Citation2012).
Parental expectation
In line with earlier work (McCoy et al. Citation2016b), we examine the extent to which parental expectations at age 9 influence post-secondary outcomes. Specifically, at wave 1 parents were asked how far they expect the child will go in his/her education or training if taking everything into account. A binary variable distinguishing degree or higher from all others is used.
School characteristics
The socio-economic profile of the schools attended at age 9 (primary school) and 13 (secondary school) is measured by using the Delivering Equality of Opportunity in Schools (DEIS) status of the school. The DEIS programme recognises schools in areas with concentrated levels of disadvantage, with approximately 21% of primary and 27% of secondary schools taking part in the programme (Department of Education Citation2022a, Citation2022b).Footnote2 A binary variable is included to differentiate students attending DEIS schools at any wave from those attending non-DEIS schools.
Tables A1 and A2 of the Appendix summarise the percentage of young people attending different post-school trajectories by individual, family and school characteristics.
Analytical approach
Using a multilevel structure clustering the standard errors at the school level at age 9, we examine how individual, family and school characteristics in childhood and adolescence shape the probability of accessing HE by the age of 20. We include both descriptive and multivariate statistical approaches, all undertaken in Stata.
The results of the multilevel logistic models are expressed in terms of odd ratios, with values greater than one indicating a greater likelihood of entering HE and values less than one indicating lower chances. The results of the multivariate multinomial model are expressed in terms of the relative risk ratio, or the change in the relative risk of being in that category compared to the reference category that goes with a one-unit change in the variable in question. A value greater than one indicates a higher probability attending other educational settings relative to the probability of attending an honours degree university programme, and a value less than one indicates a reduced probability.
Results
Descriptive results
Overall, 61% of 20-year-olds were currently in or had completed a HE degree, including 62% of females and 59% of males. As shown in , there were wide differences across different types of SEN and disability – 66% of those with no SEN at 9 were in HE, 62% with a physical or sensory disability, 49% with a specific learning difficulty, 46% of those in the other disability category, 40% with a social-emotional SEN and 28% with an intellectual disability. Considering family resources, much lower levels of HE participation are evident where a family has experienced economic vulnerability or where parents had lower levels of education. While 42% of those who attended a DEIS school were in HE, this compared to 68% among those attending non-DEIS schools.
Figure 1. Higher education access gaps.
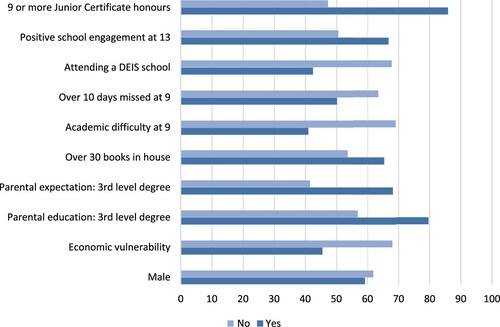
There were also significant gaps across key personal factors and experiences at 9. Much higher levels of HE participation are found among those whose parents expected them to achieve this level of education (68% compared to 42% where expectations were lower). Participation rates were significantly lower among children who were identified as having a difficulty with a key academic subject at 9 and among those who missed more than 10 days of school in the previous year at 9.
Key school-based factors at 13 and 17 also show strong associations with HE entry. For example, while half of those who did not report positive engagement with school at 13 were now in HE, this was two-thirds among those who did report positive engagement. All achievement and aptitude measures are highly predictive of HE entry, with 47% of those who achieved fewer than 9 Junior Certificate honours in HE at 20, compared to 86% of those who achieved 9 or more.
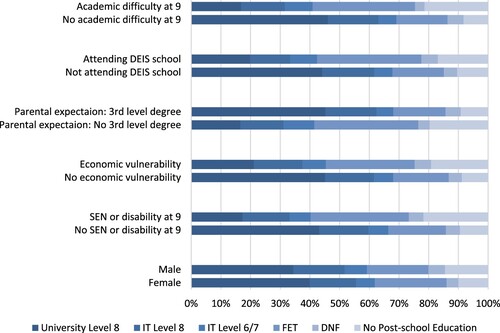
below shows that these gaps become even more pronounced when we move beyond the binary measure of HE access. Those with a disability or from a socioeconomically disadvantaged background are not only less likely to enrol in HE, those who access HE are less likely to be in more prestigious, harder to enter University Level 8 courses and more likely to be in less competitive IT Level 8 courses or Level 6/7 courses. also shows what those who are not in HE are doing – those groups less represented in HE are instead in FET or did not take part in any post-school education or training. The Did Not Finish (DNF) group are those who started course of any level but did not complete it.
Figure 2. Higher education pathway gaps.
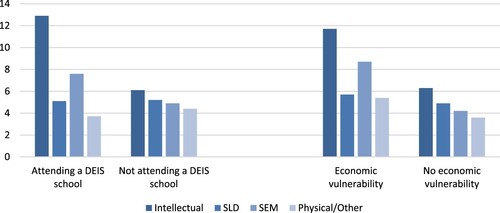
As well as SEN status, and make clear the other key gaps in access to HE. and explore the relationship between SEN status and these key characteristics and experiences. Boys (26%) are slightly more likely to be in the SEN group than girls (21%). Young people with a SEN are roughly one and a half times more likely to have gone to a DEIS school (36–26%) and to have experienced economic vulnerability (45–30%). Within this, certain types of SEN or disability are more overrepresented than others: 13% of DEIS students and 12% of economically vulnerable young people have an intellectual disability, compared to 6% in non-DEIS schools and 6% of non-economically vulnerable young people. Almost 9% of economically vulnerable young people and 8% of DEIS students have a socio-emotional or behavioural SEN, while 4% of non-economically vulnerable young people and 5% in non-DEIS schools do.
Figure 3. Key characteristics by disability status.
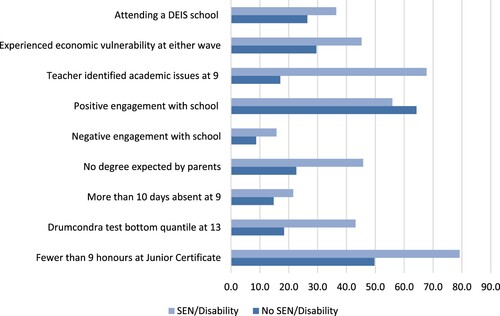
Figure 4. Disability type by key socioeconomic factors.
At 9, young people with a SEN are far more likely to be identified as having academic issues, as well as being more likely to have missed more than 10 days of school and twice as likely to be expected not to get a degree by parents. At 13, they are much more likely to be in the bottom quintile, as well as being less likely to have positive engagement with school and more likely to have negative engagement with school. At Junior Certificate level, they are more likely to achieve 8 or fewer honours (80–50%), a key gap considering the very high percentage of those who go on to HE having achieved 9 or more honours.
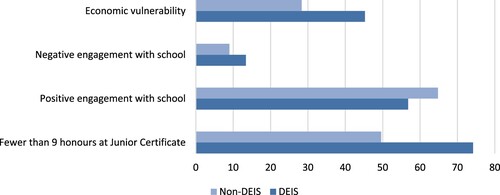
Finally, shows some key differences between DEIS and non-DEIS school settings. While there are many qualitative differences between the challenges facing DEIS and non-DEIS schools, of particular relevance for this study are the higher number of students who achieve 8 honours or fewer at Junior Certificate level (74–50%), the lower level of positive engagement with school (57–65%), the higher level of negative engagement with school (13–9%) and the far greater frequency of economic vulnerability among DEIS students (45–28%).
Figure 5. Key characteristics by DEIS status.
Binary logistic regression results
To further explore the ways in which these key characteristics influenced HE attendance, multilevel logistic regression analysisFootnote3 was conducted with young people clustered within primary schools. The models were constructed using four successive blocks of variables. The first block includes only SEN/disability status and gender. The second block adds wave 1 controls: economic vulnerability, parental education, parental expectations, number of books in household, academic performance, attendance, as well as school DEIS status at primary and secondary school. The third block adds wave 2 controls: teacher conflict, positive engagement and achievement at 13. Finally, the fourth block adds the number of Junior Certificate honours. shows the odds ratios for each variable, as well as an indicator of significance.
Table 1. Binary regression results for higher education attendance.
Considering different types of disability or SEN separately, this model shows that having a physical or sensory impairment is not significantly associated with HE attendance, regardless of whether other controls are included. Being identified as having a socio-emotional or behavioural SEN or a SEN/disability categorised as Other, conversely, remains significantly associated with a lower likelihood of HE attendance even after controls from all three waves are introduced. The sequential approach also highlights some of the mechanisms underpinning the gaps in HE attendance between groups. In the original model, for example, both those with intellectual disabilities and those with specific learning difficulties are significantly less likely to attend HE than those without a SEN or disability. When key personal and contextual characteristics at 9 are introduced, however, having a specific learning difficulty is no longer significantly associated with HE attendance. Once aptitude and school engagement at 13 are introduced, having an intellectual disability also becomes a non-significant factor. In other words, the lower likelihood of attending HE for these groups is mediated by one or more of the context factors.
Model 2 shows that socioeconomic factors, namely parental education, experiencing economic vulnerability and attending a DEIS school are all significant predictors of HE attendance. Parental expectations also play a strong role, as does missing more than 10 days of school at 9. Being identified by a teacher as having academic issues at 9 is also significantly associated with lower likelihood of attending HE. This is no longer significant in Model 3 when key context variables from wave 2 are introduced, likely due to the inclusion of Drumcondra Test quantile to capture academic aptitude, but the other wave 1 factors remain significant. Teacher conflict at 13 is negatively associated with HE attendance while liking school at 13 is positively associated with HE attendance. Drumcondra scores show very strong effects, with those in the highest quintile four times as likely to attend HE as those in the lowest quintile.
Achieving 9 or more Junior Certificate Honours is confirmed to be highly significantly associated with attending HE, as expected from the descriptive results. In many ways, achieving 9 Junior Certificate Honours is an outcome in itself, one linked to earlier academic performance, engagement and other important constructs. It also comes at a key moment in young peoples’ educational trajectories, feeding into young people and their schools’ and families’ decisions on how many higher-level subjects to take and what to aim for in senior cycle. However, even after including it several key variables remain significant. As discussed above, having a socio-emotional or behavioural SEN or disability or one categorised as Other remains negatively associated with HE attendance. So too does having experienced economic vulnerability or attending a DEIS school. Missing more than 10 days of school at 9 or disliking school at 13 are also negatively associated with HE attendance, even with all else being equal. Finally, academic aptitude at 13 remains significant, though with a levelling off effect across the top 3 quintiles.
Multinomial logistic regression results
A multinomial logistic regression was conducted to investigate important factors in the different post-school educational pathways taken by young people, with results presented in .
Table 2. Multinomial logistic regression results for post-school setting.
The multinomial regression shows that beyond the unequal access to HE, there is unequal allocation of places in more prestigious settings within higher and further education. Young people with a SEN or disability are less likely to be in a University Level 8 degree and more likely to attend an IT, FET, not to finish their programme or not to attend any post-school education or training than young people without an SEN or disability, all else being equal.Footnote4 Those who attended DEIS schools or experienced economic vulnerability are less likely to be in a University Level 8 degree and more likely to be in each of the other settings. Those who are identified as having academic issues at 9 or whose parents did not expect them to complete a degree are also more likely to be in each of the other settings, though no more likely to have stopped attending a programme without finishing it. The analysis also highlights where the widest gaps exist: the largest relative risk for each variable is marked in bold in . For young people with a SEN or disability, young people who experienced economic vulnerability and young people who were identified as experiencing academic issues at 9, the biggest gap is in not accessing any post-school education or training, while for those attending DEIS schools it is attending FET.
In sum, in line with evidence from other countries, disabled children perform consistently worse academically than their non-disabled peers, with disability gaps already formed during primary school (see Parsons and Platt Citation2017 in the UK context). The results show that disability differentials in progression to HE are partly explained by primary effects, represented by teacher identified academic issues during primary education, an ability measure in early secondary education and an achievement measure at upper secondary education. Further, type of impairment matters and students with socio-emotional disabilities are less likely to progress to HE even when we take account of primary effects. The results also reflect factors like repeated absences and socio-economic disadvantage that are often associated with disability, as shown elsewhere (Blackburn, Spencer, and Read Citation2010; Champaloux and Young Citation2015; Crump et al. Citation2013; Chatzitheochari and Platt Citation2019). Clearly differentiation in the extent and nature of HE access by disability status cannot be considered in isolation from the effects of family resources and gender. Additionally, the results show that agency is also important, with students’ school engagement and parental expectation underscoring the HE entry gaps (also demonstrated by Pinquart and Ebeling Citation2020).
Discussion
Extending the effectively maintained inequality perspective to disability research, our results highlight important qualitative differences in the trajectories of disabled young people. The evidence reveals multiple challenges facing disabled young people in Ireland, in particular reflecting the direct and indirect impact of socio-economic disadvantage, at family, school and community levels. All else being equal, children identified with a socio-emotional or behavioural difficulty or one categorised as Other, are less likely to progress to HE. We find greater progression to FET, and lower participation in Level 8 degrees in universities, among disabled young adults. The results highlight the importance of attendance, engagement and achievement during the primary and early secondary years, as well as of parental expectations, raising important implications for inclusive education and policy addressing education disadvantage.
The persistent significance of key characteristics at 9 after including socioeconomic controls and accounting for academic aptitude highlights the importance of early educational engagement for students’ long-term trajectories. In particular, attendance and parental expectations at this stage play a crucial role in where students are over a decade later. This raises clear questions around whether schools are adequately engaging disabled students, and whether they have the resources to do so (Kenny, McCoy, and Mihut Citation2020). The fact that having a physical or sensory disability at 9 is not significantly associated with HE access shows that inclusion can be effective. While the challenges may be greater for young people with intellectual disabilities and specific learning difficulties, this study makes clear the impact of the status quo on their educational outcomes. The finding also highlights the particular issues facing young people with a socioemotional or behavioural difficulty – their unequal access to HE is not fully moderated by achievement, socioeconomic background or our other controls. Targeted supports both in school and as they transition to post-school settings are therefore key to meaningfully including these students.
The disproportionate representation of disabled students in DEIS schools and in economically vulnerable households, and the significance of these factors in students’ post-school pathways, also raise questions about equity in Irish schools. While the DEIS programme has shown strong results in tackling achievement, attendance and engagement gaps, adequately supporting the complexity of needs their students are facing clearly demands more resources. The clustering of students with complex needs in DEIS schools also emerges as a clear issue. Is it any surprise at-risk young people are attending different post-school settings when they are in many ways attending different school settings as well?
As well as the challenges facing disabled young people, and especially disabled young people in DEIS schools or from economically vulnerable households, in leaving school and transitioning to post-school education, this study identifies clear barriers along the way. Liking school at 13 has a positive association with HE attendance, and the lack of this positive engagement is one such barrier for young people as they move through secondary school. Working to make school a place where students want to be is a key part of the DEIS framework, and this study reaffirms the importance of building engaging contexts in order to nurture engaged students. The Junior Certificate emerges as a clear split in young people’s trajectories, with those who achieve 9 or more honours highly likely to go on to HE and those who achieve 8 or fewer highly unlikely. There has been a positive development since this cohort finished school, in that the new Junior Cycle Framework does not divide subjects into higher- and ordinary-level (aside from Irish, English and Maths). This will hopefully lead to less of a gap opening up in those early secondary years, and ultimately to more students sitting more higher-level Leaving Certificate subjects.
Finally, it is important to qualify our HE binary and our hierarchical approach to our multinomial measure. There has been significant reform across the FET sector and among Institutes of Technology (many now amalgamated into regional Technological Universities) over the last few years, with an extremely high standard of education and training now available across a vast range of fields. There is also a growing emphasis on mobility between sectors, especially in progressing through FET into HE. However, the numbers remain stark. HE graduates continue to experience better post-education outcomes across earnings, job satisfaction and general life satisfaction, and the more prestigious the institution the more pronounced the premium (Frawley et al. Citation2020; McCoy et al. Citation2014b). As long as this remains the case, differential access to these higher-status courses by disability status and socioeconomic background will continue to be a key driver of social reproduction, and the education system will continue to effectively maintain inequality.
Acknowledgements
The authors are grateful to Bertrand Maître and Míde Griffin at ESRI for helpful comments on an early draft of this manuscript.
Disclosure statement
No potential conflict of interest was reported by the author(s).
Data availability statement
The data that support the findings of this study are available from Ireland’s Central Statistics Office (CSO). Restrictions apply to the availability of these data, which were used under licence for this study. Data may be obtained by registered research organisations with the permission of the Central Statistics Office. Growing Up in Ireland (GUI) is funded by the Department of Children, Equality, Disability, Integration and Youth (DCEDIY). It is managed by DCEDIY in association with the CSO. Results in this paper are based on analyses of data from Research Microdata Files provided by the CSO. Neither the CSO nor DCEDIY take any responsibility for the views expressed or the outputs generated from these analyses.
Additional information
Notes on contributors
Eamonn Carroll
Eamonn Carroll is a Postdoctoral Research Fellow at the Economic and Social Research Institute in Ireland. His research interests include educational inequality, bio-ecological approaches to educational research and inclusive education.
Keyu Ye
Keyu Ye is a Research Assistant at the Economic and Social Research Institute in Ireland. Her research interests include educational inequality and inclusion both at national and international levels.
Selina McCoy
Selina McCoy is a joint coordinator of education research at the Economic and Social Research Institute, Dublin and Adjunct Professor of Sociology at Trinity College Dublin, Ireland. Selina has published in prestigious journals on issues such as inclusive education, ICT and equality. She is a member of the European Commission Expert Group on Quality Investment in Education and Training.
Notes
1 For full details see: https://www.qqi.ie/what-we-do/the-qualifications-system/national-framework-of-qualifications All NFQ qualifications have a European Qualifications Framework reference level.
2 The rate is calculated based on primary and post primary school enrolment data for 2021/2022 academic year.
3 The model with weights applied or not produces similar results. In this paper we use model with weights applied.
4 The numbers at each setting were too small to permit analysis of post-school setting by disability/SEN type.
References
- AHEAD (Association for Higher Education Access & Disability). 1994. Number of Students with Disabilities Studying in Higher Education in Ireland. Dublin: AHEAD.
- AHEAD (Association for Higher Education Access & Disability). 2019. Number of Students with Disabilities Studying in Higher Education in Ireland 2017/18. Dublin: AHEAD.
- Andrew, M. 2017. “Effectively Maintained Inequality in U.S. Postsecondary Progress: The Importance of Institutional Reach.” American Behavioral Scientist 61 (1): 30–48.
- Banks, J., M. Shevlin, and S. McCoy. 2012. “Disproportionality in Special Education: Identifying Children with Emotional Behavioural Difficulties in Irish Primary Schools.” European Journal of Special Needs Education 27 (2): 219–235.
- Blackburn, C., N. J. Spencer, and J. M. Read. 2010. “Prevalence of Childhood Disability and the Characteristics and Circumstances of Disabled Children in the UK: Secondary Analysis of the Family Resources Survey.” BMC Pediatrics 10 (1). Article number 21. https://bmcpediatr.biomedcentral.com/articles/10.1186/1471-2431-10-21.
- Bronfenbrenner, U., and P. A. Morris. 2006. “The Bioecological Model of Human Development.” In Handbook of Child Psychology, edited by R. M. Lerner, and W. Damon, 793–828. Hoboken, NJ: Wiley & Sons.
- Byrne, D., A. Doris, O. Sweetman, R. Casey, and D. Raffe. 2013. An Evaluation of the HEAR and DARE Supplementary Admission Routes to Higher Education. Maynooth: National University of Ireland. https://mural.maynoothuniversity.ie/8969/1/DB-Evaluation-2014.pdf.
- Byrne, D., and S. McCoy. 2017. “Effectively Maintained Inequality in Educational Transitions in the Republic of Ireland.” American Behavioral Scientist 61 (1): 49–73. doi:10.1177/0002764216682991.
- Cahill, K. 2021. “Intersections of Social Class and Special Educational Needs in A DEIS Post-Primary School: School Choice and Identity.” International Journal of Inclusive Education, doi:10.1080/13603116.2021.1968519.
- Carroll, E., S. McCoy, and G. Mihut. 2022. “Exploring Cumulative Disadvantage in Early School Leaving and Planned Post-School Pathways among Those Identified with Special Educational Needs in Irish Primary Schools.” British Educational Research Journal 00: 1–18. https://doi.org/10.1002/berj.3815.
- Carroll, E., S. McCoy, G. Mihut, and K. Ye. Forthcoming. Mapping the Post-School Pathways of Young People with Special Educational and Learning Needs. Dublin: NCSE.
- Champaloux, S. W., and D. R. Young. 2015. “Childhood Chronic Health Conditions and Educational Attainment: A Social Ecological Approach.” Journal of Adolescent Health 56 (1): 98–105.
- Chatzitheochari, S., and L. Platt. 2019. “Disability Differentials in Educational Attainment in England: Primary and Secondary Effects.” The British Journal of Sociology 70 (2): 502–525. doi:10.1111/1468-4446.12372.
- Council of the European Union. 2021. Council Conclusions on Equity and Inclusion in Education and Training in Order to Promote Educational Success for All. Brussels: Council of the European Union. https://www.consilium.europa.eu/media/49660/st08693-en21-002.pdf.
- Crump, C., D. Rivera, R. London, M. Landau, B. Erlendson, and E. Rodriguez. 2013. “Chronic Health Conditions and School Performance among Children and Youth.” Annals of Epidemiology 23 (4): 179–184.
- Department of Education. 2022a. Post Primary Schools 2021/2022 - Preliminary Results. https://assets.gov.ie/212275/35ccd47d-3c3e-4760-bd31-ec8b3298db5b.xlsx.
- Department of Education. 2022b. Primary Schools 2021/2022 - Preliminary Results. https://assets.gov.ie/212274/d521dc50-7b9d-4207-9e72-48e01054ab4f.xlsx.
- Doren, B., J. M. Gau, and L. Lindstrom. 2012. “The Relationship Between Parent Expectations and Postschool Outcomes of Adolescents with Disabilities.” Exceptional Children 79 (1): 7–23.
- Doyle, D. M., M. Muldoon, and C. Murphy. 2020. “Education in Ireland: Accessible Without Discrimination for All?” The International Journal of Human Rights 24 (10): 1701–1720. doi:10.1080/13642987.2020.1773437.
- Eurostat. 2018. Disability Statistics - Access to Education and Training. Brussels: European Commission. https://ec.europa.eu/eurostat/statistics-explained/index.php?oldid=413588.
- Frawley, D., V. Harvey, V. Pigott, and M. Mawarire. 2020. Graduate Outcomes Survey: Class of 2018. Dublin: HEA.
- González, J. M. G., S. G. Gómez-Calcerrada, E. S. Hernández, and S. Rios-Aguilar. 2021. “The Twisting Road to Access to Higher Education for People with Disabilities in Spain.” International Journal of Disability, Development and Education, doi:10.1080/1034912X.2021.1910932.
- Hughes, C. 2013. “Poverty and Disability: Addressing the Challenge of Inequality.” Career Development and Transition for Exceptional Individuals 36 (1): 37–42. doi:10.1177/2165143413476735.
- Kenny, N., S. McCoy, and G. Mihut. 2020. “Special Education Reforms in Ireland: Changing Systems, Changing Schools.” International Journal of Inclusive Education, doi:10.1080/13603116.2020.1821447.
- Kim, H., and D. Baker. 2021. “Dreaming of College Versus Going to College: Expectations and Enrolment among Autistic Students.” Remedial and Special Education, 1–15. doi:10.1177/07419325211046050.
- Lucas, S. R. 2001. “Effectively Maintained Inequality: Education Transitions, Track Mobility, and Social Background Effects.” American Journal of Sociology 106: 1642–1690.
- McCoy, S., and J. Banks. 2012. “‘Simply Academic?’ Why Children with Special Educational Needs Don’t Like School.” European Journal of Special Needs Education 27 (1): 81–97.
- McCoy, S., J. Banks, and M. Shevlin. 2016a. “Insights Into the Prevalence of Special Educational Needs.” In Cherishing All the Children Equally? Ireland 100 Years on from the Easter Rising, edited by J. Williams, E. Nixon, E. Smyth, and D. Watson, 153–174. Cork, Ireland: Oak Tree Press. https://www.esri.ie/system/files/media/file-uploads/2016-10/CB201608.pdf.
- McCoy, S., E. Calvert, E. Smyth, and M. Darmody. 2010. Study on the Costs of Participation in Higher Education. Dublin: HEA. https://www.esri.ie/system/files/publications/BKMNEXT138_1.pdf.
- McCoy, S., B. Maître, D. Watson, and J. Banks. 2016b. “The Role of Parental Expectations in Understanding Social and Academic Well-Being among Children with Disabilities in Ireland.” European Journal of Special Needs Education 31 (4): 535–552.
- McCoy, S., A. Quail, and E. Smyth. 2012. Influences on 9-Year-Olds’ Learning: Home, School and Community. Dublin: Department of Children and Youth Affairs.
- McCoy, S., A. Quail, and E. Smyth. 2014a. “The Effects of School Social Mix: Unpacking the Differences.” Irish Educational Studies 33 (3): 307–330. doi:10.1080/03323315.2014.955746.
- McCoy, S., M. Shevlin, and R. Rose. 2020. “Secondary School Transition for Students with Special Educational Needs in Ireland.” European Journal of Special Needs Education 35 (2): 154–170.
- McCoy, S., and E. Smyth. 2011. “Higher Education Expansion and Differentiation in the Republic of Ireland.” Higher Education 61 (3): 243–260.
- McCoy, S., E. Smyth, D. Watson, and M. Darmody. 2014b. Leaving School in Ireland: A Longitudinal Study of Post-School Transitions. Dublin: ESRI. https://www.esri.ie/pubs/RS36.pdf.
- McNamara, E., C. O’Reilly, A. Murray, D. O’Mahony, J. Williams, D. Murphy, R. McClintock, and D. Watson. 2021. Design, Instrumentation and Procedures for Cohort ’98 (Child Cohort) at Wave 4 (20 Years of Age). https://www.growingup.ie/pubs/20Yr-Design-Report.pdf.
- NCSE (National Council for Special Education). 2020. “Special Classes in Primary and Post Primary Schools Academic year 20/21.” Online data, NCSE. https://ncse.ie/wp-content/uploads/2020/09/List-of-Special-ClassesSeptember-2020.15.09.2020-1.pdf.
- Newman, L. A., A. A. Trainor, and H. S. Javitz. 2022. “Effect of Self-Determination on Postsecondary Enrollment of English Learners with Disabilities.” Remedial and Special Education, 1–13. doi:10.1177/07419325221081502.
- Newman, L. A., M. Wagner, A. M. Knokey, C. Marder, K. Nagle, D. Shaver, and X. Wei. 2011. The Post-High School Outcomes of Young Adults with Disabilities Up to 8 Years After High School. A Report from the National Longitudinal Transition Study-2 (NLTS2) (NCSER 2011-3005). Menlo Park, CA: SRI International. http://www.nlts2.org/reports/2011_09_02/nlts2_report_2011_09_02_complete.pdf.
- Nic Fhlannchadha, S. 2018. DARE HEAR Facts and Figures Report 2017-2018: Summary Report. Dublin: Irish Universities Association. https://www.iua.ie/wp-content/uploads/2018/08/DARE-HEAR-Facts-and-Figures-2017-2018-Summary-Report.pdf.
- O’Mahony, D., E. McNamara, R. McClintock, A. Murray, E. Smyth, and D. Watson. 2021. The Lives of 20-Year-Olds: Making the Transition to Adulthood. https://www.growingup.ie/pubs/The-Lives-of-20-Year-Olds.pdf.
- Parsons, S., and L. Platt. 2017. “The Early Academic Progress of Children with Special Educational Needs.” British Educational Research Journal 43 (3): 466–485.
- Pinquart, M., and M. Ebeling. 2020. “Parental Educational Expectations and Academic Achievement in Children and Adolescents—A Meta-Analysis.” Educational Psychology Review 32: 463–480. doi:10.1007/s10648-019-09506-z.
- Rath, V. 2021. . “The Social Engagement Experiences of Disabled Students in Higher Education in Ireland”. PhD, Trinity College Dublin. http://www.tara.tcd.ie/bitstream/handle/2262/95415/PhD_VR_Final_26.02.2021%20Upload_Final%20V2%20MMYR_Appendixedt.pdf?sequence=3.
- Riddell, S., T. Tinklin, and A. Wilson. 2005. Disabled Students in Higher Education: Perspectives on Widening Access and Changing Policy. 1st ed. London: Routledge. doi:10.4324/9780203087121.
- Riddell, S., and E. Weedon. 2014. “Disabled Students in Higher Education: Discourses of Disability and the Negotiation of Identity.” International Journal of Educational Research 63: 38–46. DOI:10.1016/j.ijer.2013.02.008.
- Roby, D. E. 2004. “Research on School Attendance and Student Achievement: A Study of Ohio Schools.” Education Research Quarterly 28: 3–4.
- Scanlon, G., and A. Doyle. 2021. “Transition Stories: Voices of School Leavers with Intellectual Disabilities.” Special Issue: Education as a Catalyst for the Social Inclusion of People with Learning Disabilities 49: 4. doi:10.1111/bld.12433.
- Shaw, A. 2021. “Inclusion of Disabled Higher Education Students: Why Are We Not There Yet?” International Journal of Inclusive Education, doi:10.1080/13603116.2021.1968514.
- Shifrer, D. 2013. “Stigma of a Label: Educational Expectations for High School Students Labelled with Learning Disabilities.” Journal of Health and Social Behavior 54 (4): 462–480.
- Thompson, A. 2013. “Social Class and Learning Disabilities: Intersectional Effects on College Students In New York City.” Disability and Intersecting Statuses (Research in Social Science and Disability) 7: 267–292. Emerald Group Publishing Limited, Bingley. https://doi.org/10.1108/S1479-3547(2013)0000007012.
- Wagner, M. M., L. A. Newman, and H. S. Javitz. 2014. “The Influence of Family Socioeconomic Status on the Post–High School Outcomes of Youth with Disabilities.” Career Development and Transition for Exceptional Individuals 37 (1): 5–17. doi:10.1177/2165143414523980.
- Whelan, C. T., D. Watson, B. Maître, and J. Williams. 2015. “Family Economic Vulnerability and the Great Recession: An Analysis of the First Two Waves of the Growing up in Ireland Study.” Longitudinal and Life Course Studies: International Journal 6 (3): 230–244.
Appendix
Table A1. Descriptive statistics: Percentage participating in HE.
Table A2. Descriptive statistics: percentage in different postsecondary pathways.