
 ?Mathematical formulae have been encoded as MathML and are displayed in this HTML version using MathJax in order to improve their display. Uncheck the box to turn MathJax off. This feature requires Javascript. Click on a formula to zoom.
ABSTRACT
This study examines Nordic economic convergence from the sixteenth to twentieth century respective of the economic leaders, in effect the UK before 1914 and USA thereafter. The paper uses a novel approach of combining the analysis of both GDP and wages. The examination of real GDP per capita suggests that there was a catch-up process in play, both with the economic leaders and among the Nordic states, from the early nineteenth century onwards. However, the examination of the adjusted silver wages suggests convergence among the Nordic economies by the end of the eighteenth century. Therefore, we argue, no single Nordic Model emerged from these development patterns, even though the Nordic states today do have striking similarities. Furthermore, they diverged from the West European growth path until the twentieth century, thus they were a part of the Little Divergence at Europe’s other peripheries. The world wars and other crises delayed the full impacts of the convergence process until the latter part of the twentieth century.
1. Introduction
The topic of economic converge has inspired numerous scholars over the last 50 years (Abramovitz, Citation1986; Barro, Citation1991; Barro & Sala-i-Martin, Citation1992; Barro, Sala-i-Martin, Blanchard, & Hall, Citation1991; Baumol, Citation1986; Broadberry, Citation1993; Crafts & Toniolo, Citation1996). Most of these studies have emphasised the post-World War II economic growth as exceptional, partially due to convergence patterns in the West and later in Asia. However, they typically have not addressed the Nordic countries directly or their longer run development over centuries. There is a long tradition of Nordic growth studies (Bohlin, Citation2003; Christensen, Hjerppe, Krantz, & Nilsson, Citation1995)Footnote1 that can be used to trace the convergence patterns in these countries, mainly for the last 200 years.Footnote2 However, comparative long term studies on Nordic economic growth are rareFootnote3 (Fellman, Iversen, Sjögren, & Thue, Citation2008; Lindmark & Vikström, Citation2003).
The purpose of our study is twofold. First, we examine whether the Nordic countries converged among themselves during the last 300 years. We trace the long roots of the ‘Nordic Model’ that, according to our study, did not exist in the economic development patterns of the Nordic countries over the last 400 centuries.Footnote4 Second, we analyse whether the Nordic countries converged with or diverged from the fastest growing parts of Western Europe in this time period, i.e. when did they enter the trajectory towards today’s high living standards?
Our study contributes to the literature in two ways. First, it engages the debate on the divergence and convergence of early modern economies. The dispute over the timing and the causes of Europe’s ascendancy to global dominance in the early modern period has become known as the Great Divergence debate (Broadberry, Citation2021; Broadberry & Gupta, Citation2006; Pomeranz, Citation2009;Van Zanden, Citation2009). There is now considerable new scholarship on developments within Europe, which generally tends to highlight an emerging ‘Little Divergence’, i.e. a reversal of fortunes between Mediterranean Europe and Northern Europe between the fifteenth and nineteenth centuries (Allen, Citation2001; Allen, Bassino, Ma, Moll-Murata, & Van Zanden, Citation2011; Álvarez-Nogal, De La Escosura, & Santiago-Caballero, Citation2016; Broadberry & Gupta, Citation2006; De Pleijt & Van Zanden, Citation2016; De Vries, Citation2010; Losa & Zarauz, Citation2021; Rota & Weisdorf, Citation2020; on Eastern Europe, see e.g. Malinowski, Citation2016). This literature has also begun to address the ‘long memory’ of shocks originating from early modern growth trajectories (Fochesato, Citation2018; Rodríguez Caballero & Prados de la Escosura, Citation2020). In this paper, we argue that the Little Divergence is an important research avenue to understand the developments within the regions, especially those that have received less scholarly attention, such as smaller states. In fact, the emerging studies of this phenomenon at another corner of Europe, Portugal, show that the Iberian peninsula was not really behind North-Western Europe in terms of institutions, despite diverging from the growth patterns of countries like Great Britain and the Netherlands (Henriques & Palma, Citation2020; Lains, Citation2002; Palma & Reis, Citation2019).
However, most of these studies of long-run convergence and divergence either do not discuss the Nordic polities or do so in a cursory manner. Typically, Nordic countries are studied because of their historically high modern growth trends, high contemporary living standards, their trends toward equality, similar culture and institutions, the emergence of welfare states, and well-performing educational systems (e.g. Arnesen & Lundahl, Citation2006; Broadberry & Klein, Citation2012; Esping-Andersen, Citation1990; Citation1996; Kettunen, Citation2001; Petersen, Citation2011). However, economic convergence in the long run is at the heart of all of these processes. Therefore, we want to investigate when and how the Nordic states may have converged among themselves and whether they converged to economic leaders during the Little Divergence, the nineteenth century globalisation, and the twentieth century economic expansion after the world wars.
Second, we contribute to the literature on Nordic convergence(e.g. Kokkinen, Jalava, Hjerppe, & Hannikainen, Citation2007; Kryger Larsen, Citation2001; Lindmark & Vikström, Citation2003; O'Rourke & Williamson, Citation1995). There has been some research on Nordic convergence extending back to the nineteenth century. For example, Lindmark and Vikström (Citation2003) analysed the potential convergence between Sweden and Finland in 1870–1990. Ljungberg and Schön (Citation2013) examined sectoral change and foreign trade, as indicators of convergence, among the Nordic states in 1850–1914. While their focus was mostly on explaining structural change and industrialisation patterns, they argued that the different structures of the Nordic economies meant that there was no clear pattern of catch-up or convergence, both among the Nordic countries themselves as well as in relation to the Western European economic leaders (see also Schön, Citation2005). A volume edited by Kryger Larsen (Citation2001) reported converging patterns for Denmark, Finland, and Sweden during the industrialisation period from the mid-nineteenth century up to the Second World War. Many of the analyses of long-run Nordic convergence patterns have focused on shorter periods (for an exception, see e.g. Kryger Larsen, Citation2001; Prado, Lundh, Collin, & Enflo, Citation2021), or have dealt the issue from a business historical perspective (Fellman et al., Citation2008). Krantz (Citation2001) has shown that there were similarities and differences between the growth paths of three of the Nordic countries: Denmark being the long-term leader, Sweden the second, and Finland the latecomer, however, catching up with the other two countries eventually. Thus we combine two different measures to understand the processes of convergence and divergence in the Nordic context: real GDP per capita and wages of unskilled workers. Both datasets, especially when stretched to cover long time period, can be problematic. GDP (per capita) shows, as Bolt, Inklaar, de Jong, and van Zanden (Citation2018, p. 3) indicate ‘an economy’s productive, income-generating capacity’. In the context of longer time periods, the GDP as a measure can be limiting due to the scattered statistical data and various external as well as internal shocks affecting to these measures (Bolt et al., Citation2018). In this article, the most up-to-date real GDP per capita data is used to analyse convergence patterns during the last two centuries.
The wage data, in turn, allows us to analyse a longer (and partially overlapping) time period of potential convergence, as GDP series extending to the early modern era do not exist as of yet for all of the Nordic countries(see Appendix 1 for details and the various sources utilised). The wage data, however, counts by definition only wages; and the data in hand measures only unskilled urban labour wages. This alone is problematic when analysing mainly agrarian societies over an extended period of time, yet it is a problem difficult to overcome without deeper research into Nordic long-run regional wage differences. Thus, we use the currently available data to construct long-run Nordic adjusted silver wages (nominal wage indices converted into grams of 1850 silver) from the eighteenth century onwards to extend our convergence analyses backwards before the nineteenth century.
Combining GDP and wage data in the analytical framework creates yet another challenge, as GDP measures returns for all of the factors of production (at least in theory), whilst wage data used here only the incomes of unkilled labour force. We are well aware of the theoretical and methodological pitfalls of employing such a combination of data. Therefore, we are not aiming to combine these two measures into one, but rather we use them in a complimentary manner to get a better understanding of possible convergence patterns between the Nordic countries.
The extensive Nordic research both on GDP and on wages, moreover, provides tools to overcome the obstacles of obtaining long-run data series on each. The wage data is extensive (see e.g. Abildgren, Citation2017; Grytten, Citation2009; Jörberg, Citation1972; Lundh, Schön, & Svensson, Citation2005; Söderberg, Citation1987), helping us to build a credible long-run data. For the real GDP per capita, we use the data from the Maddison Project Database (version 2013: Bolt & Van Zanden, Citation2014) that gathers data developed by individual researchers and research groups around the world, also by the Nordic scholars.Footnote5 The adjusted silver wages were constructed from several sources in a set of previous studies that are described more in detail in Appendix 1, along with other data solutions and rationale.Footnote6
We use a two-pronged strategy to provide an understanding of the overall trends and to identify convergence periods. In particular, we utilise descriptive analysis to compare the convergence trends in both real GDP per capita and adjusted silver wages. To increase accuracy, we apply two long periods in our analysis. For the UK, we utilise the years 1820–1939; for the USA, we utilise the years 1880–2010. Our more in-depth quantitative analysis employs a time series approach of measuring convergence (Bernard & Durlauf, Citation1995, Citation1996). Convergence, using this approach, is defined as the difference between two time-series (for instance, the difference in GDP per capita for two countries) as being stationary. The approach makes use of unit root tests, whilst checking for potential break points. The methodology behind the econometric procedures can be found in Appendix 2.
We argue, first, that we should not assume that Nordic convergence was a phenomenon that only applied to the nineteenth and twentieth centuries, especially as the more recent literature has suggested that the extant globalisation processes also started before this period. Second, our empirical analyses that focus on the convergence between the Nordic countries themselves and the Nordic countries and the economic leaders show that the Nordic countries did experience an economic catch-up process, first in the late nineteenth century and again in the post-World War II period (on Finland, see also Koponen & Saaritsa, Citation2019). All of the Nordic countries, but especially Finland, diverged from the West European economic development in the eighteenth and nineteenth centuries. The interwar period hindered the catch-up process, as it did with the broader process of globalisation. By the end of the twentieth century, the Nordic countries had fully integrated into the Western economic patterns.
2. Globalisation, convergence, and the Nordic economies
In this section, we will attempt to find evidence of converge patterns for the Nordic countries’ economic performance in the last 300 years in comparison with the leading Western economies. First, we will utilise the real GDP per capita data. A complimentary measure, which does allow us to go further back in time, is adjusted silver wages, defined as a nominal wage index derived from 1850 silver wages. We compare those wages with the Allen (Citation2001) data on European cities, which provide useful regional points of comparisons. Moreover, as the Nordic data are mostly derived from urban centres, as these comparisons with the Allen (Citation2001) data are fairly robust, and emphasise the fact that nation states and borders were less rigid prior to the twentieth century.
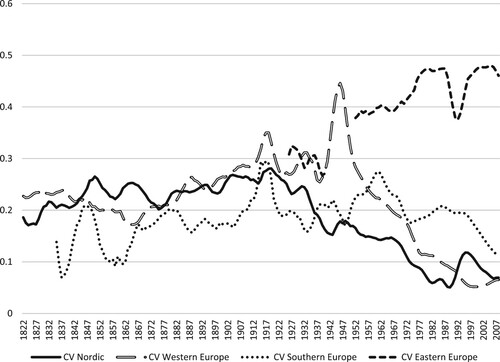
Moreover, we analyse the potential Nordic convergence patterns in comparison with other parts of Europe. Convergence in this analysis refers to beta convergence, involving a country with a lower GDP per capita growing faster than a country with a higher GDP per capita. We will also examine sigma convergence, meaning the decrease of differences in GDP per capita for a group of countries, in our descriptive exercises.Footnote7 In fact, before measuring beta convergence, we start with measuring sigma convergence to get an overall in quality within a group of countries by measuring the coefficient of variation (CV). shows that the development in the Nordic countries was similar to many other parts of Europe until the early twentieth century. However, from around 1918 the Nordic countries began to converge faster than the other regions. Clearly, the trend is similar to Western Europe, although the World Wars delayed this process.
Figure 1. Coefficient of variation in real GDP per capita for the Nordic countries, Western Europe, Southern Europe, and Eastern Europe, 1822–2008 (Five-Year Moving Average). Source: GDP per capita figures from Maddison Project Database (version 2013); See: Bolt and van Zanden (Citation2014). Nordic: Denmark, Finland, Norway and Sweden; Western Europe: Austria, Belgium, France, Germany the Netherlands, Switzerland, Britain, Ireland; Southern Europe: Portugal, Spain, Italy, Greece; Eastern Europe: Albania, Bulgaria, Hungary, Poland, Romania, Bosnia, Croatia, Macedonia, Slovenia, Montenegro, Serbia, Kosovo, Czech republic, Slovakia, Belarus, Estonia, Latvia, Lithuania, Moldova, Russia, Ukraine.
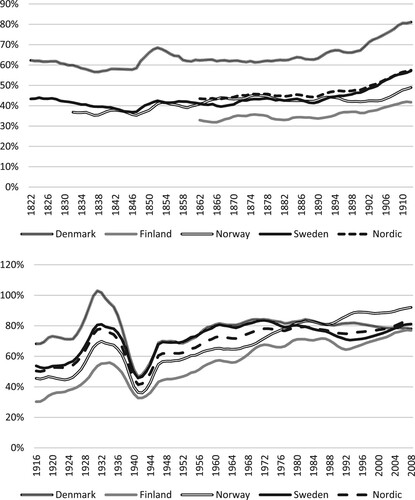
Overall, the Nordic economies have fared better than the world in comparative economic terms over the last 200 years. However, as shows, the picture gets murkier when compared with the leading economy of the nineteenth century (UK) and the leading economy of the twentieth century (USA). Nordic economies started to gradually catch up to the UK from the early twentieth century onwards, reaching parity in the late 1960s and maintaining a dwindling edge until the early twenty-first century. As for the USA, the Nordic economies steadily lost ground in the nineteenth century until the 1920s, when they temporarily gained some, only to lose it again during World War II. In the post-war period, however, they have experienced some catch-up, although never gaining parity.
Figure 2. Nordic GDP per capita as a share of British GDP per Capita, 1822–1910, and US GDP per Capita, 1916–2008 (Five-year Moving Averages). Source: GDP per capita figures from Maddison Project Database (version 2013); See: Bolt and van Zanden (Citation2014). The Nordic GDP per capita is weighted by population, population figures from Bolt et al. (Citation2018).
The limitations of the real GDP data are obvious: the data become scarce toward the early nineteenth century. Even though there are efforts underway in the various Nordic countries to remedy that, it is difficult to obtain real GDP per capita figures for the period prior to 1800, with Sweden being one of the few exceptions, with data going all the way to the beginning of the sixteenth century (Broadberry & Klein, Citation2012; Edvinsson, Citation2013a, Citation2013b; Schön & Krantz, Citation2012; on regional Swedish GDP, see Enflo & Missiaia, Citation2018). Given these problems, we analysed the development of the Danish, Finnish, Norwegian, and Swedish economies in the long-run also via the adjusted silver wages.
Adjusted silver wages are here constructed using (i) a real wage index, and (ii) the 1850 silver wage. These wages therefore represent the 1850 silver value. The main caveat with the data is that the wages and the consumer price indices (CPI) were gathered using different methodologies in different countries; see Appendix 2 for a more detailed overview of the sources.Footnote8 It is therefore important to emphasise that these figures are not true real wages, as this would require that both the nominal wages and CPI were gathered using the same methodology.Footnote9 Despite these caveats, we argue that the adjusted silver wages are an improvement compared to previous analysis such as Allen (Citation2001), which used nominal wages converted into silver (along with real wages based on consumption baskets).Footnote10
shows that the Nordic wages converged with for example London wages substantially in the eighteenth century and then diverged in the nineteenth century. The trends were similar to that in London, although the gap remained substantial until the latter part of the nineteenth century with Denmark and Sweden starting to catch up. In essence, Denmark and Sweden followed a West European development path, whereas Norway and especially Finland lagged behind.Footnote11 Thus, this shows again the diverging pattern especially in the case of Finland. Differences during the ‘long’ nineteenth century might be related to the differences in the timing of industrialisation in these countries (see especially Kryger Larsen, Citation2001 and Krantz, Citation2001), and with the fact that Finland started to lag behind the other Nordic countries in its economic development after being annexed to Russia in 1809 (on the recent discussion, see especially Einonen & Voutilainen, Citation2020). Furthermore, the Nordic convergence during the late eighteenth century might be explained with declining wages in Sweden, Denmark, and lately also in Norway, whereas the wages in Finland did not change as much as in the other Nordic countries. Thus, in the long term Finland is clearly an outlier from the rest of the group, with her adjusted silver wages being constantly between 20 and 30 per cent of the London level, whereas the wages were more volatile in other countries, fluctuating in the case of Denmark from 30 to 70 per cent. This development, however, does not necessarily reveal the whole picture about the diverging or converging economies of these countries, as the adjusted silver wages do not reflect the differences between the real wages in each of these countries, nor do they explain exactly the differences or similarities in terms of GDP.
Figure 3. Nordic adjusted silver wages (in 1850 Silver Price) as a share of London, 1730–1908 (Eleven-year Moving Averages). Source: See Appendix B1: Data sources for wages.
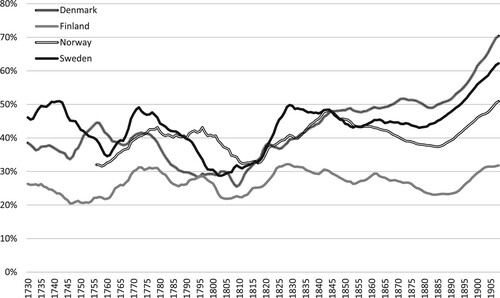
As show, there was no uniform Nordic economic development path for this extended period. For instance, a divergence emerged between Finland and the other Nordic countries that originated in the early eighteenth century, and this gap grew in the nineteenth century. Moreover, Finland’s development was more in line with Eastern European cities like Krakow, in essence putting Finland in a different category prior to the twentieth century. Of course, both Poland and Finland were part of the Russian Empire in the nineteenth century and subjected to similar institutional and economic constraints, so this is not entirely surprising (see also Allen, Citation2001), even though as an autonomous part of Russia Finland kept her old (Swedish) institutions throughout the Russian period (1809–1917). Therefore, from an institutional perspective Finland should be seen as part of Nordic contingent even during the Russian period. However, Finland was not able to further develop its own institutions until the latter part of the nineteenth century, which has been traditionally seen as among the key phenomena that explains Finland’s divergence from the overall Nordic economic development patterns (Einonen & Voutilainen, Citation2020; Hjerppe, Citation1989; Jussila, Citation2004).
3. Globalisation, convergence, and the Nordic economies: a time series analysis
Greasley and Oxley (Citation1997) were among the pioneers of the use of newer time series techniques in analysing historical convergence patterns. Based on real GDP per capita data for 1900–1987, they found evidence of bivariate convergence within Europe, including Sweden and Denmark. Oxley and Greasley (Citation1999) showed that Sweden, Denmark, and Finland formed a convergence club for the period 1900–1987, based on figures from the older Maddison publications and unit-root tests of convergence. They found bivariate convergence between Sweden and Denmark, as well as catching up between Sweden and Finland, thus representing a Nordic Club, with Norway as the outlier. Liew and Ahmad (Citation2009) show that the income gaps of Finland, Norway and Sweden vis-à-vis Denmark had attained a steady state of income equality, and thus finding strong evidence of a Nordic Convergence Club; Johnson and Papageorgiou (Citation2020) provide a comprehensive review of the literature and evidence of convergence over the past 50 years. However, again the data underlying the study was a shorter sample, consisting of Penn World Data for 1950–2000, which is too short to examine e.g. the impact of globalisation waves.
Our descriptive analysis of Section 2 is indicative of trends in convergence and also divergence among the Nordic countries, and also when comparing to Nordic countries to other areas in Europe over an extended period of time. In Section 3.1, we provide in-depth analysis on these patterns by utilising a time series approach of measuring convergence. The analysis examines the adjusted silver wage series and the real GDP per capita figures. The methodology is based on Bernard and Durlauf (Citation1995, Citation1996) and it is detailed in Appendix 2.
3.1. Convergence in real GDP per capita
and present our key findings. First, we tested the real GDP per capita in the Nordic countries relative to the UK (1820–1939) and the USA (1880–2010) for the periods as a whole (). Second, we report the results when the GDP series were subdivided using break dates estimated by the QA test (). For Finland, the period before 1939 was too short for meaningful comparison.Footnote12
Table 1. Testing for GDP convergence using unit root tests.
Table 2. Testing for GDP convergence using unit root tests by subperiod.
shows that, for the first period 1820–1939, measuring convergence relative to the UK, there was evidence of catching-up for all four countries. The results are conditional on the presence of a structural break. Without such a break, none of the Nordic countries exhibited catching-up. For the second period 1880–2010, relative to the USA, there was evidence of catching-up for Finland, Norway, and Sweden, and conditional convergence for Denmark. The results were stronger than for the first period, as these are significant at the one per cent level even if the structural break is not modelled.
In , the date for the turning point varies across the countries, as identified by the QA test. Concentrating on convergence with the UK, we can detect a pattern, i.e. Denmark, Norway, and Sweden were not catching-up in the early decades of the nineteenth century. At the end of the period, all three countries were catching up to the UK. The best evidence, including the results from the other unit root specifications, indicated that Denmark and Sweden started to catch-up from the end of the 1880s. Based on the same evidence, Norway started a decade later.
The results for the USA as the leader country provided interesting contrasts. First, Denmark exhibited a conditional convergence for the entire 1880–2010 period as a whole. The evidence was strongest for the 1880–1939 period. Following 1940, there was a period of catching-up until the mid-1960s. Since then, Denmark started to fall behind the USA. Second, there was evidence for catching-up for the period as a whole for Finland, the evidence being strongest for the immediate post-World War II era. Finland, like Denmark, started to fall behind the USA from the 1960s onwards. Third, Sweden was the only country that did not have a break due to World War II; in fact, the QA test identified 1960 as the break date. The finding is not surprising since Sweden was a neutral country during World War II. Sweden was, therefore, the least affected by the conflict. Like Finland and Denmark, Sweden displayed evidence of catching up with the USA until the 1960s, with a less clear pattern following this date. Fourth, Norway was the only country that exhibited catching up throughout the period. There was no evidence of a lack of catching up following the 1960s as there was for the other Nordic countries. The natural explanation concerns the emerging oil economy from the 1970s onwards that led Norway to a higher growth path than the other OECD countries (Holden, Citation2013).
3.2. Convergence in adjusted silver wages
Adjusted silver wages are here used as an alternative measure of welfare and productivity, mostly in urban settings, which complements the analysis based on the GDP per capita figures. For the wages, we followed the same approach as for real GDP per capita, and the results for the period as a whole are shown in . We can discern four key findings.
Table 3. Testing for wage convergence using unit root tests.
First, Denmark started to catch up with London wages following 1814, which is earlier than indicated by the GDP figures. Second, Norway and Sweden did not show any signs of catching-up with the richer North-Western Europe, thus being part of the Little Divergence. The finding is not a surprise given that the real GDP per capita results of catching-up only indicated it beginning late in the nineteenth century. Third, Finland showed evidence of catching-up for the period as a whole, contrary to the results for the real GDP per capital. These results may reflects luggish, although statistically significant catching-up, or the fact that Finland started from a lower starting point than the other three Nordic countries, and experienced strong growth during the last decades analysed here.Footnote13 Fourth, the measurement of convergence over the entire 1731–1939 period might mask some of the changing dynamics over time, so these results should interpreted with that in mind.
As with the GDP, the period for wages was subdivided based on the break dates identified by the QA test. The findings shown in can be summarised as follows. First, the results for Finland were in line with the prior findings for real GDP per capita: Finland was falling behind London wages until 1818, and it was only after 1917 that Finland started catching up with London wages. This suggest that the late catching up influenced the results for the entire period. The results were consistent with the political developments in Finland. For most of the 1731–1817 period, present-day Finland was divided (and thus also partly ruled) between Russia and Sweden. From 1809 to 1917, Finland was an autonomous part of Russia under the moniker Grand Duchy of Finland, with a fair amount of independence and its own domestic institutions (especially after 1860). It is not surprising that Finland started to catch-up following independence and the Civil War in 1918, given the new political and economic opportunities (see especially Eloranta & Ojala, Citation2018; Hjerppe, Citation1989).
Table 4. Testing for wage convergence using unit root tests by subperiod.
Second, the results for Norway and Sweden were consistent with the results for GDP per capita. There was no evidence of catching-up prior to the 1880s, yet there was clear evidence of catching-up for the real wages following 1880. The only difference is that Norway showed evidence of falling behind in the interwar period. This is not a surprise as the country experienced three major economic crises during this time that may have disproportionately affected development.Footnote14 Third, the results for Denmark were consistent showing: first, catching-up with London occurring before the other Nordic countries and, secondly, that Denmark experienced convergence with the US real GDP per capita in the 1880–1939 period. These results suggest that comparatively speaking Denmark forged ahead of the other Nordic countries and started to catch up to the economic leaders earlier.
4. Conclusions and Further challenges
Our analysis is a part of extant trends to study the Nordic economies in the long run, and the authors, along with other colleagues, are in the process of gathering more data on prices, wages, and ultimately on GDP per capita. Recent studies have analysed wages in number of European towns from a period starting from middle ages until our times, converted the data to comparable (real) wages, and compared the long-term wage series across different countries (Allen, Citation2001; Broadberry & Gupta, Citation2006; Clark, Citation2005; Edvinsson, Jacobson, & Waldenström, Citation2010; Söderberg, Citation2010; van Zanden, Citation1999). This data enabled us to study economic and societal structures for longer periods than the data on GDP.
In summary, our study forms a part of the broader efforts to study the Nordic economies in the long run. We focused on Nordic economic performance from the eighteenth to the twenty-first century, as measured by real GDP per capita and adjusted silver wages, which are clearly different yet complementary measures of productivity. This is a bold methodological approach, which has some data and comparative challenges, that has allowed us to examine, first, possible convergence over time among the Nordic countries and in comparison with other parts of Europe. Moreover, we examined whether they converged toward the economic leaders of the nineteenth and twentieth centuries, namely the UK and USA. Our first steps included analysing the development of real GDP per capita from the early nineteenth century to 2010. Our analysis suggested that there was a catch-up process that surfaced among the Nordic economies themselves and respective of the economic leaders, especially in the decades prior to World War I and then again after World War II. The period 1914–1945 was one of divergence and global crises, and the Nordic countries were not immune to the events, especially the economic damage of the wars and the trade disturbances. The convergence of income levels waned at the end of the twentieth century, as the Nordic countries had already achieved, more or less, parity with the economic leaders in the West.
The real GDP per capital data is limited before the mid-nineteenth century, and it would be risky to assume that divergence was prevalent before the nineteenth century, especially given the new studies suggesting that the first era of globalisation already began in the eighteenth century. Therefore, we examined a different facet of economic convergence, namely the development of the Nordic adjusted silver wages from the eighteenth to the twentieth centuries. The results indicated similar development between the countries until 1800, a significant divergence from the West European ‘path’ in the nineteenth century, and notable stagnation of Finland. Norway’s development was similar, with slower growth in the nineteenth century compared to Sweden. Convergence with various parts of Europe was varied, and there was no clear and sustained convergence with particular parts of the continent. It also appears that Denmark began its convergence to the richer, more developed parts of Europe earlier than the other Nordic states.
Our findings contribute to the large body of literature on the Great Divergence and Little Divergence. Our results reveal that the Nordic countries did not fit neatly into this pattern. To certain extent, they were a part of the Little Divergence from north western Europe. Furthermore, they developed in line with other parts of Europe until the late nineteenth century, which is when a strong catch-up process commenced, albeit temporarily broken up by the world wars and de-globalisation. Furthermore, our findings suggest that one should be careful in generalising results from the adjusted silver wages for entire countries, as certain sectors (like shipping) could thrive amidst a general trend of divergence from growing economies. The Nordic path towards high equality, thriving schools, and extensive welfare states, while accompanied by relatively rapid economic growthFootnote15 occurred in the twentieth century, although the roots of these processes can be traced further back in time. However, the Nordic Model, at least based on economic convergence among these countries, was not readily discernible before the twentieth century.
Our study has only revealed some of the development patterns related to the Nordic countries and convergence in the long run. We have not provided an explanatory framework to resolve the factors that contributed to these countries falling behind the economic leaders in the eighteenth and nineteenth centuries, and then catching up since the late nineteenth century. We would suggest that the potential suspects would have to include institutional factors, resilience during crises, human capital, impacts of and participation in globalisation waves, migration flows, and innovation vis-à-vis key natural resources, and patterns and implications of structural change. However, to investigate that properly quantitatively and qualitatively is a bigger task than we can tackle in this article.
Disclosure statement
No potential conflict of interest was reported by the author(s).
Additional information
Funding
Notes
1 Growth studies have traditionally been among the most popular topics both in the Scandinavian Economic History Review and in Nordic dissertations. See e.g. Ojala, Hemminki, and Nevalainen (Citation2019).
2 The most recent accounts include e.g. Grytten (Citation2004c, Citation2020, Citation2021) on Norway; Lobell, Schön, and Krantz (Citation2008), Edvinsson (Citation2013a, Citation2013b) and Schön and Krantz (Citation2012) on Sweden; Abildgren (Citation2012) and Hansen (Citation1984) on Denmark; and Hjerppe et al. (Citation2006), Kokkinen et al. (Citation2007) and Eloranta and Ojala (Citation2018) on Finland.
3 The Nordic National Accounts Project (1994–2008) published several meeting proceedings during the turn of the millennium for comparative purposes. The access to these volumes is, unfortunately, rather limited. See, for example, Eloranta (Citation1997); Jónsson (Citation2003). The most current Nordic historical national accounts are thus the results of several rounds of iterations and improvements.
4 The Nordic Model, however, has referred originally to labour market policies that, in turn, do have their origins in the overall economic development discourse. See, for example, Kettunen (Citation2001, Citation2013); Hilson (Citation2008); Koivunen, Ojala, and Holmén (Citation2021).
5 The Danish GDP data is of a more prelimary standard than for the other countries. For the latest Maddison Project real GDP data see Bolt and van Zanden (Citation2020) that is resulted in the Bolt et al. (Citation2018) revision. We opted against using the latest versions figures as there are some potential concerns over the data quality. For example, the real GDP per capita in Norway was found to be higher than in the US during the 1914–1918 period, and also 28 per cent higher in 1940. These figures contradict other sources.
6 These previous studies we are relying upon have also more detailed accounts on how data series are compiled; for example, how boarding and lodging is taken into account.
7 The difference between beta and sigma convergence is perhaps best explained in how they are measured. For beta convergence, we measure whether poorer countries have a higher economic growth than rich countries. For sigma convergence, we measure whether the coefficient of variation (standard deviation divided by the mean) changes over time. If the coefficient of variation decreases, it means that the spread around the mean GDP per capita is reduced, meaning we have sigma convergence.
8 The wage data also does not take into account wage inequalities, see for instance Enflo and Rosés (Citation2015) for further discussion.
9 Regardless, the correlation between real wages and real GDP per capita is very high for Sweden (in 1560–1914: 0.94) and Finland (1860–1900: 0.88) in the nineteenth and early twentieth century. For further discussion, see e.g. Allen (Citation2001); Baumol (Citation1986); Crafts (Citation1997); Crafts and Mills (Citation1994); Maddison (Citation2001); van Zanden (Citation1999); Williamson (Citation1999); Özmucur and Pamuk (Citation2002).
10 Allen’s data were also susceptible to the same methodological problems for gathering wage data and had the additional problem of being dependent on silver prices that changed a lot during the 1800s. In addition, taking the CPI into account allows us to control for price differences across countries, which nominal data does not.
11 These results in part contradict Grytten (Citation2021), in which Norway was wealthier than Sweden until around 1905. This contradiction may in part be due to the different way the Maddison project estimated GDP per capita. Moreover, the general trends are similar as Sweden was growing faster than Norway from the late 19th century, as argued by Grytten (Citation2021).
12 The unit root test was not reliable for the period 1920–1939 as the period was too short. The breakpoint identified for Finland was 1919, which is fairly logical, given the turmoil of the Civil War of 1918.
13 In 1731, wages in Finland were only 24 per cent of the level in London, whilst they were 33 and 46 per cent for Denmark and Sweden respectively.
14 See Grytten and Hunnes (Citation2014) for more on financial crises in Norway.
15 Peter Lindert would call this the ‘free lunch puzzle’. See esp. Lindert (Citation2003).
16 The literature on convergence initially applied cross-sectional data to analyse the average growth rate over time (Barro & Sala-i-Martin, Citation1992; Sala-i-Martin, Citation1996a, Citation1996b). The usage of cross-sectional data has criticized as it ignores the time series properties of the data (Quah, Citation1993).
17 See Greasley and Oxley (Citation1997, 2010).
18 These definitions are partly based on Greasley and Oxley (Citation2010).
19 Perron (Citation1989).
20 Zivot and Andrews (Citation1992).
21 Byrne and Perman (Citation2006).
22 The QA test builds on the idea of the Chow test. The Chow Breakpoint test is for a known date, and tests whether the relationship differs in two subsamples, before and after the pre-defined breakpoint. The QA test performs a single Chow test for all possible subsamples, and returns the break date with highest test statistic.
References
- Abildgren, K. (2010). Consumer prices in Denmark 1502–2007. Scandinavian Economic History Review, 58(1), 2–24.
- Abildgren, K. (2012). Business cycles and shocks to financial stability: Empirical evidence from a new set of Danish quarterly national accounts 1948–2010. Scandinavian Economic History Review, 60(1), 50–78.
- Abildgren, K. (2017). Trends in real wages in Denmark since the late middle ages. Historical Methods: A Journal of Quantitative and Interdisciplinary History, 50(2), 67–78.
- Abramovitz, M. (1986). Catching up, forging ahead, and falling behind. The Journal of Economic History, 46(2), 385–406.
- Allen, R. C. (2001). The great divergence in European wages and prices from the middle ages to the First World War. Explorations in Economic History, 38(4), 411–447.
- Allen, R. C., Bassino, J. P., Ma, D., Moll-Murata, C., & Van Zanden, J. L. (2011). Wages, prices, and living standards in China, 1738–1925: In comparison with Europe, Japan, and India. The Economic History Review, 64(S1), 8–38.
- Álvarez-Nogal, C., De La Escosura, L. P., & Santiago-Caballero, C. (2016). Spanish agriculture in the little divergence. European Review of Economic History, 20(4), 452–477.
- Arnesen, A. L., & Lundahl, L. (2006). Still social and democratic? Inclusive education policies in the Nordic welfare states. Scandinavian Journal of Educational Research, 50(3), 285–300.
- Barro, R. J. (1991). Economic growth in a cross section of countries. The Quarterly Journal of Economics, 106(2), 407–443.
- Barro, R. J., & Sala-i-Martin, X. (1992). Convergence. Journal of Political Economy, 100(2), 223–251.
- Barro, R. J., Sala-i-Martin, X., Blanchard, O. J., & Hall, R. E. (1991). Convergence across states and regions. Brookings Papers on Economic Activity, 1991, 107–182.
- Baumol, W. J. (1986). Productivity growth, convergence, and welfare: What the long-run data show. The American Economic Review, 76(5), 1072–1085.
- Bernard, A. B., & Durlauf, S. N. (1995). Convergence in international output. Journal of Applied Econometrics, 10(2), 97–108.
- Bernard, A. B., & Durlauf, S. N. (1996). Interpreting tests of the convergence hypothesis. Journal of Econometrics, 71(1-2), 161–173.
- Bohlin, J. (2003). Swedish historical national accounts: The fifth generation. European Review of Economic History, 7(1), 73–97.
- Bolt, J., Inklaar, R., de Jong, H., & van Zanden, J. L. (2018). Rebasing ‘Maddison’: New incomecomparisons and the shape of long-run economic development. (GGDC Research Memorandum; Vol. GD-174). Groningen: Groningen Growth and Development Center.
- Bolt, J., & van Zanden, J. L. (2014). The Maddison project: Collaborative research on historical national accounts. The Economic History Review, 67(3), 627–651.
- Bolt, J., & van Zanden, J. L. (2020). Maddison style estimates of the evolution of the world economy. A new 2020 update (Maddison-Project Working Paper WP-15).
- Broadberry, S. (2021). The industrial revolution and the great divergence: Recent findings from historical national accounting. In A. Bisin & G. Frederico (Eds.), The handbook of historical economics (pp. 749–771). London: Elsevier/Academic Press.
- Broadberry, S., & Klein, A. (2012). Aggregate and per capita GDP in Europe, 1870–2000: Continental, regional and national data with changing boundaries. Scandinavian Economic History Review, 60(1), 79–107.
- Broadberry, S. N. (1993). Manufacturing and the convergence hypothesis: What the long-run data show. The Journal of Economic History, 53(4), 772–795.
- Broadberry, S. N., & Gupta, B. (2006). The early modern great divergence: Wages, prices and economic development in Europe and Asia, 1500–1800. The Economic History Review, 59(1), 2–31.
- Byrne, J. P., & Perman, R. (2006). Unit roots and structural breaks: A survey of the literature. Glasgow: University of Glasgow, Department of Economics.
- Christensen, J. P., Hjerppe, R., Krantz, O., & Nilsson, C. A. (1995). Nordic historical national accounts since the 1880s. Scandinavian Economic History Review, 43(1), 30–52.
- Clark, G. (2005). The condition of the working class in England, 1209–2004. Journal of Political Economy, 113(6), 1307–1340.
- Crafts, N., & Toniolo, G. (Eds.). (1996). Economic growth in Europe since 1945. Cambridge: Cambridge University Press.
- Crafts, N. F. (1997). The human development index and changes in standards of living: Some historical comparisons. European Review of Economic History, 1(3), 299–322.
- Crafts, N. F., & Mills, T. C. (1994). Trends in real wages in Britain, 1750–1913. Explorations in Economic History, 31(2), 176–194.
- De Pleijt, A. M., & Van Zanden, J. L. (2016). Accounting for the “little divergence”: What drove economic growth in pre-industrial Europe, 1300–1800? European Review of Economic History, 20(4), 387–409.
- De Vries, J. (2010). The limits of globalisation in the early modern world. The Economic History Review, 63(3), 710–733.
- Edvinsson, R. (2013a). New annual estimates of Swedish GDP, 1800–2010. The Economic History Review, 66(4), 1101–1126.
- Edvinsson, R. (2013b). Swedish GDP 1620–1800: Stagnation or growth? Cliometrica, 7(1), 37–60.
- Edvinsson, R., Jacobson, T., & Waldenström, D. (Eds.). (2010). Historical monetary and financial statistics for Sweden: Exchange rates, prices, and wages, 1277–2008. Stockholm: Ekerlidsförlag, Sveriges Riksbank in cooperation with Ekerlids Förlag.
- Einonen, P., & Voutilainen, M. (2020). Suomen sodanjälkeen. 1800-luvun alun yhteiskuntahistoria. In P. Einonen, & M. Voutilainen (Eds.), Suomen sodan jälkeen - 1800-luvun alun yhteiskuntahistoria (pp. 375–380). Tampere: Vastapaino.
- Eloranta, J. (Ed.). (1997). Nordiskahistoriskanationalräkenskaper: The second workshop. Jyväskylä: University of Jyväskylä.
- Eloranta, J. (2019). Cliometric approaches to war. In C. Diebolt & M. Haupert (Eds.), Handbook of cliometrics (pp. 563–586). Frankfurt: Springer International Publishing.
- Eloranta, J., & Ojala, J. (2018). Suomi kansainvälisessä taloudessa 1600–2000. In P. Haapala (Ed.), Suomen rakennehistoria. Näkökulmia muutokseen ja jatkuvuuteen (1400–2000) (pp. 142–169). Tampere: Vastapaino.
- Enflo, K., & Missiaia, A. (2018). Regional GDP estimates for Sweden, 1571–1850. Historical Methods: A Journal of Quantitative and Interdisciplinary History, 51(2), 115–137.
- Enflo, K., & Rosés, J. R. (2015). Coping with regional inequality in Sweden: Structural change, migrations, and policy, 1860–2000. The Economic History Review, 68(1), 191–217.
- Esping-Andersen, G. (1990). The three worlds of welfare capitalism. Princeton: Princeton University Press.
- Esping-Andersen, G. (1996). Welfare states in transition: National adaptations in global economies. London: Sage.
- Fellman, S., Iversen, M., Sjögren, H., & Thue, L. (Eds.). (2008). Creating Nordic capitalism: The business history of a competitive periphery. Basingstoke: Palgrave Macmillan.
- Fochesato, M. (2018). Origins of Europe’s north-south divide: Population changes, real wages and the ‘little divergence’ in early modern Europe. Explorations in Economic History, 70, 91–131.
- Greasley, D., & Oxley, L. (1997). Time-series based tests of the convergence hypothesis: Some positive results. Economics Letters, 56(2), 143–147.
- Greasley, D., & Oxley, L. (2010). Cliometrics and time series econometrics: Some theory and applications. Journal of Economic Surveys, 24(5), 970–1042.
- Grytten, O. H. (2004a). Nominal wages in Norway 1726–1940 by occupation. In Ø. Eitrheim, J. T. Klovl, & J. F. Qvigstad (Eds.), Historical monetary statistics for Norway 1819–2003 (pp. 231–342). Oslo: Norges Bank.
- Grytten, O. H. (2004b). Norwegian wages 1726–2006 classified by industry. In Ø. Eitrheim, J. T. Klovl, & J. F. Qvigstad (Eds.), Historical monetary statistics for Norway 1819–2003 (pp. 343–384). Oslo: Norges Bank.
- Grytten, O. H. (2004c). The gross domestic product for Norway, 1830–2003. Norges Bank: Occasional Papers, 1, 241.
- Grytten, O. H. (2009). Purchasing power of labour: Norwegian real wages, 1726–2006. Scandinavian Economic History Review, 57(1), 48–87.
- Grytten, O. H. (2020). Two centuries of economic growth: Norwegian GDP 1816–2020. (NHH Dept. of Economics Discussion Paper 10).
- Grytten, O. H. (2021). Revising growth history: New estimates of GDP for Norway, 1816–2019. Forthcoming in The Economic History Review.
- Grytten, O. H., & Hunnes, A. (2014). An anatomy of financial crises in Norway, 1830–2010. Financial History Review, 21(1), 25–57.
- Hansen, S. A. (1984). Økonomiskvækst i Danmark: Volume I: 1720-1914 and Volume II: 1914–1983. København: Akademisk Forlag.
- Heikkinen, S. (1997). Labour and the market: Workers, wages and living standards in Finland, 1850–1913. Helsinki: Finnish Society of Sciences and Letters.
- Heikkinen, S., Hjerppe, R., Kaukiainen, Y., Markkanen, E., & Nummela, I. (1987). Förändringar i levnadsstandarden i Finland 1750–1913. In G. Karlsson (Ed.), Levestandarden i Norden 1750–1914 (pp. 67–94). Reykjavik: University of Iceland.
- Henriques, A. C., & Palma, N. (2020). Comparative European institutions and the little divergence, 1385–1800. (CGEH Working Paper Series, Working Paper no. 84).
- Hilson, M. (2008). The Nordic model: Scandinavia since 1945. London: Reaktion.
- Hjerppe, R. (1989). The Finnish economy 1860–1985: Growth and structural change. Helsinki: Bank of Finland.
- Hjerppe, R., Jalava, J., et al. (2006). Economic growth and structural change: A century and half of catching up. In J. Ojala (Ed.), The road to prosperity: An economic history of Finland (pp. 33–63). Helsinki: SKS.
- Holden, S. (2013). Avoiding the resource curse the case Norway. Energy Policy, 63, 870–876.
- Jastram, R. W. (1981). Silver: The restless metal. Hoboken: John Wiley & Sons.
- Johnson, P., & Papageorgiou, C. (2020). What remains of cross-country convergence? Journal of Economic Literature, 58(1), 129–175.
- Jónsson, G. (Ed.). (2003). Nordic Historical national accounts: Proceedings of Workshop VI: Reykjavik 19-20 September 2003. Reykjavik: University of Iceland Press.
- Jörberg, L. (1972). The development of real wages for agricultural workers in Sweden during the 18th and 19th centuries. Economy and History, 15(1), 45–57.
- Jussila, O. (2004). Suomen suuriruhtinaskunta 1809–1917. Helsinki: WSOY.
- Kettunen, P. (2001). The Nordic welfare state in Finland. Scandinavian Journal of History, 26(3), 225–247.
- Kettunen, P. (2013). The ILO as a forum for developing and demonstrating a Nordic model. In S. Kott & J. Droux (Eds.), Globalizing social rights. The international labour organization and beyond (pp. 210–230). Basingstoke: Palgrave Macmillan.
- Khaustova, E., & Sharp, P. (2015). A note on Danish living standards through historical wage series, 1731–1913. Journal of European Economic History, 44(3), 143–172.
- Klovland, J. T. (2004). Historical exchange rate data 1819–2003. In Ø. Eitrheim, J. T. Klovland, & J. F. Qvigstad (Eds.), Historical monetary statistics for Norway 1819–2003 (pp. 289–408). Oslo: Norges Bank.
- Koivunen, A., Ojala, J., & Holmén, J. (2021). Always in crisis, always a solution? The Nordic model as a political and scholarly concept. In A. Koivunen, J. Ojala, & J. Holmén (Eds.), The Nordic economic, social and political model: Challenges in the 21st century (pp. 1–19). Abigdon: Routledge.
- Kokkinen, A., Jalava, J., Hjerppe, R., & Hannikainen, M. (2007). Catching up in Europe: Finland's convergence with Sweden and the EU15. Scandinavian Economic History Review, 55(2), 153–171.
- Koponen, J., & Saaritsa, S. (Eds.). (2019). Nälkämaasta Hyvinvointivaltioon: Suomi kehityksen kiinniottajana. Helsinki: Gaudeamus.
- Krantz, O. (2001). Industrialisation in three Nordic countries: A long-term quantitative view. In H. Kryger Larsen (Ed.), Convergence? Industrialisation of Denmark, Finland and Sweden 1870–1940 (pp. 23–65). Helsinki: The Finnish Society of Sciences and Letters.
- Kryger Larsen, H. (Ed.). (2001). Convergence? Industrialisation of Denmark, Finland and Sweden 1870–1940. Helsinki: The Finnish Society of Sciences and Letters.
- Lains, P. (2002). Southern European econonomic backwardness revisited: The role of open economy forces in Portugal and the Balkans, 1870–1913. Scandinavian Economic History Review, 50(1), 24–43.
- Liew, V. K. S., & Ahmad, Y. (2009). Income convergence: Fresh evidence from the Nordic countries. Applied Economics Letters, 16(12), 1245–1248.
- Lindert, P. H. (2003). Why the welfare state looks like a free lunch (No. w9869). National Bureau of Economic Research.
- Lindmark, M., & Vikström, P. (2003). Growth and structural change in Sweden and a story of convergence Finland, 1870–1990: A story of convergence. Scandinavian Economic History Review, 51(1), 46–74.
- Ljungberg, J., & Schön, L. (2013). Domestic markets and international integration: Paths to industrialisation in the Nordic countries. Scandinavian Economic History Review, 61(2), 101–121.
- Lobell, H., Schön, L., & Krantz, O. (2008). Swedish historical national accounts, 1800–2000: Principles and implications of a new generation. Scandinavian Economic History Review, 56(2), 142–159.
- Losa, E. L., & Zarauz, S. P. (2021). Spanish subsistence wages and the little divergence in Europe, 1500–1800. European Review of Economic History, 25(1), 59–84.
- Lundh, C., Schön, L., & Svensson, L. (2005). Regional wages in industry and labour market integration in Sweden, 1861–1913. Scandinavian Economic History Review, 53(3), 71–84.
- Maddison, A. (2001). The world economy: A millennial perspective. Paris: Development Centre of the OECD.
- Malinowski, M. (2016). Little divergence revisited: Polish weighted real wages in a European perspective, 1500–1800. European Review of Economic History, 20(3), 345–367.
- Nummela, I. (2007). Varallisuus. In P. Haapala & R. Toivo (Eds.), Suomen historian kartasto (pp. 106–107). Tampere: Karttakeskus.
- Nummela, I., & Karonen, P. (1993). Hinnat ja palkat Hämeessä vuosina 1541–1617. Jyväskylä: Jyväskylän yliopisto.
- Ojala, J., Hemminki, T., & Nevalainen, P. (2019). Increase in diversity: Nordic dissertations 2014–2018. Scandinavian Economic History Review, 67(1), 4–11.
- O'Rourke, K. H., & Williamson, J. G. (1995). Open economy forces and late nineteenth century Swedish catch-up. A quantitative accounting. Scandinavian Economic History Review, 43(2), 171–203.
- Oxley, L., & Greasley, D. (1999). A Nordic convergence club? Applied Economics Letters, 6(3), 157–160.
- Özmucur, S., & Pamuk, Ş. (2002). Real wages and standards of living in the Ottoman Empire, 1489–1914. The Journal of Economic History, 62(2), 293–321.
- Palma, N., & Reis, J. (2019). From convergence to divergence: Portuguese economic growth, 1527–1850. The Journal of Economic History, 79(2), 477–506.
- Perron, P. (1989). The great crash, the oil price shock, and the unit root hypothesis. Econometrica: Journal of the Econometric Society, 57, 1361–1401.
- Petersen, K. (2011). National, Nordic and trans-Nordic: Transnational perspectives on the history of the Nordic welfare states. In P. Kettunen (Ed.), Beyond welfare state models: Transnational historical perspectives on social policy (pp. 41–64). Cheltenham: Edward Elgar.
- Pomeranz, K. (2009). The great divergence: China, Europe, and the making of the modern world economy. Princeton: Princeton University Press.
- Prado, S., Lundh, C., Collin, K., & Enflo, K. (2021). Labour and the ‘law of one price’: Regional wage convergence of farm workers in Sweden, 1757–1980. Scandinavian Economic History Review, 69(1), 41–62.
- Quah, D. (1993). Galton's fallacy and tests of the convergence hypothesis. The Scandinavian Journal of Economics, 95, 427–443.
- Rodríguez Caballero, C. V., & Prados de la Escosura, L. (2020, May). Growth, war, and pandemics: Europe in the very long-run. (EHES Working Paper No. 185).
- Rota, M., & Weisdorf, J. (2020). Italy and the little divergence in wages and prices: New data, new results. The Journal of Economic History, 80(4), 931–960.
- Sala-i-Martin, X. X. (1996a). The classical approach to convergence analysis. The Economic Journal, 106(437), 1019–1036.
- Sala-i-Martin, X. X. (1996b). Regional cohesion: Evidence and theories of regional growth and convergence. European Economic Review, 40(6), 1325–1352.
- Schön, L. (2005). Capital supply in Swedish modernisation. In M. Jerneck (Ed.), Different paths to modernity: A Nordic and Spanish perspective (pp. 203–223). Lund: Nordic Academic Press.
- Schön, L., & Krantz, O. (2012). The Swedish economy in the early modern period: Constructing historical national accounts. European Review of Economic History, 16(4), 529–549.
- Söderberg, J. (1987). Real wage trends in urban Europe, 1730–1850: Stockholm in a comparative perspective. Social History, 12(2), 155–176.
- Söderberg, J. (2010). Long-term trends in real wages of labourers. In R. Edvinsson, T. Jacobson, & D. Waldenström (Eds.), Historical monetary and financial statistics for Sweden: Exchange rates, prices, and wages, 1277–2008 (pp. 453–478). Stockholm: Sveriges Riksbank in cooperation with Ekerlids Förlag.
- van Zanden, J. L. (1999). Wages and the standard of living in Europe, 1500–1800. European Review of Economic History, 3(2), 175–197.
- Van Zanden, J. L. (2009). The skill premium and the ‘great divergence’. European Review of Economic History, 13(1), 121–153.
- Williamson, J. G. (1999). Real wages, inequality and globalisation in Latin America before 1940. Revista de Historia Económica / Journal of Iberian and Latin American Economic History, 17(S1), 101–142.
- Zivot, E., & Andrews, D. W. K. (1992). Further evidence on the great crash, the oil-price shock, and the unit-root hypothesis. Journal of Business and Economic Statistics, 10, 251–270.
Appendices
Appendix 1. Summary statistics and data sources
A1: Summary statistics
GDP per capita data
Adjusted silver wages data
B1: Data sources for wages
Denmark
A real wage index did not exist, therefore we constructed one using nominal wages and CPI data from Kim Abildgren (Citation2010, Citation2017).
Nominal wages for Denmark: Nominal wage index for annual earning
Source: Abildgren (Citation2017).
1731–1788: Based on the development in daily wages for workmen in Copenhagen (the figure for 1735 has been interpolated)
1800–1826: Based on the development in daily wages for non-agricultural workers in Odense
1827–1869: Daily wages for male urban workers within manufacturing and construction
1870–1895: Male urban workers within manufacturing and construction
1896–1939: Average earnings within manufacturing etc.
Consumer price index for Denmark
Source: Abildgren (Citation2010).
1712–1800: Laspeyres type index based on individual free market price series from actual transactions for 50 representative commodities divided into 10 consumption groups and budget weights from 1844.
1800–1815: Laspeyres type index based on 60 individual farm-gate price series 1800–1815 for 10 representative commodities divided into 5 consumption groups and budget weights from 1844.
Since 1815: Based on CPI series with a broad coverage of consumer goods and services.
Wage in grams of pure silver per day in 1850 for Denmark
Source: Khaustova and Sharp (Citation2015).
Finland
First, we obtained a real wage index for 1731–1913 that was based on the following sources: Heikkinen (Citation1997); Heikkinen, Hjerppe, Kaukiainen, Markkanen, and Nummela (Citation1987). Second, we used the wage in grams of pure silver per day in 1850 obtained fromNummela and Karonen (Citation1993) and Nummela (Citation2007). These data are a combination of urban and rural wages. Finally, we converted the silver wages into adjusted silver wages in the same way as described above. The data was available for the entire period 1731–1913.
For the growth rate of real wages for the period 1914–1939, we used data from Riitta Hjerppe (Citation1989) ‘The Finnish Economy 1860–1985’ chained these figures with the ones we already have from beforehand. The idea is then to use the manufacturing earnings divided by employment to obtain earning per employee. Next, this figure would then be divided by the cost-of-living to get an estimate for real earnings for 1914–1939.
Norway
For Norway, the main source was the work by Ola Grytten. The real wage index used was originally in 1998 Norwegian kroner and converted to an index with base year 1850. The real wage index covers the average annual earnings. For the daily wage in pure silver in 1850, although the total daily wages across sectors is available from 1850, we chose to use the daily wage of manufacturing (textiles and misc manufacturing) to increase the comparability of with the other countries. An assumption made here is that changes in real wages in manufacturing follows the changes in annual wages in general.
Real wage index for Norway
Source: Grytten (Citation2004b).
From 1726: Wages for mining, manufacturing and crafts
From 1751: Also include wages for the merchant fleet
From 1820: Also include wages for agriculture
From 1830: Also include wages for domestic services
From 1850: Also include wages for communication and construction
From 1875: Also include wages for public services.
Wage in grams of pure silver per day in 1850 for Norway
The daily wage in pure silver in 1850 was estimated by using daily wage for manufacturing and converting it to silver by using the British price and converting it with the exchange rate using the following sources:
Daily wages for manufacturing in 1850 in Norwegian kroner (NOK). Source: Grytten (Citation2004a).
Silver prices, pure silver in grams per British pounds (GBP). Source: Jastram (Citation1981, pp. 164–188).
Exchange rate Norwegian kroner (NOK: GBP). Source: Klovland (Citation2004).
Sweden
Real wage index for Sweden
Source: Söderberg (Citation2010).
1365–1850: Daily wages of unskilled labourers in Stockholm 1365–1850
1850–1939: Daily wages of manufacturing
Wage in grams of pure silver per day in 1850 for Sweden
Source: Söderberg (Citation2010).
UK
Real wage index
Source: Allen (Citation2001) and Bank of England (2017).
The real wage index was constructed using the data from Robert Allen for 1731–1913:
Nominal wages for building labourers in London in pence
Consumer price index for pence for London
The real wage index for 1914–1939 was chained with the Bank of England real wage index from the Bank of England (2017) publication ‘A millennium of macroeconomic data for the UK’.
Wage in grams of pure silver per day in 1850 for the UK
Silver prices, pure silver in grams per British pounds (GBP):
Source: Jastram (Citation1981, pp. Citation164–Citation188).
Appendix 2. Econometric procedures
We are utilising a time series approach of measuring convergence here (Bernard & Durlauf, Citation1995, Citation1996).Footnote16 The underlying idea of convergence is that poorer countries grow faster than richer countries. We define and
as the outputs measured in logarithms for country
and
, respectively. Furthermore, we define
, where
is the Nordic country and
is the leading country. Following Bernard and Durlauf (Citation1995, Citation1996) convergence can be defined as the equality of the long-term forecasts of output, at given information set It,, i.e. they are equalised at a fixed time
as
goes to infinity:
(A1)
(A1) We test for convergence by applying unit root tests.Footnote17 The most commonly used test is the Augmented Dickey-Fuller (ADF), which has the following test equation:
(A2)
(A2) in which
is the parameter to be tested,
is the intercept,
is a linear trend, and
the slope parameter. Lagged terms of
correct for potential autocorrelation in the error term (
The test equation can be used to define the following concepts:Footnote18
Full convergence: the series is stationary,
and
Conditional convergence: the series is stationary,
Catching-up: the series is trend stationary with a positive trend and
Falling behind: the series is trend stationary with a positive trend and
Inconclusive: the series has a unit root and there is no evidence of any of the above. This implies that there is no clear pattern in the income gap over time.
A common challenge of the analysis concerns the presence of structural breaks in data. Typically, breaks are tested for predetermined break dates by applying the Perron break testFootnote19:
(A3)
(A3) where
is a one-time known break dummy with
being the parameter indicating its significance. In this paper, we consider three predetermined (exogenous) break dates, namely the Napoleonic Wars (1803–1815), World War I (1914–1918), and World War II (1939–1945). While the wars often have long lasting consequences for economic development, they are also typically followed by economic recovery, arising from pent-up supply and demand, as well as reconstruction efforts (cf. Eloranta, Citation2019). Obviously, this approach is not perfect, but it is the most plausible.
The approach has been criticised as the definition of a break date may be ad hoc.Footnote20 The Zivot-Andrews (ZA) test, which allows for breaks in the intercept, trend or both, provides an alternative test design:
(A4)
(A4) in which
is an intercept break variable and
is a trend break variable, with
and
indicating their significance, respectively. The breakpoint is estimated by maximising the t-statistic of the intercept or trend, or the F-statistic of both. However, the ZA test does not allow for a structural break in the null hypothesis.Footnote21 The null hypothesis is a unit root with no structural break, whilst the alternative hypothesis is a stationary process with a structural break. To determine the existence of a structural break, even if the process is non-stationary, we conduct the Quandt-Andrews (QA) test for a single unknown breakpoint for each series.Footnote22
In summary, we conduct five unit-root test for each bivariate case: the ADF test, the Perron test, and three different versions of the ZA test. We report the result with the lowest small sample adjusted AIC (AICc). To investigate convergence by sub periods, each time series is subdivided once. The date for subdivision is based on the QA test. If the test fails, we apply a break date obtained from the unit root test with the lowest AICc, provided that it is statistically significant at the five per cent level.