
Abstract
The use of barley (Hordeum vulgare L.) in Morocco is still limited to food and feed despite the amplified demand by local industries for imported malt. This study aims to evaluate 36 barley elite lines for major grain physicochemical parameters and malt quality traits. Analysis of variance, Pearson correlation, principal component analysis (PCA), and hierarchical cluster analysis (HCA) were performed. The results showed significant genotypic variation among genotypes for individual grain and malt traits. High broad sense heritability was obtained for all traits except for plump grain percentage, malt friability, and germination capacity. Starch, malt extract, Kolbach index, grain area, and test weight correlated significantly and negatively with barley protein. Malt extract correlated positively with Kolbach index and starch, but a negative correlation with soluble protein and malt protein was found. Based on 12 characters, 77% of the total genotypic variation was explained by the three first principal components following PCA and four clusters were depicted based on HCA. Genotypes of high interest with desirable levels of quality standards were identified to be used as a malt quality traits donor while designing crossing programs.
Supplemental data for this article is available online at https://doi.org/10.1080/03610470.2021.1978036 .
Introduction
Globally, barley (Hordeum vulgare L.) is ranked as the fourth largest cereal crop in terms of production after maize, rice, and wheat. It is also known as the ‘climate change crop’ and considered as the crop of choice amongst farmers due to its wide adaptability to abiotic stress, low labor inputs requirement, and yield stability.[Citation1,Citation2] Barley is grown on more than 48.8 million hectares (average 2010 to 2018) with an average production per year of 140.1 million tonnes (FAOSTAT 2020). Barley grain is used principally for animal feed (60–70%) and malt production (30–40%), while about 5% and 2–4% goes for seed use and direct food use, respectively.[Citation3]
The continuous rise in the annual requirement of barley for the malting industry has given this crop the status of an industrial crop.[Citation4] The malt industry consumes approximately 22 million tonnes per year of malt. This malt is further used in beer production (about 50%), distillation (20-25%), energy drinks and baby foods (20–25%), and medicinal syrups and vinegar (5%).[Citation2,Citation3, Citation5]
Among the four commercial grass species, barley is the most preferred for malt, because of its high starch to protein ratio and because its husk protects the coleoptile during the germination process and helps in the filtration of wort. Furthermore, the firm texture of grains and its amylase activity makes it unique among cereals in terms of malt yield and brewing quality. The malting process involves soaking the barley grains in water (steeping), allowing the grains to germinate (germination), and then a drying stage (kilning).[Citation6] During this process the cell walls and much of the stored proteins are digested, transforming the tough barley grain into readily friable malt. At the same time, the germination process allows for the synthesis and the mobilization of several amylolytic enzymes that break down the cell walls and some of the protein and that convert the grain starch into fermentable sugars during the brewing process.[Citation7]
In industrial applications, malting quality is an important factor in determining the quality of the manufactured products,[Citation8] and varieties suitable for malting attract premium prices.[Citation9] Therefore, breeding barley varieties with higher malting quality for processing is an important goal. Nevertheless, varietal selection of malting barley is complex because of the wide range of desired quality requirements in addition to the various positive and negative correlations between quality traits as well as between these traits and agronomic characteristics.[Citation5,Citation10]
Despite the decline in barley production over the past three decades, worldwide beer production from barley has shown steady growth reflecting the rising use of barley in malting.[Citation3] The industrial use of barley in malting and brewing is also becoming popular in developing countries such as in West Asia and North Africa (WANA), due to the increased demand for both alcoholic and non-alcoholic drinks and other malt-based products. The International Center for Agricultural Research in the Dry Areas (ICARDA) holds the CGIAR consortium global mandate for barley breeding and serves the non-tropical dry areas. The increased demand for malting barley in the region can be considered an opportunity for creating new sources of additional income for local farmers offering premium prices for better grain quality.
The need for developing high yielding barley genotypes suitable for the WANA region to meet growing demand has pushed ICARDA to initiate breeding programs targeting malting barley for different countries. In past years, its barley breeding program in Morocco has given high priority to food and feed with limited investment in barley breeding for malt production, due to scarce interest in the country and the limited number of breweries. Until 1985, farmers had small contracts with brewing companies to produce barley for malting.[Citation11] With growing urbanization and changing lifestyles, demand for malt products has increased in the last two decades. Beer represents 42% of alcoholic beverages consumed per capita in Morocco[Citation12] with an increasing annual production from 49,400 to 149.649 tons from 1990 to 2014 (FAOSTAT, 2020). Nowadays there are no malting barley varieties registered in the country and the cultivated ones are not meeting the minimum standards for various grain and malt traits for classification as malting grade barley. Local breweries therefore rely completely on imported malt for beer production. The development of high-yielding malt barley cultivars has thus become a necessity to meet the industrial demand for malt in the country.
Providing malting varieties to boost the production of malt in the country will also provide an increased income to the farmers that usually grow barley. ICARDA germplasm has been used for malting in several countries such as Ethiopia, India, Lebanon, and Turkey. This study aimed to assess the malting quality of ICARDA elite lines derived from barley yield trials performed in Morocco to select the best genotypes to be used as donors in malt breeding programs and delivered to farmers across Morocco and North Africa.
Experimental
Plant material
A total of 36 two-row winter barley genotypes were derived from the ICARDA winter barley breeding program (). The genotypes were sown in an α-lattice design with two replications and three genotypes ‘Tarm92’, ‘Larende’ and ‘Ince04’ planted as a check. The material was assessed under rainfed conditions at the experimental station of the National Institute of Agronomic Research (INRA) located in Annoceur, on the edge of the Middle Atlas in Morocco (33.667 N 4.850 W) during the 2017-18 crop season. This station is located at 1350 m asl (above sea level) and is characterized by a hot summer Mediterranean climate, accordingly to Köppen classification with rocky limestone clay soil. The long-term average rainfall is 500 mm. The minimum temperature is −7° C and the maximum temperature is 40° C. Local agronomical practices were followed. The genotypes were harvested, and grain samples were evaluated for grain physicochemical parameters and malting quality traits at the ICARDA Quality Laboratory in Morocco.
Grain physicochemical parameters
Thousand-kernel weight (TKW; g) and hectoliter weight (HW; Kg hl−1) were measured. Different grain fractions were sorted and classified based on their plumpness using the Sortimat (M/s Pfeuffer GmbH, Germany). According to Analytica-EBC (2003),[Citation13] the percentage of grains from two different fractions, plump (ranging from 2.8 mm to >2.5 mm) and thin (<2.2 mm) was used as a first criteria for germplasm selection. Grain physical characteristics including the grain area (mm2), perimeter (mm), grain length (mm) and width (mm) were obtained through analyzed images using Grainscan software.[Citation14] The images of random samples (250–400 grains) were scanned using a flatbed scanner (CanoScan LiDE 220; Canon) as described by Kehel et al.[Citation15] Barley moisture, grain protein content (BP), and starch content (Starch) were determined by near-infrared spectroscopy (NIR, Infratec 1241, Foss).
Micromalting
Barley grain samples (100 g of plump grain) of each genotype were malted through an automatic micro-malting system (M/s Phoenix Systems®, Australia) following a 16 h steeping, 76 h germination, and 30-32 h kilning cycle. Germination capacity (GC) was calculated after the first 72 h of barley grain incubation. After the malting process, roots and shoots of the dry germinated grains were removed manually. The malt obtained from each genotype was stored at room temperature in plastic interlocking envelopes.
Malt quality analysis
Malt protein, soluble protein, malt extract content and malt friability
Malt protein (MP), soluble protein (SP) and the malt extract (ME) content of the different samples were determined by NIR (NIR, Infratec 1241, Foss). Results were recorded and expressed on a dry matter basis. The Kolbach index (KI) was calculated from the formula (% SP/% MP) x 100. The physical quality of malt was measured by the friability of malted grains (MF) using a Friabilimeter device according to the official method.[Citation13] The Friabilimeter crushes the malted grain between a rubber roller and a metal sieve. The friability is measured as the percentage of the powdered malt able to pass through the sieve.
The β-glucan, α-amylase, and free amino nitrogen content
Sample preparation was performed for both barley grain and malted barley following the protocol described by EBC (1987): 100 mg of the whole grain flour samples were mixed in a Pyrex test tube with 9.9 ml of distilled water and with 100 μl of Termamyl α-amylase. Subsequently, the mixture was vortexed and incubated in boiling water for 1 h. Afterwards, the tubes were removed and placed in cold tap water and cooled to room temperature (5 to 10 min). Then, 10 ml of sulphuric acid (0.075 mol.litre−1) was added to the tube and it was vortexed again. After incubation in boiling water for 10 min, the samples were again cooled to room temperature for 10 min. The samples were centrifuged at 3000 rpm for 10 min and filtered through Whatman filters.
Mixed linkage (1 → 3, 1 → 4)-β-D-glucan or commonly known as β-glucan (BG) was measured in malt (MBG) and barley grain (BBG) samples using the Megazyme (Megazyme Ireland Ltd.) assay kit following the automated procedure.[Citation16] α-Amylase (AAL) and free amino nitrogen (FAN) content of the malted grains were determined using the automated procedures SKALAR METHODS (2013)[Citation17] and SKALAR METHODS (2005),[Citation18] respectively.
Statistical analysis
Data were analyzed using analysis of variance (ANOVA) (α = 0.05). Pearson correlation coefficients were calculated between significant variables measured in this study and the results were plotted using the corrplot package[Citation19] in R version 3.6.2.[Citation20] The best linear unbiased estimations (BLUEs) of the genotypes were obtained by considering the genotypes as fixed effects, block and replication were considered as random effects. The principal component analysis (PCA) was conducted to determine the traits explaining the greater shared variation and to determine different groups of genotypes associated with major quality traits. To assess the level of similarity between the genotypes tested and to understand the relationships between them, a hierarchical cluster analysis (HCA) was performed based on recorded traits using Ward’s method by calculating the Euclidean distance. Both PCA and HCA were performed using the BLUEs and the data was scaled before the analysis. The plots were constructed using ggplot2 package[Citation21] in R. Heatmap correlation (genotypes versus variables) was performed on scaled data using pheatmap package version 1.0.12 implemented in R software.[Citation22]
Results
Grain quality analysis
A total of seven grain physical traits were recorded to determine seeds density, weight, and size and shape i.e., hectoliter weight, thousand kernel weight, percentage of plump grain, and seed area, length, width, and perimeter (). represents the results of the summary statistics, least significant difference at 0.05 (LSD), coefficient of variation (CV%), ANOVA expressed in mean square and the broad sense heritability of different grain physical parameters. A large variation in grain physical parameters was found within the genotypes studied. HW showed the highest CV followed by the percent of plump grain and TKW. On the other hand, seed size and shape traits showed the lowest values of CV%. The ANOVA revealed significant variation (p < 0.01) among genotypes for HW, seed length, and seed perimeter, and a highly significant variation (p < 0.0001) for TKW, seed area, and seed width.
Table 1. Summary statistics, analysis of variance, least significant difference, coefficient of variation and broad-sense heritability for grains characteristics of different barley genotypes.
Hectoliter weight values ranged from 28.80 to 41.50 Kg.hl−1 with an average of 34.59 Kg.hl−1. TKW was found in the range of 40.64-55.30 g with an average of 47.35 g. Thirty-three genotypes showed a TKW higher than 45 g, with genotype YT-14 showing the highest value; while it was less than 45 g for genotypes YT-02, YT-03, and YT-01. The percentage of plump grain ranged from 71.6% to 98.6% with a mean of 89.88%. Out of 36 genotypes, 17 were found to have desirable values (>90%) for plump. The range of seed size traits varied between 18.05 to 22.85 mm2, 6.94 to 8.23 mm, 3.30 to 3.74 mm, and from 22.13 to 25.84 mm for the seed area, length, seed width, and perimeter, respectively.
Summary statistics, LSD, CV%, ANOVA and broad-sense heritability of chemical characteristics of grain samples are shown in . Total protein content showed the highest CV% followed by germination capacity and starch content. Analysis of variance revealed a significant variation (p < 0.01) for grain protein and (p < 0.05) starch content. The BP had a heritability of 0.68, which is relatively higher compared to the heritability (0.54) of starch content and (0.16) germination capacity. The range of GC (at 72 h) varied from 73.44% to 100% with an average of 94.31%. A desirable range of values (>95%) for GC indicates good seed viability and a good germination process. BP varied from 8.08% to 13.53% with a mean of 10.66%. Desirable values (9-11%) of BP were obtained in 30 genotypes. The average of starch content was 55.01% with a maximum of 57.33% and a minimum of 52.56%. Out of 36 tested genotypes, 22 were in the desirable range of values (55-65%) for starch content.
Malt quality analysis
Malt quality parameters of 36 lines are summarized in . Descriptive statistics, LSD, CV%, and ANOVA expressed as the mean square of malt traits are provided in . Analysis of variance revealed a significant variation (p < 0.05) for ME and (p < 0.01) for SP, MP, and KI. Whereas no significant variation was observed between genotypes for MF. The KI and SP had similar heritability of 0.72 and 0.71, which is relatively higher than the heritability of other malt traits such as MP (0.67) and ME (0.57), while MF had the lowest heritability (0.30) (). MF ranged from 66% to 97.8% with a mean of 87.13%. Desirable MF (>80%) values were obtained in all genotypes except for 3 genotypes YT-02, YT-06, and YT-27, respectively. ME values ranged from a minimum of 78.90 to a maximum of 84.70%. Furthermore, desirable values (>80%) of ME were obtained in all genotypes except YT-03. A wide range of variation was observed between barley genotypes for MP, SP, and KI. The SP ranged from 4% to 5.70% and the MP content from 9.3% to 12.8%. Overall, most of the genotypes fell in the desirable range of values for SP (<5%) and MP (9.5%- 12.5%) compared to the EBC standards. The KI values ranged from 37.27 to 49.46%, with a mean of 43.43%. The KI values of >45% were obtained in 9 genotypes, furthermore, 24 genotypes were in the range of 41-45%. Values of 35-41% were obtained in 3 genotypes (YT-06, YT-24 and YT-29).
Table 2. Descriptive statistics, least significant difference at 5%, coefficient of variation, analysis of variance and broad-sense heritability of malt quality traits of different malted genotypes.
After a first screening based on grain physical parameters (TKW, TW, and plump %) and malt traits such as MF, MP, SP, ME, and KI, the best 20 genotypes were shortlisted. Afterwards, selected entries were subsequently tested for further malting quality traits such as malt and grain β-glucan, α-amylase, and FAN content. Grain physicochemical characteristics and malt quality parameters of the 20 selected lines are provided in . The results of descriptive statistics and analysis of variance are shown in . Grain β-glucan content ranged from 1.41% to 2.23% with a mean of 2.03%. In general, all genotypes could be selected for malting based on their grain β-glucan content, which met the desirable range values (<4%). The content of malt β-glucan decreased from the initial level after the malting process and ranged from 0.73% to 0.8%. The results of the FAN content indicated a mean of 174.4 (mg N/l) and a range of 149.3 − 211.8 (mg N/l) . FAN values of (>180 mg N/l) were obtained in 6 genotypes, namely YT-30, YT-04, YT-08, YT-05, YT-15 and the check Turkish malt barley cultivar Larende. Malt β-glucan showed the highest CV% (42.75%) followed by FAN (8.64%) and barley β-glucan (7.46%), while no significant variation amongst selected genotypes was obtained for these traits. The analysis of variance showed a highly significant (p < 0.001) variation between malted genotypes for α-amylase content. The AAL values varied from 96.42 to 212.78 (U/g) indicating a wide range among genotypes for this trait. The check cultivars, Larende and Ince04, showed the highest and the lowest AAL content, respectively. In addition to Larende, only 2 genotypes (YT-05 and YT-25) showed desirable values (> 150 U/g) of α-amylase content.
Table 3. Correlation and the contribution (%) of studied traits to the first three principal components of the principal component analysis.
Correlation between grain physicochemical parameters and malt quality traits
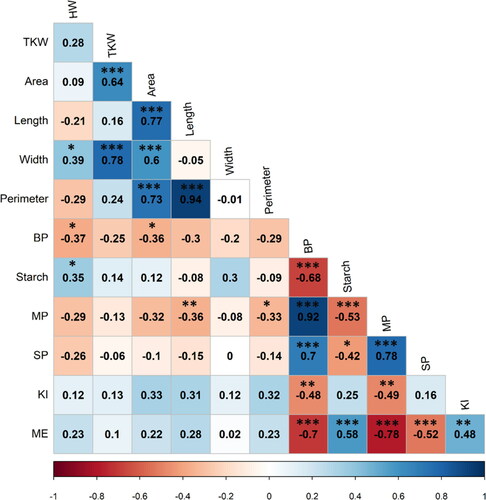
The Pearson correlations between significant traits that affect malting quality are shown in . Correlation analysis among grain physical parameters revealed seven significant positive correlations. HW was correlated with Width, TKW was highly correlated with Area, and Width. Furthermore, Area was highly correlated with Length, Width, and Perimeter. The association between grain physical and chemical parameters revealed that BP was negatively correlated with HW, Area, and Perimeter. Whereas starch showed a significant positive correlation with HW. Furthermore, Starch had a relatively high negative correlation with BP. Among malt traits, MP was positively correlated with SP, while negatively correlated with ME and KI. Moreover, ME was correlated negatively with SP and positively with KI. The association between grain physicochemical parameters and malt traits revealed that MP was negatively correlated with Perimeter, Length, and Starch, while positively correlated with BP. Similarly, SP showed a positive correlation with BP and a negative correlation with Starch. ME was correlated positively with Starch and negatively with BP. Moreover, KI showed a significant negative correlation with BP.
Figure 1. Pearson correlations coefficient among measured traits. Positive correlations are displayed in blue and negative correlations in red. The intensity of the color and the size of the circles are proportional to the correlation coefficients. The color legend shows the correlation coefficients and the corresponding colors. Thousand kernel weight (TKW), hectoliter weight (HW). Percentage of plump grains (Plump). Seed area (Area), Seed length (Length). Seed width (Width). Seed perimeter (Perimeter). Barley protein (BP). Starch content (Starch). Malt extract (ME). Malt protein (MP). Soluble proteins (SP). Kolbach index (KI). *significant at p < 0.05, ** significant at p < 0.01, *** significant at p < 0.001.
Multivariate analysis
Principal component analysis
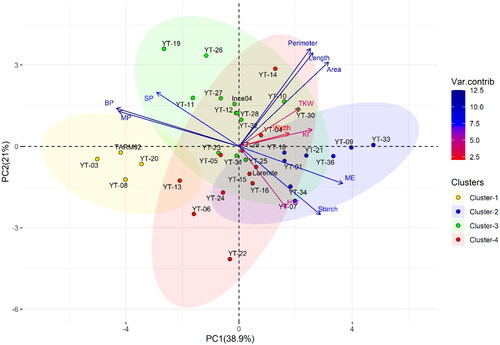
The principal component analysis (PCA) based on the significant grain physicochemical parameters and malt traits showed that the first three-axes of the PCA explained 38.9%, 21%, and 17.2% of the genotypic variation, respectively. The correlation and the contribution (in percentage) of each trait to the first three principal components are provided in . The first principal component (PC1) was positively correlated with Grain Area, ME, Starch to a lesser extent to Grain Length, Grain Perimeter and KI. At the same time, PC1 was largely and negatively influenced by BP, MP, and SP. The second principal component (PC2) was positively and highly associated with Grain Perimeter, Grain Length, and Grain Area, while negatively correlated with Starch content. The third principal component (PC3) was positively and highly associated with Grain Width, TKW and HW. Biplot of PCA () showed that the evaluated genotypes can be grouped into four clusters. PC1 showed clear variability contributed from BP, MP, SP, ME, Starch, and Grain Size parameters. Cluster 1 was characterized by genotypes with a high barley protein and malt protein, which was negatively correlated with cluster 2, which reflects the dominance of ME, Starch, HW and KI. The PC2 showed clear differences among genotypes from cluster3 and cluster4 based on SP, Grain Perimeter, Length, Area, TKW and HW.
Figure 2. Biplot of the first two dimensions (PC1 and PC2) of the principal component analysis (PCA) for the 36 genotypes based on their significant physicochemical and malt traits. The clusters were obtained by the hierarchical cluster analysis using Ward’s method by calculating the Euclidean distance. Variables contribution to explained variation (Var.contrib). Hectoliter weight (HW), thousand kernel weight (TKW), seed area (Area), seed length (Length), seed width (Width), seed perimeter (Perimeter), barley protein (BP), grain starch content (Starch), malt protein (MP), soluble protein (SP), malt extract (ME), Kolbach index (KI).
Hierarchical cluster analysis
The result of the PCA was verified by an agglomerative hierarchical clustering using Ward’s method based on Euclidian distance. It shows the presence of four distinct clusters comprising the same cultivars that are at par with the PCA biplot. The clustering dendrogram coupled cross information of 36 genotypes is given in . The mean, minimum, maximum, and standard deviation values of each trait in each of the four clusters are presented in . The first cluster grouped four barley genotypes; this group of genotypes showed high values of BP, MP and SP, and low values of HW, TKW, grain size parameters, starch, and ME. The second cluster was represented by 8 genotypes with high ME, KI, Starch, HW and low values of BP and MP. The third cluster combined 13 genotypes including the check Ince04. Genotypes falling in this group showed high values of SP, Perimeter, Length, and grain Area. The fourth cluster grouped 11 genotypes with optimum values of most of the traits and low KI and grain area compared to the other clusters. Furthermore, genotypes sharing similar pedigree were also grouped in the same cluster. The sister lines (YT-09, YT-07) and (YT-33, YT-34) were grouped in cluster 2. The third cluster grouped the sister lines (YT-10, YT-11), (YT-30, YT-31), and (YT-27, YT-28). Out of 13 genotypes, 5 genotypes (YT-26, YT-31, YT-30, YT-27, and YT-28) share the cross (24569/5/F2//Radical/Karat/3/Radical/4/Xemus) in their selection history. This cross was also shared by 4 genotypes in group 4 (YT-06, YT-29, YT-16 and YT-05).
Figure 3. Dendrogram of 36 barley genotypes based on twelve grain and malt quality parameters. Pedigree information of each genotype plotted on the left vertical axis.
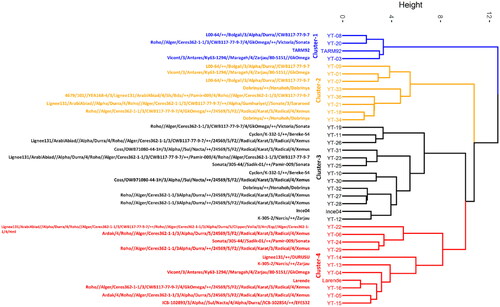
Table 4. Mean value, minimum, maximum, and standard deviation of grain physicochemical and malt quality traits in the four clusters of 36 barley genotypes.
Selection of the best malting genotypes
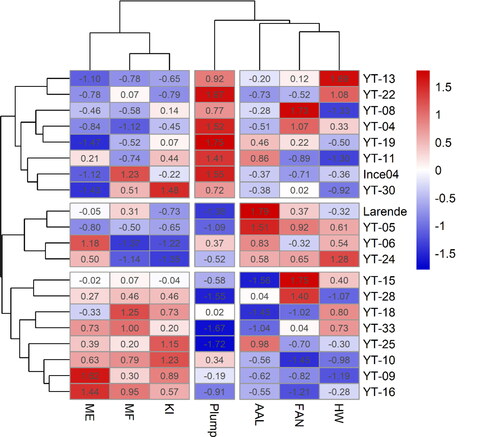
Hierarchical clustering and Heatmap of grain physicochemical characteristics and malt quality traits in the 20 selected genotypes were performed on scaled data. The clustering of individuals was done based on seven variables using Euclidean distance, while clustering of variables was done based on the Pearson correlation between them. The hierarchical clustering and Heatmap () show three distinct clusters for entries based on two physical parameters and five malt traits. The first main cluster contained 8 genotypes, which were characterized by a higher percentage of plump grain and lower ME values than the other clusters. The second cluster grouped 4 genotypes including the best control Larende. Genotypes belonging to this group showed higher AAL, FAN and moderately lower values of KI. The third cluster contained 8 genotypes characterized by high values of ME, MF, KI, and low values for Plump and AAL compared to the first and second clusters. The heat maps showed the potential of genotypes with high or low values for individual traits. Regarding variables, three distinct clusters were identified with MF, ME, and KI clustering in one group. AAL, FAN, and HW clustered in a second group and Plump Grain in a third group.
Figure 4. Heatmap and hierarchical clustering for physicochemical and malt quality traits in the 20 selected genotypes. Genotype names on the vertical axis. Variables names on the horizontal axis. Hectoliter weight (HW), percentage of plump grain (Plump), malt friability (MF), malt extract (ME), Kolbach index (KI), free amino nitrogen (FAN), α-amylase (AAL). Bright blue indicates lowest values while bright red indicates highest values for each trait.
A weighted score was given to each selected genotype based on important parameters for the malt industry including HW, Plump %, MF, ME, KI, FAN (AAL was also included) () as per Kumar et al.[Citation23] in order to select performant genotypes that could be useful sources for barley improvement for the malt segment. Based on the weighted score of the seven parameters, 21 was the highest possible score. Out of the 20 selected lines, only the genotype YT-05 (19/21) exceeded the best check Larende (17/21). Furthermore, the genotypes YT-04 and YT-30 were similar to the best control despite having a higher HW and a lesser AAL than the best check Larende. These 3 genotypes fulfilled all quality parameter standards.
Table 5. Weighted score for selected genotypes based on seven quality traits as described by Kumar et al.[23] (free amino nitrogen and alpha-amylase included).
Discussion
The worldwide demand for malting barley is rising to meet industrial requirement for malting purposes.[Citation24] Barley production requires breeding programs to provide varieties combining efficient production characteristics and quality attributes suited to barley end uses.[Citation25] This study aimed to assess the malting quality of elite lines derived from the ICARDA winter barley breeding program and to select suitable lines for malting that could be delivered to ICARDA’s NARS partners. Malting quality is a complex phenotype genetically determined by a large number of interrelated components, which are expressed prior to and during the malting process. In this regard, 36 genotypes were tested for important grain quality traits before malting and for malt quality traits after malting. Twenty genotypes were shortlisted based on important grain and malt parameters and were analyzed for further malt traits (BBG, MBG, AAL and FAN).
Grain and malt quality analysis
Results showed significant differences in both grain characteristics and malt quality parameters among the tested genotypes. Grain weight and size are crucial components that affect barley yield and malt quality,[Citation26] mainly specified by three dimensions (length, width, and thickness) and the degree of filling.[Citation27] Improving grain weight and size are important breeding goals for barley malting quality, thus breeders target high yielding genotypes with improved grain quality attributes such as plump and uniform grains, TKW, and HW. Two-rowed malting barley grains normally have a TKW ranging from 32 g to 44 g, while six-rowed barleys usually have values of around 30 g.[Citation28] Large, plump, and uniform kernels are desired because they enable homogenous water uptake and modification. This study provides valuable information about the range of grain physicochemical parameters in the ICARDA winter barley program and the correlations existing between these traits. All grain size and weight traits had a broad-sense heritability over 50%, except for the percent of plump grain (38%), indicating that the phenotypic variance on grain size and weight in barley is mainly dominated by genetic effects. Fang et al.[Citation26] reported similar ranges for TKW and grain size parameters (area, width, length, and perimeter) and higher heritability. Significant variation was found for all size and weight traits tested except for the percent of plump grain. Most of the tested lines fulfilled the standard values for TKW (>45 g), and percent of plump grain (>90%).
Barley for malting requires a low protein content and a high starch content to maximize the potential for an extracted yield.[Citation29] Generally, higher protein content is associated with shriveled grains due to the negative relationship between grain protein and starch content. Genotypes in the desirable range (9-12%) of protein and starch (>50%) were observed. Barley with high protein (>13%) gave poor endosperm modification and a reduced level of malt extract, while a low protein content (<9.5%) can compromise the enzyme levels[Citation30] necessary to modify the barley endosperm, to break down the starch, and to ensure good yeast amino acid nutrition during the brewing process.[Citation5, Citation25]
Germination is probably the most important quality requirement for malting. Barley grain must have the ability to germinate rapidly and synchronously to produce a homogeneous malt product. The failure of barley grain to germinate at an acceptable level (>95%) will directly affect the enzymatic activity, as well as cell-wall breakdown in the endosperm, and protein solubilization[Citation25] and thus can cause problems during the malting process, which can negatively impact the brewing performance.[Citation25, Citation31,Citation32]
Malt quality traits including MP, SP, ME, and KI were found to be significant except for MF, which showed a lower heritability (30%). The phenotypic variation between tested genotypes for MP, SP, KI, and ME was mainly determined by the genetic effects as indicated by the medium to high broad sense heritabilities of 67%, 71%, 72%, and 57%, respectively. MF measures the modification of starchy endosperm during the malting process. ME is one of the key parameters for the selection of good quality malt,[Citation4] and it is considered a complex trait and is influenced by environmental factors, with several genetic and biochemical components affecting the final level. This includes row type, husk thickness, grain size, protein, starch, non-starch polysaccharides, and enzyme production, in addition to the effect of the malting process.[Citation25] Out of 36 genotypes, over 90% of genotypes fulfilled the value of the standards (>80%) for ME and only three lines were not in the desired range for MF (>80%).
The protein content in malted grains decreased slightly after malting compared to the unmalted grains, while increasing in some of the lines. Fox et al.,[Citation33] reported that the variation of protein content after malting is related to the initial content of barley protein, the method of malting, and it is highly dependent upon the proteinase activity during the malting process. The increase of protein after malting could be related to the release of more soluble free amino acids. However, the difference is somewhat minor after malting, despite the internal changes from barley to malt.[Citation32] The SP, derived from grain protein, produces various amino acids and small molecular peptides following degradation. The SP ratio to the total malt protein is known as the Kolbach index. This represents the degree of protein modification during malting and mashing, as the greater the hydrolysis of proteins during malting, the more nitrogenous compounds will be soluble.[Citation4, Citation26] Most of the tested genotypes fulfilled the standards values for MP (9.5-12.5%), SP (<5%) and KI (41-45%). Values of KI below 35% are indicative of insufficient malt disintegration and reduced enzyme activity, resulting in a lower ME, protein turbidity, and wort filtration difficulties. Values of 41-45% indicate very good modification and values above 48% indicate excessive disintegration, which compromises the normal proportion of protein components and can result in accelerated yeast aging and a thin beer taste.[Citation26] The KI of elite malt should therefore be controlled between 41 and 48%.[Citation33]
Out of 36 genotypes, 20 were selected and analyzed for further malt quality traits. The α-amylase activity varied considerably among the selected genotypes, whereas no significant variation was obtained for FAN, BBG and MBG. Most of the selected elite lines were in desirable average values of α-amylase activity (> 150 U/g). Amylolytic enzymes are a crucial component of malting barley due to their important role in good quality malt. Four starch degrading enzymes (α-amylase, β-amylase, limit dextrinase, and α-glucosidase) are identified as active during germination and mashing.[Citation25] The diastatic power of malt represents the collective activity of these enzymes.
A low β-glucan content is desired for the brewing and malting industries.[Citation34] In the tested genotypes, the β-glucan content was found to be similar within all genotypes for both barley and malt samples. Its content in grain samples was very low (<3%) in all tested lines and decreased significantly after the malting process (within 58-69%) resulting in malt with low values of β-glucan (<1%). Several studies have reported a significant decrease of β-glucan content (70-80%) in malted grain compared to the initial level.[Citation35–37] The decrease of β-glucan after malting suggests that the enzymatic activity during germination results in more reduction in β-glucan content. In brewing and malting, a high β-glucan content is a causative agent of high wort viscosity, low filterability, and low malt extracts.[Citation28]
FAN is a measure of the available nitrogen compounds, predominately free amino acids that are assimilated or metabolized by yeast during fermentation.[Citation30, Citation38,Citation39] The desirable malting range (140-180 mg/L) for FAN was obtained in all of the twenty selected lines. The final FAN in the extract is related to the initial nitrogen and starch content in the grain and both enzyme production during malting and carbohydrates/soluble nitrogen after endosperm modification.[Citation39,Citation40] It has been noted that higher nitrogen barley produced a lower yield of malt extract, released higher levels of soluble protein, FAN, and peptides in the extract.[Citation38, Citation40]
Association between grain and malt quality parameters
Pearson correlation coefficient among significant measured traits was used to understand the existing correlation between studied grain and malt traits, high values of HW and TKW were obtained from genotypes having a high seed width, high percentage of plump grains, high starch, and low BP. As expected, HW showed a significant positive correlation with starch and a negative correlation with BP. Also, HW and TKW were positively correlated with grain width. Grain area was negatively correlated with BP, while grain length and grain perimeter were negatively correlated with MP. It has been shown that variation in grain size has a direct impact on components whiting the kernel such as starch, non-starch polysaccharides such as β-glucan, and proteins.[Citation32] Fox et al.[Citation25] and Izydorczyk and Edney[Citation30] reported that plump grain has increased starch and lower protein levels resulting in greater malt extract potential.[Citation25, Citation30]
SP was found to be correlated positively with BP, MP, KI, and negatively with starch content and ME, whereas KI was correlated positively with ME and negatively with MP and BP. Similar correlations have been reported in earlier studies.[Citation9, Citation41–43] Moreover, ME was negatively correlated with BP, MP, and SP, while positively correlated with starch. Similar findings have been reported in earlier studies.[Citation5, Citation36, Citation44] Correlations between ME and BP were also reported by Qi et al.[Citation45] and Mohammadi et al.[Citation46] Mather et al.[Citation47] noted that grain proteins were responsible for enzymes degrading malt starch including α-amylase and β-amylase.
Multivariate analysis
Principal component analysis (PCA) was used to estimate the contribution of each trait to the total variations between the genotypes and to then identify the major traits accounting for the greater share in the observed variations. Over 70% of the cumulative variation was explained by the first three principal components. Traits of most importance in the first PC were BP, MP, ME, Area, and Starch. The variation explained by the second PC was mostly related to seed perimeter, seed length, seed area and starch content. The variation explained by the third PC was mainly contributed by grain width, TKW and HW. The hierarchical cluster analysis (HCA) classified the 36 genotypes into four major clusters based on 12 significant variables. Obtained results indicated that these methods (PCA and HCA) were efficient in classifying tested genotypes based on similar grain and malt quality attributes. The number of genotypes varied from one cluster to another indicating considerable diversity in germplasm for the studied quality traits. Genotypes belonging to the first and third clusters contained relatively high BP, MP, and SP coupled with low starch, ME, and HW values. Although these two clusters might not be good for malt barley, they can be good for feed barley due to their relatively higher protein content, especially cluster one. The second and the fourth clusters are more suitable for malt barley, particularly cluster four, which grouped genotypes with optimum combinations of grain and malt traits. The clustering approach can also be used to characterize genotypes for different end uses.
Genotypes with good malting quality were spread across identified clusters and genotypes with similar genetic backgrounds were often grouped in the same cluster. Verma and Sarkar[Citation48] studied the genetic diversity for malting quality in 72 barley varieties released in India and identified nine clusters based on malt and grain quality traits.
Identification of the best malting genotypes
Studied traits often showed strong positive and negative correlations with each other and it becomes very difficult to combine all of the desirable traits in one single genotype. The hierarchical clustering and heat maps of the selected 20 genotypes based on only seven traits of interest (protein, β-glucan, and TKW were not included) depicted three distinct clusters for individuals and three groups of variables. The weighted score of the parameters used to build the Heatmap clustering identified 4 genotypes (YT-05, Larende, YT-30, and YT-04) combining important malting quality attributes. The genotype YT-05 showed a higher score (19/21) than the best check Larende (17/21), while YT-30 and YT-04 were similar to the best check. Larende and YT-05 were grouped in the second cluster along with genotypes having high AAL, FAN and HW, whereas YT-30 and YT-04 were clustered in the first cluster with genotypes having higher plump grain compared to other clusters. Genotypes with low ME, MF, KI, and AAL were grouped in the third cluster. The heat map clustering of variables and individuals helped in identifying the genotypes combining desirable traits for malting. Furthermore, the selection of genotypes with desired levels of single or combined traits could be identified more easily with heat map clustering. These selected genotypes can be used as a malt trait donor when designing crosses in a breeding program for the development of superior malting quality varieties.
Conclusions
The present study was conducted to evaluate the malting potential of 36 elite lines derived from the ICARDA yield trials. The study revealed a considerable variation among studied germplasms and the presence of genotypes with desired levels for major grain and malt quality traits. The correlation analysis indicated that the studied traits were significantly intercorrelated, either positively or negatively. The multivariate analysis indicated that most variability was explained mainly by BP, MP, SP, ME, starch, seed area, seed length, seed perimeter, HW, and TKW contributions. This could help breeders focus on these traits for malt barley improvements. Genotypes with similar quality attributes have often been grouped in the same cluster. Considerable genetic diversity in germplasm exists for the studied traits as the number of genotypes varies from one cluster to another. However, the present study provides detailed information about the malting potential of the ICARDA winter barley elite lines. Moreover, the present investigation differentiated genotypes combining levels of quality standards. Three genotypes are of high interest for ICARDA and NARS partners breeding programs for both direct release and/or for use as malt traits donors in crossing programs. It is also noteworthy to mention that the release of malting barley varieties, potentially adapted to the harsh environment of the Middle Atlas, might represent a new source of income for farmers in the area.
Supplemental Material
Download MS Excel (32.8 KB)Disclosure statement
No potential conflict of interest was reported by the authors.
Additional information
Funding
Related Research Data
Literature cited
- Baum, M.; Von Korff, M.; Guo, P.; Lakew, B.; Hamwieh, A.; Lababidi, S.; Udupa, S. M.; Sayed, H.; Choumane, W.; Grando, S.; Ceccarelli, S. Molecular Approaches and Breeding Strategies for Drought Tolerance in Barley\rGenomics-Assisted Crop Improvement. Genom. Appl. Crops 2007, 2, 51–79. DOI: 10.1007/978-1-4020-6297-1_3.
- Newton, A. C.; Flavell, A. J.; George, T. S.; Leat, P.; Mullholland, B.; Ramsay, L.; Revoredo-Giha, C.; Russell, J.; Steffenson, B. J.; Swanston, J. S.; et al. Crops That Feed the World 4. Barley: A Resilient Crop? Strengths and Weaknesses in the Context of Food Security. Food Sec. 2011, 3, 141–178. DOI: 10.1007/s12571-011-0126-3.
- Langridge, P. Economic and Academic Importance of Barley. In The Barley Genome, Springer International Publishing: Cham, Switzerland, 2018; pp. 345–361. DOI: 10.1007/978-3-319-92528-8_1.
- Kumar, D.; Kumar, V.; Verma, R. P. S.; Kharub, A. S.; Sharma, I. Quality Parameter Requirement and Standards for Malt barley-A Review. Agri. Rev. 2013, 34, 313–317. DOI: 10.5958/j.0976-0741.34.4.018.
- Verma, R.; Sarkar, B.; Gupta, R.; Varma, A. Breeding Barley for Malting Quality Improvement in India. Cereal Res. Commun. 2008, 36, 135–145. DOI: 10.1556/CRC.36.2008.1.14.
- MacLeod, L.; Evans, E. Barley: Malting. In Encyclopedia of Food Grains, 2nd ed.; Wrigley, C.W., Corke, H., Seetharaman, K., Faubion, J., Eds.; Elsevier Ltd: UK, 2015. DOI: 10.1016/B978-0-12-394437-5.00153-4.
- Rick, H.; Graham, F. Crop Post-Harvest: Science and Technology, Blackwell Science Ltd: Oxford, UK, 2004.
- Kochevenko, A.; Jiang, Y.; Seiler, C.; Surdonja, K.; Kollers, S.; Reif, J. C.; Korzun, V.; Graner, A. Identification of QTL Hot Spots for Malting Quality in Two Elite Breeding Lines with Distinct Tolerance to Abiotic Stress. BMC Plant Biol. 2018, 18, 106–117. DOI: 10.1186/s12870-018-1323-4.
- Cu, S. T.; March, T. J.; Stewart, S.; Degner, S.; Coventry, S.; Box, A.; Stewart, D.; Skadhauge, B.; Burton, R. A.; Fincher, G. B.; Eglinton, J. Genetic Analysis of Grain and Malt Quality in an Elite Barley Population. Mol. Breeding 2016, 36, 1–16. DOI: 10.1007/s11032-016-0554-z.
- Briggs, D. E. Barley Genetics. In Barley, Springer: Dordrecht, 1978; pp 419–444.
- Saidi, S.; Jilal, A.; Amri, A.; Grando, S.; Ceccarell, S. Amélioration Génétique de L’orge. In La création variétale à l’INRA: Methodologie, acquis et perspectives; Fouad, A. A., Abdalhaq, C., Eds.; INRA. INRA: Rabat, Maroc, 2005; pp. 99–114.
- World Health Organization. Morocco: Alchohol Consumption, Health Consequences, Policies and Interventions, 2018. https://www.who.int/substance_abuse/publications/global_alcohol_report/profiles/mar.pdf?ua=1.
- Analytica-EBC. European Brewery Convention; Fachverlag Hans Carl: Nürnberg, Germany, 2003.
- Whan, A. P.; Smith, A. B.; Cavanagh, C. R.; Ral, J. P. F.; Shaw, L. M.; Howitt, C. A.; Bischof, L. GrainScan: A Low Cost, Fast Method for Grain Size and Colour Measurements. Plant Methods. 2014, 10, 23. DOI: 10.1186/1746-4811-10-23.
- Kehel, Z.; Sanchez-Garcia, M.; El Baouchi, A.; Aberkane, H.; Tsivelikas, A.; Charles, C.; Amri, A. Predictive Characterization for Seed Morphometric Traits for Genebank Accessions Using Genomic Selection. Front. Ecol. Evol. 2020, 8, 32. DOI: 10.3389/fevo.2020.00032.
- SKALAR METHODS. ‘Skalar Methods, Analysis: beta-glucan’, (060616/99305320), 2006; pp. 1–7. doi: Catnr. 349-202 issue 060616/99305320.
- SKALAR METHODS. ‘Skalar Methods, Analysis: alpha-amylase’, (060616/99305320), 2013; pp. 1–8. doi: Catnr. 164-001 issue 060616/99305320.
- SKALAR METHODS. Skalar Methods, Analysis: Free Amino Nitrogen. (060616/99305320), 2005; pp. 1–5. doi: Catnr. 149-203 issue 060616/99305320.
- Wei, T.; Simko, V. ‘R package “corrplot”: Visualization of a Correlation Matrix’, 2021. https://github.com/taiyun/corrplot.
- R Core Team. R: A Language and Environment for Statistical Computing, R Foundation for Statistical Computing: Vienna, Austria, 2019. https://www.r-project.org/.
- Wickham, H. ggplot2: Elegant Graphics for Data Analysis. 2016. Springer-Verlag New York. Available at: https://protect-us.mimecast.com/s/Jks7CVO5NBc211KW7cGB6wL?domain=ggplot2.tidyverse.org” https://ggplot2.tidyverse.org.
- Kolde, R. Package ‘pheatmap’: Pretty Heatmaps. 2018, 1–8.
- Kumar, D.; Verma, R. P. S.; Narwal, S.; Singh, J.; Kumar, V.; Kharub, A. S.; Singh, G. P. Identification of Barley Genotypes with Higher Protein Content Coupled with Bold Grains for Food and Malt Barley Improvement under Sub-Tropical Climates. JWR. 2018, 9, 94–100. DOI: 10.25174/2249-4065/2017/73253.
- Punda, I. Agribusiness Handbook, Barley, Malt, Beer. In FAO Agribusiness, FAO: Rome, Italy, 2009; p. 65. Available at: www.eastagri.org.
- Fox, G. P.; Panozzo, J. F.; Li, C. D.; Lance, R. C. M.; Inkerman, P. A.; Henry, R. J. Molecular Basis of Barley Quality. Aust. J. Agric. Res. 2003, 54, 1081–1101. DOI: 10.1071/AR02237.
- Fang, Y.; Zhang, X.; Xue, D. Genetic Analysis and Molecular Breeding Applications of Malting Quality QTLs in Barley. Front. Genet. 2019, 10, 352. DOI: 10.3389/fgene.2019.00352.
- Zhang, X.; Wang, J.; Huang, J.; Lan, H.; Wang, C.; Yin, C.; Wu, Y.; Tang, H.; Qian, Q.; Li, J.; Zhang, H. Rare Allele of OsPPKL1 Associated with Grain Length Causes Extra-Large Grain and a Significant Yield Increase in Rice. Proc. Natl. Acad. Sci. U S A. 2012, 109, 21534–21539. DOI: 10.1073/pnas.1219776110.
- Briggs, D. E.; Brookes, P. A.; Stevens, R.; Boulton, C. A. Brewing: Science and Practice. Woodhead Publishing Limited: Cambridge UK, 2004.
- Knežević, D.; Pržulj, N.; Zečević, V.; Đukić, N.; Momčilović, V.; Maksimović, D.; Mićanović, D.; Dimitrijević, B. Breeding Strategies for Barley Quality Improvement and Wide Adaptation. Kragujevac J. Sci. 2004, 26, 75–84.
- Izydorczyk, M. S.; Edney, M. Barley: Grain-Quality Characteristics and Management of Quality Requirements. In Cereal Grains: Assessing and Managing Quality, 2nd ed.; Woodhead Publishing: Cambridge, UK, 2017; pp 195–234. DOI: 10.1016/B978-0-08-100719-8.00009-7.
- Swanston, J. S.; Wilhelmson, A.; Ritala, A.; Gibson, B. R. Malting, Brewing and Distilling. In Chapter 8 Barley: Chemistry and Technology, 2nd ed.; Shewry, P. R., Ullrich, S. E., Eds.; Elsevier Inc: UK, 2016; pp 193–222.
- Fox, G.; Lance, R. Developing Barley Crops for Improved Malt Quality. In Achieving Sustainable Cultivation of Barley, Burleigh Dodds Science Publishing: Cambridge UK, 2020; pp 377–404. DOI: 10.19103/AS.2019.0060.20.
- Fox, G. P.; Nguyen, L.; Bowman, J.; Poulsen, D.; Inkerman, A.; Henry, R. J. Relationship between hardness genes and quality in barley (Hordeum vulgare). J. Inst. Brew, 2007, 113, 87–95. DOI: 10.1002/j.2050-0416.2007.tb00261.x.
- Molina-Cano, J. L.; Francesch, M.; Perez-Vendrell, A. M.; Ramo, T.; Voltas, J.; Brufau, J. Genetic and Environmental Variation in Malting and Feed Quality of Barley. J. Cereal Sci. 1997, 25, 37–47. DOI: 10.1006/jcrs.1996.0067.
- Bamforth, C. W.; Martin, H. L. Beta-Glucan and Beta-Glucan Solubilase in Malting and Mashing. J. Inst. Brew. 1981, 87, 365–371. DOI: 10.1002/j.2050-0416.1981.tb04052.x.
- Wang, J.; Zhang, G.; Chen, J.; Wu, F. The Changes of β-Glucan Content and β-Glucanase Activity in Barley before and after Malting and Their Relationships to Malt Qualities. Food Chem. 2004, 86, 223–228. DOI: 10.1016/j.foodchem.2003.08.020.
- Bera, S.; Sabikhi, L.; Singh, A. K. Assessment of Malting Characteristics of Different Indian Barley Cultivars. J. Food Sci. Technol. 2018, 55, 704–711. DOI: 10.1007/s13197-017-2981-1.
- 35. Ojha, P.; Gautam, N.; Subedi, U.; Dhami, N. B. Malting Quality of Seven Genotypes of Barley Grown in Nepal. Food Sci. Nutr. 2020, 8, 4794–4804. DOI: 10.1002/fsn3.1743.
- 36. Stewart, G. G.; Hill, A.; Lekkas, C. Wort FAN - Its Characteristics and Importance during Fermentation. J. Am. Soc. Brew. Chem. 2013, 71, 179–185. DOI: 10.1094/ASBCJ-2013-0921-01.
- 37. Hill, A. E.; Stewart, G. G. Free Amino Nitrogen in Brewing. Fermentation 2019, 5, 22. DOI: 10.3390/fermentation5010022.
- 38. Agu, R. C. Some Relationships between Malted Barleys of Different Nitrogen Levels and and Wort Proprties. J. Inst. Brew. 2003, 109, 106–109. DOI: 10.1002/j.2050-0416.2003.tb00137.x.
- Cai, S.; Yu, G.; Chen, X.; Huang, Y.; Jiang, X.; Zhang, G.; Jin, X. Grain Protein Content Variation and Its Association Analysis in Barley. BMC Plant Biol. 2013, 13, 1–11. DOI: 10.1186/1471-2229-13-35.
- Wang, X.; Zhang, X.; Cai, S.; Ye, L.; Zhou, M.; Chen, Z.; Zhang, G.; Dai, F. Genetic Diversity and QTL Mapping of Thermostability of Limit Dextrinase in Barley. J. Agric. Food Chem. 2015, 63, 3778–3783. DOI: 10.1021/acs.jafc.5b00190.
- Hoyle, A.; Brennan, M.; Pitts, N.; Jackson, G. E.; Hoad, S. Relationship between Specific Weight of Spring Barley and Malt Quality. J. Cereal Sci. 2020, 95, 103006. DOI: 10.1016/j.jcs.2020.103006.
- Sarkar, B.; Verma, R. P. S.; Mishra, B. Association of Important Malting Traits in Barley (Hordeum vulgare). Ind. J. Agri. Sci. 2008, 78, 853–857.
- Qi, J. C.; Chen, J. X.; Wang, J. M.; Wu, F. B.; Cao, L. P.; Zhang, G. P. Protein and Hordein Fraction Content in Barley Seeds as Affected by Sowing Date and Their Relations to Malting Quality. J. Zhejiang Univ. Sci. B. 2005, 6, 1069–1075. DOI: 10.1631/jzus.2005.B1069.
- Mohammadi, M.; Blake, T. K.; Budde, A. D.; Chao, S.; Hayes, P. M.; Horsley, R. D.; Obert, D. E.; Ullrich, S. E.; Smith, K. P. A Genome-Wide Association Study of Malting Quality across Eight U.S. Barley Breeding Programs. Theor. Appl. Genet. 2015, 128, 705–721. DOI: 10.1007/s00122-015-2465-5.
- Mather, D. E.; Tinker, N. A.; LaBerge, D. E.; Edney, M.; Jones, B. L.; Rossnagel, B. G.; Legge, W. G.; Briggs, K. G.; Irvine, R. G.; Falk, D. E.; Kasha, K. J. Regions of the Genome That Affect Grain and Malt Quality in a North American Two-Row Barley Cross. Crop Sci. 1997, 37, 544–554. DOI: 10.2135/cropsci1997.0011183X003700020039x.
- Verma, R. P. S.; Sarkar, B. Diversity for Malting Quality in Barley (Hordeum Vulgare) Varieties Released in India. Ind. J. Agri. Sci. 2010, 80, 493–500.