
Abstract
Beer flavor is primarily impacted by malt kilning and the choice of yeast/hops in the beer recipe. Although barley malt is the material backbone of most beers, variety has until recently been largely overlooked with respect to flavor differences. In this study, 11 malt variety samples from multiple Australian and international (UK, Canada, China) growing regions were infusion mashed (65 °C) at laboratory scale to produce unboiled wort to investigate differences between the flavor profiles observed with sensory assessment and headspace-SPME gas chromatography-mass spectrometry (HS-SPME GC-MS). Sensory evaluation identified wort flavor differences with the control heritage samples, Maris Otter/Schooner, having the highest overall flavor complexity and acceptability. The Chinese malted Chinese/Canadian samples had the lowest overall flavor complexity rankings. Overall, flavor complexity was correlated with KI, malt protein (negative), and β-glucosidase (negative), while sweetness intensity was correlated with limit dextrinase and pH. HS-SPME GC-MS analysis focused only on compounds that were significantly different between varieties (ANOVA, P ≤ 0.05). Overall, 107 compounds were identified with significantly different levels between the varietal worts. The resultant PCA plots (overall, aldehydes, alcohols, esters, organic acids, terpenes, ketones) supported the sensory assessment, with Maris Otter and the Australian samples clustering in different PCA sectors compared to the Chinese malted Canadian/Chinese samples. These findings provide a basis for key compound identifications that influence malt flavor through the brewing process. The results have the potential to assist barley breeders in selecting optimized germplasm for future variety development and can assist maltsters and brewers to consistently target desired flavors for finished beers and potentially whisk(e)y.
Supplemental data for this article is available online at https://doi.org/10.1080/03610470.2022.2041156 .
Introduction
There is no disputing the logic that “a beer drinker drinks as much with his or her eyes as with their mouth.”[Citation1] The serving of beer in a well selected glass[Citation2] also heightens the drinker’s anticipation of beer quality attributes such as flavor, color, clarity, foam, and degree of carbonation, which the brewer carefully designs to meet or exceed that promise. The dispensed beer must also consistently meet or exceed the drinker’s expectations for the style and brand of beer. Beyond these points, beer flavor must fulfil the flavor expectations of the visual cues. Beer flavor results from interactions between the beer and the mouth, primarily the tongue, but also the olfactory system located in the nasal cavity.[Citation3–5]
The process of brewing beer is relatively simple but more complex when considering the subtle and not so subtle ways the brewer has at their disposal to develop beer styles with desirable visual and flavor attributes. Unlike traditional wines, once a brewer has developed a brand and style profile, they must seek to consistently brew to that standard year in, year out. In the case of major brewers, this consistency may extend over multiple breweries, decades, and even countries. Essentially the key stages of the brewing process for flavor development are malting, mashing, boiling, fermentation, maturation, packaging, and storage. Thus, lists of the key impacts on beer flavor are as follows:
Malt variety.[Citation6–11]
Terroir or where the malting barley was grown.[Citation12] A significant component of terroir is likely to be the micronutrient content of the malt with respect to cations such as Zn+, Mg2+ etc., which are known to vary between malts and can impact yeast fermentation behavior.[Citation13,Citation14]
Malthouse design, configuration, and the specifications maltsters target for the brewing customer.[Citation9]
Lipoxygenase impact on flavor and foam stability.[Citation15,Citation16]
Specialty malts.[Citation13,Citation17,Citation18]
Modification[Citation12] and Maillard reaction products.[Citation19–21] Maillard reactions can also be accentuated by Mg2+.[Citation18]
Brewing liquor ionic composition.[Citation13,Citation22]
Wort lipid levels,[Citation23–25] where the 16:0/18:2 fatty acid ratio impacts yeast ester generation.[Citation26–30]
Wort glucose/fructose ratio to maltose has been shown to influence yeast metabolism and the subsequent ester content and flavor of the beer.[Citation31,Citation32]
Wort boiling has the potential to remove volatile wort aroma components such as hop aroma volatiles or dimethyl sulfide.[Citation33,Citation34] De Schutter et al.[Citation35] showed that wort boiling loss was also dependent on the aroma compound involved and the wort pH.
Yeast strain and fermentation temperature regime impact beer flavor.[Citation36,Citation37]
Beer staling potential.[Citation38,Citation39]
Hops, bitterness, and aromatics (including hop glycosides).[Citation40]
Interaction between polyphenols and oral proline rich salivary proteins (astringency).[Citation41]
Of the key beer flavor contributors outlined above, specialty malts, hops (aroma, bittering), and yeast will tend to dominate beer style and flavor. In this, craft brewers have differentiated and built enviable reputations for their brands often based on aggressively flavored beers. However, the world of beer revolves around lager, with estimates being that lagers represent more than 90% of beer sold worldwide.[Citation13] Broadly, this international lager style can be described as light to straw in color, barley malt-based, with/without adjunct use, typically well carbonated (4.5–6.0 g.l−1 CO2) and relatively subtle in the balance of hop, yeast, and malt flavors. Particularly in a warm environment, these lagers are easy to drink, thirst-quenching, and very ‘sessionable.’ It is therefore not surprising that this style has come to dominate the world beer market over the past 150 years.[Citation42] With international lagers, the grist mixes, hopping rates, yeast strains, and fermentation are set and rigidly controlled; as for most brands their typical flavor has to endure across many decades or even longer. With such international lagers, it is likely that subtle differences resulting from variation in malt flavor between varieties and where the barley is grown (terroir) could potentially result in flavor variation for consumers. Terroir of barley may include the regional manifestation of growth temperatures (particularly during grain fill), moisture availability, macronutrient availability (e.g., Zu, Fe, Cu, Mn, Mg, Ca), along with other factors.[Citation13,Citation43–48]
By craft brewer repute, the heritage variety Maris Otter has been accorded ‘legendary’ status as the ‘go to’ malt for desirable flavor in beer. In that sense, the results have been compelling with Maris Otter being the malt of choice for 12 out of 18 (2002 to 2019) outright Champion Beers of Britain at the annual CAMRA sponsored Great British Beer Festival (London, Per. Comm., Robin Appel, Robin Appel Ltd, UK). A comparative flavor study was conducted in 2007/08 comparing Maris Otter beer with that of seven other commercial malts similarly brewed. The brewing protocol used the 1 HL pilot brewery at Brewing Research International (Surrey, UK) using a “best bitter standard ale” recipe to produce beer with 5% alcohol by volume (abv), 24 international bitterness units (IBU) and packaged and pasteurized in 275 mL crowned, brown glass bottles.[Citation49] The Maris Otter beer was described by the taste panel as having a “clean and crisp flavor with biscuit and grain notes, and low astringency with sweet/bitter balance.” Roasted/nutty flavors were also described, with Maris Otter beer being in the group of most liked beers for flavor. A recent study by Morrissy et al.[Citation11] confirmed that the wort flavor and aroma of Maris Otter was different to other malted barley varieties or lines. In contrast, the extensive studies of Bettenhausen et al.,[Citation8,Citation9] described the underlying flavor of many of the current North American malting varieties as relatively mild in flavor, with a distinguishing and austere “corn chip” character. The corn chip descriptor was confirmed by a wide range of craft brewers at the recent ASBC Malt Aroma and Flavor Symposium.[Citation50]
Before embarking on an investigation to understand malt flavor, some potential targets were identified among parameters measured in conventional malt quality assessment, enzymes, and malt flavor GC-MS. Malt modification as measured by KI (protein) has previously been identified as a component of inter-malt flavor differences in relation to Maillard reactions.[Citation12,Citation19–21] By a similar rationale, it would be likely that wort soluble protein and free amino nitrogen (FAN) could be useful in understanding flavor in terms of the amino acid composition of FAN.[Citation51–54] The starch degrading Diastatic Power (DP) enzymes (α-amylase, beta-amylase and limit dextrinase) may also be worth observing, as subtle changes in fermentable sugar may alter yeast flavor active compound production, or the enhanced ‘sweet’ flavor of wort might be related to the levels of DP enzymes.[Citation55] In addition, observing lipoxygenase due to its relationship with beer flavor staling and foam instability,[Citation15] malt glycosides may also be lying latent in malt and wort to also be worthy of attention.[Citation56–58]
The term flavor is frequently used in describing food and beverages, which can be broadly described as a multisensory interaction between aroma, taste, and texture/mouthfeel (tactile) properties of a substance being consumed. Ultimately, any practical, efficient, and cost-effective assessment of malt flavor will be underpinned by compositional analysis, for example, by headspace gas chromatography-mass spectrometry (HS-SPME GC-MS) to identify specific volatile aroma compounds. In this pursuit, Bettenhausen et al.[Citation8,Citation9] have been leading the way with HS-SPME GC-MS analysis of beer and have identified over 138 aroma and non-volatile compounds in beer. Recently, Bettenhausen et al.[Citation59] reported 64 aroma compounds of difference that were strongly associated with cereal aroma, in wort made from 12 North American malt samples, produced by the increasingly popular ASBC Hot Steep Flavor Assessment Method.[Citation60] In addition, there was a total of 23 compounds associated with grassy aroma, and these have associations with potentially undesirable flavor and later beer staling.
It was the objective of this investigation to step towards a more scientific and rational basis for the assessment of pale malt flavor for malting barley breeders, maltsters, and brewers. Acknowledging the impact of wort boiling, hopping, yeast fermentation and bio-transformation, which complicate the flavor impact of malt on the eventual beer. The conundrum was whether to evaluate wort[Citation59] or the final beer[Citation6–12] to discern the influence of malt flavor on beer? In this study we chose wort, because at this stage of the brewing process the flavor components contributed by the malt would not be convoluted by flavor contribution (hopping), loss (boiling), yeast fermentation and bio-transformation. Rather our step-wise investigation was to follow the malt important and differentiating components through the brewing process. The steps beyond wort (boiled wort and beer) were marked for future investigation.
This study evaluated the aroma and flavor characteristics of wort using both direct tasting and HS-SPME GC-MS. The aim was a preliminary attempt to identify differing and functional malt flavor characteristics that retain their importance during beer production from wort to dispense. This followed the success and uptake of the recently adopted “Hot Steep Malt Sensory Evaluation Method”.[Citation60] The malts studied herein comprised a range of Australian, Chinese, and Canadian variety samples that had been commercially malted in either Australia or China. The Maris Otter malt variety sample (UK) was included as a ‘standard’ as it is widely regarded to exhibit desirable flavor characteristics. These relatively diverse malt variety samples were selected to maximize the differences between the malt samples. Since the “Hot Steep Malt Sensory Evaluation Method”[Citation60] has some substantive differences from conventional milling and mashing for wort production, a small scale wort production scheme was adopted from Stewart et al.,[Citation61] following Evans et al.[Citation62] This enabled preliminary identification and quantification of malt quality parameters, enzymes, and volatile compounds that had a material impact on malt aroma and flavor.
Experimental
Chemicals and solutions
Linoleic acid was purchased from Merck (Bayswater, Vic., Australia). All other solvents and reagents were of analytical reagent grade or higher and purchased from Sigma-Aldrich (Castle Hill, NSW, Australia).
Commercial malts
All malts used in the study were standard commercial pale malts (mean moisture, 4.2%, range 3.2-4.8%). The premium Canadian variety samples, AC Metcalfe and CDC Copeland, were grown in Canada and malted in China, while Gan Pi was grown and malted in China. All international malt variety samples were supplied by the Tsingtao Brewery Co. Ltd. (Qingdao, China). These samples are referred to in this paper as Canadian grown/China malted. The Australian grown and commercially malted barley variety samples were supplied by Coopers Malting, Coopers Brewery, Regency Park, South Australia. The varieties malted were Compass, Commander, Planet, Scope, Schooner, Sparticus, and Westminster. The varieties Planet and Westminster were bred in Europe/UK, while the remainder were bred in Australia. The Maris Otter malt variety sample was purchased from Simpsons Malt (Northumberland, UK). The variety origin, where grown, and where malted are provided in for the Australian, Maris Otter, and Chinese malt variety samples.
Table 1. Details of samples used with respect to varietal origin, where grown and malted.
Conventional malt quality and malt enzyme activity analysis
DP enzyme activity (total beta-amylase, α-amylase, and total limit dextrinase) was measured by a small-scale protocol using the Megazyme (Bray, Ireland) Betamyl-3, Ceralpha, and Limit DextriZyme substrates, respectively, with the rapid 8 × 12 micro-well format protocol.[Citation63,Citation64] The β-glucosidase activity was measured according to Kanauchi and Bamforth[Citation65] with the p-nitrophenyl-β-D-glucopyranoside substrate (Megazyme). Lipoxygenase was measured by the oxidative breakdown of linoleic acid in borate-phosphate buffer containing Tween 20, where activity was determined by the rise in absorbance on a spectrophotometer set to 234 nm and temperature controlled to 20 ± 1 °C as specified by the ASBC Methods of Analysis, Malt-16.[Citation66]
Conventional malt quality analyses were measured using the ASBC Methods of Analysis,[Citation66] moisture (Malt 3), malt protein (Malt 8), Congress mash and fine extract (Malt 4), apparent attenuation limit (Wort 5), KI and wort soluble protein (Wort 10), FAN (Wort 12), viscosity (Wort 13), and pH (Wort 8).
Wort production
A modified small-scale mashing method was developed for use in the laboratory to enable a consistent production of wort for tasting and chemical analysis. The method developed was a modification of a published method by Stewart et al.[Citation61] The mashing method consisted of the following: 142.5 g of malt was milled (0.2 mm mesh) and to this, 0.185 g of calcium sulfate in 443 ml of ddH2O was added prior to mashing at 65 °C for 40 min, ramping to 74 °C and holding at this temperature for 10 mins. The hot mash was immediately lautered using Macherey-Nagel ‘wet strength’ filter paper (MN722), and sparged with 75 °C distilled water (approximately 300 mL). Wort density was analyzed, and density was adjusted to a uniform 10°P with ddH2O. Wort samples were taken at the pre-boil stage for chemical and sensory analysis.
Sensory analysis
The sensory profiles of wort samples were compared (using freshly lautered wort, diluted 50% with ddH2O) by an expert tasting panel comprising staff from the Coopers Brewery, (n = 7-8 male and one female, aged between 40 and 60 years, with sensory evaluation experience ranging between 8 and 37 years). The panelists are regularly assessed by the industry on their sensory evaluation skills and routinely conduct in-house sensory evaluations before beer release from the brewery (e.g., 3-5 times per week).
Prior to sensory evaluation, the panel completed a brief induction in wort flavor tasting, during which they were introduced to a list of attributes. Due to the high level of sugars present in the wort, the lautered wort was diluted 50% with water prior to aroma and tasting evaluations. After several initial blind tastings, it was decided that only three descriptors would be selected for evaluation: nutty/biscuit, sweetness intensity, and overall flavor complexity. The first two descriptors are known brewing industry standards and the third is a new term to explain the complex interaction between all of the flavors and aromas detected.
Sensory evaluation comprised a multi-sample ranking test using a balanced incomplete block design (Friedman Analysis),[Citation67] conducted over 6 sessions (held in a temperature and light controlled sensory evaluation room), with five randomly chosen panelists assessing 5 samples (also chosen randomly) per session, such that the 10 wort samples were each assessed 3 times in total. Samples were presented in random order, served at room temperature in 3-digit coded covered 200 mL tasting glasses, with a fresh bracket of samples provided for the ranking of each sensory descriptor, at each session. Panelists were asked to taste the samples in each bracket and to rank them in order of lowest (1) to highest (10) intensity. To mitigate sensory fatigue, panelists were instructed to cleanse their palates with water between samples and between brackets of samples (i.e., evaluation of each sensory descriptor). Ranking data were collected using in-house ballot papers and collated in Excel for statistical analysis.
Semi-quantification of volatile compounds by HS-SPME GC-MS
Volatiles were analyzed in wort and beer samples using HS SPME GC-MS. Briefly, wort samples were diluted 1 in 2 with water to a final volume of 10 mL and 3 g of NaCl was added. A 10 µL aliquot of d13-hexanol, d11-hexanoic acid, d16-octanal, d5-ethyl nonanoate, and d3-linalool was added as an internal standard before the vial was thoroughly mixed by vortexing. The concentration of the internal standards in ethanol was as follows: d13-hexanol 920 µg.L−1; d11-hexanoic acid 930 µg.L−1; d16-octanal 82.1 µg.L−1; d5-ethyl nonanoate 9.2 µg.L−1; and d3-linalool 1.73 µg.L−1. Identified peaks were normalized against the internal standard reflective of their chemistry. Compounds that did not fit within these constraints were quantified against d16-octanal.
HS SPME-GC-MS was performed with an Agilent 7890 A gas chromatograph (Santa Clara, CA) fitted with a Gerstel MPS autosampler (Lasersan Australasia Pty Ltd., Robina, QLD, Australia) and coupled to an Agilent 5975 C mass spectrometer. The autosampler was fitted with a 2 cm, 50/30 µm DVB/CAR/PDMS SPME (23 gauge, 50/30 µm; Supelco, Bellefonte, PA, USA) for volatile extraction. The samples were incubated for 10 min at 50 °C before extraction at 50 °C for 10 min, with agitation at 500 rpm. Analytes were desorbed in the injector at 240 °C for 0.5 min in pulsed splitless at 25 psi, after which the split vent was purged. Separation was achieved on a 60 m J&W DB-Wax UI fused silica capillary column (0.25 mm i.d., 0.25 µm film thickness) using helium carrier gas (BOC gases, ultrahigh purity) at a flow rate of 1.4 mL/min (constant flow). The column temperature was as follows: 40 °C for 5 min, increasing at 2 °C/min to 135 °C, held at this temperature for 0 min, and increasing at 5 °C/min to 212 °C, held at this temperature for 0 min, and increasing at 15 °C/min to 245 °C. The transfer line was held at 240 °C throughout the run. Positive electron impact spectra at 70 eV were recorded in the range m/z 35-350 (4.45 scans/s).
The identity of detected volatile compounds, as determined by comparison of mass spectra with the National Institute of Standards and Technology (NIST) and Wiley mass spectral libraries, is provided in .
Statistics
Chemical data were analyzed by analysis of variance (ANOVA), SPSS 16.0 for Windows (Version 28.0, IBM Cooperation, Armonk, New York, USA). Principal component analysis (PCA) was subsequently performed on chemical data for which statistically significant differences were observed between samples (P ≤ 0.05) using XLSTAT (version 2018.1.1., Addinsoft, New York, USA). Statistical analysis of sensory ranking data was analyzed using multiple pairwise comparisons using Nemenyi’s procedure (two-tailed test) and correlation using non-parametric evaluation. These statistical tests were performed in XLSTAT. Regression analysis between flavor ranking (non-parametric Friedman test) and malt quality/enzyme parameters was achieved by Spearman’s correlation analysis.
Results and discussion
Describing wort flavor and varietal variation
The wort flavors of 11 commercial malt variety samples, () were assessed by the Coopers Brewery tasting panel. The flavor varietal scores are presented in . The tasting panel concluded that resolution of wort flavor complexity was more straightforward when the worts were diluted by 50% with ddH2O as wort sugar sweetness was not as dominating. The comparison of wort flavor ranking (0-10 point scale) showed that there were significant (P < 0.05) flavor differences between the malt samples in terms of overall flavor complexity (flavor intensity), nutty/biscuit (aroma), and sweetness (perceived wort sweetness intensity on palate) ranking. These differences in flavor confirm that variety and/or growing environment, or malthouse can produce discernable differences in malt flavor in wort, in agreement with previous studies.[Citation6–11,Citation59]
Table 2. Malt sample flavor ranks determined multiple pairwise comparisons using Nemenyi’s procedure (two-tailed test).
Maris Otter wort had the highest overall flavor complexity and nutty/biscuit flavor, but a relatively low sweetness intensity ranking (). Anecdotally, the tasters commented that not only was Maris Otter wort the most flavor intense, it also very clearly had the most desirable and pleasing flavor (data not shown). It is thus not surprising that Maris Otter is renowned, among craft brewers, in particular for imparting desirable flavor attributes to the beers brewed using its malt.
An extended malt quality report for each of the 11 malt variety samples assessed, including conventional Congress malt quality parameters and a selection of potentially malt flavor influencing enzyme activities, is shown in . Of the malt evaluated, the expert panel ranked the Australian heritage variety Schooner as the variety recording a wort flavor complexity closest to that of Maris Otter in preliminary trials (Susan Stewart, data not shown). Interestingly, the late Prof David Sparrow (barley breeder) worked with the British Plant Breeding Institute team (PBI 1966, Dr G.D.H. Bell) that bred Maris Otter (Proctor x Pioneer) and was the breeder of Schooner (Prior A x Proctor x CI.3576, Waite Institute, University of Adelaide, 1983). A recent study by Evans et al.[Citation55] that compared 61 Australian and 33 Chinese commercial malts concluded that despite differences in the malting location, malthouse design and protocol; on average, malt variety samples made from Australian barley were very similar in malt quality, as judged from a wide range of malt quality parameters, to the Chinese malts when Australian barley was used for malting in either Australia or China. These results suggest that the impact of commercial malt house design and operation would have a relatively small impact on malt quality, presumably also flavor, assuming a similar degree of modification.
Table 3. Comparison of variety wort (50% dilution) flavor rankings with respect to sample variety, conventional malt parameters, and enzyme activity.
The relationships between wort flavor, (overall complexity, nutty/biscuit, and sweetness intensity) with malt quality parameters were assessed by Spearman’s (non-parametric) regression analysis (). indicates that there was a strong correlation between wort overall complexity and nutty/biscuit flavor ranking (r = 0.998, P < 0.05) but there was not a significant correlation with sweetness intensity. The three Chinese (Canada/Chinese varieties) malted samples had the lowest wort flavor in terms of overall flavor complexity and nutty/biscuit ranking and were in the lower to mid-range of varietal samples for sweetness intensity (). These flavor evaluation-descriptions for the North American/Canadian samples had many similarities with that of Bettenhausen et al.,[Citation8,Citation9] who described the beer flavor as an austere ‘corn chip’ flavor. In contrast, the research team at Tsingtao Brewery (China) concluded that Canadian and Chinese varieties produced beer with higher overall flavor complexity than malt from Australian varieties (Per. Comm., Drs J. Dong and S. Hu).[Citation68] It was also concluded that the wort nutty/biscuit ranking was a substantial component of overall flavor complexity ranking, while sweetness intensity was influenced by somewhat different factors. As such, only wort overall flavor complexity and sweetness intensity ranking were considered for further analysis. The desirability of the strength of the overall flavor complexity of malt wort flavor most likely depends on the brewer’s flavor objectives and how wort flavor was modulated by grist composition (use of adjuncts), wort boiling, fermentation (yeast strain), and beer maturation. Recently Morrissy et al.[Citation11] concluded that hot steep wort flavor was observed to have some influence on eventual beer flavor when genetically different malt samples were used to brew the same style of beer.
Table 4. Correlation matrix derived by the Freidman’s test (Spearman’s correlation coefficient) for flavor rankings (0–10), conventional malt quality parameters, and potentially flavor associated malt enzymes.
Relationship between wort flavor, protein, modification, and variety
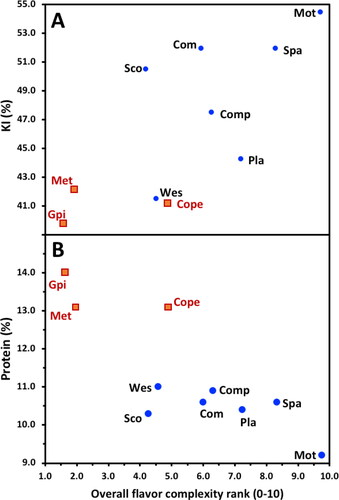
It is well known that there is a relationship between malt flavor and modification.[Citation12] This is not surprising given the importance of Maillard reactions in food flavor in general,[Citation19–21] and brewing in particular with respect to specialty malt and beer staling.[Citation13,Citation17,Citation18,Citation38,Citation39] In agreement with Herb et al.,[Citation12] a significant positive correlation (r = 0.679, P < 0.05) was observed between the overall flavor complexity ranking with malt KI, but surprisingly not for the wort color or FAN malt parameters (, ) typically associated with KI.[Citation55] Interestingly, there was an equivalent inverse correlation between the overall flavor complexity ranking and malt protein content (). The scatter plots for both the KI and protein overall flavor complexity correlations exhibit distinct data point distributions whereby higher overall flavor complexity rankings were linked to higher KI but lower protein content (). That was, the higher protein Canadian/Chinese malt had lower KI but higher protein that was linked with a lower overall flavor complexity ranking. In general, the KI of Maris Otter and the Australian malt variety samples (excluding Westminster) were higher than the Canadian/Chinese malt samples.
Figure 1. Scatterplots between overall flavor complexity ranking and A. malt protein, and B. malt KI.
See for varietal point code. Blue circles: Australian grown and malted; orange squares: China malted.
Relationship between wort overall flavor complexity, hydrolytic enzyme levels, and variety
β-Glucosidase is an enzyme that cleaves latent glycosides into a sugar and a flavor active aglycone component such as linalool and β-damascenone, which are particularly important in beer flavors imparted by hops.[Citation58,Citation69] Reported here for the first time, a correlation between β-glucosidase and overall flavor complexity ranking (r = −0.645, P < 0.05) was observed (). also indicates a clustering of data points that appear to be associated with the barley grown in China/Canada, malted in China, compared with the Australian grown barley samples malted in Australia. The β-glucosidase relationships were surprising as low levels of β-glucosidase appeared to be associated with high overall flavor complexity, while high levels of β-glucosidase appeared to correlate with more lightly flavored wort. The reverse association would be expected according to the hypothesis that an active β-glucosidase would release flavor active compounds. As this was the first study to consider β-glucosidase with respect to wort flavor, these results should be viewed with caution but similarly suggest that further investigation is warranted to validate these findings.
Figure 2. Scatterplots between overall flavor complexity ranking and A. malt β-glucosidase activity and B. malt lipoxygenase activity, and C. sweetness intensity ranking with malt lipoxygenase activity.
See for varietal point code. Blue circles: Australian grown and malted; orange squares: China malted.
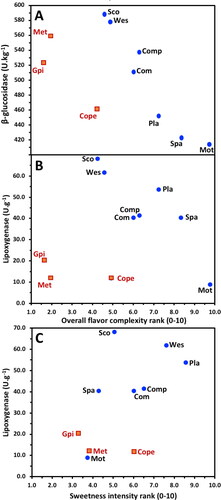
Lipoxygenase is another malt flavor-linked enzyme that has been associated with undesirable beer flavors, staling, and reduced foam stability.[Citation15] In this study of wort, there were no significant correlations between lipoxygenase activity and overall flavor complexity or sweetness intensity rank (). The Australian bred malt variety samples and European malt variety samples (Planet and Westminster) grown/malted in Australia generally clustered differently, with higher overall flavor complexity ranking and lipoxygenase activity, than the Chinese produced malt samples (Chinese or Canadian barley, ). However, the Maris Otter sample was observed to have low lipoxygenase activity but a very high overall flavor complexity ranking. This observation was less obvious for the sweetness intensity ranking () It has been observed that Australian malt samples have higher levels of lipoxygenase since Australian varieties primarily carry a haplotype to express higher levels of lipoxygenase compared to malt from Canadian variety samples.[Citation16] Our results did not identify whether the higher lipoxygenase levels were due to varietal or terroir effects. Perhaps the level of lipoxygenase contributes to Australian malt samples being observed to have higher levels of overall flavor complexity in terms of higher levels of aldehyde derivatives compared to the Chinese produced malt samples ()? Certainly, lipoxygenase is a malt enzyme that deserves ongoing study with respect to wort and fresh beer flavor.
Relationship between wort flavor, DP enzyme levels, and variety
It was expected that there would be an association between the activity of DP enzymes that are integrally linked with wort levels of yeast fermentable sugars (e.g., glucose and maltose), and sweetness intensity but not overall flavor complexity ranking (). However, of the DP enzymes studied, only limit dextrinase (r = 0.784, P < 0.05) was correlated with the sweetness intensity ranking. The other DP enzymes, α-amylase, beta-amylase, and the overall measure of yeast fermentable sugars, and AAL were not significantly correlated (). It was noted that Evans et al.,[Citation55] for whom the malt samples studied here were part of a broader set of commercial malts, observed that the level of malt limit dextrinase in the sample set was approximately double that of several previous studies. The question arises as to the chemical mechanisms to explain the differences in wort sweetness intensity between malt variety samples. On this basis, it could be useful to measure the composition of wort fermentable sugars (maltose, glucose, sucrose, maltotriose, fructose). However, it would be expected that the sweetness intensity characteristics of the wort would not persist into the beer as the majority of fermentable sugars would be sequestered by yeast during fermentation.[Citation70]
Relationship between wort flavor and physiochemical characteristics
Physiochemical relationships were considered with respect to overall flavor complexity and sweetness intensity ranking. No correlations were observed for wort viscosity and color (). Although overall flavor complexity ranking was not correlated to pH, a correlation was observed between sweetness intensity ranking and wort pH (r = 0.619, P < 0.05), despite a relatively narrow pH range of 0.19 units (). Fermentation typically results in a reduction of wort pH by approximately 1.0-1.5 units,[Citation37] to produce a typical range for beer, that is pleasant to humans, of pH 4.1-4.5.[Citation42] The pH of the wort produced in this study had a range of 5.74-5.92 (), so it remains to be determined how this dramatic fermentation pH drop from wort to beer impacts the flavor contribution of components contributed by malt.
Identification of key differentiating wort aroma components by HS-SPME GC-MS
HS-SPME GC-MS analysis identified 107 volatile aroma compounds that differed in concentration between the unboiled worts from Maris Otter, Westminster, Scope, Schooner, Planet, Compass, Commander, AC Metcalfe, and CDC Copeland. These varieties were considered to provide a representative snapshot of the wort characters tasted. Thus, the wort from Spartacus and Gan Pi malt samples were not further analyzed. A similar wort study by Bettenhausen et al.[Citation59] of 12 North American malts observed 64 compounds strongly associated with “cereal” aroma and 23 compounds associated with “grassy” aroma.
Principal Component Analysis (PCA) was performed on compositional data and gave a biplot () that explained 79.8% of variation. Clear separation of malt variety samples was observed along the X axis, with the Canadian grown and malted CDC Copeland and AC Metcalf variety samples positioned on the far right of the biplot (34 individual compounds), while the Australian grown and malted variety samples were distributed in the two left quadrants (73 individual compounds). It was noted that Maris Otter associated spatially most closely with the Australian samples, especially Westminster, Scope, Schooner, and Planet. The wort compounds most spatially associated with the malts from Australian varietal malt samples were a range of alcohols, esters, ketones, aldehydes, terpenes, and carboxylic acids ( and ), whereas a different and more limited set of alcohol, aldehyde, carboxylic acid, ester, furan, organochloride, and ketone compounds were associated with wort made from the Canadian variety malt samples ( and ). It would be from these tables that candidate compounds associated with variability in malt flavor could potentially be found and provide opportunities for targeted quantitative analysis in future studies. Of course, to be valuable for malt quality assessment, these components and their relative levels would need to survive the flavor impacting stages of brewing including wort boiling and fermentation.
Figure 3. PCA biplot of mean relative concentrations of 107 volatile aroma compounds detected in the pre-boiled wort samples derived from different malt variety samples.
• (blue filled circles) Active observations (varieties), • (red filled circles) Active variables (aroma compounds).
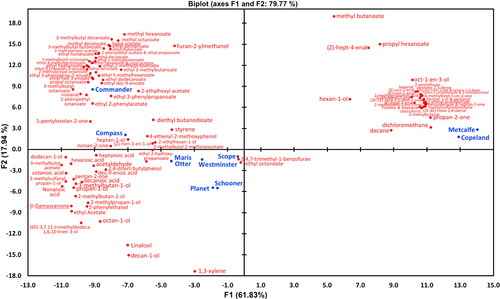
Table 5. Flavor/aroma compounds detected in the wort of Australian malt variety samples, but not detected in Canadian malt variety samples.
Table 6. Flavor/aroma chemical compounds detected in all samples but at considerably higher concentrations in the Australian malt variety samples when compared with Canadian variety malt samples.
Table 7. Flavor/aroma compounds detected in the wort of Canadian malt variety samples but absent in Australian variety malt samples.
Table 8. Flavor/aroma chemical compounds detected in all samples but at considerably higher concentrations in the Canadian malt variety samples when compared with Australian variety malt samples.
Compounds were clustered by PCA based on their chemical nature with groups for alcohols, aldehydes, and esters () and, similarly, quantified using chemically appropriate internal standards, to improve the resolution of the comparison. considered 38 compounds that were quantified with d16-octanal (aldehyde) that showed a very distinct distribution between the Australian and Chinese/Canadian malt samples. Given that a number of aldehyde components such as nonenal and hexanal can be potentially derived from lipoxygenase action, it was surprising that these components were dominant in the Canadian malt variety samples given the higher lipoxygenase levels of the Australian malt samples (, ). and show the PCA distribution of volatile compounds quantified with d13-hexanol (alcohol) and d5-ethyl nonanoate (ester), respectively. The PCA plot in shows 18 alcohol compounds primarily segregating with the Australian malt variety samples compared to the Chinese/Canadian malt samples. In particular, the two Canadian malt samples were co-located almost together and well separated from the Australian grown and malted samples and associated with increased concentrations of pentan-1-ol. The alcohol segregation for malt sample origin was evident but not as distinct as for the aldehydes presented in .
Figure 4. PCA biplot of mean relative concentrations of 38 compounds quantified with d16-octanal, quantifying aldehydes present in volatile headspace and all chemicals that did not share chemical nature with other internal standards. • (blue filled circles) Active observations (varieties), • (red filled circles) Active variables (d16-octanal standard).
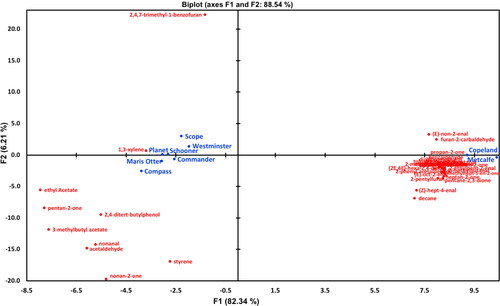
Figure 5. PCA biplot of mean relative concentrations of 18 volatile compounds quantified with d13-hexanol, quantifying all alcohols present in volatile headspace.
• Active observations (varieties), • Active variables (d13-hexanol standard).
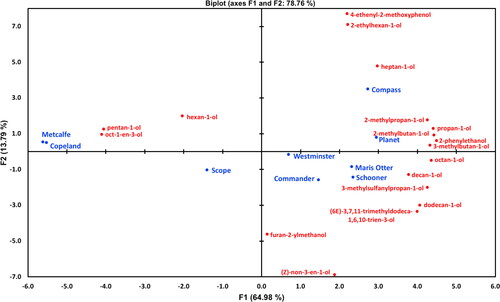
Figure 6. PCA biplot of mean relative concentrations of 42 volatile compounds quantified with d5-ethyl nonanoate quantifying all esters present in volatile headspace.
• (blue filled circles) Active observations (varieties), • (red filled circles) Active variables (d5-ethyl nonanoate).
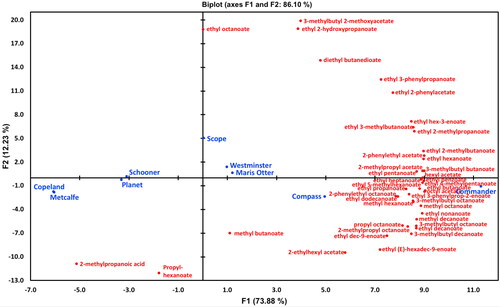
The geographical clustering/origin for varietal wort flavor components for the esters () was not as tight as was observed for aldehydes and alcohols ( and ). However, Commander and Compass segregated most closely with the greatest number of esters (). The PCA plot in considered 42 ester components. The major separation occurred along the X-axis (73.9%), with the discrimination between the Chinese/Canadian malt variety samples being less distinct for the Australian malt samples. However, whilst the Chinese/Canadian malt samples clustered closely together, there was a spread of Australian malt samples across the X-axis suggesting a greater diversity in their ester content. Interestingly, the number of esters present in the Australian samples far outweighed the few esters detected in the Canadian malt samples () and this may be responsible for the increased separation of Australian malt samples. Overall, these evaluations suggest that aldehyde and alcohol content will be more useful to segregate Australian malt sample wort flavor from Chinese/Canadian variety samples than esters in future investigations.
Organic acids present in the wort volatile headspace were quantified with d11-hexanoic acid (). Due to the low number of these compounds present, they have been presented differently to the numerous alcohols, esters, and aldehydes. From the results it was evident that the organic acid profile of the worts differs substantially based on malt sample variety. Wort arising from Australian grown barley has substantially higher concentrations of octanoic acid, n-decanoic acid, 9-decanoic acid, and hexanoic acid than that found in Canadian malt samples (). It was interesting to note that the variety Scope has considerably lower levels of detected wort volatile acids than the other five Australian malt samples.
Figure 7. Comparison of relative quantity of wort aroma compounds using heat maps for compounds relative to d11-hexanoic acid as the internal standard that was utilized to quantify all organic acids present in volatile headspace. A. At the concentration scale between 0.0 and 0.5, and B. at the concentration scale between 0.0 and 7.5. C. Compounds detected and quantified in wort samples with respect to d3-linalool as the internal standard at the concentration scale between 0.0 and 4.5.
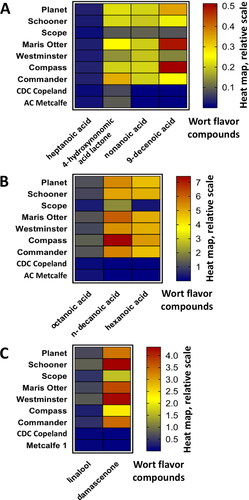
Linalool (terpene) and β-damascenone (C13 norisoprenoid ketone) are flavor compounds of particular interest due to their well-known contribution to the flavor of wines,[Citation71] and late hop aroma in beer.[Citation40,Citation72] shows the concentration of linalool and β-damascenone present in the pre-boil wort volatile headspace. Again, the two Canadian malt variety samples had substantially less linalool and β-damascenone than the Australian derived malt samples. Linalool and β-damascenone have been previously detected in unhopped wort[Citation56,Citation57] but were not significantly different in level between the lines in the study by Morrissy et al.[Citation11] This may be due to the barley line and growing area used not being sufficiently different to enable such an observation. Given that at least 90% of beers consumed in the world are of the international lager style, most beers brewed will require malt that produces beer that is relatively light flavored and sessionable.[Citation13]
The amount of malt contributed linalool and β-damascenone was estimated semi-quantitatively to be approximately 0.3-3 µg.l−1 and 1-15 µg.l−1, respectively, with reference to a d3-linalool standard. According to Peltz and Shellhammer,[Citation72] the published median concentration of linalool in beer was observed at 9 µg.l−1 with a range of 0.14-100 µg.l−1, while β-damascenone in beer was 20 µg.l−1 with a range of 0.02-203 µg.l−1. Obviously much of the linalool and β-damascenone is contributed by the hops. The malt levels of linalool and β-damascenone could potentially contribute to the flavor of international lagers, should these malt wort components be maintained at sufficient levels during the wort boiling and fermentation process.
Overall, the aroma components identified in this investigation were essentially a subset of those previously identified in unhopped wort[Citation11,Citation56,Citation57] and beer.[Citation8,Citation9,Citation11] In comparison to Bettenhausen et al.,[Citation8,Citation9,Citation59] the 107 differential compounds identified in this investigation were primarily a subset of the overall 138 aroma and non-volatile compounds detected.
An obvious question, when considering aroma compounds is the impact of the wort boiling stage of the brewing process. Typically a modern kettle operation with a rolling boil over approximately ±60 min, will result in approximately a 6% reduction in volume that will cause a useful reduction in DMS and other volatile components.[Citation33–35,Citation73] The extent of DMS reduction during boiling will be determined by kettle design, pH, intensity of the boil, and the brewer’s objective. Thus, it is likely that a portion of the aroma compounds that were identified in this investigation would be lost (evaporated) during wort boiling. De Schutter et al.[Citation35] showed that not only was boiling intensity important but also wort pH with respect to the extent of the Maillard reactions that occur during this stage. Further, the potential boiling loss was dependent on the compound with substantial reductions observed for hexanal, DMS, 3-methylbutanol, and phenylacetaldehyde, but little change in β-damascenone and an increase in 2-furfural. Preliminary experiments have indicated that the flavor differences observed in unboiled wort between the Australian and Canadian malt sample worts were still apparent with small-scale rolling-boiled wort with ∼6% evaporation (Susan Stewart, unpublished data).
Brewing beer is not the only use for malted barley where the flavor profile of the malt might subtly influence the beverage produced. In whisk(e)y production, the malt +/- adjunct is mashed, the mash often lautered (not always), but the wort is rarely boiled[Citation74]. It follows that aroma compounds in the wort will more likely be retained and potentially make it into the distillers’ “feints” derived by the distillation process to be combined to make the raw distilled spirit. Of course, the fermentation and barrel aging process could potentially alter or bio-transform such aroma compounds. Wanikawa[Citation75] recently exhaustively reviewed the flavors of whisky, while French[Citation76] and Pomeranz[Citation77] concluded that malt terroir plays a significant role in eventual whisky flavor. It can thus be concluded that malt varietal and terroir differences should be more readily translated into differences in whisky flavor than in beer whose production includes a key wort boiling stage. Such a perspective with respect to whisk(e)y production should be a fertile aspect for further study.
Use of aroma compounds identified for malt variety selection
The primary objective of this study was to identify potential malt derived compounds that could be selected by barley breeders and maltsters to optimize malt flavor in accordance with brewer’s requirements. Broadly it would be expected that the malt flavor requirements for international lager style beers would be relatively low, while for craft beers, malt flavor would trend towards that of the craft-desirable malt variety Maris Otter ( and and and ). Overall, Australian malt variety samples (particularly the heritage variety Schooner) were more similar in overall flavor complexity than the Canadian/Chinese malt samples assessed in this study. Clearly, for routine malt quality flavor testing and malting barley breeding program selection it would be more practical and efficient if the basis was analytical quantification (HS-SPME GC-MS) of a subset of key aroma compounds rather than the cumbersome, human and sample number limited process of taste panel testing. In addition, flavor testing would be focused on wort, such as that from the ASBC Malt Method #4 (Extract) or "Sensory Analysis 14. Hot Steep Malt Sensory Evaluation Method"[Citation60], for reasons of efficiency and cost during malt or variety evaluation. However, we need to be cognizant that wort flavor undergoes substantial changes during wort boiling, fermentation, and the maturation stages of brewing so that following studies will need to sift between the malt derived compounds identified here and other studies to identify those which truly impact beer flavor. [Citation6–11] Although, the craft flavor desirability of Maris Otter produced beer[Citation49] does strongly indicate that at least some varietal flavor factors survive the brewing process into beer.
Broadly, in this investigation, the Australian and Maris Otter malt variety samples were linked to higher overall flavor complexity compared to the Chinese malted Canadian and Chinese samples ( and ). The HS-SPME GC-MS wort analysis identified 28 compounds (), which could be detected in the wort from Australia but not the Canadian malt samples (alcohols, esters, and ketones), while in further 29 compounds were considerably higher in the wort from Australian malt variety samples compared to Canadian/Chinese malt samples (alcohol, aldehyde, carboxylic acid, ester, ketone, and terpene). In comparison, lists 11 compounds that were only detected in the wort from Canadian but not the Australian malt variety samples (alcohols, aldehydes, and ketones), while lists a further 14 compounds that were considerably higher in the wort from Australian malt samples compared to the Canadian/Chinese (aldehydes, carboxylic acids, ester, ketone, furan, and organochloride).
In particular, compounds that were observed to be at relatively low concentration in the Scope sample (high KI, relatively low overall flavor complexity) may indicate particular potential to match the lower KI, low overall flavor complexity of the Chinese/Canadian malt variety samples. These compounds would include β-damascenone, 1-heptan1-ol, decan-1-ol, decanoic acid, and 2-ethylhexan-1-ol (). Future studies will seek to validate the importance of these potential flavor indicator compounds for routine malt evaluation to aid barley variety selection. This subset will be defined and shaped by how these compounds progress through the flavor shaping brewing stages of wort boiling, fermentation, maturation, and the interactions with other beer flavor components. Future investigations should also be designed to consider the impact of barley growing terroir and maltster/malthouse effects on malt flavor potential. Herb et al. [Citation12] concluded that terroir was mostly manifested in modification, however this complex question requires further elucidation that was beyond the scope of this study.
Both β-damascenone and linalool monoterpenoids may be ‘locked’ in latent flavorless precursors, known as glycosides, in both malt and wort that may be released by glycoside cleaving enzymes such as β-glucosidase from yeast. Interestingly, the malts with the highest flavor ranking tended to have the lowest levels of β-glucosidase (). Jin and Rogers[Citation56] saw glycosides as the potential for the enhancement of the sensory quality of beer with later release into the beer, presumably with the assistance of yeast β-glucosidases or the inclusion of exogenous glycoside releasing enzymes.[Citation58,Citation78] Of course in beer, the majority of monoterpenoids are contributed from hop addition during the boiling and “late hopping” stages.
Conclusions
Substantive flavor variation was observed between unboiled and non-hopped worts made from a range of Australian, Canadian/Chinese, and Maris Otter malt variety samples. With taste panel assessment, the Maris Otter and Australian malt variety samples were observed to have higher overall flavor complexity, nutty/biscuit aroma, and sweetness intensity compared to the Chinese malted Chinese and Canadian samples. Interestingly, there was a positive correlation between wort pH and wort sweetness intensity (r = 0.619, P < 0.05). The flavor variation was confirmed by analysis with HS-SPME GC-MS where the Australian and Canadian malt sample worts consistently segregated to generally distinct and discrete clusters in the PCA plots. A range of flavor compounds were detected in the wort produced from the Australian malt samples but were either not detected or were detected at considerably higher concentrations than the wort made from Canadian malt samples. Conversely, there were compounds that were either only detected or were detected at considerably higher concentrations than the wort made from Australian variety malt samples.
Conventional measures of malt quality and malt enzymes show promise in potentially defining the flavor characteristics of beer. As highlighted by Herb et al.,[Citation12] protein modification as measured by KI (positive, r = 0.679) but also malt protein (negative, r = −0.618), were very useful malt quality factors by which to consider overall flavor complexity. The activity of the malt enzymes, β-glucosidase (r = 0.645) and possibly lipoxygenase also appeared to influence wort overall flavor complexity and sweetness intensity by correlation or potentially by varietal association. Finally, as would perhaps be expected, there was a positive correlation between wort sweetness intensity ranking and limit dextrinase (r = 0.784), but not for α-amylase, beta-amylase nor AAL.
Taken together the flavor compounds and malt quality parameters reported here may have potential to identify key malt derived flavor components that can be selected for or against to potentially modulate and modulate malt flavor in beer or indeed whisk(e)y, by extension. This perspective will need to be validated in future investigations that will follow these compounds through the beer making process (wort boiling, fermentation, maturation) and assess their capability to be differentiated in beer tasting. It is anticipated that this research will focus on determining what proportion of the variation in malt flavor/quality can be attributed to varietal genetics, and what can be related to terroir or malting practices. With the observation of clear flavor differences between diverse malts, such information could potentially be used by barley breeders, malt analysts, and brewers to target the potential malt flavor produced by malted varieties.
Supplemental Material
Download MS Word (39.8 KB)Acknowledgements
The authors gratefully acknowledge the Grains Research Development Corporation (GRDC), Coopers Brewery Ltd, and Viterra Ltd, for funding this project. Katherine Allder for technical assistance; Prof Pat Hayes, Prof Tom Shellhammer, and Lance Lusk. Robin Appel for access to the 2008 Maris Otter flavor trial and other information regarding the flavor of Maris Otter. We also thank the School of Natural Sciences, University of Tasmania, and the School of Agriculture, Food and Wine, University of Adelaide for the facilities that enabled this study to be completed.
Disclosure statement
No potential conflict of interest was reported by the authors.
Additional information
Funding
Literature cited
- Bamforth, C. W. Bringing Matters to a Head: The Status of Research on Beer Foam. Euro. Brew. Conv. Monograph “XXVII (Amsterdam)” 1999, 10–23.
- Delvaux, F.; Deams, V.; Vanmachelen, H.; Neven, H.; Derdelinckx, G. Retention of Beer Flavours by the Choice of Appropriate Glass. In Proc. 25th Eur. Brew. Conv. Congr. Brussels, pp 533–542. 1995.
- Clark, R.; Linforth, R.; Bealin-Kelly, F.; Hort, J. Effects of Ethanol, Carbonation and Hop Acids on Volatile Delivery in a Model Beer System. J. Inst. Brew. 2011, 117, 74–81. DOI: 10.1002/j.2050-0416.2011.tb00446.x.
- Chaya, C.; Pacoud, J.; Ng, M.; Fenton, A.; Hort, J. Measuring the Emotional Response to Beer and the Relative Impact of Sensory and Packaging Cues. J. Am. Soc. Brew. Chem. 2015, 73, 49–60. DOI: 10.1094/ASBCJ-2015-0114-01.
- Yang, Q.; Doradoa, R.; Chayab, C.; Hort, J. The Impact of PROP and Thermal Taster Status on the Emotional Response to Beer. Food Qual. Pref. 2018, 68. DOI: 10.1016/j.foodqual.2018.03.001.
- Dong, L.; Hou, Y.; Li, F.; Piao, Y.; Zhang, X.; Zhang, X.; Li, C.; Zhao, C. Characterization of Volatile Aroma Compounds in Different Brewing Barley Cultivars. J. Sci. Food Agric. 2015, 95, 915–921. DOI: 10.1002/jsfa.6759.
- Herb, D.; Filichkin, T.; Fisk, S.; Helgerson, L.; Hayes, P.; Meints, B.; Jennings, R.; Monsour, R.; Tynan, S.; Vinkemeier, K.; et al. Effects of Barley (Hordeum vulgare L.) Variety and Growing Environment on Beer Flavor. J. Am. Soc. Brew. Chem. 2017, 75, 345–353. DOI: 10.1094/ASBCJ-2017-4860-01.
- Bettenhausen, H. M.; Benson, A.; Fisk, S.; Herb, D.; Hernandez, J.; Lim, J.; Queisser, S. H.; Shellhammer, T. H.; Vega, V.; Yao, L.; et al. Variation in Sensory Attributes and Volatile Compounds in Beers Brewed from Genetically Distinct Malts: An Integrated Sensory and Non-Targeted Metabolomics Approach. J. Am. Soc. Brew. Chem. 2020, 78, 136–152. DOI: 10.1080/03610470.2019.1706037.
- Bettenhausen, H. M.; Barr, L.; Broeckling, C. D.; Chaparro, J. M.; Holbrook, C.; Sedin, D.; Heuberger, A. L. Influence of Malt Source on Beer Chemistry, Flavor, and Flavor Stability. Food Res. Int. 2018, 113, 487–504. DOI: 10.1016/j.foodres.2018.07.024.
- Windes, S.; Bettenhausen, H. M.; Van Simaeys, K. R.; Clawson, J.; Fisk, S.; Heuberger, A. L.; Lim, J.; Queisser, S. H.; Shellhammer, T. H.; Hayes, P. M. Comprehensive Analysis of Different Contemporary Barley Genotypes Enhances and Expands the Scope of Barley Contributions to Beer Flavor. J. Am. Soc. Brew. Chem. 2021, 79, 281–305. DOI: 10.1080/03610470.2020.1843964.
- Morrissy, C. P.; Féchir, M.; Bettenhausen, H. M.; Van Simaeys, K. R.; Fisk, S.; Hernandez, J.; Mathias, K.; Benson, A.; Shellhammer, T. H.; Hayes, P. M. Continued Exploration of Barley Genotype Contribution to Base Malt and Beer Flavor through the Evaluation of Lines Sharing Maris Otter® Parentage. J. Am. Soc. Brew. Chem. 2021, 79, 1–14. DOI: 10.1080/03610470.2021.1952509.
- Herb, D.; Filichkin, T.; Fisk, S.; Helgerson, L.; Hayes, P.; Benson, A.; Vega, V.; Carey, D.; Thiel, R.; Cistue, L.; et al. Malt Modification and Its Effects on the Contribution of Barley Genotype to Beer Flavor. J. Am. Soc. Brew. Chem. 2017, 75, 354–362. DOI: 10.1094/ASBCJ-2017-4976-01.
- Evans, D. E. Mashing. Pilot Knob, Minneapolis, MN: American Society of Brewing Chemists and Master Brewers of the Americas, 2021.
- Ribeiro-Filho, N. R.; Linforth, R.; Powell, C. D.; Fisk, I. D. Influence of Essential Inorganic Elements on Flavour Formation during Yeast Fermentation. Food Chem. 2021, 361, 130025. DOI: 10.1016/j.foodchem.2021.130025.
- Hirota, N.; Kuroda, H.; Takoi, T.; Kaneko, T.; Kaneda, H.; Yoshida, I.; Takashio, M.; Ito, T.; Takeda, K. K. Development of a Novel Barley with Improved Beer Foam and Flavour Stability - the Impact of Lipoxygenase-1-Less Barley in the Brewing Industry. Tech. Q. Master Brew. Assoc. Am. 2006, 43, 131–135.
- Ye, H.; Harasymow, S.; Zhang, X.-Q.; Paynter, B.; Wu, D.; Jones, M.; Shu, X.; Li, C. Sequence Variation and Haplotypes of Lipoxygenase Gene LOX-1 in the Australian Barley Varieties. BMC Genet. 2014, 15, 36. DOI: 10.1186/1471-2156-15-36.
- Coghe, S.; Adriaenssens, B.; Leonard, S.; Delvaux, F. R. Fractionation of Colored Maillard Reaction Products from Dark Specialty Malts. J. Am. Soc. Brew. Chem 2004, 62, 79–86. DOI: 10.1094/ASBCJ-62-0079.
- Omari, I. O.; Charnock, H. M.; Fugina, A. L.; Thomson, E. L.; Scott McIndoe, J. S. Magnesium-Accelerated Maillard Reactions Drive Differences in Adjunct and All-Malt Brewing. J. Am. Soc. Brew. Chem. 2021, 79, 145–155. DOI: 10.1080/03610470.2020.1795437.
- Hodge, J. E. Dehydrated Foods: Chemistry of Browning Reactions in Model Systems. J. Agric. Food Chem. 1953, 1, 928–943. DOI: 10.1021/jf60015a004.
- Ames, J. M. The Maillard Browning Reaction - an Update. Chem. Indust 1988, 17, 558–561.
- Danehy, J. P.; and Wolnak, B. Maillard Technology: Manufacturing Applications in Food Products. In The Maillard Reaction in Foods and Nutrition; Waller, G. R., Feather, M.S., Eds. American Chemical Society: Washington, DC, 1983; pp 303–316.
- Palmer, J. Putting Brewing Water Adjustment in Perspective. Tech. Q. Master Brew. Assoc. Am. 2018, 55, 39–45. DOI: 10.1094/TQ-55-2-0731-01.
- Kuhbeck, F.; Back, W.; Krottenthaler, M. Influence of Lauter Turbidity on Composition, Fermentation Performance and Beer Quality - a Review. J. Inst. Brew. 2006, 112, 215–221. DOI: 10.1002/j.2050-0416.2006.tb00716.x.
- Kuhbeck, F.; Back, W.; Krottenthaler, M. Influence of Lauter Turbidity on Wort Composition, Fermentation, Performance and Beer Quality in Large-Scale Trials. J. Inst. Brew. 2006, 112, 222–231. DOI: 10.1002/j.2050-0416.2006.tb00717.x.
- Kuhbeck, F.; Schutz, M.; Thiele, F.; Krottenthaler, M.; Back, W. Influence of Lauter Turbidity and Hot Trub on Wort Composition, Fermentation, and Beer Quality. J. Am. Soc. Brew. Chem. 2006, 64, 16–28. DOI: 10.1094/ASBCJ-64-0016.
- Evans, D. E.; Goldsmith, M.; Redd, K. S.; Nischwitz, R.; Lentini, A. Impact of Mashing Conditions on Extract and Its Fermentability, and the Level of Wort Free Amino Nitrogen (FAN), β-Glucan and Lipids. J. Am. Soc. Brew. Chem. 2012, 70, 39–49. DOI: 10.1094/ASBCJ-2012-0103-01.
- Ayrapaa, T.; Lindstrom, I. Influence of Long-Chain Fatty Acids on the Formation of Esters by Brewer’s Yeast. Proc. 14th Eur. Brew. Conv. Congr., Salzburg, 1973; pp 271–283.
- Moonjai, N.; Verstrepen, K. J.; Delvaux, F. R.; Derdelinckx, G.; Verachtert, H. The Effects of Linoleic Acid Supplementation of Cropped Yeast on Its Subsequent Fermentation Performance and Acetate Ester Synthesis. J. Inst. Brew. 2002, 108, 227–235. DOI: 10.1002/j.2050-0416.2002.tb00545.x.
- Moonjai, N.; Verstrepen, K. J.; Shen, H.-Y.; Derdelinckx, H.; Verachtert, H.; Delvaux, F. R. Uptake of Linoleic Acid by Cropped Brewers’ Yeast and Its Incorporation into Cellular Lipid Fractions. J. Am. Soc. Brew. Chem. 2003, 61, 161–168. DOI: 10.1094/ASBCJ-61-0161.
- Thurston, P. A.; Quain, D. E.; Tubb, R. S. Lipid Metabolism and Regulation of Volatile Ester Synthesis in Saccharomyces cerevisiae. J. Inst. Brew. 1982, 88, 90–94. DOI: 10.1002/j.20500416.1982.tb04078.x.
- Evans, D. E.; Collins, H. M.; Eglinton, J. K.; Wilhelmson, A. Assessing the Impact of the Level of Diastatic Power Enzymes and Their Thermostability on the Hydrolysis of Starch during Wort Production to Predict Malt Fermentability. J. Am. Soc. Brew. Chem 2005, 63, 185–198. DOI: 10.1094/ASBCJ-63-0185.
- Verstrepen, K. J.; Derdelinckx, G.; Dufour, J.-P.; Winderickx, J.; Thevelein, J. M.; Pretorius, I. S.; Delvaux, F. R. Flavor-Active Esters: Adding Fruitiness to Beer. J. Biosci. Bioeng. 2003, 96, 110–118. DOI: 10.1016/S1389-1723(03)90112-5.
- Andrews, J.; Axcell, B. C. Wort Boiling - Evaporating the Myths of the past. Tech. Q. Master Brew. Assoc. Am 2003, 40, 249–254.
- Andrews, J. M. H. Evaporating the Myths. Brew. Distill. Intl. 2008, 4, 20–24.
- De Schutter, D. P.; Saison, D.; Delvaux, F.; Derdelinckx, G.; Rock, J.-M.; Neven, H.; Delvaux, F. R. Release and Evaporation of Volatiles during Boiling of Unhopped wort. J. Agric. Food Chem. 2008, 56, 5172–5180. DOI: 10.1021/jf800610x.
- Hammond, J. Yeast Growth and Nutrition. In Brewing Yeast Fermentation Performance; Smart, K., Ed.; Blackwell Scientific: Oxford, 2000; pp 77–85.
- Briggs, D. E.; Boulton, C. A.; Brookes, P. A.; Stevens, R. Brewing: Science and Practice; CRC Press: Boca Raton, FL, 2004.
- Bamforth, C. W. A Critical Control Point Analysis for Flavour Stability of Beer. Tech. Q. Master Brew. Assoc. Am. 2004, 41, 97–103.
- Ditrych, M.; Filipowska, W.; de Rouch, G.; Jaskula-Goiris, B.; Aerts, G.; Andersen, M. L.; de Cooman, L. Investigating the Evolution of Free Staling Aldehydes throughout the Work Production Process. Brew. Sci. 2019, 72, 10–17. DOI: 10.23763/BrSc18-21ditrych.
- Rettberg, N.; Biendl, M.; Garbe, L.-A. Hop Aroma and Hoppy Beer Flavor: Chemical Backgrounds and Analytical Tools—a Review. J. Am. Soc. Brew. Chem. 2018, 76, 1–20. DOI: 10.1080/03610470.2017.1402574.
- Williamson, M. P. The Structure and Function of Proline-Rich Regions in Proteins. Biochem. J. 1994, 297, 249–260. DOI: 10.1042/bj2970249.
- Oliver, G. The Oxford Companion to Beer; Oxford: Oxford University Press Inc, 2011.
- Long, N. R.; Logue, S. J.; Jefferies, S. P.; Barr, A. R. Effects of Macro- and Micro-Nutrient Supply on Grain Yield and Malting Quality on Responsive Soils. In Proc. 9th Aust. Barley Tech. Symp; Melbourne, Victoria, 12th-16th September, 1999; pp 1999.
- Dikeman, E.; Pomeranz, Y.; Lai, F. S. Mineral and Protein Contents in Hard Red Winter Wheat. Cereal Chem. 1982, 59, 139–142.
- Luo, H.; Harasymow, S.; Paynter, B.; MacLeod, A.; Izydorczyk, M. S.; O’Donovan, J. T.; Li, C. Genetic and Environmental Impact on Protein Profiles in Barley and Malt. J. Inst. Brew. 2019, 125, 28–38. DOI: 10.1002/jib.532.
- Peterson, C. J.; Johnson, V. A.; Mattern, P. J. Evaluation of Variation in Mineral Element Concentrations in Wheat Flour and Bran of Different Cultivars. Cereal Chem. 1983, 60, 450–455.
- Bekkers, A.; Vissenaekens, J.; Baks, T. Attenuation Limit of Malt as a Function of Gelatinisation Characteristics of Starch. In Proc. 31st Brew. Conv. Congr. Venice, Presentation #19, 2007.
- Stenholm, K.; Home, S.; Pietilae, K.; Macri, L. J.; MacGregor, A. W. Starch Hydrolysis in Mashing. In Proc. 26th Eur. Brew. Conv. Congr. Maastricht, 1997; pp 142–145.
- Appel R, and Brewing-Research-International. The beer flavor of Maris Otter, private project report Robin Appel’s Ltd and Home Grown Cereals Authority UK. Robin Appel’s Ltd, 2008; pp 1–19.
- American Society of Brewing Chemists ASBC Malt Aroma and Flavor Symp. Minneapolis, MN, June 10–14, 2018. https://bsgcraftbrewing.com/asbc-malt-flavor-aroma-symposium/.
- Samaras, T. S.; Camburn, P. A.; Chandra, S. X.; Gordon, M. H.; Ames, J. M. Antioxidant Properties of Kilned and Roasted Malts. J. Agric. Food Chem. 2005, 53, 8068–8074. DOI: 10.1021/jf051410f.
- Lekkas, C.; Stewart, G. G.; Hill, A.; Taidi, B.; Hodgson, J. The Importance of Free Amino Nitrogen in Wort and Beer. Tech. Q. Master Brew. Assoc. Am. 2005, 42, 113–116.
- Blanca-Gomez, G.; Edney, M. J. A High-Maltose Broth Method for Studying the Effects of Amino Acids on Fermentability. J. Am. Soc. Brew. Chem. 2011, 69, 127–132. DOI: 10.1094/ASBCJ-2011-0527-02.
- Yin, H.; He, Y.; Deng, Y.; Dong, J.-J.; Lu, J.; Chen, L. Application of Plackett-Burman Experimental Design for Investigating the Effect of Wort Amino Acids on Flavor-Active Compounds Production during Lager Yeast Fermentation. J. Inst. Brew. 2017, 123, 300–311. DOI: 10.1002/jib.424.
- Evans, D. E.; Stewart, S. L.; Stewart, D. C.; Han, Z.; Han, P.; Able, J. A. Profiling Malt Enzymes Related to Impact on Malt Fermentability, Lautering and Beer Filtration Performance of 94 Commercially Produced Malt Batches. J. Am. Soc. Brew. Chem. 2021, 127, 1–14. DOI: 10.1080/03610470.2021.1979891.
- Jin, H.; Rogers, P. Novel Recovery of Malt Flavours from Their Glycosidically Bound Precursors. Tech. Q. Master Brew. Assoc. Am. 2000, 37, 79–83.
- De Schutter, D. P.; Saison, D.; Delvaux, F.; Derdelinckx, G.; Rock, J.-M.; Neven, H.; Delvaux, F. R. Characterization of Volatiles in Unhopped Wort. J. Agric. Food Chem. 2008, 56, 246–254. DOI: 10.1021/jf072619r.
- Liang, Z.; Zhongxiang Fang, Z.; Pai, A.; Luo, J.; Gan, R.; Gao, Y.; Lu, J.; Zhang, P. Glycosidically Bound Aroma Precursors in Fruits: A Comprehensive Review. Crit. Rev. Food Sci. Nutr. 2022, 62, 215–243. DOI: 10.1080/10408398.2020.1813684.
- Bettenhausen, H. M.; Barr, L.; Omerigic, H.; Yao, L.; Heuberger, A. L. Mass Spectrometry Metabolomics of Hot Steep Malt Extracts and Association to Sensory Traits. J. Am. Soc. Brew. Chem. 2021, 79, 394–406. DOI: 10.1080/03610470.2020.1869499.
- ASBC Methods of Analysis. Sensory Analysis 14. Hot Steep Malt Sensory Evaluation Method, 14th ed.; American Society of Brewing Chemists: St. Paul, MN. https://www.asbcnet.org/Methods.
- Stewart, D. C.; Hawthorne, D.; Evans, D. E. Cold Sterile Filtration: A Small Scale Filtration Test and Investigation of Membrane Plugging. J. Inst. Brew. 1998, 104, 321–326. DOI: 10.1002/j.2050-0416.1998.tb01003.x.
- Evans, D. E.; Goldsmith, M.; Dambergs, R.; Nischwitz, R. A Comprehensive Reevaluation of the Small-Scale Congress Mash Protocol Parameters for Determination of Extract and Fermentability. J. Am. Soc. Brew. Chem. 2011, 69, 13–27. DOI: 10.1094/ASBCJ-2011-0111-01.
- Evans, D. E. A More Cost and Labour Efficient Assay for the Combined Measurement of the Diastatic Power Enzymes, α-Amylase, β-Amylase and Limit Dextrinase. J. Am. Soc. Brew. Chem. 2008, 66, 215–222. DOI: 10.1094/ASBCJ-2008-0909-.01.
- Evans, D. E.; Dambergs, R.; Ratkowsky, D.; Li, C.; Harasymow, S.; Roumeliotis, S.; Eglinton, J. K. Refining the Prediction of Potential Malt Fermentability by Including an Assessment of Limit Dextrinase Thermostability and Additional Measures of Malt Modification, Using Two Different Methods for Multivariate Model Development. J. Inst. Brew. 2010, 116, 86–97. DOI: 10.1002/j.2050-0416.2010.tb00403.x.
- Kanauchi, M.; Bamforth, C. W. The Relevance of Different Enzymes for the Hydrolysis of β-Glucans in Malting and Mashing. J. Inst. Brew 2008, 114, 224–229. DOI: 10.1002/j.2050-0416.2008.tb00332.x.
- ASBC Methods of Analysis, 14th ed.; American Society of Brewing Chemists: St. Paul, MN. https://www.asbcnet.org/Methods.
- Meilgaard, M. C.; Civille, G. V.; Carr, B. T. Sensory Evaluation Techniques, 4th ed.; CRC Press: Boca Raton, FL, 2006, pp 105–128.
- Lin, L. The Malting and Brewing Behaviour of Barley from Different Origins. In Proc. 13th Aust. Barley Tech. Symp. Fremantle, Western Australia, Australia, 2007; pp 105.
- Sharp, D. C.; Steensels, T.; Shellhammer, T. H. The Effect of Hopping Regime, Cultivar and β-Glucosidase Activity on Monoterpene Alcohol Concentrations in Wort and Beer. J. Inst. Brew. 2017, 123, 185–191. DOI: 10.1002/jib.418.
- Bamforth, C. W. Wort Composition. In Brewing Yeast Fermentation Performance; Smart, K., Ed.; Blackwell Scientific: Oxford, 2001; pp 77–85.
- Waterhouse, A. L.; Sacks, G. L.; Jeffery, D. W. Isoprenoids. In Understanding Wine Chemistry; John Wiley and Sons: Chichester, West Sussex, UK, 2016; pp 68–78.
- Peltz, M.; Shellhammer, T. Ethanol Content Has Little Effect on the Sensory Orthonasal Detection Threshold of Hop Compounds in Beer. J. Am. Soc. Brew. Chem. 2017, 75, 221–227. DOI: 10.1094/ASBCJ-2017-3994-01.
- Bamforth, C. W. Dimethyl Sulfide - Significance, Origins and Control. J. Am. Soc. Brew. Chem. 2014, 72, 165–168. DOI: 10.1094/ASBCJ-2014-0610-01.
- Pyke, M. The Manufacture of Scotch Grain Whisky. J. Inst. Brew. 1965, 71, 209–218. DOI: 10.1002/j.2050-0416.1965.tb02047.x.
- Wanikawa, A. Flavors in Malt Whisky: A Review. J. Am. Soc. Brew. Chem. 2020, 78, 260–278. DOI: 10.1080/03610470.2020.1795795.
- French, P. Terroir in whiskey ‘does exist,’ distillery study finds. The Drinks Business, 2019. January 4th: https://www.thedrinksbusiness.com/2019/01/terroir-in-whiskey-does-exist-distillery-study-finds/.
- Pomeranz Distillery offers ‘conclusive proof’ that whiskey can have terroir. Food and Wine, 2021. February 17th: https://www.foodandwine.com/news/whiskey-terroir-study.
- ANON Biotransformation to enhance hop flavor and aroma. Brauwelt Intl., 2020. 5: 27/11/2020.