
Abstract
The use of Raman spectroscopy combined with saliva is an exciting emerging spectroscopy-biofluid combination. In this review, we summarize current methods employed in such studies, in particular the collection, pretreatment, and storage of saliva, as well as measurement procedures and Raman parameters used. Given the need for sensitive detection, surface-enhanced Raman methods are also surveyed, alongside chemometric techniques. A meta-analysis of variables is compiled. We observe a wide range of approaches and conclude that standardization of methods and progress to more extensive validation Raman-saliva studies is necessary. Nevertheless, the studies show tremendous promise toward the improvement of speed, diagnostic accuracy, and portable device possibilities in applications such as healthcare, law enforcement, and forensics.
1. Introduction
1.1. Overview
The rapid and accurate detection of substances in biofluids is of paramount importance to healthcare, law enforcement, and forensics. At present, blood and urine are commonly acquired fluids and can be analyzed via various means (assays, high-performance liquid chromatography, mass spectrometry).[Citation1,Citation2] However, other biofluids are being investigated, which may have different accessibility, risk, and content profiles than blood or urine.[Citation3–6] Optical methods show promise in biosensing, and specifically, there is an increasing interest in spectroscopic means that may confer benefits of speed, increased accuracy, and multiplexing. Alongside this, the development of smaller instruments needing low sample volumes for benchtop clinical or bedside use, or in-field applications at a roadside accident or a crime scene, is desirable.
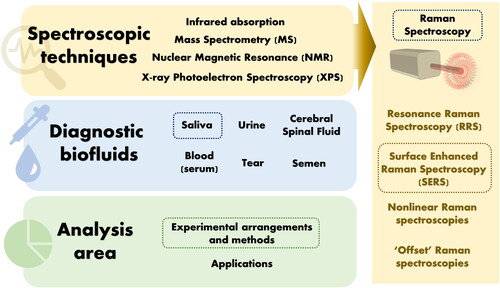
One especially exciting combination of biofluid and spectroscopy is that of saliva and Raman spectroscopy. Herein, we provide a detailed review of the experimental design and methodology in Raman-saliva studies with a specific highlight on the use of surface-enhanced Raman spectroscopy (SERS). This review will highlight an important question as to whether researchers in Raman-saliva studies employ consistent means in their experimental methods, in terms of collection, processing, storage, measurement, and analysis, and whether these methods are suitable for purpose ().
Figure 1. Spectroscopic techniques, diagnostic biofluids and analysis area. Dashed boxed topics indicate those covered in detail in this review.
A lack of standardization in biomarker studies is evident in general. Poste[Citation7] underlines the broad nature of the inquiry by raising questions on uniformity of practice and analysis pertinent to many different fields, suggesting that “lack of standardization, not only can affect the validity of the conclusion with an individual study, but also clearly impacts the meaningfulness of study comparisons.” Therefore, an increased emphasis on experimental approaches over application is timely, fueled by the need to address inconsistencies within a Raman-saliva context. Congruently, Surowiec et al.[Citation8] has recently underlined the importance of experimental design in the analysis of complex mixtures to maximize useful data extraction and, subsequently, the knowledge gained from such. Details on further biofluids, alternative spectroscopic approaches, and applications of saliva as a potential diagnostic fluid are broadly reviewed in the literature.[Citation9–19]
1.2. Why saliva?
1.2.1. Biofluids and saliva function
Biofluid analysis has become a key area of research in recent years, with an increasing awareness that many biomarkers and drugs may be detectable as indicators for disease or drug consumption.[Citation16,Citation19] The promise of saliva was noted in an early review by Pfaffe et al., observing that while technologies had the required analytical sensitivity to benefit from saliva as a diagnostic medium, these had not yet been integrated into widespread clinical practice,[Citation20] despite some appearance in simple home-testing kits.[Citation21] More robust biomarker identification, validation, and disease association studies are needed.[Citation20]
Saliva is an extracellular fluid produced by the salivary glands in mammals. The main bodily function of saliva is in lubrication, which is necessary for chewing, swallowing, and speech, but it also serves a purpose in pH regulation and for oral hygiene,[Citation20,Citation22–26] while calcium and phosphates in saliva contribute to enamel remineralization.[Citation24]
1.2.2. Saliva composition
Saliva is mostly comprised of water and may take a frothy appearance. There are three main salivary glands in the human mouth: submandibular, sublingual, and parotid, each with its own rheological properties, alongside hundreds of minor glands.Footnote1 The major proteins in saliva are proline-rich peptides (PRPs), the glycoprotein α-amylase, and the much larger mucins, the three of which cumulatively constitute almost 80% of salivary proteins.[Citation20] Up to 70% of salivary flow comes from the submandibular gland.[Citation25] Saliva also contains extracellular vesicles (EVs) and lipids, and some non-salivary gland constituents such as epithelial cells, micro-organisms, and food remnants.[Citation20] Where non-salivary gland constituents are considered, the term “oral fluid” might be more appropriate, nonetheless, “saliva” is frequently used in the literature to refer to the ensemble. Salivary constitution can change depending on hormonal and psychological effects, as well as physical exercise, oral hygiene, and whether the production of the fluid is stimulated or unstimulated. Body posture, i.e., lying down or standing up, and ambient light also affects salivary production, where darkness is reported to lower salivary flow by up to 40%.[Citation25]
Moreover, saliva composition can vary greatly depending on collection methods and the time of day, i.e., subject to circadian rhythm, and even yearly seasons.[Citation22,Citation24,Citation27–30] In the daily case, this may be simply as a result of different relative flow rates of various salivary glands.[Citation24,Citation28] It has been noted that while salivary flow peaks in the late afternoon in healthy subjects, compositional variations need to be considered separately, with, for instance, peaks in sodium and chloride levels occurring in the morning.[Citation22] Also, differential flow rates are observed in certain diseases such as in Sjögren's syndrome, an autoimmune condition characterized by epithelial cell destruction, where the flow from the submandibular and sublingual glands is lower than in healthy subjects hence affecting salivary composition.[Citation9] Head and neck irradiation and HIV may produce similar effects.[Citation24,Citation31] Circadian variations are not exclusive to saliva and have been noted in serum and cerebral spinal fluid (CSF).[Citation6] Gland-specific collection is possible, however, it is cumbersome and often done by cannulation.[Citation20,Citation32,Citation33] When stimulated, saliva amount is related to the gland size, whereas unstimulated is not.[Citation22] Gland size has been suggested to be the only reason for salivary variance noted between male and female subjects due to the mean gland size difference, although there are opposing views in the literature.[Citation34,Citation35] Similarly, there is a debate on the effect of subject body mass on the observed saliva composition in boys.[Citation36,Citation37]
In light of these salivary variations, researchers frequently conduct preliminary studies that include spectroscopic measurements combined with man-made saliva-like formulations and analyte spiking.[Citation38–41] Artificial saliva is a prevalent choice over actual human saliva in studies focusing on dental materials, which simulate an oral environment. Typical components of artificial saliva formulations contain mucin, which produces the prominent amide bands when measured with vibrational spectroscopies. However, despite the various existing formulations of artificial saliva, there is minimal guidance on standardization.[Citation42] Notably, Ionta et al.[Citation42] has reported the effect of different formulations of artificial saliva on enamel mineralization, demonstrating remineralization potential despite variations, including no effect from added mucin.
1.2.3. Saliva versus other biofluids
The use of saliva as a diagnostic biofluid presents various benefits.[Citation43] Saliva is easier to acquire than blood,[Citation44,Citation45] thus enabling faster and less intrusive acquisition that may be performed without extensive training,[Citation11] pertinent in the potential use for portable point-of-care (PoC) medical devices.[Citation46] Further, there is a negligible risk of infection to the donor and a lower risk to the handler compared to blood.[Citation6,Citation11] The ability to supervise during the collection of saliva minimizes the chance of adulteration, in contrast to urine, which may be necessary for sports-doping monitoring.[Citation47] At the roadside tests, immediate urine and blood collection pose significant challenges. Compared to urine, saliva often contains the parent compounds, whereas urine contains mainly metabolites.[Citation47] Moreover, for some substances, saliva may have a further advantage whereby the analytical sensitivity increases because the requisite substance has been orally ingested, as often evident with illicit drugs, however, analysis of oral residues, present in varying amounts, may impair quantitative analysis.[Citation48]
A positive correlation exists between multiple biomolecules detectable in serum and saliva due to the transfer of material via the salivary duct across a thin layer of epithelial cells by passive diffusion, active transport, or extracellular ultra-filtration.[Citation9,Citation20] Pfaffe et al.[Citation20] has compiled a comprehensive list of common biomolecules, which may be detected in both blood and saliva, and the clinically relevant ranges, highlighting indicators for oral and breast cancers as well as cardiovascular diseases, amongst others. The precise understanding of the movement of material from blood to saliva is still a matter of debate, as underlined by a model employed by Dadas et al., who study brain-derived proteomic biomarkers, noting the selective bias toward low molecular weight at the blood-saliva barrier.[Citation49] Inscore[Citation50] observes that illicit drugs in saliva may be in comparable concentrations to blood.
Although saliva tests in medicine are a routine practice, spectroscopic saliva studies in healthcare have not progressed much beyond the preliminary investigations into specific diseases, which seek to identify abnormal biomarkers.[Citation9,Citation51] Historically, saliva studies have presented small sample numbers and have lacked validation, having not met diagnostic criteria in terms of sensitivity and specificity. Biomarker identification is attempted amongst a myriad of changing organic species, including body secretion products, putrefaction products, and lipids.[Citation9] Bonassi et al.[Citation52] has noted that biomarker identification should be preferably as near to the causal pathway of the disease as possible. Despite an array of different proteins present, the salivary composition is not as complex as that of blood serum,[Citation9] which expresses as many as 105 different proteins over a dynamic concentration range spanning 12 orders of magnitude.[Citation53] Moreover, total salivary protein content is relatively low, indicating that protein binding with other constituents is less likely to occur. This, for instance, means that any illicit drug compounds may exist as unbound molecules.[Citation48]
Furthermore, saliva has recently been highlighted as a potential biofluid for COVID-19 diagnostics,[Citation54–57] directly linked to SARS-COV-2 virus spread,[Citation58] and has been employed for detection of the novel coronavirus with at least comparable sensitivity to a nasopharyngeal swab test during the course of patients’ hospitalization.[Citation59]
1.3. Why Raman spectroscopy?
1.3.1. Current analysis methods
In many disease cases, biopsies and histopathological analyses can be performed, but the procedure is time-consuming, invasive, and may risk infection for patients.[Citation60,Citation61] Furthermore, biopsies are often performed later in the diagnostic course and morphological or structural abnormalities may not be apparent in early pathologies.[Citation62] Other approaches, such as enzyme-linked immunosorbent assay (ELISA) or high-performance liquid chromatography (HPLC), are relatively slow and require skilled users. Mass spectrometry (MS) has similar issues and can suffer from non-universal ionization efficiency and ion-suppression.[Citation60,Citation63,Citation64] Moreover, MS precludes portable (handheld) analysis without significant detriment to analytical performance.[Citation64] Electrochemical sensors are popular, however, the reliability of anodic/cathodic peak analysis may be questionable.[Citation65] This has led to an interest in less invasive optical diagnostics such as optical coherence tomography (OCT).[Citation60,Citation62]
1.3.2. Optical biosensing
Biosensing requires detecting a panel of compounds, preferably simultaneously, rapidly, and reproducibly with high analytical selectivity and sensitivity.[Citation66] Most competitive biosensing solutions to date combine chemical transduction i.e., surface functionalization, and optical sensing e.g., phase change monitoring. The state-of-the-art techniques include surface plasmon resonance (SPR) and the related technique of grating coupled waveguide (GCW) interferometry,[Citation66] which operate based on a change in the refractive index of the aqueous medium where the analyte binds to an affinity molecule (antibodies, aptamers, small molecules, and polymers[Citation67]) at a surface, causing a change to the resonance energy of a propagating light-electron excitation (plasmon-polariton) at the metal-analyte solution interface.[Citation68] SPR/GCW requires an intricate setup and is highly assay-specific and thus unsuitable for unknown sample determination. Colorimetry/spectrophotometry provides a visual test based on the absorbance of light, however, the technique may be hampered by a subjective analysis and limited in terms of specificity, detecting only certain classes of compounds and therefore, it often requires further verification by more sensitive and specific laboratory-based techniques.[Citation47,Citation69] Speed and reagent costs are additional limitations of colorimetric methods.[Citation64] Spectrophotometry has been used with saliva samples to determine the concentration of glucose, the abnormal concentration of which may be indicative of diabetes, requiring a 90-min calibration step and chemical reagents.[Citation70] In the field of illicit drugs, detection kits suffer from a lack of quantitative determination and limited applicability, e.g., trouble in detecting the continuous emergence of new synthetic compounds.[Citation65]
1.3.3. Raman spectroscopy
Raman spectroscopy (RS) is performed with a monochromatic light source, optics to remove unwanted light, and a spectrograph/monochromator to isolate a specific wavelength range. The technique has also benefited from the improved capabilities of cameras and advances in analysis software. The Raman scattering phenomenon relies on the instantaneous inelastic interaction of light with molecular vibrations, whereby a change in bond polarizability as a function of nuclear motions results in an alteration to the emitted frequency of light known as Raman-shift. Different molecules present different bonds to analyze and therefore, differences in Raman peak energies and intensities.[Citation13,Citation71] Thus, Raman is often termed as a “molecular fingerprint.” RS has had a long history of analytical uses including explosives detection,[Citation72–74] food technology,[Citation75,Citation76] and even in the analysis of artwork.[Citation77–79] Berger[Citation80] may have been the first to suggest that Raman spectroscopy could be used to analyze biofluids in a near-infrared Raman study of blood, and many studies have followed.[Citation10,Citation15,Citation81–83] Recently, its potential to become a clinical tool for early disease diagnosis has been highlighted.[Citation17,Citation51,Citation84–91]
The phenomenon of Raman scattering produces inherently sharp spectral peaks, unlike fluorescence spectroscopy, and thus Raman facilitates multiplexed measurement, which is beneficial for sensing purposes by allowing maximal information extraction at a minimal time and cost.[Citation92] The accurate determination of various diseases such as cancer or traumatic brain injury (TBI) is often dependent on the detection of multiple biomarkers.[Citation92,Citation93] For instance, in the case of TBIs, identifying a suite of biomarkers may be necessary to differentiate between demyelinating disease, polytrauma, or a co-morbidity that otherwise affects blood-brain barrier integrity.[Citation6,Citation49,Citation93] Rehman and coworkers have tabulated and assigned Raman peaks from the literature across a range of biological tissues.[Citation94,Citation95]
RS further confers the advantage of requiring small volumes of samples (μLs),[Citation50,Citation96–103] which is pertinent when using saliva as it is challenging to acquire rapidly in large volumes.[Citation11] Significantly, Raman scattering does not suffer from interference from water molecules (99% salivary constituent), as does infrared absorption spectroscopy, due to the low Raman cross-section of water.[Citation11,Citation104] RS does not require sample staining, again unlike fluorescence-based analysis, and therefore, has been widely exploited for studies of living cells, unperturbed, in their native environment.[Citation61] Raman has several notable setup variations, including integration with interferometry (Fourier-transform Raman) and confocal microscopy (Raman micro-spectroscopy). Other variations are phenomenological. Coherent anti-Stokes Raman scattering (CARS) is a non-linear optical analog that can provide extra sensitivity. Resonance Raman spectroscopy (RRS) relies on exciting vibrational bonds at a laser wavelength close to resonance for an increased signal and has been employed in several studies incorporating Raman and saliva.[Citation105–108] Most notable, however, is surface-enhanced Raman spectroscopy, where Raman scattering is combined with plasmonic materials, supporting electron-light excitations at a surface to considerably increase the Raman signal, often by many orders of magnitude.[Citation12]
1.3.4. Surface-enhanced Raman spectroscopy
First reported by Fleischmann, McQuillan, and Hendra in 1973/74[Citation109,Citation110] while studying pyridine at roughened silver electrodes, surface-enhanced Raman spectroscopy (SERS) is a technique that can be chiefly understood in terms of large electric fields generated by surface-confined, hybridized electron-light excitations (plasmon-polaritons) associated with metals, usually gold or silver, at the nanoscale.[Citation68,Citation87,Citation111] These large local electric fields, termed “hot-spots” when concentrated to a small gap, couple to photons participating in Raman scattering events, leading to significant Raman signal enhancements. The enhancing factors can reach a 108 increase over a non-SERS regime for a substrate-averaged measurement,[Citation111] or more if nanometric substrate locations are isolated and evaluated. Regions where the electric field is most concentrated can disproportionately affect the observed SERS enhancement.[Citation112,Citation113] Concurrent with the electromagnetic SERS effects, “chemical enhancement,” consisting of alterations to bond polarizability upon molecule surface adsorption, is also broadly discussed in the SERS literature, however, the magnitude and extent of impact remain a matter of debate.[Citation14,Citation87,Citation111,Citation114] Alessandri and Lombardi[Citation115] have recently reviewed non-electromagnetic effects in SERS in dielectrics. Similar to ordinary Raman, SERS also depends on the inherent cross-section of the analytes as well as the number of molecules present and their orientation on the enhancing surface.[Citation81,Citation87,Citation106]
1.3.5. Potential of Raman and saliva, and current state of play
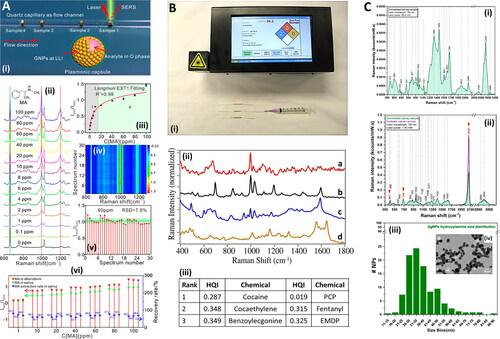
Raman scattering is inherently selective, leading to the potential of accurate determinations, meanwhile, SERS can provide increased sensitivity and low limits of detection (LoDs). Saliva has comparable diagnostic potential to other biofluids. The ease of acquisition of saliva coupled with the speed and portability of RS can facilitate continual monitoring, crucial where the nature of a medical emergency is time-sensitive or temporal kinetics are required, such as in post TBIs.[Citation49,Citation116] Thus, the combination of Raman spectroscopy and saliva is attractive for translation to the clinic and portable uses at the point-of-need. Deriu et al. show that a Raman approach for cannabinoid detection in saliva is almost three times faster than ELISA, despite involving a SERS preparation step (36 min versus 120 min for synthetic cannabinoid) (),[Citation48,Citation117] and considerably longer time-to-results have been shown with ELISA processes taking several hours.[Citation118] For illicit compound detection, while the time for blood analysis using conventional methods can take days to months, saliva analysis takes only 2–48 hours,[Citation11] which could be almost instantaneous with a portable Raman system and an established substance database.[Citation119]
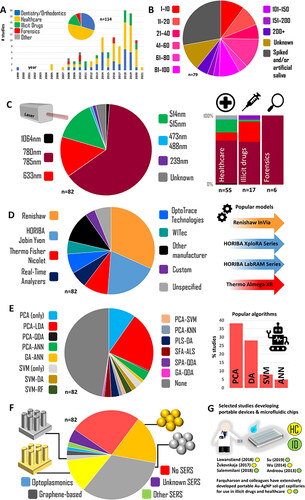
Figure 2. Meta-analysis of the Raman-saliva literature. A. Applications and publication years (dental studies included). B. Sample sizes. C. laser wavelengths and (right) application breakdown. D. Raman systems employed. E. Machine learning algorithms used. F. SERS media used. G. Portable/microfluidic device highlights. For inclusion criteria, studies included, and algorithm acronyms, see Table S1. Dental studies excluded in all except A.
In a recent review detailing nanophotonic approaches to pharmaceutical monitoring via Raman, Frosch et al.[Citation120] mention saliva as a potential breakthrough diagnostic biofluid. Previously, Butler et al.[Citation12] set out a protocol for Raman studies with biological materials, and Henson and Wong[Citation121] outlined the optimal procedures in the collection, storage and the processing of saliva samples in the context of oral biology, while Chevalier et al.[Citation122] provided recommendations on storage in a detailed study into proteomic longevity. Despite this literature, there is much room for researchers to take different approaches in setting up their Raman-saliva experiments and the methods they follow, and therefore, a summary of these details would be helpful. Importantly, there are other aspects of saliva analysis, specifically relating to the use of RS, such as the exact measurement protocol, that have not been adequately surveyed.
2. Applications of Raman-based saliva studies
Applications of saliva have been summarized previously with impact in the fields of specific disease identification,[Citation123] illicit drugs[Citation124] and pharmaceuticals.[Citation120] We briefly summarize the main applications of Raman-saliva study here. An overview is provided in .
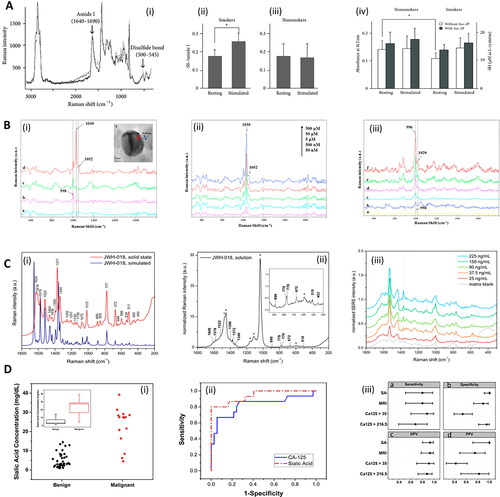
Figure 3. Methods in Raman and saliva. A. Analysis of smokers’ saliva with Raman. (i) Raman spectra of S-S stretch and amide I derived from disulfide bonds of saliva proteins. The black line and gray line correspond to stimulated saliva and unstimulated (resting) saliva, respectively. (ii, iii) The areal ratio of disulfide residues per amide I for (ii) smokers, and (iii) nonsmokers. (iv) Sulfhydryl residues in the saliva of smokers and nonsmokers collected under stimulated and unstimulated (resting) conditions were compared separately with or without L-ascorbic acid 2-phosphate (Asc-2P). Asterisk represents significant difference (p < 0.05). Adapted with permission from Taniguchi (2013) under Creative Commons BY 3.0. © Hindawi 2013. B. SERS detection of drugs in saliva with magnetic nanoparticles. (i) SERS spectra of pure saliva recorded (a) without and (b) with Au-dotted magnetic nanocomposites (AMN), (c) SERS spectrum of cotinine (5 μM) in saliva with AMN, (d) magnetically optimized SERS spectrum of cotinine (5 μM) with AMN. (e; Inset) High-resolution TEM image of AMN. (ii) Magnetically optimized SERS spectra of cotinine with various concentrations in saliva, mixed with AMN. (iii) (a) SERS spectrum of pure saliva recorded with AMN; (b) SERS spectrum of benzoylecgonine (50 μM) in saliva with AMN; the magnetically optimized SERS spectra of benzoylecgonine with different concentrations of (c) 0.1 μM, (d) 0.5 μM, (e) 5 μM and (f) 50 μM in saliva, mixed with AMN. Adapted with permission from Yang (2015). © Elsevier 2015. C. Raman and saliva for identification of novel synthetic cannabinoids. (i) Density Functional Theory simulated Raman (bottom, blue) and solid state experimental normal Raman (top, red) spectra of synthetic cannabinoid JWH-018. Intensities have been scaled for ease of comparison. (ii) Normal Raman spectrum of JWH-018 at a concentration of 5.0 mg/mL in methanol. Asterisks indicate bands assigned to the solvent. The intensities have been normalized to the solvent band at 3200 cm−1 assigned to H-bound ν(OH) of the alcohol. (iii) SERS spectra obtained from fortified oral fluid extracts at different initial concentration of JWH-018. The SERS spectrum of the matrix blank is reported in gray. The vertical dotted line marks the drug’s reference band at 1370 cm−1 assigned to the ν(C = C) of the naphthalene moiety. Adapted with permission from Deriu (2019). © American Chemical Society 2019. D. Analysis of sialic acid in saliva with Raman in ovarian cancer. (i) Cloud plot of sialic acid (SA) concentration for groups of benign and malignant cancerous patients. Insert: Box plot of sialic acid concentration. Red: ovarian cancer (OC); black: benign adnexal mass (BAM). (ii) Receiver operating characteristic (ROC) curve analysis for SA (and competitor biomarker cancer antigen 125: CA-125), to optimize the threshold of sialic acid concentrations to distinguish between BAM and OC patients. (iii) Sensitivity, specificity, positive predictive value (PPV) and negative predictive value (NPV) for each test. The figure includes cutoff values and confidence intervals for each biomarker, as well as for the calculated Malignancy Risk Index (MRI). CA125 > 35, CA-125 larger than 35 units/mL; CA125 > 216.5, CA-125 larger than 216.5 units/mL. Adapted with permission from Zermeño-Nava (2018) under Creative Commons BY 4.0. © Springer Nature 2018.
2.1. Healthcare
Healthcare is the most significant potential application, where saliva is increasingly a possible candidate for auxiliary diagnosis.[Citation125] Saliva exhibits potential for use in the developing world, where the characteristics of diseases are poorly defined and treatment options are often limited, unavailable, or ineffective.[Citation20] Sialometry (salivary flow changes) and sialochemistry (salivary chemical changes) have been used to monitor general health,[Citation126–129] and these could be easily combined with RS.
In certain areas of medicine, saliva is considered a possible first-line diagnostic supplementing existing diagnostic processes.[Citation123] For instance, in an ovarian cancer study, Zermeño-Nava et al.[Citation125] note that sialic acid detection in saliva via RS should be “considered in the clinical scenario of adnexal mass growth diagnosed patient and not in the population in general” as well as combined with further clinical diagnosis (). This may be a good indication of the ambit of saliva in healthcare studies in general, whereby aid may be given in confirmatory diagnosis, risk stratification, prognosis determination, and therapy response monitoring[Citation20] or preventative screening.[Citation130] Although the application to population monitoring is apparent,[Citation20] the complex and variable range of saliva constituents[Citation53] combined with the low specificity of certain compounds[Citation125] may limit the ability of saliva as a diagnostic biofluid in the determination of unknown disease, i.e., no suspected pathology.[Citation9] Most healthcare saliva studies use human samples from diseased subjects. Radzol and colleagues have used saliva spiked with nonstructural protein 1 in initial chemometric-focused SERS studies into Dengue fever.[Citation131,Citation132]
2.2. Illicit drugs
Illicit compounds have been studied extensively with Raman spectroscopy,[Citation133–136] and saliva has become an increasingly popular biofluid for these studies.[Citation48,Citation50,Citation99,Citation137–140] The majority of the early work in studying drugs in saliva has been led by Farquharson et al..[Citation137,Citation138,Citation141–145] The practicalities of developing a SERS sensor to detect illicit drugs, including via saliva, have been recently reviewed by Yu et al.[Citation65] The authors note that conveniently many illicit compounds are also good Raman scatterers. Raman-saliva studies in illicit compounds show high sensitivity using SERS-based sensing, comfortably outperforming the 10 s ng/mL range cutoff for many illicit drugs as recommended by the US Substance Abuse and Mental Health Services Administration (SAMHSA).[Citation146,Citation147]
Sivashanmugan et al.[Citation148] have analyzed saliva in a Raman study on cannabis users, acquiring samples 15 min after the established use. Similarly, in a study on methamphetamine, Qu et al.[Citation100] successfully acquire 20 saliva samples for SERS analysis from actual methamphetamine addicts from the Residential Drug Treatment Center of Beijing You-An Hospital, reporting discrimination between these and the saliva analysis of 20 non-addicted subjects. Collection from bona fide drug users is useful, but unusual, for reasons of legality, ethics, and compliance, and likely to be even more difficult to conduct for more harmful compounds i.e., heroin, cocaine. Similar methamphetamine studies have used spiked saliva samples.[Citation47,Citation140]
2.3. Forensics
Saliva has been identified as a potential medium for forensic analysis via RS.[Citation149] Lednev and coworkers have pioneered extensive studies into the use of RS with biofluids for forensics, including saliva.[Citation2,Citation102,Citation150–154] The authors have conducted studies to identify different phenotypes including sex,[Citation155] and have differentiated between human and animal samples.[Citation156] Recently, Buchan et al.[Citation157] have also discriminated between male and female subjects, at differing age groups, via a self-organizing map clustering algorithm displaying a sex classification accuracy of 93%. Virkler and Lednev[Citation152] noted that the spectroscopic signature of saliva could be discriminated from those of blood and semen, and further that saliva samples from multiple donors were similar. Elsewhere, the same author has assigned the most relevant Raman peaks for blood, sweat, saliva, semen and vaginal fluid.[Citation156] Zapata et al.[Citation158] has reviewed the potential of spectroscopy for forensic biofluids.
2.4. Dentistry and orthodontics
Raman and saliva in combination are often used in dentistry and orthodontics,[Citation159–187] although saliva is viewed as a storage medium in most of these studies, focusing on spectroscopic analyses without the direct measurement of artificial saliva, instead using it as a simulated storage environment. Gunchukov et al. have studied periodontitis with Raman and actual human saliva samples,[Citation107,Citation188] as have others in the contexts of remineralization.[Citation189,Citation190]
2.5. General studies
Mleczko et al.[Citation191] study the interaction of antibodies and antigens in saliva and the effect of magnetic hyperthermia, mediated by hematite (Fe3O4) NPs acting to change local temperature and pH. Karlinsey et al.[Citation192] has studied the nucleation phase of hydroxyapatite on metal oxide with Raman spectroscopy in saliva, which may be of broad interest in biocompatibility studies with possible dental applications. In these studies, saliva is not interrogated by RS directly, and thus, like many of the dentistry studies, is less relevant to the current review. SERS studies of Yuen et al. into optimizing a gold-covered bead substrate have a “SERS substrate development character” and are not tethered to any one application.[Citation193,Citation194] Other investigations also have a primary SERS substrate optimization characteristic.[Citation195,Citation196]
2.6. Viral strains
In light of the COVID-19 pandemic, we note a recent study where Eom et al.[Citation197] has reported the use of SERS for the detection of mutant influenza in saliva and nasal fluid samples with spiky gold nanoparticles (AuNPs) and simple aptamer-functionalized glass slide substrates with 250 times greater binding affinity for the mutant pH1N1/H275Y influenza virus than for the wild-type virus. The authors note that although current diagnostic approaches can identify viral subtypes, they do not indicate antiviral drug-resistant strains. Recent publications have discussed the role of saliva specifically in identifying the novel coronavirus[Citation53,Citation196] and the potential role of vibrational spectroscopy in COVID-19 identification.[Citation54]
3. Collection of saliva
3.1. Means of salivary collection
Typically, “whole saliva” is collected. This term refers to oral fluid from the salivary glands as well as from the gingival fold, oral mucosa transudate, nasal cavity, and pharynx regions. The unprocessed mixture contains not only a plethora of proteins but also nasal and pharyngeal mucus, micro-organisms, desquamated epithelial cells, and blood cells, as well as large pieces of food debris.[Citation25] There may be significant variations in the degree of salivary interference from exogenous stimuli between different subjects.[Citation22]
Unstimulated salivary flow is the basal flow at rest, whereas stimulated flow is induced by mechanical, olfactory, gustatory or pharmacological stimuli.[Citation25] Saliva may be collected by different means, including, for instance, swabbing or suction (). The most common approaches for unstimulated saliva collection are the passive drool method or simple spitting, which require no specialized training and are noninvasive. Stimulated salivary flow may be produced by supplying the subject with a piece of paraffin to chew on or by placing a drop of citric acid on their tongue.[Citation32,Citation69] Machado et al.[Citation70] employed dental gauze rolls which study subjects kept in their mouth for 3 min before centrifugation was applied to extract the saliva, a method earlier described by Chiappin.[Citation198] Inscore et al.[Citation50] employed foam-head swabbing coupled with syringed extraction to collect saliva samples.
Table 1. Collection parameters, description and references of Raman-saliva studies.
3.2. Volume of the collected saliva
Saliva volumes acquired are typically in the mL range,[Citation50,Citation97,Citation99,Citation103,Citation138,Citation199–204] which is often more than sufficient for Raman analysis, even via microfluidic Raman systems,[Citation85] and acquired easily, unless due to specific disease hyposalivation or the subject’s severe dehydration in sport and exercise studies.[Citation205,Citation206] Indeed, individual hydration is the most crucial factor in salivary flow, and when bodily water content reduces by only 8%, the salivary flow is effectively zero.[Citation22,Citation37] Barring dehydration, the amount of unstimulated saliva generated per minute in a healthy adult is 0.25–0.35 mL, rising to up to 3 mL/min when stimulation occurs.[Citation25] In a study by Taniguichi et al.[Citation207], the subjects were required to provide saliva via draining/drooling for 7.5 min or until 20 mL was acquired. Exercise may also cause the salivary composition to exhibit increased levels of α-amylase and electrolytes, in particular sodium, depending on the intensity of the activity.[Citation208] However, it is not clear within most Raman studies how saliva may be different for participants who arrived at the point of sample deposition by different levels of exertion i.e., a range of more modest activity levels.
Age, menopause, and hereditary factors also play a role in the flow rate of saliva.[Citation128,Citation129,Citation209,Citation210] With age, salivary glycoproteins increase as a consequence of innate immunity. In other cases, changes may be less due to aging and more due to ill-health and certain medicines used in older subjects, such as anticholinergics (neurotransmitter blockers), which may induce hyposalivation.[Citation211] If the subject is ill, the overproduction of mucin may be a problem[Citation205] and sample dilution may be necessary prior to analysis[Citation20,Citation157,Citation212].
3.3. Collection in Raman-saliva studies
Recently, Goodacre[Citation236] has emphasized that sampling procedures should be considered an essential aspect of the analysis of complex natural systems, and notably, Taniguchi et al.[Citation207] conveyed that differences in diagnostic performance depended on whether saliva collected was stimulated or unstimulated in a study of mucin in smokers’ saliva (). Many collection protocols in the Raman-saliva literature are strict, albeit inter-study differences are still significant. For example, in a study of malignancy in breast tissue, Feng et al.[Citation97] incorporated a 12 hour fast, a narrow collection window (6:30–8:30am), and three mouthwashes, demonstrating a statistically significant difference in SERS peak intensities (p < 0.05) between healthy and cancerous breast tissue samples. Lin et al.[Citation202] subsequently employed almost identical measures in a nasopharyngeal carcinoma study within a microfluidic device.
In dentistry, Axelsson[Citation237] has indicated that while fasting reduces salivary flow, it does not lead to hyposalivation. Maitra et al.[Citation83] extends abstention to liquids, however, with only a three-hour fast before collection. Similarly, Taniguichi et al.[Citation207] dictates no cigarette usage for at least three hours prior to saliva acquisition in their study of salivary mucin changes in smokers. Dietary and lifestyle aspects of participants, such as BMI or dental hygiene, are generally not recorded across studies. Malkovskiy et al.[Citation69] note no apparent dietary influence, with just a diurnal variation in salivary thiocyanate concentration present in a study into cystic fibrosis with RS (). Salemmilani et al.[Citation47] impose no prescription medicine to be taken prior to sample collection. This highlights an important factor since hospital patients often provide samples early in the morning, many of which may have co-morbidities.
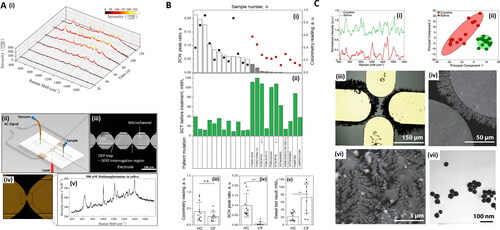
Figure 4. Methods in Raman and saliva II. A. Dielectrophoretic (DEP) nanoparticle SERS system for salivary analysis. (i) Evolution of spectra for 500 nM methamphetamine-positive saliva sample. Linear baseline correction is applied to the spectra. As nanoparticles agglomerate in the trap, the signal intensity increases until it plateaus at around 120 s. (ii) Depiction of the architecture of the DEP-SERS chip. Polydimethylsiloxane (PDMS) microchannel is sandwiched between electrode substrate and glass cover. Yellow pipet tips form fluidic reservoirs/connections. Aluminum wires, soldered to contact pads, form the electrical connection between the chip and the AC signal generator. Chip is loaded onto the Raman microscope, upside down, to prevent laser light from transmitting through PDMS layer, to effectively eliminate PDMS Raman interference. (iii) Each device consists of four trap zones. Traps are aligned to the center of the channels for maximum flow shear during clearing of the microfluidic channels for subsequent detection cycles. (iv) Close-up view of a single trap using agglomeration of nanoparticles. (v) Typical SERS spectra acquired using the DEP-SERS chip. Adapted with permission from Salemmilani (2018). © American Chemical Society 2018. B. Salivary thiocyanate (SCN−) Raman peak at 2068 cm−1 ratio discriminates cystic fibrosis (CF) from healthy control (HC) subjects. (i) SCN− peak ratio for HC (white bars) and CF (gray bars) subjects and colorimetry values (black and red squares, respectively). Arrows mark samples from the same patient three months apart, (ii) sweat test results and patient mutation, (iii) colorimetry values for HC and CF subjects now expressed as scatter plots and average values, (iv) same as (iii) for SCN− peak ratio, and (v) same as (iii) for sweat test results. Data demonstrate that SCN− score is consistent with sweat test results in these patients. **p = 0.0023. ***p = 0.000187. Data include 11 CF samples and 12 HC samples. Adapted with permission from Malkovskiy (2019). © American Chemical Society 2019. C. Study of Raman, saliva, and illicit compounds. (i) SERS spectra for processed cocaine-containing saliva, as well as processed saliva. The key peak at 1003 cm−1 (*), is evident in the cocaine sample. (ii) Plot of first two principal components for SERS spectra of cocaine-spiked and unspiked saliva. Each cluster consists of 20 spectra, and ellipses indicate 95% confidence intervals. (iii) Optical microscopy image of sensing surface. (iv) SEM image showing nanodendrites grown from the microelectrode edge. (vi) SEM at a smaller scale, showing the intricate branched structure of the dendritic silver sensing surface. Images in (vi) shown are from 12 min depositions at 10 Hz, 2.9 V pp, with a 0.5 V DC bias. (vii) TEM image of silver nanoparticles used in the dendrite preparation. Adapted with permission from Dies (2015). © Elsevier 2015.
Kah et al.[Citation60] required the study subjects to wash their mouth 30 min before collection and refrain from swallowing for several minutes to aid collection. It is unknown whether this impacts salivary composition. Radzol et al.[Citation131] ask volunteers to perform 1 min of gargling before unstimulated collection. Hernández-Arteaga et al.[Citation200] implemented “vigorous teeth brushing,” an approach which could introduce unwanted blood residues into the saliva, which is in the exclusion criteria of Othman et al.[Citation238] Salivary pH upon collection, in general, is not considered, barring ref.,[Citation50] the spectral impact of which has been discussed in Buchan.[Citation157] Establishing a universal “standard collection time” will be helpful in the consistency and comparison of the many studies exploiting saliva, as has been noted in the context of CSF and serum acquisition.[Citation6]
In a lung cancer study, Li et al.[Citation98] notes that similar numbers of smokers in their control group (n = 13/21, 65%) were selected in their lung cancer cohort (n = 14/20, 67%). This is a sensible choice given the effect that the smoking phenotype, independent of the cancer status, can have on the salivary Raman spectra.[Citation146,Citation207,Citation216,Citation239–242] The authors perform a baseline check by ELISA for possible inherent morphine traces in the hospitalized cohort. Hernández-Arteaga[Citation200] et al. further classify patients as with “no systemic disease” other than the disease being studied, i.e., breast cancer, as well as with “no oral complaints” due to the nonspecificity of sialic acid, which is elevated in other cancers and inflammatory conditions. However, such restrictive measures may prove problematic in some point-of-care settings.[Citation7]
Less stringent approaches for the saliva collection criteria include the direct collection of unprocessed saliva from healthy individuals without any prerequisites.[Citation243,Citation244] While this might introduce more significant intra-class variability in research studies, it is more in line with real-world applications, at the pitch-side, roadside, or at home, with results only later relayed to clinicians. Such applications need to be well-supported with technological advancements including AI and machine learning algorithms as decision support tools.[Citation70,Citation245–247] It is plausible that common interferents such as mouthwash or alcohol have less of an effect on substance identification than expected, as evidenced in illicit compound detection via infrared absorption spectroscopy.[Citation248]
3.3.1. Sample numbers
Raman-saliva studies in the literature involve both small sample numbers (n < 20)[Citation60,Citation96,Citation118,Citation153,Citation154,Citation224,Citation241] as well as larger (n > 150) cohorts ().[Citation200–202,Citation222,Citation238] Regarding small sample sizes of saliva, Kah et al.,[Citation60] who study five patients with oral cancer and five healthy subjects, indicate that a larger cohort is needed for statistically significant cancer staging. On the other hand, Maitra et al.[Citation83] collected nearly 500 samples for a biofluid cross-comparison study, including 114 saliva samples, further divided into 35 healthy and 79 diseased cohorts, spread across different stages of esophageal cancer. It is important to consider sufficient sample numbers in saliva studies due to relatively large variations in the salivary matrix constitution i.e., intra-class variation. This is especially relevant if the clinical stage of disease is being evaluated and the disease progression is associated with subtle changes in concentration of specific biomarker(s) such as, for instance, in the progression of early hyperplasia to invasive carcinoma in oral cancer.[Citation60,Citation249] It is critical in certain pathologies where the survival rate drops significantly with advanced stages of the disease.[Citation200,Citation201] Hernández-Arteaga et al.[Citation200] note a statistically significant difference between sialic acid concentrations in saliva interrogated by SERS in breast cancer stage 0 and 1 versus stage 3 and 4 cohorts. In this study, concentration relative standard deviation (RSD) amongst all pathological samples was 50%. For future clinical validation studies, power calculations will ensure sufficient study sample sizes to allow the determination of a clinically significant difference.[Citation250] Large sample numbers, however, are not necessary for spiked saliva studies, which may be produced by adding the required analyte to artificial/simulant saliva samples.
3.3.2. Saliva from commercial vendors
Saliva for Raman studies is frequently acquired from a commercial source. Purchased saliva sample studies include Shende (Lee Biosolutions),[Citation141] Muro (Lee Biosolutions and Bioreclamation),[Citation154] Muro (Biological Specialty Company, Lee Biosolutions, Bioreclamation),[Citation155] D’Elia (Bioreclamation),[Citation105] Eom (Lee Biosolutions),[Citation197] and Al-Hetani (Bioreclamation).[Citation239] Obtaining saliva from a commercial source may simplify subsequent steps in saliva storage and measurement and negate problems regarding collection and questions on optimal preprocesses e.g., centrifugation.
4. Pretreatment
Saliva is arguably easier to process than blood, which is prone to clotting and requires specific sample containers.[Citation9] RS also requires fewer reagents than other quantification techniques.[Citation200] There is, however, no universally set protocol for saliva pre-processing. In healthcare studies with human samples, centrifugation of the saliva matrix to remove debris and larger constituents is standard, albeit with differences in process time and centrifugation speed (). Analogously, Salemmilani et al. [Citation47] filter saliva samples using a 0.2 μm-diameter syringe to remove large cells and debris. Ma et al.[Citation64] further note that standard procedures of sample pretreatment and purification should be established to obtain more reliable and specific SERS spectra of biological species. The extent of sample pretreatment, or “sample enrichment,” may depend on the concentration range of the biomarker present in the salivary matrix and the sensitivity required,[Citation89] as well as what may be practical. Special care may be needed where specific parts of the salivary matrix need to be isolated, for example, specific proteins,[Citation202] lipids (Folch method),[Citation251] or extracellular vesicles (EVs).[Citation252]
Table 2. Pretreatment routines and storage of saliva as listed in the literature. Excludes drug mixture and artificial saliva use.
Owing to their viscous nature, mucins, which are large, glycosylated proteins, can trap substances of interest and potentially interfere with an interspersed plasmonic medium in SERS studies.[Citation50] This may mandate further pre-processing steps. With the addition of a solid-phase extraction step, Inscore et al.[Citation50] managed to measure half the LoD of cocaine in saliva compared to corresponding concentrations in water. Even with the inclusion of a subsequent nanoparticle-SERS step, the complete process was completed in under 10 min. Viscosity is also a problem for the complementary technique of spectrophotometry, which is suitable for elemental analyses such as calcium and magnesium concentrations in saliva. In such cases, saliva samples must be diluted, which is detrimental to analytical sensitivity.[Citation70] In an investigation into the detection of thiocyanate in smokers versus nonsmokers by Wu et al.,[Citation241] saliva samples are diluted by a factor of 10 prior to 30 min 7000 g centrifugation (). Alternatively, there may also be a need to perform such dilution to cause a reduction in the sample viscosity and thus ease of flow through a microfluidic channel.
Figure 5. Methods in Raman and saliva III. A. Gold nanoclusters for SERS detection of methamphetamine (MA) in saliva (i) Scheme of AuNP clusters in 3D oil-water micro-channel. (ii) SERS spectra of MA with a gradient of increasing concentrations from 0 to 100 ppm, dissolved in CHCl3 (Inset is the molecule structure of MA). (iii) Langmuir fitting relationship between the Raman peak I993/665 values and MA concentrations. (iv) 2D SERS spectral mapping of 60 ppm MA. (v) Statistical histograms of I993/665 values. (vi) Real detection and recovery test of saliva samples with gradient-increased MA addition in three parallel samples. LLI = liquid-liquid interface. Adapted with permission from Su (2019). © American Chemical Society 2019. B. Overdose drugs in saliva with gold nanoparticles for SERS analysis. (i) Photograph of SERS-ID (Real-Time Analyzers, Middletown, CT, USA) portable Raman detection system and gold sol-gel capillary tubes for SERS and solid phase extraction. (ii) SERS of (a) 50 ng/mL cocaine, (b) 1 μg/mL PCP, (c) 1 μg/mL diazepam, and (d) 10 μg/mL acetaminophen extracted from saliva. 785 nm laser acquisition. Intensities normalized and offset for clarity. (iii) Detection performance, measured by a “hit quality index” metric (HQI), for cocaine and PCP with similar compounds. Lower HQI represents closer match to spectral database. HQI details found in Farquharson (2011). PCP = phencyclidine aka “angel dust”; cocaethylene = ethylbenzoylecgonine; EMDP = 2-Ethyl-5-methyl-3,3-diphenylpyrroline. Adapted with permission from Farquharson (2011) under Creative Commons BY-NC-SA 3.0. © MDPI 2011. C. SERS study of effect of low-dose radiation on saliva. (i) Typical Raman spectrum of dried saliva. (ii) Superposition of the SERS spectra recorded before (green spectra) and after irradiation (purple spectra) for one of the patients involved in the study. (iii) Statistical analysis of silver nanoparticles diameters obtained from transmission electron microscopy (TEM) images, as in (iv). All spectra recorded with 785 nm laser excitation. Adapted with permission from Colceriu-Şimon (2019) under Creative Commons BY 4.0. © MDPI 2019.
D'Elia et al.,[Citation11] while studying saliva and cocaine, avoid any pretreatment steps by transferring saliva to NMR tubes directly before resonant Raman analysis, an approach which may be more applicable for real-world portable sensors where point-of-need saliva samples cannot be easily or rapidly processed. This approach, however, significantly compromises signal intensity and the resultant LoD of 10 μg/mL is three orders of magnitude above the requisite forensic specification. In a recent study by Hole et al.,[Citation253] the authors use RS to examine the impact of three modes of saliva pretreatment: air-drying, lyophilization, and centrifugation (pellet and supernatant). They conclude that air-dried and lyophilized samples maintain the spectroscopic character of whole saliva, suggesting that minimal processing and freeze-dried storage are most suitable for discriminating pathological salivary samples.
5. Storage
Chevalier et al. have analyzed the longevity of salivary proteins via electrophoresis as a function of time since sample collection, storage temperature, presence or absence of a protease inhibitor, and the removal of insoluble materials. It is well-known that amylase in saliva can degrade salivary proteins. Shorter storage times, lower storage temperatures, with the addition of the enzyme inhibitor, and removal of large material, are all concluded to be beneficial.[Citation122,Citation259] In alignment with the previous mass spectrometry report of Schipper et al.,[Citation27,Citation260] the authors conclude, “In case of a clinical comparison with a pathological condition, control saliva samples should be collected from a healthy nonsmoking subject, in the morning, at least 2 h after eating, and the mouth should be rinsed with water. After collection, saliva samples should be stored in a freezer at −20 °C, and during sampling, saliva should be kept on ice with a protease inhibitor cocktail and centrifuged to remove insoluble material and then stored at −80 °C.” Buchan et al.[Citation157] have recently reported minimal spectral changes in saliva analysis, with RS, over a seven day period when stored at room temperature.
In Raman-saliva studies, Inscore et al.[Citation50] measured drug-doped artificial saliva samples within 60 min of preparation, and Machado et al.[Citation70] has used saliva samples within one day of collection. Elsewhere, Maitra et al.[Citation83] have stored freshly acquired samples at 4 °C–7 °C before transfer to −80 °C in a practical protocol. Many reports, however, do not provide storage details, implying that measurements were taken soon after obtaining the samples. While critical for lab-based work with large sample sizes or protracted studies, storage concerns may be considered mostly irrelevant for the instantaneous portable Raman systems using saliva on-site unless confirmatory steps are required in a laboratory setting at a later stage. Storage considerations might be further highly dependent on the entities desired to be preserved. For instance, exosomes, a class of EVs, are remarkably stable, and in fact, there is a greater concern with the integrity of any attached surface proteins that may not persevere well in ambient or high-temperature storage conditions.[Citation252]
6. Measurement protocols
Spectroscopic saliva measurements lack a standard protocol and thus issues with variability and irreproducibility persist. Maitra et al. and Muro et al. acquire 25-point spectra in saliva measurements,[Citation83,Citation155] and Virkler et al.,[Citation152] 36 random points across a 75 μm × 75μm area. However, many studies appear to rely on considerably fewer measurements, as little as three.[Citation97,Citation99,Citation226] This can create further challenges for subsequent chemometric data analyses where only subtle differences are present in Raman peak intensities between saliva samples and intra-variance in any single sample class is high. Notably, in a biofluid forensics study, Lednev and coworkers, based on their prior individual biofluid investigations, tailor the number of Raman map points and integration times depending on the specific biofluid under interrogation, blood, sweat, saliva, semen and vaginal fluid.[Citation154] Elsewhere, Cottat et al.[Citation118] notes inhomogeneity in terms of the density of the affinity molecules for a liver cancer biomarker and thus acquires 10 separate point measurements across the surface. Wu et al.[Citation241] acquire Raman measurements at multiple different positions on a microfluidic chip, which may serve as a suitable protocol for quantitative measurements but is clearly an added complexity compared to automated single-spot measurements (). Measurements on aluminum or titanium foil for suppressed Raman background signal are common in Raman and saliva studies.[Citation69,Citation83,Citation255,Citation261]
6.1. Drop-casting and dried samples
A widely used approach for preparing liquid samples for Raman measurements is application by (micro)pipette and allowing to air-dry on a supporting surface.[Citation12,Citation106,Citation107,Citation131,Citation262,Citation263] This is known as the “drop-casting” method and is viewed as a quick and easy approach within Raman studies.[Citation264] The technique often results in a highly non-uniform distribution of fluid constituents across the dried spot area due to the evaporation gradient and consequent capillary forces acting on the drying droplet.[Citation265] This somewhat overlooked problem[Citation12] could be mitigated via an absorbent substrate[Citation202,Citation266] or by using the whole saliva fluid and an interspersed plasmonic medium to enhance the Raman signal. The effect can also be pertinent in a functionalized gold nanoparticle film, where the nanoparticles are drop-cast onto the surface before the saliva deposition. If accurate quantitative analysis is required, the exact regions being measured will need to be carefully identified.[Citation60,Citation262]
In some cases, the “coffee rings,” or more precisely, radial surface distributions, can be beneficial,[Citation12,Citation262,Citation267–270] having been used for facilitating the detection of various biomolecules,[Citation263,Citation271–275] and used for concentrating or spatially separating the desired salivary constituents.[Citation276,Citation277] In a proteomic study, Zhang et al.[Citation270] showed that such ring formations remain stable for weeks. We note, the μm- and mm-scale structural patterns in dried drop-casted bio-samples can be used as a visual diagnostic tool,[Citation278] a “Litos test,” as noted by Sefiane,[Citation279] and initially found use in urine sample analysis for urolithiasis.[Citation280] Similarly, Gonchukov et al.[Citation188] noted irregularities of dendritic structure in dried periodontitis saliva samples prior to Raman analysis, and more recently, the technique has been deployed in conjunction with machine learning for discrimination of blood samples of healthy participants pre- and post-exercise with an accuracy of 95%.[Citation281] However, more subtle biochemical changes require the specificity of spectroscopic analysis for unambiguous detection.
In a study on vacuum-dried saliva samples, Malkovskiy et al. report that the location on the dried sample spot has no impact on the measurement. This may be due to the rapid vacuum-dried stage employed by the authors, which mitigates the acting time for capillary forces on the material in the drying saliva drop, resulting in a more homogeneous material distribution.[Citation69,Citation265] Falamas et al.[Citation224] employ a lyophilization (freeze-drying) process. No apparent effect on the classification accuracy by varying measurement location has also been reported by Maitra,[Citation83] who have studied air-dried biofluids on aluminum or titanium slides prior to measurement. Others conduct measurements on dried saliva when investigating methamphetamine or sialic acid in saliva via Raman, respectively.[Citation99,Citation100] In developing a paper-based substrate for SERS with a concurrent ambient pressure mass spectrometry analysis, Díaz-Liñán et al.[Citation282] dry analyte-spiked saliva on a surface before swabbing the tip of the paper substrate across the dried saliva area. While this protocol of swabbed sampling produces a less linear calibration curve, and may induce damage to the sample, the inhomogeneity problems that arise from conventional drop-casting can be mitigated.
Qian et al.[Citation99] show useful optical images of the dried saliva (1 μL) drops, displaying fern-like dendritic formations on the surface, the formation of which was discussed by Pearce and Tomlinson.[Citation283] in the context of tear studies. Such surface inhomogeneity suggests the need for a larger number of measurements. Derjaguin-Landau-Verwey-Overbeek (DLVO) theory, which describes forces between small particles in solution in terms of electrostatic repulsion and van der Waals attraction,[Citation284] can be used to predict the interactions between small particles in solutions, and has been applied in conjunction with finite element modeling to predict the behavior of nanometric particles in a drying drop,[Citation285] although, the theory will need to be modified when applied to biological entities in a complex matrix.[Citation286] Given the simplicity of the drop-casting approach, the development of a saliva-specific model would be desirable.
A direct benefit of measuring air-dried samples is the ease of transportation that may facilitate point-of-care detection and patients’ self-care remotely.[Citation69] In conjunction with developments in portable, easy-to-use lab-on-a-chip devices, this might serve as a catalyst for decentralized medicine and a move away from a single disease diagnosis to a more all-encompassing concept of “health surveillance” and monitoring.[Citation130,Citation287]
6.2. Alternative approaches
Measurement of the saliva in solution, i.e., in a native state, may result in the problem where too few of the target molecules are within the illuminated laser area and consequently, the Raman signal is too low to be of practical use. With a planar nanostructured SERS surface, the target molecules may not be within adequate nanometric proximity to the substrate to experience a sufficient plasmonic enhancement.[Citation288] Therefore, unless the target is present at a high concentration, saliva analysis in a native liquid form requires SERS analysis with interspersed nanoparticles. To note, in complex biological matrices where many different molecular species are present, such as in saliva, and where different moieties may have highly diverse binding affinities to the metal nanoparticles, preferential adsorption could mean the exclusion of the requisite analyte.[Citation65]
Another approach for analyzing saliva in a liquid form might be to employ optical trapping, as has been used recently for red blood cell analysis,[Citation289] relying on radiation pressure from incident light onto a sample to spatially confine a desired salivary constituent, and this could be used in conjunction with a SERS-active medium.[Citation290] Structured light i.e., bespoke polarization, phase, and amplitude, in optical trapping (in 3D: optical tweezers), has recently been reviewed by Yang,[Citation291] including deployment of optical tractor beams, in what could be a kind of nano-factory[Citation292] for manipulation of biofluid constituents on the microscale. Elsewhere, inexpensive and highly absorptive paper-based substrates, which can be simply dipped into the salivary medium, could offer fast and homogeneous detection.[Citation266,Citation293,Citation294] Zangheri et al.[Citation295] explore a paper-based chemiluminescence sensor for salivary cortisol, but this approach hitherto appears to be untested in Raman-saliva studies.
6.3. Raman-saliva studies with functionalized surfaces
Sensing platforms can be designed to be highly analyte-specific by utilizing a range of affinity molecules anchored to the detection surface to provide the required selectivity for the analytes of interest.[Citation67] In some cases, the measured Raman signal is not from the analyte of interest but from a tag molecule in a “labeled” detection assay, where the measurement sensitivity is determined by proxy.[Citation106] Raman peaks of the analyte and affinity molecules may overlap spectrally, and this can hinder analyte detection. Within Raman-saliva studies most investigations avoid any intermediary molecule (functionalized surface, affinity molecules, labeled detection) and use an unmodified Raman detection regime,[Citation10] which is more cost-effective for real-world portable systems.
7. Raman measurement parameters
7.1. Wavelength
A majority of Raman-saliva studies employ a lab-based commercial system (),[Citation12] most commonly applying an excitation laser wavelength of 514/532 nm, 633 nm or 785 nm (). As an exception, D'Elia et al.[Citation105] uses stimulated resonance Raman at 239 nm excitation, establishing a LoD of 10 μg/mL for cocaine in artificially mixed saliva-cocaine samples while pointing out that a laser excitation at 200 nm could decrease the LoD further with significant sensitivity improvement required for forensic drug detection (8 ng/mL). The movement toward shorter excitation wavelengths confers a significant benefit in terms of signal due to the 1/(wavelength)4 dependence of the Raman scattering intensity. Perhaps just as important, UV excitation avoids the need for any pre-concentration or other preparatory step by mitigating the inherent, and masking, effect of absorption from the native oral fluid. However, the well-known damage that UV irradiation may pose to mammalian cells means that the extension of use of UV excitation to healthcare studies might be tentative. Due to the typically large fluorescent background in the UV and visible wavelengths, 785 nm excitation dominates Raman-saliva studies. Clinical Raman applications necessitate the need to balance the inherent wavelength dependence of the Raman scattering cross-section, the presence of the fluorescent background, as well as the quantum efficiency (QE) of any detectors used,[Citation86] where the QE of silicon-based CCDs decreases precipitously in the near-infrared (NIR) spectral range.[Citation296] In micro-spectroscopy applications, the wavelength will also affect the lateral resolution and the probed sample depth.[Citation296,Citation297]
Hernández-Arteaga et al.[Citation200] use a green laser at 532 nm because 785 nm excitation was found to cause an evaporation of the salivary water medium, using silver as the plasmonic enhancing metal, which, unlike gold, exhibits no electronic inter-band transitions in the visible part of the spectrum below 600 nm.[Citation14,Citation68,Citation298] Often, the plasmonic properties of nanostructured SERS substrates dictate the chosen excitation wavelength or vice versa, such as in the study by Cottat et al.[Citation118] who use a 660 nm laser to detect a biomarker for liver cancer via a nanocylinder surface and near-field coupled nanorods. Aluminum (in the nanostructured form) is a well-recognized alternative plasmonic material in SERS[Citation82,Citation299,Citation300] but is also often used as a planar substrate in Raman studies to confer a low background signal rather than plasmonic enhancement.[Citation261]
Resonance of particular substances being investigated might further affect the selection of the excitation wavelength, should for instance, a narrow range of compounds or similar physiological bodies be the target. 1064 nm, for example, has become frequently used in plant studies[Citation301] and has been used in mineralization analysis in dental investigations,[Citation302,Citation303] usually in the form of Fourier transform Raman, which permits fluorescence rejection and a better signal-to-noise profile (Fellgett advantage).[Citation143,Citation304]
7.2. Laser power and optics
Raman-saliva studies often do not include details on the system optics or laser power at the sample surface, i.e., system losses between the source to sample. However, these parameters may play an important role in determining an accurate assessment of the likely laser photo-damage, and the signal uniformity of the acquired measurements since larger laser interrogation areas at the sample surface produce an inherently more uniform signal. When reported, it is clear that a broad range of objective lens types is used ranging from 10×[Citation60,Citation125,Citation200,Citation201,Citation257] to 100× magnifications.[Citation96,Citation118,Citation244] In portable Raman systems,[Citation99,Citation100,Citation146,Citation226] visible in both healthcare and illicit drug applications (), the traversal of the beam through the fiber optics may induce high losses. Zhang et al. discuss the stability of such systems, and Pence et al., the optimization of fiber-optics in Raman for clinical applications.[Citation46,Citation86]
When studying biological materials, minimizing laser exposure can be critical to the consistency of signal measurement. Possible photochemical (bleaching) or sample burning effects can be easily monitored with time-series spectral acquisition. Moreover, induced graphitification may lead to the appearance of artificial carbon D and G spectral bands. Thus, it is paramount to consider the exact substance being detected. For example, Farquharson et al. report single spectrum acquisition times of up to 300 s in the study of overdose drugs (), and D'Elia et al. use long exposure times of 30 s with 20 accumulations in the detection of cocaine in saliva.[Citation105,Citation138] No ill effects are reported. Contrariwise, in a thiocyanate study, Malkovskiy et al.[Citation69] note photobleaching in saliva samples when prolonged high laser power is used, specifically the appearance of S-O Raman features in the 1000–1100 cm−1 region. In SERS measurements, plasmonically driven chemical or thermal effects may further need to be considered.[Citation87]
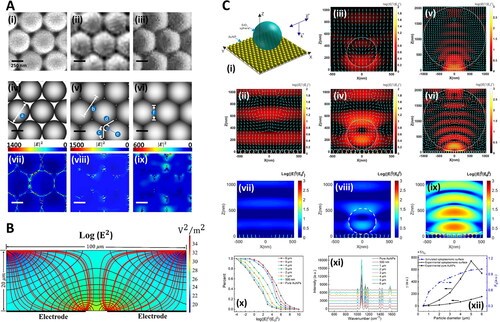
Figure 6. Numerical methods in Raman-saliva studies. A. Optimization of gold-coated polystyrene (Au-PS) bead SERS substrates for bioanalysis. SEM images of Au-PS substrate with different microwave irradiation times TMW (600 W, at 2.45 Hz): (i) 0 s, (ii) 200 s, and (iii) 600 s. (iv–vi) are the corresponding graphical diagrams with different geometries estimated from the SEM images with different TMW for discrete dipole approximation (DDA) modeling. In DDA modeling, the Au-coated PS bead sizes are assumed to have diameters (a) of 500 nm at TMW = 0 s. The center-to-center distance (b) between adjacent PS beads is 500 nm at TMW = 200 s. In the calculation, the geometry of PS beads is defined by physical contacts with adjacent beads over an edge length (c) of 176 nm positioned to another edge (d) at an angle of 120◦ with an arch (e) connecting the two ends of edges at the arch tangent point. At TMW = 600 s, the beads change to hexagonal shapes with side (f) of 288.68 nm in the DDA model. The corresponding |E|2 field distributions of the substrates with 785 nm light excitation under different TMW of 0 s, 200 s, and 600 s, are shown in (vii), (viii), and (ix), respectively. Adapted with permission from Yuen (2010). © John Wiley and Sons 2010. B. Silver nanoparticle electro-migration in dielectrophoretic microfluidic chip for SERS detection of drugs in saliva. Cross-sectional view of the microfluidic channel at midplane of one of the trap zones. Black lines correspond to contours of constant |E|2. Red lines show pathlines of the nanoparticles toward the trap. Highly polarizable nanoparticles migrate from the regions of low electric field intensity to regions of high electric field intensity. Adapted with permission from Salemmilani (2018). © American Chemical Society 2018. C. Optoplasmonic SERS platform for detection of methamphetamine in biofluids. (i) Illustration of model representing optoplasmonic hybrids. E-field intensity maps with time-averaged Poynting vectors (cyan arrows) in the X-Z plane of FDTD-simulated models at the wavelength of 785 nm for (ii) AuNP monolayer, (iii) SiO2 sphere with diameter = 500 nm, (iv) optoplasmonic unit with SiO2 sphere diameter = 500 nm, (v) SiO2 sphere with diameter = 2 μm, and (vi) optoplasmonic unit with SiO2 sphere diameter = 2μm. (vii) FDTD-simulated E-field map in the X-Z plane of AuNP monolayer and optoplasmonic units with different microsphere sizes: (viii) SiO2 particle diameter = 500 nm and (ix) SiO2 particle diameter = 5 μm. (x) Corresponding statistics on the percentage of different enhancement values in the E-field map of X-Z plane. All incident wavelengths in (vii–x) are 785 nm. (xi) SERS spectra of paramercaptoaniline obtained on the optoplasmonic unit with varied diameter (500 nm to 6 μm) of the dielectric sphere. (xii) SERS sensing efficiency γ and E-field enhancing efficiency FE as a function of dielectric particle diameter. The values are based on the SERS peak intensities at 1077 cm−1 in (xi). Adapted with permission from Hong (2020). © American Chemical Society 2020.
While surface powers of ≤5mW are sufficient for laser interrogation in the green region[Citation39,Citation257] and even for 633 nm laser excitation,[Citation47,Citation60,Citation234] higher laser power (≥10mW) is often necessary in the infrared range,[Citation50,Citation145,Citation152,Citation154–156,Citation304] due to the 1/(wavelength)4 Raman scattering signal dependence. The exact power density relies not only on the laser power at the surface but also on the numerical aperture (NA) of the objective lens and the excitation wavelength. Given the frequently used Raman parameters in the Raman-saliva studies, this value would appear to be, theoretically, in the range 105–107W/cm2 (1–100mW/μm2) in most studies.[Citation296] However, assuming an effective NA in excitation which could be two orders of magnitude lower, i.e., NA = 0.01 where the narrow, incident laser beam does not avail of the full width of the focusing objective lens, surface power could be 10–103W/cm2 (1−4–1−2mW/μm2). These values are rarely reported explicitly. Occasionally, a 3D volume is interrogated, obviating the need for any such calculation, as in Farquharson et al.[Citation138] Changes in blood samples due to the photoinduced protein denaturation, followed by hemoglobin aggregation, have been identified at higher laser powers.[Citation305] The effect of potential photo-damage to the salivary medium specifically is yet to be established.
8. SERS studies of saliva
Almost three-quarters of the Raman-saliva studies surveyed include some form of SERS () since many compounds in saliva, whether physiological or pharmaceutical in origin, are present in small quantities and thus often require an ultra-sensitive detection method. While early SERS studies centered on roughened electrodes,[Citation306] and nanoparticles remain in common use, nanostructured surfaces as enhancing media have been gaining interest.[Citation307] Intricately patterned top-down fabricated SERS substrates[Citation308–313] and inexpensive, high sensitivity, bottom-up SERS platforms[Citation113,Citation314–325] have been emerging, building upon the significant advances in nano-fabrication technologies.[Citation309,Citation326,Citation327] Alternative approaches also exist, for instance, Su et al.[Citation256] use large AuNP clusters (), and recently, Velička et al.[Citation258] have used an electrochemical SERS silver electrode set-up to detect caffeine in saliva. SERS is viewed as a promising route to accelerate the adoption of Raman spectroscopy for biostudies.[Citation15,Citation64,Citation81,Citation87,Citation104,Citation328,Citation329] In a recent breast cancer study, Feng et al.[Citation97] note that healthcare studies using standard Raman spectroscopy might be inhibited by the small Raman cross-section of protein bands and large fluorescent background signal with low sensitivity to, often subtle, biochemical changes. Most studies within SERS employ gold or silver as the plasmonic medium. Gold is biocompatible being a highly inert material, while silver has well-known toxicity in bio-systems, and silver nanoparticles (AgNPs) have been shown to produce toxic effects.[Citation330,Citation331]
SERS can now be viewed as an analytical technique,[Citation332] although the emphasis is on the end-user as to what reproducibility is required.[Citation104] It is widely accepted that depending on the application, there are various requirements from SERS in terms of the analytical sensitivity, signal uniformity, and reproducibility,[Citation85,Citation104] with Bell et al.[Citation333] recently highlighting the methods to standardize SERS measurements, including better analyte control and instrumental factors. The non-linear nature of SERS entails increasingly large enhancements as the surface features become truly nanometric and the electric fields are increasingly localized. Notably, Fang et al.[Citation112] showed that 24% of the SERS signal originated from a mere 63 out of 1,000,000 surface sites on a silver nanosphere SERS surface. However, there is also progressively less control of the morphology of the surface features as they get smaller, and this tradeoff between sensitivity and feature control is often termed the “SERS Uncertainty Principle.”[Citation334]
SERS has the potential to detect a wider range of compounds and provide better detection threshold than ELISA (10−6–10−8M) or high-performance liquid chromatography (HPLC) fluorescence (10−7M).[Citation118] Durucan et al.[Citation335] have introduced a SERS-assisted chromatography device using a nanopillar platform, which considerably improves sample throughput compared to mass spectrometry.
8.1. SERS sensitivity, reproducibility and reusability
In contrast to the trends in analytics,[Citation236] SERS studies routinely report figures of merit. However, there is a significant variation in the reporting of SERS substrate performance in the literature[Citation113] with differences in enhancement reference methods and enhancement factor calculations.[Citation14,Citation106] Zhang et al.[Citation257] for instance, use bulk dye powder as the reference, while other researchers in the broader SERS literature report the use of solutions in cuvettes, and these vary further in how the liquid reference is calculated.[Citation113,Citation317] Comprehensive details on a range of procedures and calculations for SERS are given by Le Ru and Etchegoin.[Citation14] The SERS enhancement factor (EF) is a measure of the increase in the Raman signal of a characterizing analyte molecule or the requisite compound in the study, compared to an unenhanced reference sample. Alternatively, more readily understood metrics such as the LoD and the Limit of Quantification (LoQ) can be used to quantify the sensitivity and performance of SERS substrates.[Citation14,Citation332]
Reproducibility of SERS measurements is reported less often, despite having been discussed by Natan at the first Faraday Discussion on SERS in 2005.[Citation334] Wang et al. characterizes the reproducibility and uniformity of the signal performance of a tightly packed gold nanoparticle-on-glass substrate by analyzing the relative standard deviation (RSD) with multiple measurements on the same substrate (spot-to-spot) as well as comparing between different substrates (batch-to-batch), with values of 2.37% and 3.34%, respectively (n = 19).[Citation99] Su et al.[Citation256] report a RSD of 7.8% using AuNP clusters in a microfluidic channel (). Microfluidic SERS, of likely use for in-the-field saliva analysis, can circumvent a well-known reproducibility problem in SERS, where it is difficult to control the distribution of analyte molecules across the SERS-active area. This is achieved by measuring the analyte in the aqueous phase.[Citation241] However, this does not mitigate any inherent variability in the plasmonic properties of the SERS substrate due to imperfections in the nanostructured morphologies. Reusable SERS-based microfluidic devices have appeared for potential in-field application (),[Citation47,Citation146] however, typically, SERS substrates are not reusable, with analytes adsorbing to metal surfaces, laying the need for developing cost-effective disposable SERS substrates.[Citation85,Citation308,Citation336]
8.2. Raman versus SERS
Differences can exist between Raman and SERS spectra. This can include orientation effects relative to the incident radiation induced by the nanostructure topographies,[Citation296,Citation337] or affinity molecules with specific moieties being more proximal to the high local electric fields[Citation11] or alterations to the Raman polarizability, which can increase the Raman cross-section by bringing the vibrational resonance closer to the laser excitation wavelength.[Citation87] Colceriu-Șimon et al.,[Citation96] studying saliva and gold nanoparticles on a CaF2 substrate, notice significant differences between saliva spectra for Raman and SERS where the most prominent peak of thiocyanate at 2107 cm−1 is only apparent in the SERS spectrum, which the authors attribute to a high affinity of the thiocyanate ion to metallic surfaces (). Contrariwise, no such effects appear to be prominent in a SERS study of overdose drugs in saliva, where a Raman database is used to identify the different compounds.[Citation50] Shende et al.[Citation141] record preferential adsorption in a SERS study of cocaine, caffeine, and phenobarbital, depending on the metal chosen as the plasmonic enhancer, while other drug studies make similar observations.[Citation11,Citation50,Citation338] More generally, the variable affinity of various compounds to the plasmonic metal, usually gold or silver to provide significant enhancements in the visible range, may be underappreciated in SERS.[Citation48,Citation339]
8.3. SERS-saliva studies with functionalized surfaces
Durucan et al.[Citation335] purport that non-functionalized SERS is rare in the real world, citing lower sensitivity and quantification difficulties in multi-component samples where nonspecific binding of interloping substances and competitive adsorption is problematic. For instance, an aptamer-functionalized gold SERS substrate has been used to detect a liver cancer biomarker in saliva at the nM range.[Citation118] Functionalizing SERS surfaces, however, adds system complexity, increases costs, and most of the saliva studies that utilize SERS use an unmodified SERS platform. Linker molecules create further challenges of preferential enhancement due to increased proximity to the SERS surface over the analyte molecules, such is the short-range nature of SERS (<10nm) and the precipitous drop in the electric field intensity away from the plasmonic surface.[Citation340,Citation341]
8.4. SERS highlights from the Raman-saliva literature
The use of sol-gels to create a disposable device that can separate drug components in low volumes of saliva for SERS measurements has been extensively investigated by Farquharson and coworkers ().[Citation50,Citation119,Citation142,Citation143,Citation145,Citation342] The studies have demonstrated an ability to track chemotherapy drugs and illegal drugs to an LoD of 2 μg/mL for 5-fluorouracil and 50 ppb for cocaine, respectively.[Citation50,Citation143] The sol-gels are formed by two precursor solutions, a silver amine complex and an alkoxide solution,[Citation143] mixed and spin-coated in a glass vial, followed by a reduction of the silver ions with sodium borohydride. The excess reagent is then flushed away with water. Remaining is the sol-gel, which is collected and packed into a capillary, providing NP stability. The sol-gel allows for the NPs to be trapped at a set size and aggregation. The small diameter and the fast measurement time of the capillary sol-gel device render it attractive for SERS measurements of salvia with merely 100 μL of the biofluid required, which can be collected and measured within 5 min.[Citation142]
Yuen et al. have shown Raman bands of saliva spectra to be preferentially enhanced via microwave heating (200 s, 600 [email protected]), arising due to nanoscale changes to gold-coated polystyrene bead nanostructures (). Contrariwise, subsequent heating (600 s) appears to quench the intensity of certain spectral bands disproportionately.[Citation193,Citation194] It is unclear whether this is purely a degradative photochemical[Citation296] or a plasmonic effect, where an alteration to the nanostructure topologies and roughness affects the relative enhancement of the respective salivary Raman bands. Mohammadi et al.[Citation343] report SERS measurements of methamphetamine-doped artificial saliva focusing on the EF optimization of graphene-based materials on a dendritic silver SERS surface. Graphene oxide (GO) and gold nanoparticles (AuNPs) have been used to form a GO-AuNP nanocomposite SERS surface for application in a saliva study of gastric cancer.[Citation257] Here, rather than an electromagnetic or chemical SERS enhancing material,[Citation344] GO acts as a reductant in the AuNP synthesis, surfactant, as well as the supporting structure, aiding surface uniformity.
Figure 7. Study of microfluidic channel for Raman-saliva of thiocyanate. (i) Plot of peak intensity at 2108 cm−1 as a function of channel positions for the detection of 8, 32 and 128 μM thiocyanate (SCN−). The numbers on the x-coordinate represent the sequence number for the 12 periods of the winding channel. The signals were collected at the end of each period as shown in the scheme in (ii). (iii) Concentration-dependent SERS spectra for SCN− detection. (iv) Plot of peak intensity at 2108 cm−1 as a function of SCN− concentration. (v) Comparison of peak intensity at 2108 cm−1 of Au@Ag nanorods mixed with different anion ions. (vi) Plot of peak intensity at 2108 cm−1 as a function of time for SCN− detection in the microfluidic channel. (vii) Plot of peak intensity at 2108 cm−1 from 16 randomly selected spots for SCN− detection on metal substrate (AV = average, SD = standard deviation, CV = coefficient of variation i.e. %RSD). (viii) Plot of peak intensity at 2108 cm−1 as a function of time for the detection of 8, 32 and 128 μM SCN− on metallic substrate. All error bars indicate the standard deviation of 5 different measurements. Adapted with permission from Wu (2014) © Elsevier 2014.
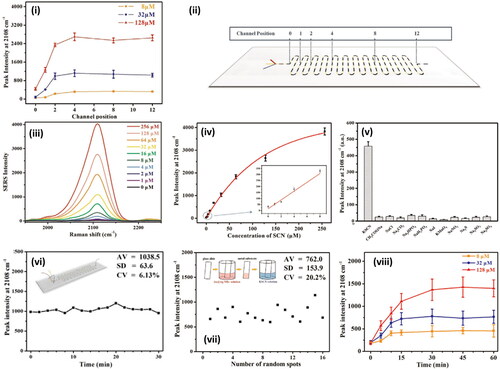
Zheng et al.[Citation345] show detection of silver (I) and mercury (II) ions in saliva via extrinsic SERS. In an intricate preparatory sequence, the authors fabricate a gold-covered titanium nanohole SERS surface pre-functionalized for single-strand DNA (ssDNA). Concurrently, gold-silica core-shell nanostars are fabricated and functionalized for the complementary ssDNA strands. Raman dye reporter molecules are sandwiched between the silica shells (3 nm) and gold stars (∼80nm). Subsequently, depending on the exact base pair sequence of the ssDNA used, the presence of Ag+ or Hg2+ can be confirmed due to these metal ions acting as intermediaries promoting the binding of the ssDNA strands. With the removal of the excess ssDNA and hence, the attached gold nanostars and the embedded Raman dye, the measured SERS signal indirectly indicates the concentration of metal ions present in the saliva sample. The gold nanohole substrate enhances the SERS signal by inducing strong plasmonic coupling with the nanostars.
Han et al.[Citation346] have developed a SERS platform utilizing a novel DNA immunoassay. The platform is based on 23 nm diameter AuNPs functionalized with left and right DNA strands, with Malachite Green dye used as the Raman reporter. This assay, specifically designed to target the biomarker S100P associated with oral squamous cell carcinoma, demonstrates a LoD of 3 nM for detecting the isolated biomarker. Salemmilani et al.[Citation47] present a AgNP SERS chip system employing dielectrophoretic aggregation to facilitate reusability. The authors show minimal nanoparticle fouling and chemical cross-contamination over three cycles (). Yang et al.[Citation146] study a magnetically induced colloidal SERS assay for the detection of cotinine, a nicotine metabolite, and benzoylecgonine, a cocaine metabolite, in saliva (). In this reusable SERS system, consisting of Fe3O4 and AuNPs linked by IP6 molecules, a RSD of 1.75% is reported using Rhodamine 6G.
The development of a microfluidic SERS sensor has been demonstrated by Sivashanmugan et al.[Citation148] who use diatom bio-silica surface channels, which allow for trace detection of tetrahydrocannabinol. The porous channels are based on a diatom frustules substrate with AgNP grown in-situ on the surface. The substrate is placed in a microfluidic chip to chromatographically separate molecules from the biological complex with a SERS section for measurements. The diatom substrate has a porous surface enabling hot spots between the AgNPs in the pores, attributed to the achieved ultrahigh SERS sensitivity. The authors successfully identify tetrahydrocannabinol in saliva to a detection limit of 10−9M in unprocessed saliva and 10−12M in a water-diluted and centrifuged salivary sample.[Citation196]
8.5. Numerical methods in SERS and saliva studies
Briefly, we also describe numerical studies within a Raman and saliva context, which are uncommon despite recognition that the development of SERS substrates is key to the progress of saliva in disease diagnosis.[Citation64] In many cases, the SERS media used already have well-understood electromagnetic behavior i.e., spherical metal nanoparticles. In the broader SERS literature, numerical studies almost always model the local electric fields surrounding metal nanostructures, typically by the finite element method (FEM), finite difference time domain method (FDTD), or a discrete dipole approximation approach (DDA).[Citation14,Citation298] Following an initial substrate characterization study,[Citation193] Yuen et al.[Citation194] modeled the far-field extinction i.e., −ln(transmittance), and SERS performance of microwave-irradiated polystyrene beads with DDA noting surface roughness and small gaps proved beneficial for larger enhancement (). These kinds of effects are well-known in SERS and hark back to SERS’ electrochemically roughened electrode beginning.[Citation110,Citation312,Citation347]
While the behavior of evaporating droplets has been numerically modeled,[Citation285,Citation348,Citation349] and thus predictions on the spread of simple particulate matter can be made, this does not necessarily extend to more complex heterogeneous media, such as saliva and other biofluids. Further investigation in this area might prove useful. Analogously, as portable devices emerge, saliva studies would benefit from fluid flow models through microfluidic systems, which could inform on the dilution needed to achieve optimal channel passage i.e., viscosity, while mitigating detrimental effect on analytical sensitivity. For instance, Lee et al.,[Citation240] in a salivary microfluidic channel study into cotinine, a nicotine metabolite, simulate the fluid dynamics through the microfluidic geometry with FEM, noting that a drag force threshold exists that can impact antibody-antigen interaction.
Nanosystems combining photonic and plasmonic components have recently found sensing applications,[Citation350] notably whispering gallery mode sensors.[Citation351] In a Raman-saliva context, Hong et al.[Citation195] have presented an optical-plasmonic hybrid FDTD model consisting of an AuNP underlayer and a larger silica microsphere (). The authors measure methamphetamine-doped urine and saliva with the optoplasmonic arrangement, presenting spectra down to concentrations of 1 × 10⁻⁸M and 1 × 10⁻⁹M, respectively. Zhang similarly explores an FDTD model but studies plasmonic coupling between a nanohole array and proximal nanostars.[Citation345] As an alternative application of numerical methods, Salemmilani et al.[Citation47] have investigated the electromigration of AgNPs in a dielectrophoretic SERS microchip with a FEM model, enabling the optimum location for SERS measurements to be determined and thus the identification of methamphetamine in saliva via a chemometric model ().
Numerical methods can be computationally expensive, especially when high system fidelity in three dimensions is needed, and lately, reports have emerged, in nanostructure electromagnetic field and optics simulation,[Citation317,Citation352–355] as well as in fluid dynamics,[Citation356,Citation357] of using machine learning to improve efficiency while achieving suitably accurate results.
9. Data analysis
Datasets are increasingly large in modern science and the challenge is in the extraction of useful information.[Citation8,Citation236] This is implied in the concept of “big data” with datasets set to be analyzed computationally in order to be analyzed meaningfully. Here, we summarize the standard spectra pre-processing methods, (univariate) statistical analysis, and the various multivariate techniques used in Raman-saliva studies. In a recent esophageal cancer study, Maitra et al.[Citation83] analyze, using Raman spectroscopy, not only saliva but also urine, serum, and plasma, and with the optimal quadratic discriminant analysis algorithm, saliva and urine are shown to provide the best classification accuracy, with saliva requiring the fewest selected variables from the spectra.
9.1. Spectra pre-processing
In the Raman-saliva literature, various pre-processing methods are used, including normalization, smoothing, cosmic ray and background removal (). For baseline subtraction, an asymmetric least square (AsLS) method[Citation83,Citation103,Citation155,Citation223,Citation239] or a high order polynomial fit[Citation97,Citation99,Citation220,Citation227,Citation244,Citation358] are often applied. Normalization is performed using the area under the curve[Citation103,Citation155,Citation227,Citation239] with several studies using peak normalization.[Citation217,Citation219,Citation220,Citation223,Citation227,Citation244] Spectral smoothing has been carried out with the Savitsky-Golay filter,[Citation155,Citation213,Citation244] however, the window and the polynomial order are not always noted. Acquarelli et al.[Citation359] have shown that, depending on the specific sample interrogated (wines, beers, coffees, pharmaceutical tablets etc.), the technique used (Raman, IR), and algorithm employed, differing optimal pre-processing pipelines exist, which exclude some procedures and require those used to be applied in a certain order for the best classification accuracy i.e., there is no one-size-fits-all approach. Therefore, despite the similarities in pre-processing procedures in the current Raman-saliva literature, a saliva-specific investigation into optimal pre-processing pathways, with reference to the desired application, may be necessary.
Figure 8. Procedures for Raman data processing and analysis. Red line is the most common data processing path among researchers in Raman-saliva studies*. A: data collection, B: baseline subtraction, C: normalization D: data cleaning in the form of dimensionality reduction/feature extraction E: classification F: results H: bypass of pre-processing steps. *Based on a subset of computationally focused Raman-saliva studies.
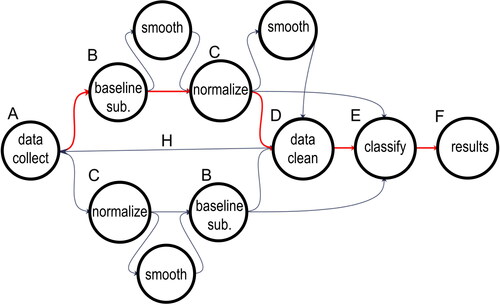
A dimensionality reduction step may be further employed to reduce the computational load before a subsequent classification algorithm is applied. Often used in Raman-saliva studies is the unsupervised Principal Component Analysis (PCA) method,[Citation83,Citation97,Citation98,Citation215,Citation221,Citation223,Citation227,Citation244,Citation360] which separates unknown spectra by redefining the co-ordinate system to maximize the variation. Dies et al.,[Citation244] for instance, employ PCA to discriminate between different drugs in water and subsequently, spiked cocaine in saliva (). Hence, PCA may be used not only for dimensionality reduction but also classification outright. PCA permits the recognition of the most important peaks responsible for the variation between the inputted spectral data set, i.e., the PCA loadings. The most important peaks in Raman-saliva studies can also be identified via genetic algorithms (GAs).[Citation83,Citation103,Citation239]
9.2. Single variable statistical data analysis
Spectral features can be compared with statistical methods, primarily, hypothesis p-value testing for singular variables. The Student’s t-test [Citation153,Citation215,Citation217,Citation219,Citation225,Citation227] and (Wilcoxon-)Mann-Whitney U test[Citation125,Citation200,Citation222] have been used to study specific peaks or validate multivariate outputs. This analysis of singular variables allows for a strong depiction of the statistical relevance of a spectral feature adding to the data interpretation.
9.3. Multivariate data analysis
Traditionally, Raman spectra have been analyzed by selecting known peaks and monitoring changes in the intensity of these manually or with a classification algorithm. More recently, the whole spectrum has been investigated with multivariate techniques, with each datapoint representing a variable. Subtle differences between spectra can be identified and classification performed following in-feed of training data.[Citation332,Citation361] This comprehensive approach obtains information not just from peaks and troughs of the most important Raman bands but also uses the shape of these peaks alongside hitherto unappreciated variations across the entire spectrum. Therefore, for a complete analysis of complex biological processes in saliva, multivariate analysis is commonly recommended.[Citation8,Citation61,Citation86]
In multivariate analysis, after initial PCA application, or feature extraction step otherwise, a supervised classification algorithm such as linear/quadratic discriminant analysis (L/QDA), or support vector machine (SVM) learning,[Citation2,Citation83,Citation99,Citation155,Citation204,Citation244,Citation362] is employed. Partial least squares (PLS) analysis is a dimensionality reduction technique similar to PCA that additionally accounts for the correlation between the independent and dependent variables. It is also often paired with DA for classification purposes (PLS-DA) ().[Citation97,Citation197]
The use of algorithmic means is termed machine learning (ML), even often when unsupervised procedures are used. ML is frequently considered a subset of artificial intelligence and is used extensively in the Raman-saliva literature and ever more by the academic community at large. Increasingly common in classification is “deep learning” where feature extraction is a heavily layered algorithmic process used to further enhance the diagnostic performance.[Citation89,Citation246,Citation359,Citation363] Notably, deep learning includes artificial neural networks (ANNs), which mimic the neuronal networks in the brain.[Citation103,Citation238,Citation239] Here, layers of interconnected nodes are activated to various degrees contingent on the data supplied. Inter-nodal connections, “synapses,” are assigned weights, which may be modified via a backpropagation algorithm designed to minimize error, a loss function, between predicted outputs and desired outputs.[Citation246] Recently, ML has been highlighted as a valuable support tool to supplement medical diagnoses, reducing human error, across a wide range of medical fields,[Citation364] even via patient-led smartphone applications.[Citation365–367]
9.4. Sample size in Raman-saliva machine learning studies
In supervised ML the data acquired is split into test and training sets, and a sufficiently large number of training samples is usually required to have a meaningful model. Beleites et al.[Citation368] have recommended 75–100 samples per class for optimal training, based on computational experimentation. Unfortunately, acquisition of such large sample sizes is often problematic in healthcare studies, especially when subclasses of disease exist, for example, varying cancer stages.[Citation60] The importance of having a large enough sample size is to reduce overfitting, which corresponds to the model's inability to generalize, i.e., the model develops bias toward the training samples, becoming unable to interpret samples from outside that of the training sample space. Test-training separations of 80%/20%[Citation83,Citation125,Citation132,Citation239,Citation369] are apparent in Raman-saliva studies, however, Raman studies on saliva have also been performed with 90%/10%[Citation204] and 60%/40% splits.[Citation362]
Within chemometric-focused Raman-saliva studies, there is a range of sample sizes used varying from 20 samples (10 healthy/10 unhealthy)[Citation96,Citation103,Citation215] to 128 (64 healthy/64 unhealthy) samples in total.[Citation132,Citation238,Citation360,Citation369] Healthy/unhealthy patient splits usually are approximately equal. Radzol and coworkers gather data from a Raman spectral databank, which is easier to obtain than clinical samples from patients.[Citation132,Citation360,Citation369] As an important distinction, it is noted that large spectral datasets do not necessarily equate to a more accurate model diagnostically when obtained from a small sample cohort, i.e., few independent samples,[Citation368] although this may nevertheless assist in accounting for the inherent variation between the native salivary constituents. Recently, Guo et al.[Citation370] have proposed modified PCA and PLS algorithms accounting for (i.e., subtracting/mitigating) intra-class variance to improve feature extraction and classification accuracy.
The accuracy of the models is evaluated via assessment of the diagnostic sensitivity (true positive rate) and the diagnostic specificity (true negative rate), often in conjunction with receiver operating characteristic curves ((iii)). In conjunction with ensuring the reproducibility and accuracy of the acquired data sets, validation, i.e., testing with an externally acquired dataset, is further necessary and is generally unconsidered in Raman-saliva studies targeting specific diseases.[Citation236] In a Raman-saliva study into Dengue fever, Othman et al.[Citation360] have investigated the effect of principal component retention criteria (eigenvalue one criterion, cumulative percentage variance, and scree test) alongside varying numbers of ANN layers. Finally, we note that many other chemometric techniques are in use within the spectroscopy field[Citation371,Citation372] and there is a need to compare the different algorithms on the same dataset.[Citation236]
10. Outlook
Several popular Raman approaches would appear to be overlooked in the Raman-saliva literature. First, there are no reports using tip-enhanced Raman spectroscopy (TERS), which uses scanning probe microscopy setups in combination with plasmonic materials to provide high sensitivity and resolution.[Citation82,Citation373–375] This approach could be helpful to characterize specific salivary components. Second, no uses of hydrophobic surfaces are observed[Citation320,Citation376–380] or surfaces otherwise deliberately functionalized to alter the wetting properties of drop-cast saliva and the subsequent deposition pattern of salivary components by, for instance, mitigating contact line pinning in a drying microdroplet.[Citation270] Su et al.[Citation256] hydrophilize (through hydroxylation) microfluidic glass channels via Piranha solution treatment followed by a 12 hour NaOH immersion.
A single study of shell-isolated nanoparticle enhanced Raman spectroscopy (SHINERS) is presented by Al-Ogaidi et al.,[Citation226] detecting glucose in saliva with SiO2-covered AuNPs. SHINERS are core-shell nanoparticles for SERS consisting of a plasmonically active core material surrounded by a thin, inert shell, often silica, ensuring that the inner material does not participate in any adsorption with the analyte.[Citation381] Given the potential interferents in saliva, or indeed any bio-matrix, their exclusion from the literature at present might seem surprising. Perhaps most surprisingly, however, resonance Raman effects are seemingly seldom employed.[Citation105]
11. Conclusions
Saliva is a promising biofluid for use in bedside, roadside, pitch-side, or other point-of-need settings. Combined with Raman spectroscopy, faster, more accurate, and multiplexed determinations could be made, whether the analytes be physiological or pharmaceutical in origin. In this review we have reported the common methods employed in the collection, pretreatment, and storage of saliva within Raman studies, alongside subsequent aspects of the measurement procedures, and Raman parameters used. Given the need to detect low concentrations or subtle changes in compounds of interest, we have further surveyed SERS methods employed and summarized data analysis techniques.
A variety of methods are evident across the various experimental facets, and hence we conclude there is little adoption of standard procedures. In some, such as saliva storage, good guidelines exist elsewhere, and these could be fine-tuned to the needs of the spectroscopist or with specific applications/analyte molecules in mind. For other aspects, such as the use of drop-casting and the effect of measurement on inhomogeneous surface distributions, there will need to be more careful consideration within a saliva context. SERS is commonplace within the Raman-saliva literature, although a greater focus on substrate development, including numerical models, may be required. A wide range of chemometrics is employed, and more comparisons of these techniques side-by-side in the same saliva study would be useful. Many of these concerns may, in fact, be indicative of the emergent nature of the field, with majority of studies being preliminary. With the standardization of collection, storage, and Raman measurement protocols for saliva, coupled with technological development into portable, even handheld, devices, advances in data science, as well progress in SERS substrate development, Raman-saliva can become a biofluid-spectroscopy combination for real-world applications.
Author contributions
MH, LK and PGO conceptualized the review. MH drafted the review and performed the meta-analyses. MH, LK, PDCG, EB & HOMC collated data from the literature. LK collated data for and . PDCG contributed to the section on data analysis. LK contributed to sections on data analysis and SERS. PDCG analyzed chemometric trends. EB provided input on microfluidic devices and HOMC on dental/orthodontic studies. MC contributed to obtaining rights and permissions. MH and PGO were in charge of the overall direction and planning, supervised the review, guided, revised and overall edited the manuscript. All authors have given approval to the final version of the manuscript. All authors discussed the review and commented on the manuscript.
Acknowledgments
We acknowledge funding from the Wellcome Trust (174ISSFPP), the Royal Academy of Engineering (RF1415\14\28), the Defence Science and Technology Laboratories (DSTLX-1000098511) and the EPSRC (EP/V029983/1). P.G.O. is a Royal Academy of Engineering Research (RAEng) Fellowship holder.
Disclosure statement
The authors declare no conflict of interest. The authors do not endorse nor have any relationship with any of the companies mentioned herein.
Data availability statement
All data used in meta-analyses in is available in Table S1 in Supporting Information.
Notes
1 In 2020 a fourth pair of salivary glands, the “tubarial glands,” found in the torus tubarius section of the nasopharynx, were identified [Citation382]. The designation of these structures as a salivary gland is being disputed.
References
- Atkins, C. G.; Buckley, K.; Blades, M. W.; Turner, R. F. B. Raman Spectroscopy of Blood and Blood Components. Appl. Spectrosc. 2017, 71, 767–793. doi:https://doi.org/10.1177/0003702816686593
- Sikirzhytski, V.; Sikirzhytskaya, A.; Lednev, I. K. Advanced Statistical Analysis of Raman Spectroscopic Data for the Identification of Body Fluid Traces: Semen and Blood Mixtures. Forensic Sci. Int. 2012, 222, 259–265. doi:https://doi.org/10.1016/j.forsciint.2012.07.002
- Sikirzhytski, V.; Sikirzhytskaya, A.; Lednev, I. K. Multidimensional Raman Spectroscopic Signature of Sweat and Its Potential Application to Forensic Body Fluid Identification. Anal. Chim. Acta. 2012, 718, 78–83. doi:https://doi.org/10.1016/j.aca.2011.12.059
- Cennamo, G.; Montorio, D.; Morra, V. B.; Criscuolo, C.; Lanzillo, R.; Salvatore, E.; Camerlingo, C.; Lisitskiy, M.; Delfino, I.; Portaccio, M.; et al. Surface-Enhanced Raman Spectroscopy of Tears: Toward a Diagnostic Tool for Neurodegenerative Disease Identification. J. Biomed. Opt. 2020, 25, 1–12. doi:https://doi.org/10.1117/1.JBO.25.8.087002
- Kuo, M. T.; Lin, C. C.; Liu, H. Y.; Chang, H. C. Tear Analytical Model Based on Raman Microspectroscopy for Investigation of Infectious Diseases of the Ocular Surface. Invest. Ophthalmol. Vis. Sci. 2011, 52, 4942–4950. doi:https://doi.org/10.1167/iovs.10-7062
- Pastare, D.; Bennour, M. R.; Polunosika, E.; Karelis, G. Biomarkers of Multiple Sclerosis. Open Immunol. J. 2019, 9, 1–13. doi:https://doi.org/10.2174/1874226201909010001
- Poste, G. Bring on the Biomarkers. Nature 2011, 469, 156–157. doi:https://doi.org/10.1038/469156a
- Surowiec, I.; Skotare, T.; Sjögren, R.; Gouveia-Figueira, S.; Orikiiriza, J.; Bergström, S.; Normark, J.; Trygg, J. Joint and Unique Multiblock Analysis of Biological Data - Multiomics Malaria Study. Faraday Discuss. 2019, 218, 268–283. doi:https://doi.org/10.1039/c8fd00243f
- Liu, J.; Duan, Y. Saliva: A Potential Media for Disease Diagnostics and Monitoring. Oral Oncol. 2012, 48, 569–577. doi:https://doi.org/10.1016/j.oraloncology.2012.01.021
- Bonifacio, A.; Cervo, S.; Sergo, V. Label-Free Surface-Enhanced Raman Spectroscopy of Biofluids: Fundamental Aspects and Diagnostic Applications. Anal. Bioanal. Chem. 2015, 407, 8265–8277. doi:https://doi.org/10.1007/s00216-015-8697-z
- D'Elia, V.; Montalvo García, G.; García Ruiz, C. Spectroscopic Trends for the Determination of Illicit Drugs in Oral Fluid. Appl. Spectrosc. Rev. 2015, 50, 775–796. doi:https://doi.org/10.1080/05704928.2015.1075206
- Butler, H. J.; Ashton, L.; Bird, B.; Cinque, G.; Curtis, K.; Dorney, J.; Esmonde-White, K.; Fullwood, N. J.; Gardner, B.; Martin-Hirsch, P. L.; et al. Using Raman Spectroscopy to Characterize Biological Materials. Nat. Protoc. 2016, 11, 664–687. doi:https://doi.org/10.1038/nprot.2016.036
- Long, D. A. The Raman Effect: A Unified Treatment of the Theory of Raman Scattering by Molecules; John Wiley and Sons: London, 2002.
- Le Ru, E. C.; Etchegoin, P. G. Principles of Surface-Enhanced Raman Spectroscopy: And Related Plasmonic Effects; Elsevier: Amsterdam, 2009. https://doi.org/10.1016/b978-0-444-52779-0.00008-8.
- Procházka, M. Surface-Enhanced Raman Spectroscopy: Bioanalytical, Biomolecular and Medical Applications; Springer: New York, 2015.
- Rohman, A.; Windarsih, A.; Lukitaningsih, E.; Rafi, M.; Betania, K.; Fadzillah, N. A. The Use of FTIR and Raman Spectroscopy in Combination with Chemometrics for Analysis of Biomolecules in Biomedical Fluids: A Review. BSI. 2020, 8, 55–71. doi:https://doi.org/10.3233/BSI-200189
- Baker, M. J.; Byrne, H. J.; Chalmers, J.; Gardner, P.; Goodacre, R.; Henderson, A.; Kazarian, S. G.; Martin, F. L.; Moger, J.; Stone, N.; Sulé-Suso, J. Clinical Applications of Infrared and Raman Spectroscopy: State of Play and Future Challenges. Analyst 2018, 143, 1735–1757. doi:https://doi.org/10.1039/C7AN01871A
- Goodacre, R.; Baker, M. J.; Graham, D.; Schultz, Z. D.; Diem, M.; Marques, M. P.; Cinque, G.; Vernooij, R.; Sulé-Suso, J.; Byrne, H. J.; et al. Biofluids and Other Techniques: General Discussion. Faraday Discuss. 2016, 187, 575–601. doi:https://doi.org/10.1039/C6FD90014C
- Baker, M. J.; Hussain, S. R.; Lovergne, L.; Untereiner, V.; Hughes, C.; Lukaszewski, R. A.; Thiéfin, G.; Sockalingum, G. D. Developing and Understanding Biofluid Vibrational Spectroscopy: A Critical Review. Chem. Soc. Rev. 2016, 45, 1803–1818. doi:https://doi.org/10.1039/c5cs00585j
- Pfaffe, T.; Cooper-White, J.; Beyerlein, P.; Kostner, K.; Punyadeera, C. Diagnostic Potential of Saliva: Current State and Future Applications. Clin. Chem. 2011, 57, 675–687. doi:https://doi.org/10.1373/clinchem.2010.153767
- Kefalides, P. T. Saliva Research Leads to New Diagnostic Tools and Therapeutic Options. Ann. Intern. Med. 1999, 131, 991–992. doi:https://doi.org/10.7326/0003-4819-131-12-199912210-00102
- Edgar, M.; Dawes, C.; O’Mullane, D. Saliva and Oral Health, 3rd ed.; BDJ Books: London, 2004.
- Ericsson, Y. Clinical Investigations of the Salivary Buffering Action. Acta Odontol. Scand. 1959, 17, 131–165. doi:https://doi.org/10.3109/00016355908993928
- Dodds, M.; Roland, S.; Edgar, M.; Thornhill, M. Saliva: A Review of Its Role in Maintaining Oral Health and Preventing Dental Disease. BDJ Team 2015, 2, 15123. doi:https://doi.org/10.1038/bdjteam.2015.123
- de Almeida, P. D. V.; Grégio, A. M. T.; Machado, M. Â. N.; De Lima, A. A. S.; Azevedo, L. R. Saliva Composition and Functions: A Comprehensive Review. J. Contemp. Dent. Pract. 2008, 9, 72–80. doi:https://doi.org/10.5005/jcdp-9-3-72
- Edgar, W. Saliva: Its Secretion, Composition and Functions. Br. Dent. J. 1992, 172, 305–312. doi:https://doi.org/10.1038/sj.bdj.4807861
- Schipper, R. G.; Silletti, E.; Vingerhoeds, M. H. Saliva as Research Material: Biochemical, Physicochemical and Practical Aspects. Arch. Oral Biol. 2007, 52, 1114–1135. doi:https://doi.org/10.1016/j.archoralbio.2007.06.009
- Whelton, H. The Anatomy and Physiology of Salivary Glands. In Saliva and Oral Health; Edgar, M., Dawes, C., O’Mullane, D., Eds.; Stephen Hancocks: Bicester, UK, 2012.
- Dawes, C. Circadian Rhythms in Human Salivary Flow Rate and Composition. J. Physiol. 1972, 220, 529–545. doi:https://doi.org/10.1113/jphysiol.1972.sp009721
- Humphrey, S. P.; Williamson, R. T. A Review of Saliva: Normal Composition, Flow, and Function. J. Prosthet. Dent. 2001, 85, 162–169. doi:https://doi.org/10.1067/mpr.2001.113778
- Atkinson, J.; Fox, P. Salivary Gland Dysfunction. Clin. Geriatr. Med. 1992, 8, 499–511. doi:https://doi.org/10.14219/jada.archive.1994.0059.
- Navazesh, M. Methods for Collecting Saliva. Ann. N Y Acad. Sci. 1993, 694, 72–77. doi:https://doi.org/10.1111/j.1749-6632.1993.tb18343.x
- Miller, C.; Foley, J.; Bailey, A.; Campell, C.; Humphries, R.; Christodoulides, N.; Floriano, P. N.; Simmons, G.; Bhagwandin, B.; Jacobson, J. W.; et al. Current Developments in Salivary Diagnostics. Biomark. Med. 2010, 4, 171–189. doi:https://doi.org/10.2217/bmm.09.68
- Percival, P.; Challacombe, S.; Marsh, P. Flow Rates of Resting Whole and Stimulated Parotid Saliva in Relation to Age and Gender. J. Dent. Res. 1994, 73, 1416–1420. doi:https://doi.org/10.1177/00220345940730080401
- Shern, R.; Fox, P.; Li, S. Influence of Age on the Secretory Rates of the Human Minor Salivary Glands and Whole Saliva. Arch. Oral Biol. 1993, 38, 755–761. doi:https://doi.org/10.1016/0003-9969(93)90071-S
- Gonçalves de Oliveira, C.; Ferro Collares, E.; Barbieri, M. A.; Machado Fernandes, M. I. Produçäo e Concentraçäo de Saliva e Amilase Salivar Em Crianças Obesas [Production and Concentration of Saliva and Salivary Amylase in Obese Children]. Arq. Gastroenterol. 1997, 34, 105–111.
- Dawes, C. Physiological Factors Affecting Salivary Flow Rate, Oral Sugar Clearance, and the Sensation of Dry Mouth in Man. J. Dent. Res. 1987, 66, 648–653. doi:https://doi.org/10.1177/00220345870660S107
- Paluszkiewicz, C.; Kwiatek, W. M.; Długoń, E.; Wesełucha-Birczyńska, A.; Piccinini, M. Surface Study of Selected Biomaterials Using Vibrational Spectroscopy. Acta Phys. Pol. A. 2009, 115, 533–536. doi:https://doi.org/10.12693/APhysPolA.115.533
- Lawanstiend, D.; Gatemala, H.; Nootchanat, S.; Eakasit, S.; Wongravee, K.; Srisa-Art, M. Microfluidic Approach for in Situ Synthesis of Nanoporous Silver Microstructures as on-Chip SERS Substrates. Sens. Actuators B Chem. 2018, 270, 466–474. doi:https://doi.org/10.1016/j.snb.2018.05.051
- Altuntas, S.; Buyukserin, F. Fabrication of Thioflavin-T-Modified Nanopillared SERS Substrates for Ultrasensitive Beta-Amyloid Peptide Detection. J. Raman Spectrosc. 2018, 49, 1247–1256. doi:https://doi.org/10.1002/jrs.5376
- Zhou, H.; Pandya, J. K.; Tan, Y.; Liu, J.; Peng, S.; Muriel Mundo, J. L.; He, L.; Xiao, H.; McClements, D. J. Role of Mucin in Behavior of Food-Grade TiO2 Nanoparticles under Simulated Oral Conditions. J. Agric. Food Chem. 2019, 67, 5882–5890. doi:https://doi.org/10.1021/acs.jafc.9b01732
- Ionta, F. Q.; Mendonça, F. L.; de Oliveira, G. C.; de Alencar, C. R. B.; Honório, H. M.; Magalhães, A. C.; Rios, D. In Vitro Assessment of Artificial Saliva Formulations on Initial Enamel Erosion Remineralization. J. Dent. 2014, 42, 175–179. doi:https://doi.org/10.1016/j.jdent.2013.11.009
- Yoshizawa, J. M.; Schafer, C. A.; Schafer, J. J.; Farrell, J. J.; Paster, B. J.; Wong, D. T. W. Salivary Biomarkers: Toward Future Clinical and Diagnostic Utilities. Clin. Microbiol. Rev. 2013, 26, 781–791. doi:https://doi.org/10.1128/CMR.00021-13
- Aps, J. K. M.; Martens, L. C. Review: The Physiology of Saliva and Transfer of Drugs into Saliva. Forensic Sci. Int. 2005, 150, 119–131. doi:https://doi.org/10.1016/j.forsciint.2004.10.026
- Moore, T. J.; Moody, A. S.; Payne, T. D.; Sarabia, G. M.; Daniel, A. R.; Sharma, B. In Vitro and in Vivo SERS Biosensing for Disease Diagnosis. Biosensors 2018, 8, 46. doi:https://doi.org/10.3390/bios8020046
- Zhang, W.; Guo, S.; Pereira Carvalho, W. S.; Jiang, Y.; Serpe, M. J. Portable Point-of-Care Diagnostic Devices. Anal. Methods 2016, 8, 7847–7867. doi:https://doi.org/10.1039/C6AY02158A
- Salemmilani, R.; Piorek, B. D.; Mirsafavi, R. Y.; Fountain, I. I. I.; A. W.; Moskovits, M.; Meinhart, C. D. Dielectrophoretic Nanoparticle Aggregation for on-Demand Surface Enhanced Raman Spectroscopy Analysis. Anal. Chem. 2018, 90, 7930–7936. doi:https://doi.org/10.1021/acs.analchem.8b00510
- Deriu, C.; Conticello, I.; Mebel, A. M.; McCord, B. Micro Solid Phase Extraction Surface-Enhanced Raman Spectroscopy (μ-SPE/SERS) Screening Test for the Detection of the Synthetic Cannabinoid JWH-018 in Oral Fluid. Anal. Chem. 2019, 91, 4780–4789. doi:https://doi.org/10.1021/acs.analchem.9b00335
- Dadas, A.; Washington, J.; Diaz-Arrastia, R.; Janigro, D. Biomarkers in Traumatic Brain Injury (TBI): A Review. Neuropsychiatr. Dis. Treat. 2018, 14, 2989–3000. doi:https://doi.org/10.2147/NDT.S125620
- Inscore, F.; Shende, C.; Sengupta, A.; Huang, H.; Farquharson, S. Detection of Drugs of Abuse in Saliva by Surface-Enhanced Raman Spectroscopy (SERS). Appl. Spectrosc. 2011, 65, 1004–1008. doi:https://doi.org/10.1366/11-06310
- Roi, A.; Rusu, L. C.; Roi, C. I.; Luca, R. E.; Boia, S.; Munteanu, R. I. A New Approach for the Diagnosis of Systemic and Oral Diseases Based on Salivary Biomolecules. Dis. Markers. 2019, 2019, 8761860. doi:https://doi.org/10.1155/2019/8761860
- Bonassi, S.; Neri, M.; Puntoni, R. Validation of Biomarkers as Early Predictors of Disease. Mutat. Res. 2001, 480-481, 349–358. doi:https://doi.org/10.1016/S0027-5107(01)00194-4
- Anderson, N. L.; Anderson, N. G. The Human Plasma Proteome: History, Character, and Diagnostic Prospects. Mol. Cell. Proteom. 2002, 1, 845–867. doi:https://doi.org/10.1074/mcp.r200007-mcp200
- Khan, R. S.; Rehman, I. U. Spectroscopy as a Tool for Detection and Monitoring of Coronavirus (COVID-19). Expert Rev. Mol. Diagn. 2020, 20, 647–649. doi:https://doi.org/10.1080/14737159.2020.1766968
- Khan, R. S.; Rehman, H. U.; Rehman, I. U. Saliva for the Diagnosis of COVID-19. Appl. Spectrosc. Rev. 2020, 55, 805–809. doi:https://doi.org/10.1080/05704928.2020.1809442
- Czumbel, L. M.; Kiss, S.; Farkas, N.; Mandel, I.; Hegyi, A.; Nagy, Á.; Lohinai, Z.; Szakács, Z.; Hegyi, P.; Steward, M. C.; Varga, G. Saliva as a Candidate for COVID-19 Diagnostic Testing: A Meta-Analysis. Front. Med. (Lausanne) 2020, 7, 465. doi:https://doi.org/10.3389/fmed.2020.00465
- Santosh, T. S.; Parmar, R.; Anand, H.; Srikanth, K.; Saritha, M. A Review of Salivary Diagnostics and Its Potential Implication in Detection of Covid-19. Cureus 2020, 12, e7708. doi:https://doi.org/10.7759/cureus.7708.
- Li, Y.; Ren, B.; Peng, X.; Hu, T.; Li, J.; Gong, T.; Tang, B.; Xu, X.; Zhou, X. Saliva is a Non-Negligible Factor in the Spread of COVID-19. Mol. Oral Microbiol. 2020, 35, 141–145. doi:https://doi.org/10.1111/omi.12289
- Wyllie, A. L.; Fournier, J.; Casanovas-Massana, A.; Campbell, M.; Tokuyama, M.; Vijayakumar, P.; Warren, J. L.; Geng, B.; Muenker, M. C.; Moore, A. J.; et al. Saliva or Nasopharyngeal Swab Specimens for Detection of SARS-CoV-2. N. Engl. J. Med. 2020, 383, 1283–1286. doi:https://doi.org/10.1056/NEJMc2016359
- Kah, J. C. Y.; Kho, K. W.; Lee, C. G. L.; James, C.; Sheppard, R.; Shen, Z. X.; Soo, K. C.; Olivo, M. C. Early Diagnosis of Oral Cancer Based on the Surface Plasmon Resonance of Gold Nanoparticles. Int. J. Nanomedicine. 2007, 2, 785–798.
- Matheson, A. The Rise of Raman Spectroscopy in Biomedicine. Spectroscopy 2018, 33, 26–28.
- Wickline, S. A.; Lanza, G. M. Molecular Imaging, Targeted Therapeutics, and Nanoscience. J. Cell. Biochem. Suppl. 2002, 39, 90–97. doi:https://doi.org/10.1002/jcb.10422
- Li, X. Z.; Bai, J.; Lin, J.; Liu, H.; Ding, J. Serum Fluorescence and Raman Spectra for Diagnosis of Cancer. SPIE Diagnostic Opt. Spectrosc. Biomed., 2001, 4432, 447127. doi:https://doi.org/10.1117/12.447127
- Ma, L.; Zhang, Z.; Li, X. Non-Invasive Disease Diagnosis Using Surface-Enhanced Raman Spectroscopy of Urine and Saliva. Appl. Spectrosc. Rev. 2020, 55, 197–219. doi:https://doi.org/10.1080/05704928.2018.1562938
- Yu, B.; Ge, M.; Li, P.; Xie, Q.; Yang, L. Development of Surface-Enhanced Raman Spectroscopy Application for Determination of Illicit Drugs: Towards a Practical Sensor. Talanta 2019, 191, 1–10. doi:https://doi.org/10.1016/j.talanta.2018.08.032
- Seitz, P. Photonics – Accelerating highly sensitive disease detection. https://ktn-uk.org/events/photonics-for-medical-diagnostics/.
- Szlag, V. M.; Rodriguez, R. S.; He, J.; Hudson-Smith, N.; Kang, H.; Le, N.; Reineke, T. M.; Haynes, C. L. Molecular Affinity Agents for Intrinsic Surface-Enhanced Raman Scattering (SERS) Sensors. ACS Appl. Mater. Interfaces. 2018, 10, 31825–31844. doi:https://doi.org/10.1021/acsami.8b10303
- Maier, S. A. Plasmonics: Fundamentals and Applications; Springer: New York, 2007. doi:https://doi.org/10.1007/0-387-37825-1
- Malkovskiy, A. V.; Yacob, A. A.; Dunn, C. E.; Zirbes, J. M.; Ryan, S. P.; Bollyky, P. L.; Rajadas, J.; Milla, C. E. Salivary Thiocyanate as a Biomarker of Cystic Fibrosis Transmembrane Regulator Function. Anal. Chem. 2019, 91, 7929–7934. doi:https://doi.org/10.1021/acs.analchem.9b01800
- Machado, A.; Maneiras, R.; Bordalo, A. A.; Mesquita, R. B. R. Monitoring Glucose, Calcium, and Magnesium Levels in Saliva as a Non-Invasive Analysis by Sequential Injection Multi-Parametric Determination. Talanta 2018, 186, 192–199. doi:https://doi.org/10.1016/j.talanta.2018.04.055
- Raman, C.; V; Krishnan, K. S. A New Type of Secondary Radiation. Nature 1928, 121, 501–502. doi:https://doi.org/10.1038/121501c0
- Golightly, R. S.; Doering, W. E.; Natan, M. J. Surface-Enhanced Raman Spectroscopy and Homeland Security: A Perfect Match? ACS Nano. 2009, 3, 2859–2869. doi:https://doi.org/10.1021/nn9013593
- López-López, M.; García-Ruiz, C. Infrared and Raman Spectroscopy Techniques Applied to Identification of Explosives. Trends Anal. Chem 2014, 54, 36–44. doi:https://doi.org/10.1016/j.trac.2013.10.011
- Huang, Y.; Liu, W.; Gong, Z.; Wu, W.; Fan, M.; Wang, D.; Brolo, A. G. Detection of Buried Explosives Using a Surface-Enhanced Raman Scattering (SERS) Substrate Tailored for Miniaturized Spectrometers. ACS Sens. 2020, 5, 2933–2939. doi:https://doi.org/10.1021/acssensors.0c01412
- Reid, L. M.; O'Donnell, C. P.; Downey, G. Recent Technological Advances for the Determination of Food Authenticity. Trends Food Sci. Technol. 2006, 17, 344–353. doi:https://doi.org/10.1016/j.tifs.2006.01.006
- Neng, J.; Zhang, Q.; Sun, P. Application of Surface-Enhanced Raman Spectroscopy in Fast Detection of Toxic and Harmful Substances in Food. Biosens. Bioelectron. 2020, 167, 112480. doi:https://doi.org/10.1016/j.bios.2020.112480
- Bersani, D.; Conti, C.; Matousek, P.; Pozzi, F.; Vandenabeele, P. Methodological Evolutions of Raman Spectroscopy in Art and Archaeology. Anal. Methods 2016, 8, 8395–8409. doi:https://doi.org/10.1039/C6AY02327D
- Candeias, A.; Madariaga, J. M. Applications of Raman Spectroscopy in Art and Archaeology. J. Raman Spectrosc. 2019, 50, 137–142. doi:https://doi.org/10.1002/jrs.5571.
- Edwards, H. G. M.; Vandenabeele, P. Raman Spectroscopy in Art and Archaeology. Philos. Trans. R. Soc. A Math. Phys. Eng. Sci. 2016, 374, 20160052. doi:https://doi.org/10.1098/rsta.2016.0052
- Berger, A.; Koo, T.-W.; Itzkan, I.; Horowitz, G.; Feld, M. S. Multicomponent Blood Analysis by near-Infrared Raman Spectroscopy. Appl. Opt. 1999, 38, 2916–2926. doi:https://doi.org/10.1364/AO.38.002916
- Larmour, I.; Graham, D. Surface Enhanced Optical Spectroscopies for Bioanalysis. Analyst 2011, 136, 3831–3853. doi:https://doi.org/10.1039/c1an15452d
- Sharma, B.; Frontiera, R. R.; Henry, A. I.; Ringe, E.; Van Duyne, R. P. SERS: Materials, Applications, and the Future. Mater. Today 2012, 15, 16–25. doi:https://doi.org/10.1016/S1369-7021(12)70017-2
- Maitra, I.; Morais, C. L.; Lima, K. M.; Ashton, K. M.; Date, R. S.; Martin, F. L. Raman Spectral Discrimination in Human Liquid Biopsies of Oesophageal Transformation to Adenocarcinoma. J. Biophoton. 2020, 13, e201960132. doi:https://doi.org/10.1002/jbio.201960132
- James, J. Raman in the Clinic. Anal. Sci. 2019, 1, 46–47.
- Rickard, J. J. S.; Di-Pietro, V.; Smith, D. J.; Davies, D. J.; Belli, A.; Goldberg Oppenheimer, P. Rapid Optofluidic Detection of Biomarkers for Traumatic Brain Injury via Surface-Enhanced Raman Spectroscopy. Nat. Biomed. Eng. 2020, 4, 610–623. doi:https://doi.org/10.1038/s41551-019-0510-4
- Pence, I.; Mahadevan-Jansen, A. Clinical Instrumentation and Applications of Raman Spectroscopy. Chem. Soc. Rev. 2016, 45, 1958–1979. doi:https://doi.org/10.1039/c5cs00581g
- Langer, J.; Jimenez de Aberasturi, D.; Aizpurua, J.; Alvarez-Puebla, R. A.; Auguié, B.; Baumberg, J. J.; Bazan, G. C.; Bell, S. E. J.; Boisen, A.; Brolo, A. G.; et al. Present and Future of Surface-Enhanced Raman Scattering. ACS Nano. 2020, 14, 28–117. doi:https://doi.org/10.1021/acsnano.9b04224
- Cialla-May, D.; Zheng, X.-S.; Weber, K.; Popp, J. Recent Progress in Surface-Enhanced Raman Spectroscopy for Biological and Biomedical Applications: From Cells to Clinics. Chem. Soc. Rev. 2017, 46, 3945–3961. doi:https://doi.org/10.1039/c7cs00172j
- Pahlow, S.; Weber, K.; Popp, J. Spectroscopic Methods Guide Precision Medicine. EuroPhotonics 2020, 25, 18–23.
- Fujita, K. A. Further Leap of Biomedical Raman Imaging. Spectroscopy 2020, 35, 10.
- Mayerhöfer, T.; Krafft, C.; Neugebauer, U.; Popp, J. Moving Raman Spectroscopy into the Clinic. EuroPhotonics 2014, 19, 24–28.
- Romao, V. C.; Martins, S. A. M.; Germano, J.; Cardoso, F. A.; Cardoso, S.; Freitas, P. P. Lab-on-Chip Devices: Gaining Ground Losing Size. ACS Nano. 2017, 11, 10659–10664. doi:https://doi.org/10.1021/acsnano.7b06703
- Dambinova, S.; Hayes, R. L.; Wang, K. K. W. Biomarkers for Traumatic Brain Injury, 1st ed.; Royal Society of Chemistry: Cambridge, 2012.
- Movasaghi, Z.; Rehman, S.; Rehman, I. U. Raman Spectroscopy of Biological Tissues. Appl. Spectrosc. Rev. 2007, 42, 493–541. doi:https://doi.org/10.1080/05704920701551530
- Chandra, A.; Talari, S.; Movasaghi, Z.; Rehman, S. Raman Spectroscopy of Biological Tissues. Appl. Spectrosc. Rev. 2015, 50, 46–111. doi:https://doi.org/10.1080/05704928.2014.923902
- Colceriu-Şimon, I. M.; Hedeşiu, M.; Toma, V.; Armencea, G.; Moldovan, A.; Ştiufiuc, G.; Culic, B.; Ţărmure, V.; Dinu, C.; Berindan-Neagoe, I. The Effects of Low-Dose Irradiation on Human Saliva: A Surface-Enhanced Raman Spectroscopy Study. Diagnostics 2019, 9, 9030101. doi:https://doi.org/10.3390/diagnostics9030101
- Feng, S.; Huang, S.; Lin, D.; Chen, U.; Xu, Y.; Li, Y.; Huang, Z.; Pan, J.; Chen, R.; Zeng, H. Surface-Enhanced Raman Spectroscopy of Saliva Proteins for the Noninvasive Differentiation of Benign and Malignant Breast Tumors. Int. J. Nanomed. 2015, 10, 537–547. doi:https://doi.org/10.2147/IJN.S71811.
- Li, X.; Yang, T.; Lin, J. Spectral Analysis of Human Saliva for Detection of Lung Cancer Using Surface-Enhanced Raman Spectroscopy. J. Biomed. Opt. 2012, 17, 037003. doi:https://doi.org/10.1117/1.JBO.17.3.037003
- Qian, K.; Wang, Y.; Hua, L.; Chen, A.; Zhang, Y. New Method of Lung Cancer Detection by Saliva Test Using Surface-Enhanced Raman Spectroscopy. Thorac. Cancer. 2018, 9, 1556–1561. doi:https://doi.org/10.1111/1759-7714.12837
- Qu, D.; Wang, Y.; Chen, A.; Zheng, W.; Liu, J.; Jiao, Y.; Liu, C. New Method for Screening Drug Addicts Based on Surface-Enhanced Raman Spectroscopy Technology. IEEE 4th International Conference on Bioinformatics and Biomedical Engineering, Chengdu, China, Jul 13, 2010, pp 1–3. doi:https://doi.org/10.1109/ICBBE.2010.5515355
- Lin, H.-Y.; Huang, C.-H.; Park, J.; Pathania, D.; Castro, C. M.; Fasano, A.; Weissleder, R.; Lee, H. Integrated Magneto-Chemical Sensor for on-Site Food Allergen Detection. ACS Nano 2017, 11, 10062–10069. doi:https://doi.org/10.1021/acsnano.7b04318
- Sikirzhytski, V.; Sikirzhytskaya, A.; Lednev, I. K. Multidimensional Raman Spectroscopic Signatures as a Tool for Forensic Identification of Body Fluid Traces: A Review. Appl. Spectrosc. 2011, 65, 1223–1232. doi:https://doi.org/10.1366/11-06455
- Ralbovsky, N. M.; Halámková, L.; Wall, K.; Anderson-Hanley, C.; Lednev, I. K. Screening for Alzheimer's Disease Using Saliva: A New Approach Based on Machine Learning and Raman Hyperspectroscopy. J. Alzheimers. Dis. 2019, 71, 1351–1359. doi:https://doi.org/10.3233/JAD-190675
- Aitchison, H.; Aizpurua, J.; Arnolds, H.; Baumberg, J.; Bell, S.; Bonifacio, A.; Chikkaraddy, R.; Dawson, P.; de Nijs, B.; Deckert, V.; et al. Analytical SERS: General Discussion. Faraday Discuss. 2017, 205, 561–600. doi:https://doi.org/10.1039/C7FD90096A
- D'Elia, V.; Montalvo, G.; Ruiz, C. G.; Ermolenkov, V. V.; Ahmed, Y.; Lednev, I. K. Ultraviolet Resonance Raman Spectroscopy for the Detection of Cocaine in Oral Fluid. Spectrochim. Acta A Mol. Biomol. Spectrosc. 2018, 188, 338–340. doi:https://doi.org/10.1016/j.saa.2017.07.010
- Schultz, Z. D. Demystifying SERS: A Newcomer’s Guide to Using Surface Enhanced Raman Scattering. Spectroscopy 2020, 35, 15–16.
- Gonchukov, S.; Sukhinina, A.; Bakhmutov, D.; Biryukova, T.; Tsvetkov, M.; Bagratashvily, V. Periodontitis Diagnostics Using Resonance Raman Spectroscopy on Saliva. Laser Phys. Lett. 2013, 10, 075610. doi:https://doi.org/10.1088/1612-2011/10/7/075610
- Maes, E. M.; Walker, F. A.; Montfort, W. R.; Czernuszewicz, R. S. Resonance Raman Spectroscopic Study of Nitrophorin 1, a Nitric Oxide-Binding Heme Protein from Rhodnius Prolixus, and Its Nitrosyl and Cyano Adducts. J. Am. Chem. Soc. 2001, 123, 11664–11672. doi:https://doi.org/10.1021/ja0031927
- Bergman, I.; Conway, B. E.; Bewick, A.; Kuwana, T.; McIntyre, J. D. E.; Gardner, C. L.; Casey, E. J.; Barrett, M. A.; Angerstein-Kozlowska, H.; Kolb, D. M.; et al. General Discussion. Faraday Discuss. Chem. Soc. 1973, 56, 152–170. doi:https://doi.org/10.1039/dc9735600152
- Fleischmann, M.; Hendra, P. J.; McQuillan, A. J. Raman Spectra of Pyridine Adsorbed at a Silver Electrode. Chem. Phys. Lett. 1974, 26, 163–166. doi:https://doi.org/10.1016/0009-2614(74)85388-1
- Moskovits, M. Persistent Misconceptions Regarding SERS. Phys. Chem. Chem. Phys. 2013, 15, 5301–5311. doi:https://doi.org/10.1039/c2cp44030j
- Fang, Y.; Seong, N.-H.; Dlott, D. Measurement of the Distribution of Site Enhancements in Surface-Enhanced Raman Scattering. Science 2008, 321, 388–393. doi:https://doi.org/10.1126/science.1148744.
- Doherty, M. D.; Murphy, A.; McPhillips, J.; Pollard, R. J.; Dawson, P. Wavelength Dependence of Raman Enhancement from Gold Nanorod Arrays: Quantitative Experiment and Modeling of a Hot Spot Dominated System. J. Phys. Chem. C. 2010, 114, 19913–19919. doi:https://doi.org/10.1021/jp107063x
- Martin, D. SERS and the rise of the Raman empire. https://www.chemistryworld.com/features/sers-and-the-rise-of-the-raman-empire/9264.article.
- Alessandri, I.; Lombardi, J. R. Enhanced Raman Scattering with Dielectrics. Chem. Rev. 2016, 116, 14921–14981. doi:https://doi.org/10.1021/acs.chemrev.6b00365
- Soares Nunes, L. A.; Vaz de Macedo, D. Saliva as a Diagnostic Fluid in Sports Medicine: Potential and Limitations. J. Bras. Patol. Med. Lab. 2013, 49, 247–255. doi:https://doi.org/10.1590/S1676-24442013000400003
- Rodrigues, W. C.; Catbagan, P.; Rana, S.; Wang, G.; Moore, C. Detection of Synthetic Cannabinoids in Oral Fluid Using ELISA and LC-MS-MS. J. Anal. Toxicol. 2013, 37, 526–533. doi:https://doi.org/10.1093/jat/bkt067
- Cottat, M.; Andrea, C. D.; Yasukuni, R.; Malashikhina, N.; Grinyte, R.; Lidgi-Guigui, N.; Fazio, B.; Sutton, A.; Oudar, O.; Charnaux, N.; et al. High Sensitivity, High Selectivity SERS Detection of MnSOD Using Optical Nanoantennas Functionalized with Aptamers. J. Phys. Chem. C. 2015, 119, 15532–15540. doi:https://doi.org/10.1021/acs.jpcc.5b03681
- Farquharson, S.; Brouillette, C.; Smith, W.; Shende, C. A Surface-Enhanced Raman Spectral Library of Important Drugs Associated with Point-of-Care and Field Applications. Front. Chem. 2019, 7, 706. doi:https://doi.org/10.3389/fchem.2019.00706
- Frosch, T.; Knebl, A.; Frosch, T. Recent Advances in Nano-Photonic Techniques for Pharmaceutical Drug Monitoring with Emphasis on Raman Spectroscopy. Nanophotonics 2019, 9, 19–37. doi:https://doi.org/10.1515/nanoph-2019-0401
- Henson, B. S.; Wong, D. T. Collection, Storage, and Processing of Saliva Samples for Downstream Molecular Applications. In Oral Biology: Molecular Techniques and Applications; Seymour, G. J., Cullinan, M. P., Heng, N. C. K., Eds.; Springer Science (Humana Press): New York, 2010; pp 21–30.
- Chevalier, F.; Hirtz, C.; Chay, S.; Cuisinier, F.; Sommerer, N.; Rossignol, M.; de Périère, D. D. Proteomic Studies of Saliva: A Proposal for a Standardized Handling of Clinical Samples. Clin. Proteom. 2007, 3, 13–21. doi:https://doi.org/10.1007/s12014-007-9000-x
- Zaragoza Meneses, M. T.; de, J.; Velasco Molina, J. A. La Saliva. Auxiliar de Diagnóstico [Saliva. An Auxiliary Diagnostic], 1st ed.; UNAM, FES Zaragoza, Universidad Nacional Autónoma de México: Mexico City, 2018. doi:https://doi.org/10.22201/fesz.9786070299780e.2018
- Barnett, N.; Rathmell, C. Detecting Drugs in Saliva. Opt. Photonik 2015, 10, 31–34. doi:https://doi.org/10.1002/opph.201500040
- Zermeño-Nava, J.; de, J.; Martínez-Martínez, M. U.; Rámirez-de-Ávila, A. L.; Hernández-Arteaga, A. C.; García-Valdivieso, M. G.; Hernández-Cedillo, A.; José-Yacamán, M.; Navarro-Contreras, H. R. Determination of sialic acid in Saliva by Means of Surface-Enhanced Raman Spectroscopy as a Marker in Adnexal Mass Patients: Ovarian Cancer vs Benign Cases. J. Ovarian Res. 2018, 11, 61. doi:https://doi.org/10.1186/s13048-018-0433-9.
- González, L.; Sánches, M. La Saliva: Revisión Sobre Composición, Función y Usos Diagnósticos: Primera Parte [Saliva: A Review on Composition, Function and Diagnostic Uses: Part One]. Univ. Odontol. 2003, 23, 18–24.
- Malamud, D. Salivary Diagnostics: The Future is Now. J. Am. Dent. Assoc. 2006, 137, 284, 286–286. doi:https://doi.org/10.14219/jada.archive.2006.0158
- Mahesh, D. R.; Komali, G.; Jayanthi, K.; Dinesh, D.; Saikavitha, T.; V; Dinesh, P. Evaluation of Salivary Flow Rate, PH and Buffer in Pre, Post & Post Menopausal Women on HRT. J. Clin. Diagn. Res. 2014, 8, 233–236. doi:https://doi.org/10.7860/JCDR/2014/8158.4067
- Xu, F.; Laguna, L.; Sarkar, A. Aging-Related Changes in Quantity and Quality of Saliva: Where Do We Stand in Our Understanding? J. Texture Stud. 2019, 50, 27–35. doi:https://doi.org/10.1111/jtxs.12356
- Hegner, M. Nanomechanical Sensors for Weighing Viruses. https://www.tcd.ie/Physics/people/Martin.Hegner/pdf/Bio-Physics_TCD_TYPE_week_2019_Dublin.pdf.
- Radzol, A. R. M.; Lee, K. Y.; Mansor, W. Nonstructural Protein 1 Characteristic Peak from NS1-Saliva Mixture with Surface-Enhanced Raman Spectroscopy. IEEE 35th Annu. Int. Conf. IEEE Eng. Med. Biol. Soc., 2013, 2013, 2396–2399. doi:https://doi.org/10.1109/EMBC.2013.6610021
- Othman, N. H.; Lee, K. Y.; Radzol, A. R. M. M.; Mansor, W.; Rashid, U. R. M. M. Optimal PCA-EOC-KNN Model for Detection of NS1 from Salivary SERS Spectra. IEEE 2018 Int. Conf. Intell. Informatics Biomed. Sci. 2018, 3, 204–208. doi:https://doi.org/10.1109/ICIIBMS.2018.8549984
- Bell, S. E. J.; Beattie, J. R.; McGarvey, J. J.; Peters, K. L.; Sirimuthu, N. M. S.; Speers, S. J. Development of Sampling Methods for Raman Analysis of Solid Dosage Forms of Therapeutic and Illicit Drugs. J. Raman Spectrosc. 2004, 35, 409–417. doi:https://doi.org/10.1002/jrs.1160
- Jones, L. E.; Stewart, A.; Peters, K. L.; McNaul, M.; Speers, S. J.; Fletcher, N. C.; Bell, S. E. J. Infrared and Raman Screening of Seized Novel Psychoactive Substances: A Large Scale Study of >200 Samples. Analyst 2016, 141, 902–909. doi:https://doi.org/10.1039/c5an02326b
- Hodges, C. M.; Hendra, P. J.; Willis, H. A.; Farley, T. Fourier Transform Raman Spectroscopy of Illicit Drugs. J. Raman Spectrosc. 1989, 20, 745–749. doi:https://doi.org/10.1002/jrs.1250201108
- Ryder, A. G.; O'Connor, G. M.; Glynn, T. J. Identifications and Quantitative Measurements of Narcotics in Solid Mixtures Using Near-IR Raman Spectroscopy and Multivariate Analysis. J. Forensic Sci. 1999, 44, 12031J–121019. doi:https://doi.org/10.1520/JFS12031J
- Dana, K.; Shende, C.; Huang, H.; Farquharson, S. Rapid Analysis of Cocaine in Saliva by Surface-Enhanced Raman Spectroscopy. J. Anal. Bioanal. Tech. 2015, 6, 1–5. doi:https://doi.org/10.4172/2155-9872.1000289.
- Farquharson, S.; Shende, C.; Sengupta, A.; Huang, H.; Inscore, F. Rapid Detection and Identification of Overdose Drugs in Saliva by Surface-Enhanced Raman Scattering Using Fused Gold Colloids. Pharmaceutics 2011, 3, 425–439. doi:https://doi.org/10.3390/pharmaceutics3030425
- Anyu, C.; Lin, H.; Jinghua, L.; ZiJian, C.; Yi, J.; Dian, Q.; Xun, G.; Chunwei, L.; Wen, H.; Hong, W. Detecting Narcotic Usage Using Surface-Enhanced Raman Spectroscopy on Saliva Samples. IFMBE World Congr. Med. Phys. Biomed. Eng. Diagn. Ther. Instrum. Clin. Eng. 2009, 25, /71–74. doi:https://doi.org/10.1007/978-3-642-03885-3_20.
- Andreou, C.; Hoonejani, M. R.; Barmi, M. R.; Moskovits, M.; Meinhart, C. D. Rapid Detection of Drugs of Abuse in Saliva Using Surface Enhanced Raman Spectroscopy and Microfluidics. ACS Nano. 2013, 7, 7157–7164. doi:https://doi.org/10.1021/nn402563f
- Shende, C.; Farquharson, A.; Brouillette, C.; Smith, W.; Farquharson, S. Quantitative Measurements of Codeine and Fentanyl on a Surface-Enhanced Raman-Active Pad. Molecules 2019, 24, 2578. doi:https://doi.org/10.3390/molecules24142578
- Gift, A.; Shende, C.; Inscore, F. E.; Maksymiuk, P.; Farquharson, S. Five-Minute Analysis of Chemotherapy Drugs and Metabolites in Saliva: Evaluating Dosage. SPIE Smart Med. Biomed. Sens. Technol. 2004, 5261, 135–141. doi:https://doi.org/10.1117/12.512228
- Farquharson, S.; Gift, A.; Shende, C.; Inscore, F.; Ordway, B.; Farquharson, C.; Murren, J. Surface-Enhanced Raman Spectral Measurements of 5-Fluorouracil in Saliva. Molecules 2008, 13, 2608–2627. doi:https://doi.org/10.3390/molecules13102608
- Farquharson, S.; Shende, C.; Inscore, F. E.; Maksymiuk, P.; Gift, A. Analysis of 5-Fluorouracil in Saliva Using Surface-Enhanced Raman Spectroscopy. J. Raman Spectrosc. 2005, 36, 208–212. doi:https://doi.org/10.1002/jrs.1277
- Shende, C.; Inscore, F.; Maksymiuk, P.; Farquharson, S. Five Minute Analysis of Chemotherapy Drugs in Saliva. Opt. Methods Life Sci. 2006, 6386, 638604. doi:https://doi.org/10.1117/12.683008
- Yang, T.; Guo, X.; Wang, H.; Fu, S.; Wen, Y.; Yang, H. Magnetically Optimized SERS Assay for Rapid Detection of Trace Drug-Related Biomarkers in Saliva and Fingerprints. Biosens. Bioelectron. 2015, 68, 350–357. doi:https://doi.org/10.1016/j.bios.2015.01.021
- SAMHSA. Substance Abuse and Mental Health Services Administration (SAMHSA). Mandatory Guidelines for Federal Workplace Drug Testing Programs— Oral/Fluid. Fed. Regist. 2019, 84, 57554–57600.
- Sivashanmugan, K.; Zhao, Y.; Wang, A. X. Tetrahydrocannabinol Sensing in Complex Biofluid with Portable Raman Spectrometer Using Diatomaceous SERS Substrates. Biosensors 2019, 9, 125. doi:https://doi.org/10.3390/bios9040125
- Nilendu, D.; Kundu, A.; Chand, A.; Johnson, A. Forensic Implications of Saliva: An Overview. Ijfmt. 2020, 14, 189–194. doi:https://doi.org/10.37506/ijfmt.v14i1.39
- Virkler, K.; Lednev, I. K. Raman Spectroscopic Signature of Semen and Its Potential Application to Forensic Body Fluid Identification. Forensic Sci. Int. 2009, 193, 56–62. doi:https://doi.org/10.1016/j.forsciint.2009.09.005
- Virkler, K.; Lednev, I. K. Analysis of Body Fluids for Forensic Purposes: From Laboratory Testing to Non-Destructive Rapid Confirmatory Identification at a Crime Scene. Forensic Sci. Int. 2009, 188, 1–17. doi:https://doi.org/10.1016/j.forsciint.2009.02.013
- Virkler, K.; Lednev, I. K. Forensic Body Fluid Identification: The Raman Spectroscopic Signature of Saliva. Analyst 2010, 135, 512–517. doi:https://doi.org/10.1039/b919393f
- Sikirzhytski, V.; Virkler, K.; Lednev, I. K. Discriminant Analysis of Raman Spectra for Body Fluid Identification for Forensic Purposes. Sensors (Basel) 2010, 10, 2869–2884. doi:https://doi.org/10.3390/s100402869
- Muro, C. K.; Doty, K. C.; de Souza Fernandes, L.; Lednev, I. K. Forensic Body Fluid Identification and Differentiation by Raman Spectroscopy. Forensic Chem. 2016, 1, 31–38. doi:https://doi.org/10.1016/j.forc.2016.06.003
- Muro, C. K.; de Souza Fernandes, L.; Lednev, I. K. Sex Determination Based on Raman Spectroscopy of Saliva Traces for Forensic Purposes. Anal. Chem. 2016, 88, 12489–12593. doi:https://doi.org/10.1021/acs.analchem.6b03988
- Virkler, K.; Lednev, I. K. Raman Spectroscopy Offers Great Potential for the Nondestructive Confirmatory Identification of Body Fluids. Forensic Sci. Int. 2008, 181, 1–5. doi:https://doi.org/10.1016/j.forsciint.2008.08.004.
- Buchan, E.; Kelleher, L.; Clancy, M.; Goldberg Oppenheimer, P. Spectroscopic “Molecular Fingerprint” Profiling of Saliva; Elsevier: Amsterdam, 2021.
- Zapata, F.; Fernández de la Ossa, M. Á.; García-Ruiz, C. Emerging Spectrometric Techniques for the Forensic Analysis of Body Fluids. Trends Anal. Chem. 2015, 64, 53–63. doi:https://doi.org/10.1016/j.trac.2014.08.011
- Cândido, M.; Silveira, J. M.; Mata, A.; Carvalho, M. L.; Pessanha, S. In Vitro Study of the Demineralization Induced in Human Enamel by an Acidic Beverage Using X-Ray Fluorescence Spectroscopy and Raman Microscopy. X-Ray Spectrom. 2019, 48, 61–69. doi:https://doi.org/10.1002/xrs.2987
- Daood, U.; Swee Heng, C.; Neo Chiew Lian, J.; Fawzy, A. S. In Vitro Analysis of Riboflavin-Modified, Experimental, Two-Step Etch-and-Rinse Dentin Adhesive: Fourier Transform Infrared Spectroscopy and Micro-Raman Studies. Int. J. Oral Sci. 2015, 7, 110–124. doi:https://doi.org/10.1038/ijos.2014.49
- Silva Soares, L. E.; Silva Soares, A. L.; De Oliveira, R.; Nahorny, S. The Effects of Acid Erosion and Remineralization on Enamel and Three Different Dental Materials: FT-Raman Spectroscopy and Scanning Electron Microscopy Analysis. Microsc. Res. Tech. 2016, 79, 646–656. doi:https://doi.org/10.1002/jemt.22679
- Toledano, M.; Cabello, I.; Vílchez, M. A. C.; Fernández, M. A.; Osorio, R. Surface Microanalysis and Chemical Imaging of Early Dentin Remineralization. Microsc. Microanal. 2014, 20, 245–256. doi:https://doi.org/10.1017/S1431927613013639
- Daood, U.; Tsoi, J. K. H.; Neelakantan, P.; Matinlinna, J. P.; Omar, H. A. K.; Al-Nabulsi, M.; Fawzy, A. S. In Vitro Assessment of Ribose Modified Two-Step Etch-and-Rinse Dentine Adhesive. Dent. Mater. 2018, 34, 1175–1187. doi:https://doi.org/10.1016/j.dental.2018.05.005
- Musa Trolic, I.; Todoric, Z.; Pop Acev, D.; Makreski, P.; Pejova, B.; Spalj, S. Effects of the Presence of Probiotic Bacteria in the Aging Medium on the Surface Roughness and Chemical Composition of Two Dental Alloys. Microsc. Res. Tech. 2019, 82, 1384–1391. doi:https://doi.org/10.1002/jemt.23290
- Wachesk, C. C.; Trava-Airoldi, V. J.; Da-Silva, N. S.; Lobo, A. O.; Marciano, F. R. The Influence of Titanium Dioxide on Diamond-Like Carbon Biocompatibility for Dental Applications. J. Nanomater. 2016, 2016, 1–7. doi:https://doi.org/10.1155/2016/8194516
- Wang, J.; Zhou, J.; Long, H. Y.; Xie, Y. N.; Zhang, X. W.; Luo, H.; Deng, Z. J.; Wei, Q.; Yu, Z. M.; Zhang, J.; Tang, Z. G. Tribological, anti-Corrosive Properties and Biocompatibility of the Micro- and Nano-Crystalline Diamond Coated Ti6Al4V. Surf. Coatings Technol. 2014, 258, 1032–1038. doi:https://doi.org/10.1016/j.surfcoat.2014.07.034
- Wang, Z.; Shen, Y.; Haapasalo, M.; Wang, J.; Jiang, T.; Wang, Y.; Watson, T. F.; Sauro, S. Polycarboxylated Microfillers Incorporated into Light-Curable Resin-Based Dental Adhesives Evoke Remineralization at the Mineral-Depleted Dentin. J. Biomater. Sci. Polym. Ed. 2014, 25, 679–697. doi:https://doi.org/10.1080/09205063.2014.891926
- Wei, S.; Shao, T.; Ding, P. Study of CNx Films on 316L Stainless Steel for Orthodontic Application. Diam. Relat. Mater. 2010, 19, 648–653. doi:https://doi.org/10.1016/j.diamond.2010.02.040
- Zaharia, A.; Muşat, V.; Anghel, E. M.; Atkinson, I.; Mocioiu, O. C.; Buşilă, M.; Pleşcan, V. G. Biomimetic Chitosan-Hydroxyapatite Hybrid Biocoatings for Enamel Remineralization. Ceram. Int. 2017, 43, 11390–11402. doi:https://doi.org/10.1016/j.ceramint.2017.05.346
- Zaharia, A.; Plescan, V. G.; Anghel, E. M.; Musat, V. Human Dentine Remineralization under Non-Colagen Materials Action. Rev. Chim. 2017, 68, 928–932. doi:https://doi.org/10.37358/RC.17.5.5583
- Hussein, M. A.; Yilbas, B.; Kumar, A. M.; Drew, R.; Al-Aqeeli, N. Influence of Laser Nitriding on the Surface and Corrosion Properties of Ti-20Nb-13Zr Alloy in Artificial Saliva for Dental Applications. J. Mater. Eng. Perform. 2018, 27, 4655–4664. doi:https://doi.org/10.1007/s11665-018-3569-2
- Zhang, J.; Lynch, R. J. M.; Watson, T. F.; Banerjee, A. Remineralisation of Enamel White Spot Lesions Pre-Treated with Chitosan in the Presence of Salivary Pellicle. J. Dent. 2018, 72, 21–28. doi:https://doi.org/10.1016/j.jdent.2018.02.004
- Zhang, Y.; Wang, Z.; Jiang, T.; Wang, Y. Biomimetic Regulation of Dentine Remineralization by Amino Acid in Vitro. Dent. Mater. 2019, 35, 298–309. doi:https://doi.org/10.1016/j.dental.2018.11.026
- Zheng, X.; Zhang, Y.; Zhang, B. Effect of N-Ion Implantation and Diamond-like Carbon Coating on Fretting Wear Behaviors of Ti6Al7Nb in Artificial Saliva. Trans. Nonferrous Met. Soc. China 2017, 27, 1071–1080. doi:https://doi.org/10.1016/S1003-6326(17)60125-0
- Daood, U.; Matinlinna, J. P.; Fawzy, A. S. Synergistic Effects of VE-TPGS and Riboflavin in Crosslinking of Dentine. Dent. Mater. 2019, 35, 356–367. doi:https://doi.org/10.1016/j.dental.2018.11.031
- da Silva, E. M.; Almeida, G. S.; Poskus, L. T.; Guimarães, J. G. A. Relationship between the Degree of Conversion, Solubility and Salivary Sorption of a Hybrid and a Nanofilled Resin Composite: Influence of the Light-Activation Mode. J. Appl. Oral Sci. 2008, 16, 161–166. doi:https://doi.org/10.1590/S1678-77572008000200015
- Fawzy, A. S.; Daood, U.; Matinlinna, J. P. Potential of High-Intensity Focused Ultrasound in Resin-Dentine Bonding. Dent. Mater. 2019, 35, 979–989. doi:https://doi.org/10.1016/j.dental.2019.04.001
- Hua, F.; Yan, J.; Zhao, S.; Yang, H.; He, H. In Vitro Remineralization of Enamel White Spot Lesions with a Carrier-Based Amorphous Calcium Phosphate Delivery System. Clin. Oral. Investig. 2020, 24, 2079–2089. doi:https://doi.org/10.1007/s00784-019-03073-x
- Veys-Renaux, D.; El Haj, Z. A.; Rocca, E. Corrosion Resistance in Artificial Saliva of Titanium Anodized by Plasma Electrolytic Oxidation in Na3PO4. Surf. Coatings Technol. 2016, 285, 214–219. doi:https://doi.org/10.1016/j.surfcoat.2015.11.028
- Romonti, D. E.; Gomez Sanchez, A. V.; Milošev, I.; Demetrescu, I.; Ceré, S. Effect of Anodization on the Surface Characteristics and Electrochemical Behaviour of Zirconium in Artificial Saliva. Mater. Sci. Eng. C Mater. Biol. Appl. 2016, 62, 458–466. doi:https://doi.org/10.1016/j.msec.2016.01.079
- Iafisco, M.; Degli Esposti, L.; Ramírez-Rodríguez, G. B.; Carella, F.; Gómez-Morales, J.; Ionescu, A. C.; Brambilla, E.; Tampieri, A.; Delgado-López, J. M. Fluoride-Doped Amorphous Calcium Phosphate Nanoparticles as a Promising Biomimetic Material for Dental Remineralization. Sci. Rep. 2018, 8, 17016. doi:https://doi.org/10.1038/s41598-018-35258-x.
- Li, Y.; Wang, K.; He, P.; Huang, B. X.; Kovacs, P. Surface‐Enhanced Raman Spectroelectrochemical Studies of Corrosion Films on Implant Co–Cr–Mo Alloy in Biosimulating Solutions. J. Raman Spectrosc. 1999, 30, 97–103. doi:https://doi.org/10.1002/(SICI)1097-4555(199902)30:2 < 97::AID-JRS352 > 3.0.CO;2-X
- Osorio, R.; Cabello, I.; Toledano, M. Bioactivity of Zinc-Doped Dental Adhesives. J. Dent. 2014, 42, 403–412. doi:https://doi.org/10.1016/j.jdent.2013.12.006
- Osorio, R.; Osorio, E.; Cabello, I.; Toledano, M. Zinc Induces Apatite and Scholzite Formation during Dentin Remineralization. Caries Res. 2014, 48, 276–290. doi:https://doi.org/10.1159/000356873
- Osorio, R.; Toledano-Osorio, M.; Osorio, E.; Aguilera, F. S.; Padilla-Mondéjar, S.; Toledano, M. Zinc and Silica Are Active Components to Efficiently Treat in Vitro Simulated Eroded Dentin. Clin. Oral Investig. 2018, 22, 2859–2870. doi:https://doi.org/10.1007/s00784-018-2372-7
- Silveira, J.; Coutinho, S.; Marques, D.; Castro, J.; Mata, A.; Carvalho, M. L.; Pessanha, S. Raman Spectroscopy Analysis of Dental Enamel Treated with Whitening Product - Influence of saliva in the remineralization. Spectrochim. Acta. A Mol. Biomol. Spectrosc. 2018, 198, 145–149. doi:https://doi.org/10.1016/j.saa.2018.03.007
- Silva Soares, L. E.; Nahorny, S.; Martin, A. A. FT-Raman Spectroscopy Study of Organic Matrix Degradation in Nanofilled Resin Composite. Microsc. Microanal. 2013, 19, 327–334. doi:https://doi.org/10.1017/S1431927612014225
- Gonchukov, S.; Sukhinina, A.; Bakhmutov, D.; Minaeva, S. Raman Spectroscopy of Saliva as a Perspective Method for Periodontitis Diagnostics. Laser Phys. Lett. 2012, 9, 73–77. doi:https://doi.org/10.1002/lapl.201110095
- Passos, V. F.; Sampaio de Melo, M. A.; Marques Lima, J. P.; Marçal, F. F.; Gonçalves de Araújo Costa, C. A.; Azevedo Rodrigues, L. K.; Santiago, S. L. Active Compounds and Derivatives of Camellia Sinensis Responding to Erosive Attacks on Dentin. Braz. oral Res. 2018, 32, e40. doi:https://doi.org/10.1590/1807-3107bor-2018.vol32.0040
- Condò, R.; Cerroni, L.; Pasquantonio, G.; Mancini, M.; Pecora, A.; Convertino, A.; Mussi, V.; Rinaldi, A.; Maiolo, L. A Deep Morphological Characterization and Comparison of Different Dental Restorative Materials. Biomed. Res. Int. 2017, 2017, 7346317. doi:https://doi.org/10.1155/2017/7346317
- Mleczko, J.; Defort, A.; Kozioł, J. J.; Nguyen, T. T.; Mirończyk, A.; Zapotoczny, B.; Nowak-Jary, J.; Gronczewska, E.; Marć, M.; Dudek, M. R. Limitation of Tuning the Antibody-Antigen Reaction by Changing the Value of PH and Its Consequence for Hyperthermia. J. Biochem. 2016, 159, 421–427. doi:https://doi.org/10.1093/jb/mvv120
- Karlinsey, R. L.; Hara, A. T.; Yi, K.; Duhn, C. W. Bioactivity of Novel Self-Assembled Crystalline Nb2O5 Microstructures in Simulated and Human Salivas. Biomed. Mater. 2006, 1, 16–23. doi:https://doi.org/10.1088/1748-6041/1/1/003
- Yuen, C.; Zheng, W.; Huang, Z. Improving Surface-Enhanced Raman Scattering Effect Using Gold-Coated Hierarchical Polystyrene Bead Substrates Modified with Postgrowth Microwave Treatment. J. Biomed. Opt. 2008, 13, 064040. doi:https://doi.org/10.1117/1.3050447
- Yuen, C.; Zheng, W.; Huang, Z. Optimization of Extinction Efficiency of Gold-Coated Polystyrene Bead Substrates Improves Surface-Enhanced Raman Scattering Effects by Post-Growth Microwave Heating Treatment. J. Raman Spectrosc. 2009, 41, 374–380. doi:https://doi.org/10.1002/jrs.2464
- Hong, Y.; Zhou, X.; Xu, B.; Huang, Y.; He, W.; Wang, S.; Wang, C.; Zhou, G.; Chen, Y.; Gong, T. Optoplasmonic Hybrid Materials for Trace Detection of Methamphetamine in Biological Fluids through SERS. ACS Appl. Mater Interfaces 2020, 12, 24192–24200. doi:https://doi.org/10.1021/acsami.0c00853
- Sivashanmugan, K.; Squire, K.; Tan, A.; Zhao, Y.; Kraai, J. A.; Rorrer, G. L.; Wang, A. X. Trace Detection of Tetrahydrocannabinol in Body Fluid via Surface-Enhanced Raman Scattering and Principal Component Analysis. ACS Sens. 2019, 4, 1109–1117. doi:https://doi.org/10.1021/acssensors.9b00476
- Eom, G.; Hwang, A.; Kim, H.; Yang, S.; Lee, D. K.; Song, S.; Ha, K.; Jeong, J.; Jung, J.; Lim, E.-K.; Kang, T. Diagnosis of Tamiflu-Resistant Influenza Virus in Human Nasal Fluid and Saliva Using Surface-Enhanced Raman Scattering. ACS Sens. 2019, 4, 2282–2287. doi:https://doi.org/10.1021/acssensors.9b00697
- Chiappin, S.; Antonelli, G.; Gatti, R.; De Palo, E. F. Saliva Specimen: A New Laboratory Tool for Diagnostic and Basic Investigation. Clin. Chim. Acta. 2007, 383, 30–40. doi:https://doi.org/10.1016/j.cca.2007.04.011
- Li, X.; Yang, T.; Ding, J. Surface Enhanced Raman Spectroscopy (SERS) of Saliva for the Diagnosis of Lung Cancer. Guang Pu Xue Yu Guang Pu Fen Xi 2012, 32, 391–393.
- Hernández-Arteaga, A.; Zermeño Nava, J.; de, J.; Kolosovas-Machuca, E. S.; Velázquez-Salazar, J. J.; Vinogradova, E.; José-Yacamán, M.; Navarro-Contreras, H. R. Diagnosis of Breast Cancer by Analysis of Sialic Acid Concentrations in Human Saliva by Surface-Enhanced Raman Spectroscopy of Silver Nanoparticles. Nano Res. 2017, 10, 3662–3670. doi:https://doi.org/10.1007/s12274-017-1576-5
- Hernández-Arteaga, A. C.; Zermeño-Nava, J.; de, J.; Martínez-Martínez, M. U.; Hernández-Cedillo, A.; Ojeda-Galván, H. J.; José-Yacamánae, M.; Navarro-Contreras, H. R. Determination of Salivary Sialic Acid through Nanotechnology: A Useful Biomarker for the Screening of Breast Cancer. Arch. Med. Res. 2019, 50, 105–110. doi:https://doi.org/10.1016/j.arcmed.2019.05.013
- Lin, X.; Lin, D.; Ge, X.; Qiu, S.; Feng, S.; Chen, R. Noninvasive Detection of Nasopharyngeal Carcinoma Based on Saliva Proteins Using Surface-Enhanced Raman Spectroscopy. J. Biomed. Opt. 2017, 22, 1–6. doi:https://doi.org/10.1117/1.JBO.22.10.105004
- Stefancu, A.; Badarinza, M.; Moisoiu, V.; Iancu, S. D.; Serban, O.; Leopold, N.; Fodor, D. SERS-Based Liquid Biopsy of Saliva and Serum from Patients with Sjögren’s Syndrome. Anal. Bioanal. Chem. 2019, 411, 5877–5883. doi:https://doi.org/10.1007/s00216-019-01969-x
- Yan, W.; Lin, H.; Jinghua, L.; Dian, Q.; Anyu, C.; Yi, J.; Xun, G.; Chunwei, L.; Wen, H.; Hong, W. Preliminary Study on the Quick Detection of Acquired Immune Deficiency Syndrome by saliva analysis using surface enhanced Raman spectroscopic technique. Annu. Int. Conf. IEEE Eng. Med. Biol. Soc. 2009, 2009, 885–887. doi:https://doi.org/10.1109/IEMBS.2009.5333131
- Gracie, K.; Pang, S.; Jones, G. M.; Faulds, K.; Braybrook, J.; Graham, D. Detection of Cortisol in Serum Using Quantitative Resonance Raman Spectroscopy. Anal. Methods 2017, 9, 1589–1594. doi:https://doi.org/10.1039/C6AY03296F
- Rutherfurd-Markwick, K.; Starck, C.; Dulson, D. K.; Ali, A. Salivary Diagnostic Markers in Males and Females during Rest and Exercise. J. Int. Soc. Sports Nutr. 2017, 14, 27. doi:https://doi.org/10.1186/s12970-017-0185-8.
- Taniguchi, M.; Iizuka, J.; Murata, Y.; Ito, Y.; Iwamiya, M.; Mori, H.; Hirata, Y.; Mukai, Y.; Mikuni-Takagaki, Y. Multimolecular Salivary Mucin Complex is Altered in Saliva of Cigarette Smokers: Detection of Disulfide Bridges by Raman Spectroscopy. Biomed. Res. Int. 2013, 2013, 168765. doi:https://doi.org/10.1155/2013/168765
- Chicharro, J. L.; Lucía, A.; Pérez, M.; Vaquero, A. F.; Ureña, R. Saliva Composition and Exercise. Sports Med. 1998, 26, 17–27. doi:https://doi.org/10.2165/00007256-199826010-00002
- Cydejko, A.; Kusiak, A.; Grzybowska, M. E.; Kochańska, B.; Ochocińska, J.; Maj, A.; Świetlik, D. Selected Physicochemical Properties of Saliva in Menopausal Women — A Pilot Study. IJERPH. 2020, 17, 2604. doi:https://doi.org/10.3390/ijerph17072604
- Affoo, R. H.; Foley, N.; Garrick, R.; Siqueira, W. L.; Martin, R. E. Meta-Analysis of Salivary Flow Rates in Young and Older Adults. J. Am. Geriatr. Soc. 2015, 63, 2142–2151. doi:https://doi.org/10.1111/jgs.13652
- Lima, A. A. S.; Machado, D. F. M.; dos Santos, A. W.; Grégio, A. M. T. Avaliação Sialométrica Em Indivíduos de Terceira Idade [Sialometric Assessment in Elderly Individuals]. Rev. Odonto. Ciênc 2004, 19, 238–244.
- Walsh, N. P.; Laing, S. J.; Oliver, S. J.; Montague, J. C.; Walters, R.; Bilzon, J. L. J. Saliva Parameters as Potential Indices of Hydration Status during Acute Dehydration. Med. Sci. Sports Exerc. 2004, 36, 1535–1542. doi:https://doi.org/10.1249/01.MSS.0000139797.26760.06.
- Rekha, P.; Aruna, P.; Brindha, E.; Koteeswaran, D.; Baludavid, M.; Ganesan, S. Near-Infrared Raman Spectroscopic Characterization of Salivary Metabolites in the Discrimination of Normal from Oral Premalignant and Malignant Conditions. J. Raman Spectrosc. 2016, 47, 763–772. doi:https://doi.org/10.1002/jrs.4897
- Žukovskaja, O.; Jahn, I. J.; Weber, K.; Cialla-May, D.; Popp, J. Detection of Pseudomonas Aeruginosa Metabolite Pyocyanin in Water and Saliva by Employing the SERS Technique. Sensors 2017, 17, 1704. doi:https://doi.org/10.3390/s17081704
- Brindha, E.; Rajasekaran, R.; Aruna, P.; Koteeswaran, D.; Ganesan, S. Raman Spectroscopy of Bio Fluids: An Exploratory Study for Oral Cancer Detection. SPIE Opt. Biopsy XIV Towar. Real-Time Spectrosc. Imaging Diagn. 2016, 9703, 97031T. doi:https://doi.org/10.1117/12.2212684
- Hou, T.; Liu, Y.; Xu, L.; Wu, Y.; Ying, Y.; Wen, Y.; Guo, X.; Yang, H. Au Dotted Magnetic Graphene Sheets for Sensitive Detection of Thiocyanate. Sens. Actuators B Chem. 2017, 241, 376–382. doi:https://doi.org/10.1016/j.snb.2016.10.094
- Qiu, S.; Xu, Y.; Huang, L.; Zheng, W.; Huang, C.; Huang, S.; Lin, J.; Lin, D.; Feng, S.; Chen, R.; Pan, J. Non-Invasive Detection of Nasopharyngeal Carcinoma Using Saliva Surface-Enhanced Raman Spectroscopy. Oncol. Lett. 2016, 11, 884–890. doi:https://doi.org/10.3892/ol.2015.3969
- Feng, S.; Lin, D.; Lin, J.; Huang, Z.; Chen, G.; Li, Y.; Huang, S.; Zhao, J.; Chen, R.; Zeng, H. Saliva Analysis Combining Membrane Protein Purification with Surface-Enhanced Raman Spectroscopy for Nasopharyngeal Cancer Detection. Appl. Phys. Lett. 2014, 104, 073702. doi:https://doi.org/10.1063/1.4866027
- Zamora-Mendoza, B. N.; Espinosa-Tanguma, R.; Ramírez-Elías, M. G.; Cabrera-Alonso, R.; Montero-Moran, G.; Portales-Pérez, D.; Rosales-Romo, J. A.; Gonzalez, J. F.; Gonzalez, C. Surface-Enhanced Raman Spectroscopy: A Non Invasive Alternative Procedure for Early Detection in Childhood Asthma Biomarkers in Saliva. Photodiagn. Photodyn. Ther. 2019, 27, 85–91. doi:https://doi.org/10.1016/j.pdpdt.2019.05.009
- Wu, W.; Gong, H.; Liu, M.; Chen, G.; Chen, R. Noninvasive Breast Tumors Detection Based on Saliva Protein Surface Enhanced Raman Spectroscopy and Regularized Multinomial Regression. IEEE 8th International Conference on Biomedical Engineering and Informatics (BMEI), Shenyang, China, Oct 14–16, 2016, pp 214–218. doi:https://doi.org/10.1109/BMEI.2015.7401503
- Chen, M.; Chen, Y.; Wu, S.; Huang, W.; Lin, J.; Weng, G.-X. G.; Chen, R. Raman Spectroscopy of Human Saliva for Acute Myocardial Infarction Detection. SPIE 12th Int. Conf. Photonics Imaging Biol. Med. 2014, 9230, 92300J. doi:https://doi.org/10.1117/12.2068876
- Chen, Y.; Cheng, S.; Zhang, A.; Song, J.; Chang, J.; Wang, K.; Zhang, Y.; Li, S.; Liu, H.; Alfranca, G.; et al. Salivary Analysis Based on Surface Enhanced Raman Scattering Sensors Distinguishes Early and Advanced Gastric Cancer Patients from Healthy Persons. J. Biomed. Nanotechnol. 2018, 14, 1773–1784. doi:https://doi.org/10.1166/jbn.2018.2621
- Connolly, J. M.; Davies, K.; Kazakeviciute, A.; Wheatley, A. M.; Dockery, P.; Keogh, I.; Olivo, M. Non-Invasive and Label-Free Detection of Oral Squamous Cell Carcinoma Using Saliva Surface-Enhanced Raman Spectroscopy and Multivariate Analysis. Nanomedicine 2016, 12, 1593–1601. doi:https://doi.org/10.1016/j.nano.2016.02.021
- Falamas, A.; Faur, C. I.; Baciut, M.; Rotaru, H.; Chirila, M.; Cinta Pinzaru, S.; Hedesiu, M. Raman Spectroscopic Characterization of Saliva for the Discrimination of Oral Squamous Cell Carcinoma. Anal. Lett. 2021, 54, 57–69. doi:https://doi.org/10.1080/00032719.2020.1719129
- Lin, X.-L.; Lin, D.; Qiu, S.-F.; Ge, X.-S.; Pan, J.-J.; Wu, Q.; Lin, H.-J.; Huang, H. Detection of Nasopharyngeal Carcinoma Based on Human Saliva Surface-Enhanced Raman Spectroscopy. Spectrosc. Spectr. Anal. 2018, 38, 2430–2434. doi:https://doi.org/10.3964/j.issn.1000-0593(2018)08-2430-05.
- Al-Ogaidi, I.; Gou, H.; Al-Kazaz, A. K. A.; Aguilar, Z. P.; Melconian, A. K.; Zheng, P.; Wu, N. A Gold@Silica Core-Shell Nanoparticle-Based Surface-Enhanced Raman Scattering Biosensor for Label-Free Glucose Detection. Anal. Chim. Acta. 2014, 811, 76–80. doi:https://doi.org/10.1016/j.aca.2013.12.009
- Cao, G.; Chen, M.; Chen, Y.; Huang, Z.; Lin, J.; Lin, J.; Xu, Z.; Wu, S.; Huang, W.; Weng, G.; Chen, G. A Potential Method for Non-Invasive Acute Myocardial Infarction Detection Based on Saliva Raman Spectroscopy and Multivariate Analysis. Laser Phys. Lett. 2015, 12, 125702. doi:https://doi.org/10.1088/1612-2011/12/12/125702
- Wang, Y.; Sun, S.; Qu, D.; Chen, A.; Cui, Z.; Yao, Y.; Jiao, Y.; Guo, X.; Liu, C. Preliminary Study on Early Detection Technology of Lung Cancer Based on Surface-Enhanced Raman Spectroscopy. IEEE 3rd International Conference on Biomedical Engineering and Informatics, Yantai, China, Oct 16–18, 2010, pp 2081–2084. doi:https://doi.org/10.1109/BMEI.2010.5639379
- Lotfi, Z.; Zavvar Mousavi, H.; Sajjadi, S. M. Nitrogen Doped Nano Porous Graphene as a Sorbent for Separation and Preconcentration Trace Amounts of Pb, Cd and Cr by Ultrasonic Assisted in‐Syringe Dispersive Micro Solid Phase Extraction. Appl. Organometal. Chem. 2018, 32, e4162. doi:https://doi.org/10.1002/aoc.4162
- Desai, S.; Mishra, V.; S.; Joshi, A.; Sarkar, D.; Hole, A.; Mishra, R.; Dutt, S.; Chilakapati, M. K.; Gupta, S.; Dutt, A. Raman Spectroscopy-Based Detection of RNA Viruses in Saliva: A Preliminary Report. J. Biophoton. 2020, 13, e202000189. doi:https://doi.org/10.1002/jbio.202000189
- Hernández‐Cedillo, A.; García-Valdivieso, M. G.; Hernández‐Arteaga, A. C.; Patiño-Marín, N.; Vértiz-Hernández, Á. A.; José‐Yacamán, M.; Navarro‐Contreras, H. R. Determination of Sialic Acid Levels by Using surface-enhanced Raman spectroscopy in Periodontitis and Gingivitis. Oral Dis. 2019, 25, 1627–1633. doi:https://doi.org/10.1111/odi.13141
- Carlomagno, C.; Banfi, P. I.; Gualerzi, A.; Picciolini, S.; Volpato, E.; Meloni, M.; Lax, A.; Colombo, E.; Ticozzi, N.; Verde, F. Human Salivary Raman Fingerprint as Biomarker for the Diagnosis of Amyotrophic Lateral Sclerosis. Sci. Rep. 2020, 10, 10175. doi:https://doi.org/10.1038/s41598-020-67138-8.
- Schilling, K. M.; Bowen, W. H. Glucans Synthesized in Situ in Experimental Salivary Pellicle Function as Specific Binding Sites for Streptococcus Mutans. Infect. Immun. 1992, 60, 284–295. doi:https://doi.org/10.1128/iai.60.1.284-295.1992
- Andreou, C.; Kishore, S. A.; Kircher, M. F. Surface-Enhanced Raman Spectroscopy: A New Modality for Cancer Imaging. J. Nucl. Med. 2015, 56, 1295–1299. doi:https://doi.org/10.2967/jnumed.115.158196
- Lin, X.; Ge, X.; Xu, Z.; Zheng, Z.; Huang, W.; Hong, Q.; Lin, D. Saliva Surface-Enhanced Raman Spectroscopy for Noninvasive Optical Detection of Nasopharyngeal Cancer. SPIE Opt. Heal. Care Biomed. Opt. VII 2016, 24, 1002440. doi:https://doi.org/10.1117/12.2246261
- Goodacre, R. The Blind Men and the Elephant: Challenges in the Analysis of Complex Natural Mixtures. Faraday Discuss. 2019, 218, 524–539. doi:https://doi.org/10.1039/C9FD00074G
- Axelsson, P. Diagnosis and Risk Prediction of Dental Caries, 2nd ed.; Quintessence Books: Chicago, IL, 2000.
- Othman, N. H.; Lee, K. Y.; Radzol, A. R. M.; Mansor, W. PCA-SCG-ANN for Detection of Non-Structural Protein 1 from SERS Salivary Spectra. In ACIIDS Intelligent Information and Database Systems; Nguyen, N., Tojo, S., Nguyen, L., Trawinski, B., Eds.; Lecture Notes in Artificial Intelligence; 2017; Vol. 10192, pp 424–433. doi:https://doi.org/10.1007/978-3-319-54430-4_41
- Al-Hetlani, E.; Halámková, L.; Amin, M. O.; Lednev, I. K. Differentiating Smokers and Nonsmokers Based on Raman Spectroscopy of Oral Fluid and Advanced Statistics for Forensic Applications. J. Biophotonics. 2020, 13, e201960123. doi:https://doi.org/10.1002/jbio.201960123
- Lee, K.; Yoon, T.; Yang, H. S.; Cha, S.; Cheon, Y. P.; Kashefi-Kheyrabadi, L.; Jung, H. I. All-in-One Platform for Salivary Cotinine Detection Integrated with a Microfluidic Channel and an Electrochemical Biosensor. Lab Chip. 2020, 20, 320–331. doi:https://doi.org/10.1039/c9lc01024f
- Wu, L.; Wang, Z.; Zong, S.; Cui, Y. Rapid and Reproducible Analysis of Thiocyanate in Real Human Serum and Saliva Using a Droplet SERS-Microfluidic Chip. Biosens. Bioelectron. 2014, 62, 13–18. doi:https://doi.org/10.1016/j.bios.2014.06.026
- Ankudze, B.; Philip, A.; Pakkanen, T. T. Ultrasensitive and Recyclable Superstructure of AuSiO2@Ag Wire for Surface-Enhanced Raman Scattering Detection of Thiocyanate in Urine and Human Serum. Anal. Chim. Acta. 2019, 1049, 179–187. doi:https://doi.org/10.1016/j.aca.2018.10.040
- Yang, H.; Xiang, Y.; Guo, X.; Wu, Y.; Wen, Y.; Yang, H. Diazo-Reaction-Based SERS Substrates for Detection of Nitrite in Saliva. Sens. Actuators B Chem. 2018, 271, 118–121. doi:https://doi.org/10.1016/j.snb.2018.05.111
- Dies, H.; Raveendran, J.; Escobedo, C.; Docoslis, A. Rapid Identification and Quantification of Illicit Drugs on Nanodendritic Surface-Enhanced Raman Scattering Substrates. Sens. Actuators B Chem. 2018, 257, 382–388. doi:https://doi.org/10.1016/j.snb.2017.10.181
- Shah, P.; Kendall, F.; Khozin, S.; Goosen, R.; Hu, J.; Laramie, J.; Ringel, M.; Schork, N. Artificial Intelligence and Machine Learning in Clinical Development: A Translational Perspective. NPJ Digit. Med. 2019, 2, 69. doi:https://doi.org/10.1038/s41746-019-0148-3
- Banbury, C.; Mason, R.; Styles, I.; Eisenstein, N.; Clancy, M.; Belli, A.; Logan, A.; Goldberg Oppenheimer, P. Development of the Self Optimising Kohonen Index Network (SKiNET) for Raman Spectroscopy Based Detection of Anatomical Eye Tissue. Sci. Rep. 2019, 9, 10812. doi:https://doi.org/10.1038/s41598-019-47205-5.
- Vollmer, S.; Mateen, B. A.; Bohner, G.; Király, F. J.; Ghani, R.; Jonsson, P.; Cumbers, S.; Jonas, A.; McAllister, K. S. L.; Myles, P.; et al. Machine Learning and Artificial Intelligence Research for Patient Benefit: 20 Critical Questions on Transparency, Replicability, Ethics, and Effectiveness. BMJ 2020, 368, l6927. doi:https://doi.org/10.1136/bmj.l6927.
- Hans, K. M.-C.; Müller, S.; Sigrist, M. W. Infrared Attenuated Total Reflection (IR-ATR) Spectroscopy for Detecting Drugs in Human Saliva. Drug Test Anal. 2012, 4, 420–429. doi:https://doi.org/10.1002/dta.346
- Shin, D. M.; Ro, J. Y.; Hong, W. K.; Hittelman, W. N. Dysregulation of Epidermal Growth Factor Receptor Expression in Premalignant Lesions during Head and Neck Tumorigenesis. Cancer Res. 1994, 54, 3153–3159.
- Jones, S. R.; Carley, S.; Harrison, M. An Introduction to Power and Sample Size Estimation. Emerg. Med. J. 2003, 20, 453–458. doi:https://doi.org/10.1136/emj.20.5.453
- Bel’skaya, L. V.; Sarf, E. A.; Solomatin, D. V.; Kosenok, V. K. Analysis of the Lipid Profile of Saliva in Ovarian and Endometrial Cancer by IR Fourier Spectroscopy. Vib. Spectrosc. 2019, 104, 102944–102949. doi:https://doi.org/10.1016/j.vibspec.2019.102944
- Mamoun, R. Customized Extracellular Vesicles for Preventative and Therapeutic Solutions. https://www.nanoviewbio.com/exosome-blog/2020/7/17/focus-on-exosomes-with-dr-robert-mamoun.
- Hole, A.; Tyagi, G.; Deshmukh, A.; Deshpande, R.; Gota, V.; Chaturvedi, P.; Krishna, C. M. Salivary Raman Spectroscopy: Standardization of Sampling Protocols and Stratification of Healthy and Oral Cancer Subjects. Appl. Spectrosc. 2021, 75, 581–588. doi:https://doi.org/10.1177/0003702820973260
- Li, W.; Li, X.; Yang, T.; Guo, X.; Song, Y. Detection of Saliva Morphine Using Surface-Enhanced Raman Spectroscopy Combined with Immunochromatographic Assay. J. Raman Spectrosc. 2020, 51, 642–648. doi:https://doi.org/10.1002/jrs.5822
- Moisoiu, V.; Badarinza, M.; Stefancu, A.; Iancu, S. D.; Serban, O.; Leopold, N.; Fodor, D. Combining Surface-Enhanced Raman Scattering (SERS) of Saliva and Two-Dimensional Shear Wave Elastography (2D-SWE) of the Parotid Glands in the Diagnosis of Sjögren's syndrome. Spectrochim. Acta A Mol. Biomol. Spectrosc. 2020, 235, 118267. doi:https://doi.org/10.1016/j.saa.2020.118267
- Su, M.; Jiang, Y.; Yu, F.; Yu, T.; Du, S.; Xu, Y.; Yang, L.; Liu, H. Mirrorlike Plasmonic Capsules for Online Microfluidic Raman Analysis of Drug in Human Saliva and Urine. ACS Appl. Bio Mater. 2019, 2, 3828–3835. doi:https://doi.org/10.1021/acsabm.9b00425
- Zhang, A.; Chang, J.; Chen, Y.; Huang, Z.; Alfranca, G.; Zhang, Q.; Cui, D. Spontaneous Implantation of Gold Nanoparticles on Graphene Oxide for Salivary SERS Sensing. Anal. Methods 2019, 11, 5089–5097. doi:https://doi.org/10.1039/C9AY01500K
- Velička, M.; Zacharovas, E.; Adomavičiūtė, S.; Valdas, Š. Detection of caffeine intake by Means of EC-SERS Spectroscopy of Human Saliva. Spectrochim. Acta. A Mol. Biomol. Spectrosc. 2021, 246, 118956. doi:https://doi.org/10.1016/j.saa.2020.118956
- Kim, Y.-W.; Kim, Y.-K. The Effects of Storage of Human Saliva on DNA Isolation and Stability. J. Oral Med. Pain 2006, 31, 1–16.
- Hu, S.; Loo, J. A.; Wong, D. T. Human Saliva Proteome Analysis. Ann. N Y Acad. Sci. 2007, 1098, 323–329. doi:https://doi.org/10.1196/annals.1384.015
- Cui, L.; Butler, H. J.; Martin-Hirsch, P. L.; Martin, F. L. Aluminium Foil as a Potential Substrate for ATR-FTIR, Transflection FTIR or Raman Spectrochemical Analysis of Biological Specimens. Anal. Methods 2016, 8, 481–487. doi:https://doi.org/10.1039/C5AY02638E
- Filik, J.; Stone, N. Drop Coating Deposition Raman Spectroscopy of Protein Mixtures. Analyst 2007, 132, 544–550. doi:https://doi.org/10.1039/b701541k
- Kočišová, E.; Procházka, M.; Vaculčiaková, L. Drop-Coating Deposition Raman (DCDR) Spectroscopy as a Tool for Membrane Interaction Studies: Liposome-Porphyrin Complex. Appl. Spectrosc. 2015, 69, 939–945. doi:https://doi.org/10.1366/14-07836
- Guicheteau, J. A.; Tripathi, A.; Emmons, E. D.; Christesen, S. D.; Fountain, I. I. I.; A. W. Reassessing SERS Enhancement Factors: Using Thermodynamics to Drive Substrate Design. Faraday Discuss. 2017, 205, 547–560. doi:https://doi.org/10.1039/c7fd00141j
- Deegan, R. D.; Bakajin, O.; Dupont, T. F.; Huber, G.; Nagel, S. R.; Witten, T. A. Capillary Flow as the Cause of Ring Stains from Dried Liquid Drops. Nature 1997, 389, 827–829. doi:https://doi.org/10.1038/39827
- Hoppmann, E. P.; Yu, W. W.; White, I. M. Highly Sensitive and Flexible Inkjet Printed SERS Sensors on Paper. Methods 2013, 63, 219–224. doi:https://doi.org/10.1016/j.ymeth.2013.07.010
- Filik, J.; Stone, N. Analysis of Human Tear Fluid by Raman Spectroscopy. Anal. Chim. Acta. 2008, 616, 177–184. doi:https://doi.org/10.1016/j.aca.2008.04.036
- Filik, J.; Stone, N. Investigation into the Protein Composition of Human Tear Fluid Using Centrifugal Filters and Drop Coating Deposition Raman Spectroscopy. J. Raman Spectrosc. 2009, 40, 218–224. doi:https://doi.org/10.1002/jrs.2113
- Kočišová, E.; Sayedová, S.; Procházka, M. Drop Coating Deposition Raman Scattering of Selected Small Molecules of Biological Importance. J. Raman Spectrosc. 2020, 51, 871–874. doi:https://doi.org/10.1002/jrs.5840
- Zhang, D.; Xie, Y.; Mrozek, M. F.; Ortiz, C.; Davisson, V. J.; Ben-Amotz, D. Raman Detection of Proteomic Analytes. Anal. Chem. 2003, 75, 5703–5709. doi:https://doi.org/10.1021/ac0345087
- Kopecký, V.; Baumruk, V. Structure of the Ring in Drop Coating Deposited Proteins and Its Implication for Raman Spectroscopy of Biomolecules. Vib. Spectrosc. 2006, 42, 184–187. doi:https://doi.org/10.1016/j.vibspec.2006.04.019
- Barman, I.; Dingari, N. C.; Kang, J. W.; Horowitz, G. L.; Dasari, R. R.; Feld, M. S. Raman Spectroscopy-Based Sensitive and Specific Detection of Glycated Hemoglobin. Anal. Chem. 2012, 84, 2474–2482. doi:https://doi.org/10.1021/ac203266a
- Kočišová, E.; Procházka, M. Drop-Coating Deposition Raman Spectroscopy of Liposomes. J. Raman Spectrosc. 2011, 42, 1606–1610. doi:https://doi.org/10.1002/jrs.2915
- Šimáková, P.; Kočišová, E.; Procházka, M. Sensitive Raman Spectroscopy of Lipids Based on Drop Deposition Using DCDR and SERS. J. Raman Spectrosc. 2013, 44, 1479–1482. doi:https://doi.org/10.1002/jrs.4364
- Kočišová, E.; Procházka, M. Drop Coating Deposition Raman Spectroscopy of Dipicolinic Acid. J. Raman Spectrosc. 2018, 49, 2050–2052. doi:https://doi.org/10.1002/jrs.5493
- Zhang, D.; Mrozek, M. F.; Xie, Y.; Ben-Amotz, D. O. R. Chemical Segregation and Reduction of Raman Background Interference Using Drop Coating Deposition. Appl. Spectrosc. 2004, 58, 929–933. doi:https://doi.org/10.1366/0003702041655430
- Jeong, H.; Han, C.; Cho, S.; Gianchandani, Y.; Park, J. Analysis of Extracellular Vesicles Using Coffee Ring. ACS Appl Mater Interfaces 2018, 10, 22877–22882. doi:https://doi.org/10.1021/acsami.8b05793
- Sefiane, K. Patterns from Drying Drops. Adv. Colloid Interface Sci. 2014, 206, 372–381. doi:https://doi.org/10.1016/j.cis.2013.05.002
- Sefiane, K. On the Formation of Regular Patterns from Drying Droplets and Their Potential Use for Bio-Medical Applications. J. Bionic Eng. 2010, 7, S82–S93. doi:https://doi.org/10.1016/S1672-6529(09)60221-3
- Shabalin, V. N.; Shatokhina, S. N. Method of Diagnosing Complicated Urolithiasis and Prognosticating Urolithiasis. European Patent EP0504409/A1, 1996.
- Hamadeh, L.; Imran, S.; Bencsik, M.; Sharpe, G. R.; Johnson, M. A.; Fairhurst, D. J. Machine Learning Analysis for Quantitative Discrimination of Dried Blood Droplets. Sci. Rep. 2020, 10, 3313. doi:https://doi.org/10.1038/s41598-020-59847-x.
- Díaz-Liñán, M. C.; García-Valverde, M. T.; López-Lorente, A. I.; Cárdenas, S.; Lucena, R. Silver Nanoflower-Coated Paper as Dual Substrate for Surface-Enhanced Raman Spectroscopy and Ambient Pressure Mass Spectrometry Analysis. Anal. Bioanal. Chem. 2020, 412, 3547–3557. doi:https://doi.org/10.1007/s00216-020-02603-x
- Pearce, E. I.; Tomlinson, A. Spatial Location Studies on the Chemical Composition of Human Tear Ferns. Oph. Phys. Opt. 2000, 20, 306–313. doi:https://doi.org/10.1046/j.1475-1313.2000.00523.x
- Berg, J. C. An Introduction to Interfaces and Colloids: The Bridge to Nanoscience, 1st ed.; World Scientific Publishing Co.: Toh Tuck Link, Singapore, 2010.
- Bhardwaj, R.; Fang, X.; Somasundaran, P.; Attinger, D. Self-Assembly of Colloidal Particles from Evaporating Droplets: Role of DLVO Interactions and Proposition of a Phase Diagram. Langmuir 2010, 26, 7833–7842. doi:https://doi.org/10.1021/la9047227
- Boström, M.; Williams, D. R. M.; Ninham, B. W. Specific Ion Effects: Why DLVO Theory Fails for Biology and Colloid Systems. Phys. Rev. Lett. 2001, 87, 168103. doi:https://doi.org/10.1103/PhysRevLett.87.168103
- Uthayakumar, G. S.; Senthilkumar; Inbasekaran, S.; Sivasubramanian, A.; Jacob, S. J. P. Nanoparticle Analysis for Various Medicinal Drugs and Human Body Saliva at Macromolecular Level. Appl. Nanosci. 2015, 5, 563–568. doi:https://doi.org/10.1007/s13204-014-0350-1
- Hardy, M.; Doherty, M. D.; Krstev, I.; Maier, K.; Möller, T.; Müller, G.; Dawson, P. Detection of Low-Concentration Contaminants in Solution by Exploiting Chemical Derivatization in Surface-Enhanced Raman Spectroscopy. Anal. Chem. 2014, 86, 9006–9012. doi:https://doi.org/10.1021/ac5014095
- Zhu, R.; Avsievich, T.; Popov, A.; Meglinski, I. Optical Tweezers in Studies of Red Blood Cells. Cells 2020, 9, 545–527. doi:https://doi.org/10.3390/cells9030545
- Yuan, Y.; Lin, Y.; Gu, B.; Panwar, N.; Tjin, S. C.; Song, J.; Qu, J.; Yong, K.-T. Optical Trapping-Assisted SERS Platform for Chemical and Biosensing Applications: Design Perspectives. Coord. Chem. Rev. 2017, 339, 138–152. doi:https://doi.org/10.1016/j.ccr.2017.03.013
- Yang, Y.; Ren, Y.-X.; Chen, M.; Arita, Y.; Rosales-Guzmán, C. Optical Trapping with Structured Light: A Review. Adv. Photonics 2021, 3, 034001. doi:https://doi.org/10.1117/1.AP.3.3.034001.
- Raziman, T.; V; Wolke, R. J.; Martin, O. J. F. Optical Forces in Nanoplasmonic Systems: How Do They Work, What Can They Be Useful for? Faraday Discuss. 2015, 178, 421–434. doi:https://doi.org/10.1039/c4fd00224e
- Huang, Z.; Cao, G.; Sun, Y.; Du, S.; Li, Y.; Feng, S.; Lin, J.; Lei, J. Evaluation and Optimization of Paper-Based SERS Substrate for Potential Label-Free Raman Analysis of Seminal Plasma. J. Nanomater. 2017, 2017, 1–8. doi:https://doi.org/10.1155/2017/4807064
- Kaneta, T.; Alahmad, W.; Varanusupakul, P. Microfluidic Paper-Based Analytical Devices with Instrument-Free Detection and Miniaturized Portable Detectors. Appl. Spectrosc. Rev. 2019, 54, 117–141. doi:https://doi.org/10.1080/05704928.2018.1457045
- Zangheri, M.; Cevenini, L.; Anfossi, L.; Baggiani, C.; Simoni, P.; Di Nardo, F.; Roda, A. A Simple and Compact Smartphone Accessory for Quantitative Chemiluminescence-Based Lateral Flow Immunoassay for Salivary Cortisol Detection. Biosens. Bioelectron. 2015, 64, 63–68. doi:https://doi.org/10.1016/j.bios.2014.08.048
- Álvarez-Puebla, R. A. Effects of the Excitation Wavelength on the SERS Spectrum. J. Phys. Chem. Lett. 2012, 3, 857–866. doi:https://doi.org/10.1021/jz201625j
- Matousek, P.; Stone, N. Development of Deep Subsurface Raman Spectroscopy for Medical Diagnosis and Disease Monitoring. Chem. Soc. Rev. 2016, 45, 1794–1802. doi:https://doi.org/10.1039/c5cs00466g
- Zhao, J.; Pinchuk, A. O.; McMahon, J. M.; Li, S.; Ausman, L. K.; Atkinson, A. L.; Schatz, G. C. Methods for Describing the Electromagnetic Properties of Silver and Gold Nanoparticles. Acc. Chem. Res. 2008, 41, 1710–1720. doi:https://doi.org/10.1021/ar800028j
- Knight, M. W.; King, N. S.; Liu, L.; Everitt, H. O.; Nordlander, P.; Halas, N. J. Aluminum for Plasmonics. ACS Nano. 2014, 8, 834–840. doi:https://doi.org/10.1021/nn405495q
- Sigle, D. O.; Perkins, E.; Baumberg, J. J.; Mahajan, S. Reproducible Deep-UV SERRS on Aluminum Nanovoids. J. Phys. Chem. Lett. 2013, 4, 1449–1452. doi:https://doi.org/10.1021/jz4004813
- Agarwal, U. P. 1064 Nm FT-Raman Spectroscopy for Investigations of Plant Cell Walls and Other Biomass Materials. Front. Plant Sci. 2014, 5, 490. doi:https://doi.org/10.3389/fpls.2014.00490
- Braga, S. R. M.; de Oliveira, E.; Sobral, M. A. P. Effect of Neodymium:Yttrium-Aluminum-Garnet Laser and Fluoride on the Acid Demineralization of Enamel. J. Invest. Clin. Dent. 2017, 8, e12185. doi:https://doi.org/10.1111/jicd.12185
- Braga, S. R. M.; de Faria, D. L. A.; de Oliveira, E.; Sobral, M. A. P. Morphological and Mineral Analysis of Dental Enamel after Erosive Challenge in Gastric Juice and Orange Juice. Microsc. Res. Tech. 2011, 74, 1083–1087. doi:https://doi.org/10.1002/jemt.20998
- Farquharson, S.; Gift, A. D.; Shende, C.; Maksymiuk, P.; Inscore, F. E.; Murran, J. Detection of 5-Fluorouracil in Saliva Using Surface-Enhanced Raman Spectroscopy. Vib. Spectrosc. 2005, 38, 79–84. doi:https://doi.org/10.1016/j.vibspec.2005.02.021
- McLaughlin, G.; Lednev, I. K. A Modified Raman Multidimensional Spectroscopic Signature of Blood to account for the Effect of Laser Power. Forensic Sci. Int. 2014, 240, 88–94. doi:https://doi.org/10.1016/j.forsciint.2014.04.021
- Moskovits, M. SERS, Surface and Interfacial Phenomena. In 11th International Conference on Raman Spectroscopy; Clark, R. J. H., Long, D. A., Eds.; Wiley–Blackwell: London, 1988.
- Dieringer, J. A.; McFarland, A. D.; Shah, N. C.; Stuart, D. A.; Whitney, A.; V; Yonzon, C. R.; Young, M. A.; Zhang, X.; Van Duyne, R. P. Surface Enhanced Raman Spectroscopy: New Materials, Concepts, Characterization Tools, and Applications. Faraday Discuss. 2006, 132, 9–26. doi:https://doi.org/10.1039/b513431p
- Banholzer, M. J.; Millstone, J. E.; Qin, L.; Mirkin, C. A. Rationally Designed Nanostructures for Surface-Enhanced Raman Spectroscopy. Chem. Soc. Rev. 2008, 37, 885–897. doi:https://doi.org/10.1039/b710915f
- Le Ru, E. C.; Etchegoin, P. G. Recent Developments. In Principles of Surface-Enhanced Raman Spectroscopy: And Related Plasmonic Effects; Le Ru, E. C., Etchegoin, P. G., Eds.: Elsevier: Amsterdam, 2009; pp 415–464. doi:https://doi.org/10.1016/b978-0-444-52779-0.00014-3
- Hankus, M. E.; Stratis-Cullum, D. N.; Pellegrino, P. M. Surface Enhanced Raman Scattering (SERS)-Based Next Generation Commercially Available Substrate: Physical Characterization and Biological Application. Biosens. Nanomed. IV 2011, 8099, 0990N. doi:https://doi.org/10.1117/12.893842
- Cetin, A. E.; Altug, H. Fano Resonant Ring/Disk Plasmonic Nanocavities on Conducting Substrates for Advanced Biosensing. ACS Nano. 2012, 6, 9989–9995. doi:https://doi.org/10.1021/nn303643w
- Macias, G.; Alba, M.; Marsal, L. F.; Mihi, A. Surface Roughness Boosts the SERS Performance of Imprinted Plasmonic Architectures. J. Mater. Chem. C. 2016, 4, 3970–3975. doi:https://doi.org/10.1039/C5TC02779A
- Wuytens, P. C.; Demol, H.; Turk, N.; Gevaert, K.; Skirtach, A. G.; Lamkanfi, M.; Baets, R. Gold Nanodome SERS Platform for Label-Free Detection of Protease Activity. Faraday Discuss. 2017, 205, 345–361. doi:https://doi.org/10.1039/c7fd00124j
- Schmidt, M. S.; Hübner, J.; Boisen, A. Large Area Fabrication of Leaning Silicon Nanopillars for Surface Enhanced Raman Spectroscopy. Adv. Mater. 2012, 24, OP11–18. doi:https://doi.org/10.1002/adma.201103496
- Sanger, K.; Durucan, O.; Wu, K.; Thilsted, A. H.; Heiskanen, A.; Rindzevicius, T.; Schmidt, M. S.; Zór, K.; Boisen, A. Large-Scale, Lithography-Free Production of Transparent Nanostructured Surface for Dual-Functional Electrochemical and SERS Sensing. ACS Sens. 2017, 2, 1869–1875. doi:https://doi.org/10.1021/acssensors.7b00783
- Banbury, C.; Rickard, J. J. S.; Mahajan, S.; Goldberg Oppenheimer, P. Tuneable Metamaterial-Like Platforms for Surface-Enhanced Raman Scattering via Three-Dimensional Block Co-Polymer-Based Nanoarchitectures. ACS Appl. Mater. Interfaces. 2019, 11, 14437–14444. doi:https://doi.org/10.1021/acsami.9b00420
- De Carvalho Gomes, P.; Rickard, J. S.; Goldberg Oppenheimer, P. Electrofluidynamic Patterning of Tailorable Nanostructured Substrates for Surface-Enhanced Raman Scattering. ACS Appl. Nano Mater. 2020, 3, 6774–6784. doi:https://doi.org/10.1021/acsanm.0c01190
- Štolcová, L.; Proška, J.; Novotný, F.; Procházka, M.; Richter, I. Periodic Arrays of Metal Nanobowls as SERS-Active Substrates; NANOCON: Brno, Czech Republic, 2011.
- Dawson, P.; Duenas, J. A.; Boyle, M. G.; Doherty, M. D.; Bell, S. E. J.; Kern, A. M.; Martin, O. J. F.; Teh, A. S.; Teo, K. B. K.; Milne, W. I. Combined Antenna and Localized Plasmon Resonance in Raman Scattering from Random Arrays of Silver-Coated, Vertically Aligned Multiwalled Carbon Nanotubes. Nano Lett. 2011, 11, 365–371. doi:https://doi.org/10.1021/nl102838w
- Coppé, J. P.; Xu, Z.; Chen, Y.; Logan Liu, G. Metallic Nanocone Array Photonic Substrate for High-Uniformity Surface Deposition and Optical Detection of Small Molecules. Nanotechnology 2011, 22, 245710. doi:https://doi.org/10.1088/0957-4484/22/24/245710
- Doherty, M. D.; Murphy, A.; Pollard, R. J.; Dawson, P. Surface-Enhanced Raman Scattering from Metallic Nanostructures: Bridging the Gap between the near-Field and Far-Field Responses. Phys. Rev. X. 2013, 3, 011001. doi:https://doi.org/10.1103/PhysRevX.3.011001
- Goldberg-Oppenheimer, P.; Mahajan, S.; Steiner, U. Hierarchical Electrohydrodynamic Structures for Surface-Enhanced Raman Scattering. Adv. Mater. 2012, 24, 175–180. doi:https://doi.org/10.1002/adma.201104159
- Mahajan, S.; Baumberg, J. J.; Russell, E.; Bartlett, P. N. Reproducible SERRS from Structured Gold Surfaces. Phys. Chem. Chem. Phys. 2007, 9, 6016–6020. doi:https://doi.org/10.1039/b712144j
- Šubr, M.; Petr, M.; Peksa, V.; Kylián, O.; Hanuš, J.; Procházka, M. Ag Nanorod Arrays for SERS: Aspects of Spectral Reproducibility, Surface Contamination, and Spectral Sensitivity. J. Nanomater. 2015, 2015, 1–7. doi:https://doi.org/10.1155/2015/729231
- Wu, K.; Boisen, A.; Rindzevicius, T.; Thilsted, A. H.; Schmidt, M. S. Optimizing Silver‐Capped Silicon Nanopillars to Simultaneously Realize Macroscopic, Practical‐Level SERS Signal Reproducibility and High Enhancement at Low Costs. J. Raman Spectrosc. 2017, 48, 1808–1818. doi:https://doi.org/10.1002/jrs.5255
- Oh, Y. J.; Kang, M.; Park, M.; Jeong, K. H. Engineering Hot Spots on Plasmonic Nanopillar Arrays for SERS: A Review. BioChip J. 2016, 10, 297–309. doi:https://doi.org/10.1007/s13206-016-0406-2
- Mosier-Boss, P. Review of SERS Substrates for Chemical Sensing. Nanomater 2017, 7, 142. doi:https://doi.org/10.3390/nano7060142
- Baumberg, J.; Bell, S.; Bonifacio, A.; Chikkaraddy, R.; Chisanga, M.; Corsetti, S.; Delfino, I.; Eremina, O.; Fasolato, C.; Faulds, K.; et al. SERS in Biology/Biomedical SERS: General Discussion. Faraday Discuss. 2017, 205, 429–453. doi:https://doi.org/10.1039/c7fd90089a
- Perkel, J. M. Advances in Analytical Chemistry: Processes, Techniques, and Instrumentation; American Chemical Society: Washington, DC, 2017.
- Mao, B.-H.; Chen, Z.-Y.; Wang, Y.-J.; Yan, S.-J. Silver Nanoparticles Have Lethal and Sublethal Adverse Effects on Development and Longevity by Inducing ROS-Mediated Stress Responses. Sci. Rep. 2018, 8, 2445. doi:https://doi.org/10.1038/s41598-018-20728-z.
- Stensberg, M. C.; Wei, Q.; McLamore, E. S.; Porterfield, D. M.; Wei, A.; Sepúlveda, M. S. Toxicological Studies on Silver Nanoparticles: Challenges and Opportunities in Assessment, Monitoring and Imaging. Nanomedicine (Lond.) 2011, 6, 879–898. doi:https://doi.org/10.2217/nnm.11.78
- Goodacre, R.; Graham, D.; Faulds, K. Recent Developments in Quantitative SERS: Moving towards Absolute Quantification. Trends Anal. Chem. 2018, 102, 359–368. doi:https://doi.org/10.1016/j.trac.2018.03.005
- Bell, S. E. J.; Charron, G.; Cortés, E.; Kneipp, J.; Lamy de la Chapelle, M.; Langer, J.; Procházka, M.; Tran, V.; Schlücker, S. Towards Reliable and Quantitative Surface-Enhanced Raman Scattering (SERS): from Key Parameters to Good Analytical Practice. Angew. Chem. Int. Ed. Engl. 2020, 59, 5454–5462. doi:https://doi.org/10.1002/anie.201908154
- Natan, M. J. Concluding Remarks: Surface Enhanced Raman Scattering. Faraday Discuss. 2006, 132, 321. doi:https://doi.org/10.1039/b601494c
- Durucan, O.; Wu, K.; Viehrig, M.; Rindzevicius, T.; Boisen, A. Nanopillar-Assisted SERS Chromatography. ACS Sens. 2018, 3, 2492–2498. doi:https://doi.org/10.1021/acssensors.8b00887
- Hamon, C.; Liz-Marzán, L. M. Colloidal Design of Plasmonic Sensors Based on Surface Enhanced Raman Scattering. J. Colloid Interface Sci. 2018, 512, 834–843. doi:https://doi.org/10.1016/j.jcis.2017.10.117
- Nyamekye, C. K. A.; Weibel, S. C.; Smith, E. A. Directional Raman Scattering Spectra of Metal – Sulfur Bonds at Smooth Gold and Silver Substrates. J. Raman Spectrosc. 2021, 52, 1–10. doi:https://doi.org/10.1002/jrs.6124.
- Kline, N. D.; Tripathi, A.; Mirsafavi, R.; Pardoe, I.; Moskovits, M.; Meinhart, C.; Guicheteau, J. A.; Christesen, S. D.; Fountain, A. W. III, Optimization of Surface-Enhanced Raman Spectroscopy Conditions for Implementation into a Microfluidic Device for Drug Detection. Anal. Chem. 2016, 88, 10513–10522. doi:https://doi.org/10.1021/acs.analchem.6b02573
- Ye, Z.; Li, C.; Xu, Y.; Bell, S. E. J. Exploiting the Chemical Differences between Ag and Au Colloids Allows Dramatically Improved SERS Detection of “Non-Adsorbing” molecules. Analyst 2019, 144, 448–453. doi:https://doi.org/10.1039/c8an01927d
- Etchegoin, P. G.; Le Ru, E. C. Basic Electromagnetic Theory of SERS. In Surface Enhanced Raman Spectroscopy: Analytical, Biophysical and Life Science Applications; Schlücker, S., Ed., Wiley-VCH: Weinheim, Germany, 2010; pp 1–37.
- Gersten, J.; Nitzan, A. Electromagnetic Theory of Enhanced Raman Scattering by Molecules Adsorbed on Rough Surfaces. J. Chem. Phys. 1980, 73, 3023–3037. doi:https://doi.org/10.1063/1.440560
- Farquharson, S.; Maksymiuk, P. Simultaneous Chemical Separation and Surface-Enhanced Raman Spectral Detection Using Silver-Doped Sol-Gels. Appl. Spectrosc. 2003, 57, 479–482. doi:https://doi.org/10.1366/00037020360626041
- Mohammadi, A.; Nicholls, D. L.; Docoslis, A. Improving the Surface-Enhanced Raman Scattering Performance of Silver Nanodendritic Substrates with Sprayed-on Graphene-Based Coatings. Sensors 2018, 18, 3404. doi:https://doi.org/10.3390/s18103404
- Lai, H.; Xu, F.; Zhang, Y.; Wang, L. Recent Progress on Graphene-Based Substrates for Surface-Enhanced Raman Scattering Applications. J. Mater. Chem. B. 2018, 6, 4008–4028. doi:https://doi.org/10.1039/c8tb00902c
- Zheng, P.; Li, M.; Jurevic, R.; Cushing, S. K.; Liu, Y.; Wu, N. A Gold Nanohole Array Based Surface-Enhanced Raman Scattering Biosensor for Detection of Silver(I) and Mercury(II) in Human Saliva. Nanoscale 2015, 7, 11005–11012. doi:https://doi.org/10.1039/C5NR02142A
- Han, S.; Locke, A. K.; Oaks, L. A.; Cheng, Y.-S. L.; Coté, G. L. Development of a Free-Solution SERS-Based Assay for Point-of-Care Oral Cancer Biomarker Detection Using DNA-Conjugated Gold Nanoparticles. SPIE Opt. Diagnostics Sens. XVIII Towar. Point-of-Care Diagn. 2018, 10501, 1050104. doi:https://doi.org/10.1117/12.2290516
- Kruszewski, S. Dependence of SERS Signal on Surface Roughness. Surf. Interface Anal. 1994, 21, 830–838. doi:https://doi.org/10.1002/sia.740211203
- Karapetsas, G.; Matar, O. K.; Valluri, P.; Sefiane, K. Convective Rolls and Hydrothermal Waves in Evaporating Sessile Drops. Langmuir 2012, 28, 11433–11439. doi:https://doi.org/10.1021/la3019088
- Mollaret, R.; Sefiane, K.; Christy, J. R. E.; Veyret, D. Experimental and Numerical Investigation of the Evaporation into Air of a Drop on a Heated Surface. Chem. Eng. Res. Des. 2004, 82, 471–480. doi:https://doi.org/10.1205/026387604323050182
- Xavier, J.; Vincent, S.; Meder, F.; Vollmer, F. Advances in Optoplasmonic Sensors – Combining Optical Nano/Microcavities and Photonic Crystals with Plasmonic Nanostructures and Nanoparticles. Nanophotonics 2018, 7, 1–38. doi:https://doi.org/10.1515/nanoph-2017-0064
- Chen, Y.; Yin, Y.; Ma, L.; Schmidt, O. G. Recent Progress on Optoplasmonic Whispering-Gallery-Mode Microcavities. Adv. Optical Mater. 2021, 9, 2100143. doi:https://doi.org/10.1002/adom.202100143
- Blanchard-Dionne, A.-P.; Martin, O. J. F. Teaching Optics to a Machine Learning Network. Opt. Lett. 2020, 45, 2922–2925. doi:https://doi.org/10.1364/OL.390600
- Gallinet, B.; Butet, J.; Martin, O. J. F. Numerical Methods for Nanophotonics: Standard Problems and Future Challenges. Laser Photon. Rev. 2015, 9, 577–603. doi:https://doi.org/10.1002/lpor.201500122
- Yao, K.; Unni, R.; Zheng, Y. Intelligent Nanophotonics: Merging Photonics and Artificial Intelligence at the Nanoscale. Nanophotonics 2019, 8, 339–366. doi:https://doi.org/10.1515/nanoph-2018-0183
- Muskens, O. L.; Wiecha, P. A Deep Neural Network for Generalized Prediction of the near Fields and Far Fields of Arbitrary 3D Nanostructures. SPIE Nanosci. + Eng. Emerg. Top. Artif. Intell. 2020, 11469, 1146908. doi:https://doi.org/10.1117/12.2568624
- Kochkov, D.; Smith, J. A.; Alieva, A.; Wang, Q.; Brenner, M. P.; Hoyer, S. Machine Learning – Accelerated Computational Fluid Dynamics. Proc. Natl. Acad. Sci. USA 2021, 118, e2101784118. doi:https://doi.org/10.1073/pnas.2101784118
- Brunton, S. L.; Noack, B. R.; Koumoutsakos, P. Machine Learning for Fluid Mechanics. Annu. Rev. Fluid Mech. 2020, 52, 477–508. doi:https://doi.org/10.1146/annurev-fluid-010719-060214
- Doty, K. C.; McLaughlin, G.; Lednev, I. K. A Raman "Spectroscopic Clock" for Bloodstain Age Determination: The First Week after Deposition. Anal. Bioanal. Chem. 2016, 408, 3993–4001. doi:https://doi.org/10.1007/s00216-016-9486-z
- Acquarelli, J.; van Laarhoven, T.; Gerretzen, J.; Tran, T.; Buydens, L.; Marchiori, E. Convolutional Neural Networks for Vibrational Spectroscopic Data Analysis. Anal. Chim. Acta. 2017, 954, 22–31. doi:https://doi.org/10.1016/j.aca.2016.12.010
- Othman, N. H.; Lee, K. Y.; Radzol, A. R. M.; Mansor, W. Termination Criterion for PCA with ANN for Detection of NS1 from Adulterated Saliva. J. Teknol. 2016, 78, 13–20. doi:https://doi.org/10.11113/jt.v78.9044.
- Wold, S. Chemometrics; What Do We Mean with It, and What Do We Want from It? Chemom. Intell. Lab. Syst. 1995, 30, 109–115. doi:https://doi.org/10.1016/0169-7439(95)00042-9
- Liu, W.; Man, Z.; Hua, L.; Chen, A.; Wang, Y.; Qian, K.; Zhang, Y. Data Mining Methods of Lung Cancer Diagnosis by Saliva Tests Using Surface Enhanced Raman Spectroscopy. IEEE 7th International Conference on Biomedical Engineering and Informatics, Dalian, China, Oct 14–16, 2014, pp 623–627. doi:https://doi.org/10.1109/BMEI.2014.7002849
- Yang, J.; Xu, J.; Zhang, X.; Wu, C.; Lin, T.; Ying, Y. Deep Learning for Vibrational Spectral Analysis: Recent Progress and a Practical Guide. Anal. Chim. Acta. 2019, 1081, 6–17. doi:https://doi.org/10.1016/j.aca.2019.06.012
- Grigorescu, I. Medical Marvels. Phys. World 2021, 34, 35–36. doi:https://doi.org/10.1088/2058-7058/34/05/36
- Oresko, J. J.; Jin, Z.; Cheng, J.; Huang, S.; Sun, Y.; Duschl, H.; Cheng, A. C. A Wearable Smartphone-Based Platform for Real-Time Cardiovascular Disease Detection via Electrocardiogram Processing. IEEE Trans. Inf. Technol. Biomed. 2010, 14, 734–740. doi:https://doi.org/10.1109/TITB.2010.2047865
- Schwab, P.; Karlen, W. A Deep Learning Approach to Diagnosing Multiple Sclerosis from Smartphone Data. IEEE J. Biomed. Health Inform. 2021, 25, 1284–1291. doi:https://doi.org/10.1109/JBHI.2020.3021143
- Zhan, A.; Mohan, S.; Tarolli, C.; Schneider, R. B.; Adams, J. L.; Sharma, S.; Elson, M. J.; Spear, K. L.; Glidden, A. M.; Little, M. A.; et al. Using Smartphones and Machine Learning to Quantify Parkinson Disease Severity the Mobile Parkinson Disease Score. JAMA Neurol. 2018, 75, 876–880. doi:https://doi.org/10.1001/jamaneurol.2018.0809
- Beleites, C.; Neugebauer, U.; Bocklitz, T.; Krafft, C.; Popp, J. Sample Size Planning for Classification Models. Anal. Chim. Acta. 2013, 760, 25–33. doi:https://doi.org/10.1016/j.aca.2012.11.007
- Othman, N.; Lee, K. Y.; Radzol, A.; Mansor, W.; Ramlan, N. Linear Discriminant Analysis for Detection of Salivary NS1 from SERS Spectra. IEEE Reg. 10 Int. Conf. TENCON 2017 2017, 2017, 2876–2879. doi:https://doi.org/10.1109/TENCON.2017.8228352
- Guo, S.; Rösch, P.; Popp, J.; Bocklitz, T. Modified PCA and PLS: Towards a Better Classification in Raman Spectroscopy–Based Biological Applications. J. Chemom. 2020, 34, e3202. doi:https://doi.org/10.1002/cem.3202.
- Workman, J.; Mark, H. A Survey of Chemometric Methods Used in Spectroscopy. Spectroscopy 2020, 35, 9–14.
- Meza Ramirez, C. A.; Greenop, M.; Ashton, L.; Ur Rehman, I. Applications of Machine Learning in Spectroscopy. Appl. Spectrosc. Rev. 2020. doi:https://doi.org/10.1080/05704928.2020.1859525.
- Deckert-Gaudig, T.; Taguchi, A.; Kawata, S.; Deckert, V. Tip-Enhanced Raman Spectroscopy - From Early Developments to Recent Advances. Chem. Soc. Rev. 2017, 46, 4077–4110. doi:https://doi.org/10.1039/c7cs00209b
- Kurouski, D. Tip-Enhanced Raman Spectroscopy: An Emerging Technique for Probing Biology and Electrochemistry at the Nanoscale. Spectroscopy 2018, 33, 38–46.
- Mahapatra, S.; Li, L.; Schultz, J. F.; Jiang, N. Tip-Enhanced Raman Spectroscopy: Chemical Analysis with Nanoscale to Angstrom Scale Resolution. J. Chem. Phys. 2020, 153, 010902. doi:https://doi.org/10.1063/5.0009766
- De Angelis, F.; Gentile, F.; Mecarini, F.; Das, G.; Moretti, M.; Candeloro, P.; Coluccio, M. L.; Cojoc, G.; Accardo, A.; Liberale, C. Breaking the Diffusion Limit with Super-Hydrophobic Delivery of Molecules to Plasmonic Nanofocusing SERS Structures. Nat. Photon. 2011, 5, 2–7. https://doi.org/10.1038/NPHOTON.2011.222.
- Song, W.; Psaltis, D.; Crozier, K. B. Superhydrophobic Bull's-Eye for Surface-Enhanced Raman Scattering. Lab Chip. 2014, 14, 3907–3911. doi:https://doi.org/10.1039/c4lc00477a
- Martines, E.; Seunarine, K.; Morgan, H.; Gadegaard, N.; Wilkinson, C. D. W.; Riehle, M. O. Superhydrophobicity and Superhydrophilicity of Regular Nanopatterns. Nano Lett. 2005, 5, 2097–2103. doi:https://doi.org/10.1021/nl051435t
- Lovera, P.; Creedon, N.; Alatawi, H.; Mitchell, M.; Burke, M.; Quinn, A. J.; Riordan, A. O. Low-Cost Silver Capped Polystyrene Nanotube Arrays as Super-Hydrophobic Substrates for SERS Applications. Nanotechnology 2014, 25, 175502. doi:https://doi.org/10.1088/0957-4484/25/17/175502
- Hakonen, A.; Wang, F.; Andersson, P. O.; Wingfors, H.; Rindzevicius, T.; Schmidt, M. S.; Soma, V. R.; Xu, S.; Li, YQi.; Boisen, A.; Wu, HAn. Hand-Held Femtogram Detection of Hazardous Picric Acid with Hydrophobic Ag Nanopillar SERS Substrates and Mechanism of Elasto-Capillarity. ACS Sens. 2017, 2, 198–202. doi:https://doi.org/10.1021/acssensors.6b00749
- Li, J. F.; Huang, Y. F.; Ding, Y.; Yang, Z. L.; Li, S. B.; Zhou, X. S.; Fan, F. R.; Zhang, W.; Zhou, Z. Y.; Wu, D. Y.; et al. Shell-Isolated Nanoparticle-Enhanced Raman Spectroscopy. Nature 2010, 464, 392–395. doi:https://doi.org/10.1038/nature08907
- Valstar, M. H.; de Bakker, B. S.; Steenbakkers, R. J. H. M.; de Jong, K. H.; Smit, L. A.; Klein Nulent, T. J. W.; van Es, R. J. J.; Hofland, I.; de Keizer, B.; Jasperse, B.; et al. The Tubarial Salivary Glands: A Potential New Organ at Risk for Radiotherapy. Radiother. Oncol. 2021, 154, 292–298. doi:https://doi.org/10.1016/j.radonc.2020.09.034