
Abstract
Particulate matter (PM) is an important player in indoor air quality. Even though PM limit values are in force for more than a decade in Europe and reference methods are well in place for ambient air, measuring indoor PM concentration still remains a challenge and standardizing a measurement protocol is complex. As people stay most of their time indoors, indoor PM is of great interest in terms of public health, as concentration can be drastically different to the one outdoors. This review aims to provide key information to the indoor air monitoring communities, to better understand principal methods suitable for the analysis of indoor PM with their respective main influencing parameters. Advantages and drawbacks of each method are discussed and specific awareness is raised to avoid wrong data interpretation in specific situations. The inter-instrument deviation is also explained and, when possible, methods to correct are proposed.
1. Introduction
Although the methodology and limit values for the assessment and management of outdoor air quality are usually well defined by binding European and national regulations, indoor air quality (IAQ) is subject to regulation in only a few countries (Finland, Lithuania, Portugal, Slovenia). Due to the lack of regulatory provisions, IAQ monitoring is not bound to the use of reference methods nor subject to a rigid system of evaluation and validation of the data collected. However, the importance of IAQ in the prevention of adverse health outcomes is undisputed,[Citation1] given also that people (and especially susceptible persons) spend most of their time in dwellings, means of transport and non-industrial work environments. Moreover, the concentration and chemical composition of indoor air pollution, including PM, can be very different from outdoors.[Citation2] The indoor concentration of gas contaminants and particles is often much higher compared to outdoors due to a variety of emission sources which include human activities.[Citation3] Airborne particles can indeed be either transported into indoor environments from outdoors by infiltration or directly result from indoor sources. In this regard, it has been argued that the toxicity of indoor PM can be higher than outdoors [Citation4] if high emitters is present.[Citation5] Some particle emission processes are nearly continuous (e.g., ambient air infiltration, heating systems) while others are intermittent (e.g., cooking, smoking, burning candles, printing). In this latter case, a relevant temporal variability of indoor PM levels can be assumed, which could be superimposed to the spatial variability typical of some specific indoor air pollutants.[Citation6] This issue is further complicated by the fact that indoor particles can interact with each other by agglomeration, derive from gas-phase chain reactions by condensation or nucleation, be converted to the gas-phase by evaporation, or deposit onto room surfaces. The particle concentration and chemical composition of indoor PM strongly depend also on parameters such as the room size, microclimatic variables, ventilation and air exchange rates, and sink effects on surfaces (e.g., walls, ceilings, floor coverings, furnishings).
All these aspects must be taken into consideration when designing environmental monitoring campaigns and for choosing the most suitable measuring instruments. The study motivations and final objectives are also a key factor. For example, when the routine evaluation of IAQ by comparison with guidance values is the main purpose, the monitoring strategy and the instrumental approaches must be able to best represent the variability factors typically found on a time scale defined by the reference time of the limit values themselves.
Unlike for gaseous pollutants, in the case of aerosols an additional element of variability and health hazard should be considered- the size distribution of particle concentrations and their chemical composition, which in return, are dependent on the source type and strength, the dynamics processes mentioned above and the type of indoor environment investigated.
2. Factors influencing indoor PM concentrations and monitoring
The following parameters should be considered when planning PM sampling campaigns, and selecting sampling strategies, monitoring procedures and instruments.
2.1. Reasons behind and objectives for an IAQ monitoring campaign
The motivations and goals of an IAQ monitoring campaign can be considered as the first decisions that determine the sampling strategies, monitoring procedures and instrumental techniques to be used.[Citation7]
Possible reasons behind an indoor air monitoring campaign can be very broad and can imply a gradient of complexity. For example, a routine IAQ assessment through compliance testing with respect to guidance or legally binding limit values for PM2.5 or for some specific particle-bound pollutants must be performed following well-standardized methods and procedures [Citation8,Citation9] and rely on the mass metric and the reference period against which reference values are defined. The degree of complexity increases when specific particulate-bound pollutants are determined using innovative analytical techniques.[Citation10] When there is the need to investigate the reasons behind complaints or reported problems about IAQ perception by office workers or building occupants or suspected building related syndromes, the sampling strategy and monitoring methodology can be based on the type of toxicity (e.g., acute, subacute, chronic) of hazardous substances and on the time resolution of methods used (e.g., time-activity diaries vs. checklists) to collect simultaneous information on the possible factors affecting IAQ for risk management purposes.[Citation11]
Monitoring some specific indoor PM constituents can be also useful when providing data to build, assess or validate indoor air pollution models.[Citation12] In such a case, the selected instrumental methods should maintain a good accuracy and the collection of data with high temporal and spatial resolution, to follow the kinetics of possible reactions and match the resolution of model estimates. Furthermore, if changes of state (i.e., condensation, nucleation) or oxidation occur, then collocated measurements of the gaseous and particulate pollutants (levels, chemical profiles, sizes) should be carried out.
One of the main reasons for monitoring IAQ is often to identify and understand the behavior and sources of indoor pollutants as well as distinguishing them from those originating outdoors. Source apportionment is the practice of deriving information about the sources and their contributions to air pollution including techniques based on the measured concentrations of pollutants and their components (receptor-oriented models) or on chemistry, transport and dispersion (source-oriented models). Particulate matter source apportionment studies use either the chemical composition [Citation13] of the particles or particle number concentration and size distribution.[Citation14] Other possible reasons for monitoring indoor PM are reported elsewhere.[Citation7]
2.2. Indoor-outdoor PM relationship
Outdoor ambient atmospheric aerosols can strongly affect IAQ because outdoor and indoor environments are not independent systems and most indoor PM in countries with a high sociodemographic index and nonsmoking dwellings is of outdoor origin, which implies that knowing the relationship between indoor and outdoor PM is usually very important. Furthermore, outdoor oxidants when infiltrated in indoor environments might trigger processes of new particle formation and condensation events that dramatically increase levels of ultrafine particles (UFPs) and secondary organic aerosols.[Citation15] Indoor infiltration of PM from outdoor can occur via natural or mechanical ventilation, as well as infiltration through cracks in the building envelope.
Severe atmospheric particle and anthropogenic dust pollution has attracted public concern due to the frequent occurrence of haze events in some countries during the last decade. The concentration of indoor airborne particles is increasing in parallel with the deterioration of outdoor air quality. Although reducing building infiltration rates through efficient insulation or by closing doors and windows can reduce the concentration of indoor particles of outdoor origin, the IAQ may still worsen due to the additional emission of indoor-generated airborne particles, for example, particles generated by solid fuel combustion, cooking and smoking.[Citation16]
As a general rule, a clear positive relationship between indoor and outdoor PM can be assumed under high ventilation conditions, but not when the ventilation rate is low. Typically, Indoor/Outdoor (I/O) ratios (the ratio of the concentration of a pollutant indoor and outdoor) for PM vary from 0.7 to 1.5 and can also be much higher than 1 when there are important sources of primary or secondary aerosols in the indoor environment. This can typically occur when smoking indoors or during other emitting activities (e.g., cooking, vacuuming or using open fireplaces, sprays or incense sticks and burning candles).[Citation16]
2.3. Indoor sources of PM
Major indoor PM sources are cooking (especially frying and grilling), combustion and heating activities (e.g., smoking, candle and incense burning, fuel combustion, fireplace burning, natural gas stoves and ovens) as well as several occupant activities such as cleaning and consumer products use (use of sprays), emission from electronic equipment (e.g., printers) and resuspension (e.g., walking, children’s crawling on the carpet, sweeping).[Citation17] Source profiles (chemical composition and size distribution) of indoor PM can vary significantly depending on climate, indoor location and specific source types and can be modulated by many different factors. For example, emissions from cooking are highly dependent on parameters including levels and type of outdoor pollution and concentration of oxidants, culinary techniques, types of food ingredients, composition of cooking oil, relative humidity, cooking temperature, or fuel type. However, particles can also result from reactions involving gas-phase precursors emitted both indoors and outdoors, i.e., secondary PM formation processes. For instance, secondary particles can be formed indoors from O3-initiated reactions (enhanced by photo-oxidation), arising from outdoor infiltration or from indoor ozonizers, with chemicals emitted from consumer products, building materials, and cleaning products.[Citation18,Citation19]
2.4. Indoor particle dynamics
Indoor particle concentrations and particle size distributions can be subject to high spatial and temporal variability. There are various dynamic processes which can affect measurement results:
Type and number of possible emission sources, their spatial arrangement and time-dependent emission patterns
Contribution of the particles penetrating from the outside and associated influencing factors, such as environmental conditions (outdoor air quality, meteorology) and building conditions (ventilation rates, ventilation systems with and without filtering, construction, building tightness, location of the object, floor)
the occurrence of new particle formation from gaseous precursors and other aerosol processes (condensation and growth, coagulation, shrinkage, re-condensation)
Particle transport and deposition mechanisms (aerosol dilution, sedimentation, resuspension, thermophoresis and diffusion)
Amount of laminar or turbulent air movement and air mixing in the room;
Temperature and humidity;
Conversion by chemical (oxidation) and physical processes (coagulation, evaporation, re-condensation, gas-particle partitioning).
Among other factors, these processes drive the concentration, size distribution and chemical composition of particles.[Citation20] Once in the atmosphere, UFPs behave more like gas molecules and are primarily affected by diffusion processes, while coarser particles are more prone to sedimentation and resuspension phenomena. Particle deposition is an important factor as it significantly influences the pollutant concentration of indoor air and, thus, personal exposure. Deposition is positive from the perspective of human health, as deposited particles cannot be inhaled so only dermal exposure can occur. There is a considerable amount of literature about particle deposition on indoor surfaces. The relationship between particle size and area-averaged deposition velocities or particle rate loss coefficients is typically U- or V-shaped with a minimum at about 0.2 − 0.3 µm in particle size.[Citation21] To determine the deposition velocity onto a surface, the corresponding mass flux and the particle concentration outside the boundary layer must be measured simultaneously. The most relevant challenge lies in how to generate monodisperse tracer-labelled particles and measure accurately the very small amount of mass deposited on the surface. Mismatch of tracer particle and actual particle surface energies can also be a problem.
Settled dust resuspension is caused by particles detaching from surfaces. PM is subjected to various removal forces, such as aerodynamic lift and drag, surface vibration forces and electrostatic forces; they then become airborne. Human-induced particle resuspension is associated with various activity patterns (e.g., sweeping) and different types of movements as walking or crawling across horizontal surfaces, such as floors and carpets. Resuspension rates increase directly with particle size, which is particularly relevant for PM1-10 and even more so for the PM5-10 size fractions.[Citation16,Citation22,Citation23] Resuspension of UFPs can be considered to be close to zero, indeed electrostatic bindings are so strong that UFPs are nearly definitely bound when settled onto a surface.
All these aspects should be considered when planning the measurement strategy and also when evaluating the measurements, e.g., by recording and analyzing the time response of an aerosol or different aerosol size fractions over a longer period. In general, it should be considered that aerosol size fractions may also occur in concentrations outside the measuring range of the monitoring instruments.
3. Pm size and fractions: monitoring methods and strategies
Size is probably the most fundamental parameter directly describing and characterizing aerosol particles, but the classification of indoor airborne particles according to their size range will also provide indirect information on their sources, generation and interaction mechanisms, and aerodynamic behavior, penetration and deposition in the respiratory system. The health effects after aerosol intake can also strongly depend on the deposition in the various regions of the respiratory tract, but also with the fact that a relevant fraction of inhaled UFP translocate the lung and reaches the circulatory system, and with then several organs of the body. In this regard, the International Commission of Radiological Protection (ICRP) in 1994 developed a comprehensive lung deposition model for radioactive aerosols.[Citation24] Several parameters are required to construct the model including breathing rate, lung volume, activity, nose/mouth breathing, etc. The obtained deposition curves can be found elsewhere [Citation25] and are summarized in . The extra-thoracic deposition curve represents the relative number of particles that deposits in the nasal and oral passages, pharynx and larynx; the tracheobronchial deposition curve represents the fraction of aerosol that deposits beyond the larynx (i.e., in the trachea, the bronchi, and the bronchioles), while the alveolar deposition curve represents the fraction of the aerosol that deposits in the deepest region of lungs, where oxygen exchange with blood occurs. Conventionally, the upper size limit for particle inhalation is about 100 µm, while the lower size limit is likewise arbitrary and can be taken to be a few nanometers.
Figure 1. Illustration of particle size-dependent deposition of airborne particle in the human respiratory tract – taken from exposure assessment considerations for nanoparticles in the workplace.[Citation25]
![Figure 1. Illustration of particle size-dependent deposition of airborne particle in the human respiratory tract – taken from exposure assessment considerations for nanoparticles in the workplace.[Citation25]](/cms/asset/ba4ea43c-d67e-4813-b84e-22789fce42d1/laps_a_2088554_f0004_b.jpg)
Furthermore, the main health effect associated to PM is the aggravation/cause of cardiovascular disorders.[Citation26] This hypothesis arises from inflammatory reactions in the lungs with a resultant systemic release of cytokines, which may influence cardiovascular endpoints.[Citation27] Pulmonary inflammation has been associated with systemic hypercoagulability, generation of oxidants, activation of complement, increase in blood viscosity, and elevation of the plasma concentrations of fibrinogen and C-reactive protein.[Citation28] It has also been hypothesized that a fraction of UFPs (finer than 100 nm) translocate from the lungs into the circulation and thus influence cardiovascular endpoints more directly, also reaching organs of the body through the circulatory system.[Citation29]
The appropriate particle size definition depends primarily on the type of measurement and class of particles: for example, the aerodynamic diameter (Dae, defined as the diameter of a spherical particle of unit density having the same terminal settling velocity as that of the particle in question) is useful for particles larger than about 0.5 µm (i.e., those particles having appreciable inertia).[Citation30] Particles smaller than about 0.5 µm can be better characterized by their diffusive diameter (i.e., the diameter of a spherical particle of unit density having the same diffusion coefficient, thus the same migration velocity in an electric field, as the particle in question). Another classification criterion, used for light-scattering devices, is the optical equivalent diameter (i.e., the diameter of a particle having the same response in an instrument that detects particles by their interaction with light).
These various equivalent diameters are thus defined as the diameter of a sphere, which, for a given instrument, would yield the same size measurement as the particle under consideration. Most of the time, the different types of diameter are considered equally without taking particular care, even though each type of diameter can be totally different. Depending on the shape, color, refractive index and density of the particle, the same particle can indeed be measured in various ways and neglecting these parameters can lead to incorrect data interpretation.
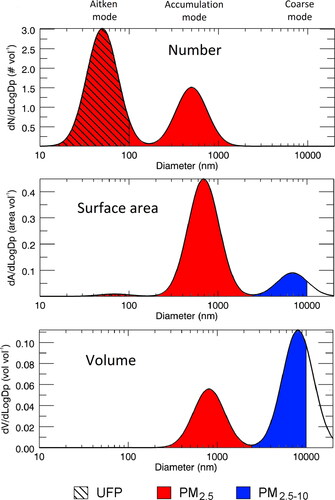
Furthermore, the particles in real aerosols are not uniform in size and follow multimodal distributions. The typical description of the size distribution of ambient aerosols is a trimodal distribution consisting of a nuclei mode in the size range 0.005 to 0.1 µm, an accumulation mode from 0.1 to 2 µm, and a coarse mode greater than 2.5 µm. In the air quality field, focusing on PM mass concentration, the size discrimination leading to PM2.5, PM10 and PM2.5-10 (coarse fraction) definitions rely on the fact that fine and coarse particles have distinct sources and physicochemical characteristics. Since the 1990s, scientific interest was extended to include indoor UFPs. PM size fractions are collected and hence can be also defined as those portions of airborne particles that pass through a size-selective inlet with a 50% efficiency cutoff at the desired aerodynamic diameter. Thus, PM10 is the fraction of particles which pass through a size-selective inlet with a 50% efficiency cutoff at 10 μm aerodynamic diameter, PM2.5 at 2.5 µm, PM1 at 1 µm and so on. Due to the importance of particle size in determining penetration and deposition in the respiratory system and the possible health effects, it is crucial to measure PM in a consistent manner. For this reason, regulatory and standardization bodies have defined effectiveness curves and agreed on standardized samplers for size-fractionated PM. The International Organization for Standardization (ISO) has also released recommendations on sampling conventions based on particle deposition in specific regions of the respiratory tract.[Citation31] The “Total Suspended Particles” (TSP) fraction is an old regulatory measure of the total mass concentration of PM. Nowadays, TSP is no longer used, except for some applications for exposure assessment in industrial environments. Today, PM2.5 is the most important PM fraction to represent health risks, corresponding to the “high-risk respirable convention” as defined in ISO 7708:1995 [Citation32] and has great importance for indoor air quality studies because it includes the near totality of combustion-generated particles and secondary PM deriving from chemical reactions either outdoors or indoors. It is not by accident that most of the recent studies focus on fine PM and UFPs, due to the relevance of these potentially highly-penetrating particles into the human respiratory system. PM2.5 is ISO 16000-37 is the international reference standard for indoor measurements.[Citation9]
The sampling and assessment of PM1 concentrations in indoor environments has recently become a prerogative of some research studies but is not considered in routine IAQ monitoring, due also to the lack of standardization and expense of PM1 monitoring devices.
The term UFP typically refers to <100 nm number concentrations. Mass is not used as a metric anymore because these particles are so small and thus so light that weighing them requires a long and expensive collection time and is a complex process, while an accurate count of these particles in the volume of air is much more viable and straightforward (). Coarse particles, while dominant when focusing on mass, represent a very small fraction of the total particle number. As this number fraction usually remains below the measurement uncertainty, the coarse particle number fraction, even if counted by the instrument, can be neglected. UFPs can thus be referred to the total particle number concentrations, while other studies used the term quasi-UFPs.[Citation33,Citation34] The real-time measurement of UFP number concentrations is crucial for indoor environments characterized by intermittent combustion sources. ISO 16000-42 which deals with this subject is currently under development.[Citation35] Since there are many indoor activities that can drastically increase particle number concentration (PNC) with little effect on fine PM, it is highly advisable to monitor both PM2.5 and UFP PNC in such indoor environments.
Figure 2. Typical size distributions of atmospheric PM expressed as number, surface area and volume (mass) concentrations - Modified from Wikipedia (CC BY-NC 3.0).
The aerosol fractions (i.e., inhalable, thoracic, respirable) used for risk assessment in industrial environments [Citation32,Citation36] according to occupational hygiene standards and practices [Citation37] should not be used for risk assessment in indoor environments, including spaces occupied by workers (e.g., offices, schools, cinemas/theatres, banks, hospitals, means of transport).
3.1. Main PM measurement methods
Determination of PM concentrations and their size-distribution are not straightforward and as already explained above, strongly depends on the methodologies used to evaluate them. There are now many different devices for monitoring particles in indoor environments and their selection depends on several factors such as purpose of monitoring, costs, dimensions, user-friendliness and noise. ISO 16000-34 [Citation38] gives a detailed description of the strategies for the measurement of indoor airborne particles; a large range of instruments are also presented, listing their advantages and disadvantages.
3.1.1. Particle mass concentrations using gravimetric methods
Historically, the assessment and management of both indoor and outdoor air pollution are based on the mass metric determination of PM, through the comparison of concentration levels with national or international guidelines or binding limit values. Actually, it is worth noting that the reference parameter used to investigate particle toxicity and to derive air quality standards to protect people from adverse health effects is the particle mass, instead of other PM metrics (e.g., particle number or particle surface area),[Citation39,Citation40] although in the recent years different epidemiological evidences suggest that other aspects of atmospheric PM, beside mass, correlate with a wide range of health outcomes.[Citation41] The current limit values for PM and its chemical constituents (apart from asbestos fibers) in the outdoor air [Citation42] or occupational environments are currently expressed in terms of mass per cubic meter of air. The same holds for indoor air quality guidelines [Citation43] and therefore determination of PM mass concentration levels indoors is the crucial measurement for routine and dedicated indoor air quality surveys.
Gravimetric analysis is a regulatory well-standardized procedure, exhaustively described in terms of methods and sampling strategies in the reference technical standards EN 12341 and ISO 16000-37, which focus on the PM2.5 mass measurement in ambient and indoor air, respectively.[Citation9,Citation44] The gravimetric method is essentially based on a time-integrated approach, which means that within the selected sampling-time interval (e.g., the reference time on which guideline or binding limit values are defined, generally 24 hours), information cannot be obtained about temporal trends and variability, peak levels or short-term emissions in the determined mass concentrations. Nevertheless, this is the most accurate and reliable method, giving results of good data quality and at relative low costs if all key factors that can affect the measurement (e.g., design and construction of the size-selective inlet; sampling flow rate accuracy; particle deposition losses between the inlet and the filter) are controlled and their effects are minimized.[Citation45]
The design of an active sampling system for PM collection through filter-based techniques has been schematized elsewhere.[Citation7] In brief, as well known, gravimetric determination of PM requires the passage of a volume of air at a constant and known flow rate and duration through a size-selective inlet, specifically designed for the selection of particles according to their aerodynamic diameter, using a sampling pump. The selected PM fraction is then collected on a preconditioned filter media, which is weighed in specific constant conditions before and after sampling, to obtain the average airborne particulate mass and the corresponding concentration level, for the reference sampling period.
Technical Standards (TS) [Citation38,Citation44] recommend a variety of size-selective inlets based on different types of fractionation mechanisms (viz. conventional impaction, virtual impaction and cyclonic separation) that can be employed for indoor gravimetric measurements of PM2.5 or PM10, referring to the generic term Aerosol Mass Monitor (AMM) to indicate any system that allows the collection of aerosol particulates on a filter substrate suitable for subsequent gravimetric analysis.[Citation38] In general, when the air enters the sampling inlet, 50% of particles having an aerodynamic diameter greater than a specific cutoff size (e.g., particles > 2.5 or 10 µm) should be removed, even though a certain amount of those particles are still sampled on the filter substrate because the actual inlet collection efficiency is generally described as a sigmoidal function.[Citation46] In addition to indicating the characteristics and performance of the sampler, TS documents recommend the use of low-volume samplers (LVSs) with PM2.5 or PM10 heads operating at a nominal flow rate of 2.3 m3 h−1. This flowrate, combined with long sampling time, collects a mass which is sufficient to reach an acceptable measurement uncertainty.
Nevertheless, alternative techniques which imply the use of very low-flow rates devices or small cyclones and impactors should always be considered for the collection of indoor PM. Indeed, although not recommended in reference documents, because the measurement uncertainty will increase due to the low mass collected, these methods can be the best choice if the pump must be of a reasonable size and weight and produce a low noise level or if the overall instrumentation must as small as possible. Moreover, due to their small size and weight, some of these samplers can be employed for personal monitoring, which can be very useful for exposure and risk assessment purposes. In this regard, the standard ISO 16000-34 [Citation38] mentions an instrumental category that includes a series of portable samplers (typically working below 10 L min−1) usually worn by people during indoor activities to monitor their personal exposure, even though no guidelines are clearly specified for these sampling devices.
In the scientific literature, a variety of alternative very low-flow rate devices or miniaturized cyclones and impactors have been normally used for the monitoring of indoor airborne particulates.[Citation47,Citation48] In a number of national and international studies focused on IAQ [Citation49–52] a single-stage impactor operating at a constant flow rate of 0.6 m3/h (10 L min−1) with a quasi-noiseless sampling pump was selected as a gold standard because of its reliable performance and its documented agreement with PM2.5 Federal Reference Methods (FRMs).[Citation53–55] Likewise, if PM size-fractionation is required, a miniaturized multistage cascade impactor [Citation56] that can be easily worn by people for personal exposure assessment, could be an effective choice, as recommended by the EPA Method IP-10A.[Citation57]
Alternatively, the same EPA Method IP-10A suggests the use of a referenced Personal Environmental Monitor (PEM), which is a lightweight single-stage impactor equipped with a low-volume pump and specifically developed to provide an effective collection of PM2.5 or PM10 in the indoor air.[Citation49,Citation50] it is worth mentioning that measurement uncertainty may increase significantly with this type of systems as the collected mass is often so low that micro-analytical balances with readability down to 1 µg should be used and all the possible weighing interferences should be carefully controlled.
The selected filter media used for PM collection must take into account different factors, such as type of sampling strategy, total costs, availability and gravimetric determination, plus the requirements of the analytical techniques, if a PM chemical characterization is foreseen.[Citation58] There are different types of commercially available substrates,[Citation59] all of which should guarantee a high collection efficiency (>99%),[Citation60] that anyway varies according to the filter type and manufacturer and also depends on airflow, pore size and sampling duration, as reported in detail elsewhere.[Citation60]
Each type of filter has its own advantages and drawbacks (see ), which have been exhaustively presented in a published review by Watson and coworkers.[Citation59] In general, the choice of the most appropriate filter type is a key point for the gravimetric determination of PM. Indeed, although the gravimetric procedure is essentially a simple process, it can give inaccurate and unreliable concentration data because there are different environmental and procedural variables that could influence the filter weights and for this reason, they have to be avoided, minimized or standardized, adopting suitable precautions. These factors include:
Table 1. Comparison of filter types.
absorption of gases (such as NH3, HNO3, SO2) onto the filter surface;
retention of water, as in the case of mixed cellulose ester (MCE) filters due to their higher hygroscopicity and net mass than polyvinyl chloride (PVC) membrane filters or polycarbonate capillary pore filters;
electrostatic charges, as for PVC filters that can be typically affected by a positive weighing error caused by the build-up of electrostatic charges on filter substrates;
evaporation of semi-volatile pollutants (e.g. ammonium nitrate), that can be avoided by ensuring suitable cooling after sampling;
contamination or sample losses during transportation and filter handling, including the mechanical removal of particles (and/or filter material) during sampling preparation activities.[Citation59]
Moreover, the filter composition should be compatible with the chemical determinations to be performed. By way of example, some filters (e.g., cellulose nitrate filters) are very difficult to be weighed, but they have low background values for metal elements and are easy to digest, thus representing good substrates for this type of analysis, whereas glass fiber filters contain elemental impurities that do not allow the quantification of many major and trace elements,[Citation59,Citation61] but are mechanically strong and less hygroscopic.
For gravimetric analysis of PM, specific controlled environmental conditions (i.e., clean air, constant temperature (T) and relative humidity (RH)) are required, and the filter media must be stabilized at these environmental parameters (T = 20 ± 1 °C; RH = 50 ± 5%) in a climatic chamber for a specific time (usually ≥ 48 h, but this can depend on filter type) before being weighted.[Citation44] Indeed, different conditioning parameters may result in different weighing values depending on temperature and especially relative humidity condition, which can cause a retention of liquid water with a consequent bias in the PM mass determination.[Citation62–64] Pressure variation correction should also be applied if the filter is weighed with its filter holder.
Weighing microbalance resolution and repeatability generally depend on the expected PM mass on filter media, as well as on the filter mass itself. A balance with a resolution of 10 µg is typically required for LVS working at 2.3 m3/h,[Citation44] while a lower resolution (usually of 1 µg) is recommended for VLVS (< 10 L min−1). The balances must be regularly calibrated with well-established standard weights and antistatic devices (e.g., high voltage ionizers or other static neutralizers) should be kept in the balance weighing chamber to neutralize electrostatic charges. Moreover, regular quality control (QC) and quality assurance (QA) procedures must be carried out to check that the weighing parameters always comply with the required standard conditions and obtained results can be considered reliable. Examples of QC/QA procedures include: i) periodic balance zero control; ii) replicated filter weights; iii) laboratory filter blanks weights; iv) balance maintenance; v) internal system and performance audits; vi) quality system audit; vii) performance evaluation and laboratory inter-comparison.
The quality of the weighing procedure can also be assessed using the ASTM D 6552 method.[Citation65] In this method, recommendations are provided for the reporting of weights relative to LOD and LOQ. These latter parameters are computed as a result of the method evaluation. Mass LOD and weighing imprecision for every filter size and type should then be determined.
All the aforementioned procedures are described exhaustively in the referenced Technical Standards. A comprehensive presentation about these topics can be also found elsewhere.[Citation59]
3.1.2. Fine particle number and mass determination
Filter-based techniques are the gold standard for airborne PM measurements,[Citation45] but on the other hand, gravimetric systems are characterized by different limitations. These limitations refer for example to (i) the considerable amount of time spent for the sampling of a sufficient PM mass to be analyzed via gravimetric techniques;[Citation66] (ii) the loss of potentially health-related volatile compounds caused by the filter conditioning process;[Citation67] (iii) the necessity of specific instrumentation (e.g., a climate-controlled weighing room and a high-resolution micro-balance). Gravimetric determination is also (iv) time consuming and (v) does not allow automatic remote control of particle concentrations. Finally, (vi) it provides only time-integrated concentration values, which implies the limitation of not identifying significant and short-term emissions in IAQ studies.
Alternative methods based on particle light scattering and a variety of optical counters and spectrometers have been developed and are commercially available. Photometers can be classified into two categories based on the measurement principle. Nephelometers scatter the light from an ensemble of particles and the photodetector provides a single output that is therefore converted to particle mass concentration. Optical particle counters (OPCs) count and measure the optical diameter of individual particles, then convert diameters into mass concentration by applying a transformation algorithm to each counted particle. Generally, the LOD of these instruments is equal to 1 µg m−3 or less. The lower detection limit diameter for photometers varies from 0.12 to 0.4 µm, with the majority between 0.3 and 0.35 µm as diameter for 50% detection. Maximum particle diameter can be from 3 to 40 µm, depending on the device.
These photometers enable (i) time resolution down to one second, making it possible to determine real-time particulate levels and monitor transient concentrations. Plus, they are (ii) easy to use, (iii) require low maintenance, (iv) can be operated remotely and (v) easily provide much more data; some of these instruments are also (vi) low cost. For these advantages, this type of particle monitor is widely used for indoor air campaigns, also helping to characterize intermittent activities and emission sources that may contribute significantly to indoor air pollution.[Citation68]
However, some studies show that light-scattering based instruments are not entirely reliable when compared with reference methods, under- and overestimating the indoor PM concentration.[Citation68–70] Moreover, the exact relationship between different analytical methods (i.e., filter-based and real-time) strongly depends on the type of particles and the environment.[Citation45] This is particularly true for indoor environments, characterized by high variability in activities and emission sources. The reasons for this bias error depend on the type of photometer. Nephelometric photometers collect the scattered light over an ensemble of particles so cannot directly determine the particle size distribution, although they approximate the total illuminated particle surface area. OPCs measure the optical diameter directly for each particle, so can correctly determine the particle number vs optical diameter. Both technologies have the inherent error of translating particle number to particle mass, which assumes a particle density and refractive index (RI). Nephelometers must assume a global density and RI, while OPCs can set size-specific density and RI, if known. An additional error is related to the fact that the measurements and aerosol classifications are based on optical diameters while the reference methods are generally based on other metrics (e.g., aerodynamic diameter, density/mass, electrical mobility). Other problems are the inability to measure particles below the diameter LDL and particle growth in high humidity.
To improve the accuracy of these instruments, PM mass concentration data acquired via real-time monitors are calibrated in the field, co-locating both real-time monitors and gravimetric systems, obtaining a correction factor to be applied a posteriori to adjust real-time data.[Citation71–73] As these correction procedures for real-time monitors are always linked to the particle characteristics (e.g., density, shape, refractive index); results obtained indoors could be very different if the particle composition varies due to the presence of specific sources.
As reported, these instruments (described in the ISO 16000-34 standard [Citation38]) remain useful when source identification is required or to provide information on the temporality of the PM concentration: ISO 16000-37 [Citation9] allows the use of these monitors only as supplementary methods. Thus, the reference method remains compulsory to achieve reliable indoor PM concentrations, but also to correct real-time data.
3.1.3. Ultra-fine particle number determination
UFPs are of specific health relevance due to their very small sizes that allow them to reach the alveolar area when inhaled and thus to possibly interact with blood. Mass measurement methods are not sufficiently sensitive for UFP.[Citation74] As stated above, the most relevant measurements in this particle range (<100 nm diameter) are the number concentration or the surface area.
Condensation particle counters (CPCs) are one of the most frequently used instruments to count UFPs. A CPC counts all airborne particles present in an air sample and thus provides a measure of the total particle number. Nevertheless, as coarse particles usually represent only a very small fraction in number of the total counting, CPC results can be used as a good proxy of the ultrafine fraction. Since UFPs are too small to be detected by optical techniques (detection often limited to 0.3 µm in particle diameter for most optical instruments), condensation techniques are used to grow small aerosol particles to sizes that can be detected using classical optical particle counters. The aerosol concentration measured by means of CPC is expressed as number concentration, conventionally expressed as particles per cm−3.
Through various means, CPCs create a region of vapor supersaturation to activate the condensational growth of these particles to a size large enough to be detected. Alcohols (generally butanol or 2-propanol) are often used as working fluid due to low dew points which facilitate the creation of a high supersaturation environment at low temperature. The latest versions of CPC models have two counting modes: one based on light-scattering techniques, in which the detection system uses a photodetector, measuring the signals from individual particles and thus counting each particle; a second mode based on a light-extinction photometer device, measures the intensity of the light scattered by all the particles present in the measurement chamber, thus giving an indication of the total number of particles present. The second mode is less sensitive and is used only when the particle number concentration is too high to allow individual particle detection. At intermediate concentrations two particles can pass the detector at the same time, creating coincidence and thus an under-estimation of the real concentration. Modern CPCs are thus equipped with a coincidence correction algorithm which is capable to approximately correct the problem to a certain limit.
The performance of a CPC must be calibrated. The concentration of a positively charged, monodisperse aerosol is simultaneously determined with an electrometer and a CPC. The counting efficiency of the CPC is thus determined as a function of particle size. This calibration method is the only way to ensure a traceable CPC instrument. Nevertheless this procedure is complex and costly as various particle sizes should be tested. This procedure is thus generally only used for the gold standard instrument of the manufacturer and mass production calibration is often only calibrated by comparing the released device to the gold instrument.
The diffusion losses in a CPC system increase with decreasing particle size, leading to an important decrease in counting efficiency for particles < 10 nm. The minimum detectable diameter is also influenced by the particle solubility in condensing vapor and the charge state of the particle surface.[Citation75] Many CPCs can detect particles down to 5-10 nm. CPCs optimized for the small size range (UF-CPCs) use the same particle counting technique as conventional CPCs but are further optimized to enlarge very small particles more effectively and reduce losses, which allow detection down to 3 nm. To extend the detectable size range of an alcohol CPC even further, a Particle Size Magnifier (PSM) or Size Enhancer Stage (SES) is used upstream. By using diethylene glycol, a working fluid with low vapor pressure and high surface tension, even extremely small nuclei down to 1 nm can be enlarged and counted. Some information about CPC performance can be found in Kangasluoma et al.[Citation76]
Alcohol-based CPCs should be carefully managed to avoid altering the indoor air composition by the alcohol released during sampling.[Citation77] Using alcohol as the working fluid can indeed pose health and safety risks and odor problems indoors. For this reason, some water-based CPCs have been developed. With water CPCs, an additional conditioning section in which the aerosol is brought to 100% relative humidity at ambient temperature is added before entering the heating section to better define the state of the aerosol and improve the counting efficiency for different aerosol materials down to about 1 nm. Nevertheless, strongly hydrophobic particles might not be counted correctly and particular care should be applied to ensure correct results when using water CPCs.[Citation78]
ISO 16000-42 Indoor: “Air-Measurement of the particle number concentration by Condensation Particle Counters” is now under development and will be the future reference standard.[Citation35] As regards CPC data quality, CEN/TS 16976 [Citation79] describes the minimal requirements of a suitable CPC, including detection limits, precision and accuracy. CPC flow rate is the key source of uncertainty and must be checked using an externally calibrated flowmeter. For this reason, CPCs with internal flow splitting should be avoided. The measurement uncertainty is deeply influenced by the CPC particle size-dependent detection efficiency. The detection efficiency of a CPC follows a sigmoidal curve that goes from zero to 100% when the plateau is achieved. The particle diameter for which a 50% efficiency is obtained, is defined as D50 or the “lower detection limit” (LDL) of the CPC. LDL is an intrinsic characteristic of the CPC and is fixed by setting the saturator and condenser temperatures values. Most manufacturers provide efficiency at D50 and D90. However, these characteristic quantities are dependent on the type or chemistry of particles. Users should be aware that no comparison between CPC with different D50 is possible. A D50 of 7 nm has been used as reference in ambient air (CEN/TS 16976 [Citation79]) during nearly a decade, but has been switched to 10 nm during the last revision of this standard. Particular care should thus be taken when comparing measurement campaigns performed at different periods and thus potentially with instruments having various D50.
Good practice for CPCs includes a “zero check” (“leak check”) performed before each CPC measurement. This test consists of placing a HEPA filter at the inlet of the instrument and verifies that no particles are counted by the device. It is advisable to maintain a record of the meteorological conditions during the measurements and to check the impact on data. An outdoor environmental record is compulsory because variations can be very important because the results should always be reported per volume of air in standardized normal conditions. For indoor measurements it is not compulsory, but remains recommended. The manufacturer’s manual should be consulted to check whether the sample flow indicated by the CPC is quantitatively volumetrically defined or if recalculation is necessary sine the instrument indicates the result as standard flow.
Measurement uncertainties are affected not only by the counting instrument, but also by possible losses in the sampling and measurement system. Most of the time sampling lines are not required indoors, and measurements are made directly at the inlet of the instrument. Proper functioning of the CPC components must be verified by instrument indicators and status messages. In most cases these will be documented automatically along with the data in the log files, generated by the instrument’s software. The total particle number concentration measurement of a properly calibrated CPC is expected to have a relative total uncertainty of about ±5-10% in the size range of the counting efficiency plateau and operating in either single count or correction mode. For measurements in the photometric mode the measurement uncertainty is much higher.
Reasonably compact handheld UFP monitors are now available that use condensation nuclei counting approaches to provide total particle counting (i.e., particles cm−3). The performance of these portable units in comparison to bulkier condensation particle counters is reported to be reasonable, but not in perfect agreement. An important limitation of portable units is currently their inability to detect the smallest particle sizes, down to the LDL of 10-20 nm. Substantially undercounting is thus often observed when the monitor is placed very close to combustion sources, where the nucleation mode is dominant because particles have not yet grown or collapsed. Relatively short sampling periods allowed by the available alcohol reservoir size (often a simple mesh soaked in the working fluid) limits these monitors to be used more as screening tools rather than as affordable continuous measurement systems.
3.1.4. Ultra-fine particle size distribution determination
CPCs do not provide information related to the size of the aerosol as all particles are grown to approximately the same size, whatever the size of the initial nuclei. Knowing aerosol size is important to determine the potential toxicity of the aerosol as particle penetration is deeply linked to this parameter. Mobility Particle Size Spectrometers (MPSS), also called Differential Mobility Particle Sizer (DMPS) or Scanning Mobility Particle Sizer (SMPS) can be used to determine UFP size distribution. This system is composed of three components:
bipolar charger for charging the particles in a well-established way
Differential Electrical Mobility Classifier (DEMC), also called Differential Mobility Analyzer (DMA), which classifies particles by electrical mobility
Condensation Particle Counter (CPC) for detecting particles.
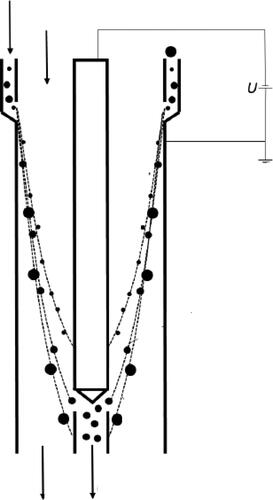
A DEMC classifies the aerosol particles by their mobility diameter and not by their aerodynamic diameter. The charged polydispersed aerosol particles go through the DEMC as laminar flow; by applying a voltage between the inner and outer electrodes, the charged aerosol particles move perpendicular to the air flow. A small fraction of the charged particles enters the thin circumferential slit near the bottom of the inner electrode, this is the classified fraction for a specific voltage setting, which is the only size fraction reaching the CPC and thus being counted. By changing the voltage another particle size will exit the DEMC. By stepwise increasing the voltage, for example from a few volts to 10 kV, a particle size range from 10 nm to 800 nm can be measured (). Since particles can carry more than one elementary charge, particles of different sizes can have the same electrical mobility. This is accounted for in the system controller by applying a data inversion process that applies size-dependent charging probabilities.
Figure 3. Working principle of a coaxial cylindrical DEMC.
Unlike optical particle counting, the number concentrations of the size classes are not recorded continuously, but discontinuously at intervals of typically 3 to 5 minutes due to the time needed to measure each separate size class. This should be taken into consideration when evaluating the results of particle counts with upstream particle size classification, especially where the particle size composition of the investigated aerosol varies rapidly compared with the time needed to measure the particle size range of interest.
DEMC limitations are in theory the same as the limitations of the CPC used for the detection, but as the CPC receives only one class size at any single time, concentration is often quite low and thus the CPCs no longer have a coincidence problem. Internal losses (sampling line, DMA, etc.) are on the other hand greatly increased, but since the particles size is known, loss correction algorithms need be applied to compensate for these losses. Typically, the DEMC automatically corrects for particle losses due to diffusion. Most MPSS instrument systems have a LDL close to 7-10 nm since the level of the smallest particles reaching the detector is too low to allow a reasonable estimation.
A radioactive source is often used in adjusting the system for a defined charge distribution. Non-radioactive neutralizers are also available but have worse long term stability and can bias the result. Transport of a radioactive source requires authorization and is not always allowed in some buildings (i.e., schools, airports). The use of MPSS thus requires a significant financial investment in equipment and can involve high maintenance costs. These instruments are also quite heavy and less transportable than a CPC. As a result, in practice MPSSs are often only used in research studies and not employed in routine IAQ analysis.
ISO 15900:2020 [Citation80] provides guidance for calibration of particle sizing and a methodology for quality control, while CEN/TS 17434:2019 [Citation81] defines performance criteria and its use for atmospheric monitoring. No specific standards for indoor air applications have been developed yet, but some general recommendations are included in ISO 16000-42.[Citation35] A relative total uncertainty of about ±10% can be achieved in the lab in the size range of the plateau counting efficiency of the CPC (for example for particles around 40-50 nm). Under real field conditions this uncertainty often reaches between 20-30% on average for the entire range, so particular care should be taken when interpreting the data.
Nanoparticles, which are manmade UFPs, usually have the property to be homogeneous in terms of size, shape and composition. CPCs and MPSSs can be used to monitor nanoparticles. Nevertheless, special care should be taken to avoid saturation of the CPC, even when measuring them with an MPSS, as all particles have nearly the same size and will thus pass the DMA at nearly the same time. In practice, a moving CPC is used in a way to ensure the absence of leaks in the manufacturing process. There is normally no reason to measure engineered nanoparticles except those released in production since it is not possible without microscopic techniques to distinguish them from others ultrafine particles and because their concentration will almost always remain much below the instrumental uncertainty.
3.1.4. Surface area determination
The respiratory system deposition region is primarily governed by particle size and shape. Also, the health response may be a function of different parameters (including mass, particle size, morphology, surface area, surface chemistry and chemical composition). Although ideally exposure should be expressed in terms of the most appropriate metric, the decision of appropriate aerosol measurement metric and methods may be driven also by practical issues. In practice, mass and number concentrations are easier to measure than parameters such as particle shape and surface area [Citation82] . However, there has been concern that the health impacts of inhaled particles - particularly those associated with UFPs and nano-sized particles - are not well-characterized by mass concentration measurements, but require exposure to be assessed in terms of alternative parameters.[Citation74,Citation83–85] In this regard, some toxicological evidence suggests that surface area might be a more health relevant dose metric than particle mass or particle number;[Citation86] this is because UFPs have substantially larger surface areas per unit mass compared to coarser particles and surface area may be a better determinant for particles’ surface reactivity.
Surface area (SA) concentration is defined as the particle surface area concentration per volume unit of air (µm2 cm−3), often expressed as lung-deposited surface area (LDSA), which is the particles’ surface area, weighted by the deposition probability in the lung. Particle SA concentration can be measured using Diffusion Chargers (DCs). A benchtop DC [Citation74] can estimate the human lung-deposited surface area of particles corresponding to tracheobronchial (TB) or alveolar (A) regions of the human lung, according to the ICRP deposition model.[Citation24] A first size selection via a cyclone with a 1 µm cut point allows measurements in the size range of 10 − 1000 nm. Then, particles charged with positive ions move into an ion trap that acts as a further size-selective sampler upstream of the electrometer by setting the voltage for B or A response.[Citation87] Personal monitors for real-time determination of LDSA of airborne particles are also available,[Citation88–90] still based on unipolar diffusion charging. The underlying assumption is the good correlation between LDSA and particle diameter in the size range from 10 to 300 nm and thus also with the charge acquired in diffusion charging. Some of these can also additionally produce estimates of the mean particle diameters and particle number concentrations. The performance of these personal monitors have been assessed in a comparative study,[Citation91] whose results indicated that LDSA concentrations are usually within ±30% of the reference level obtained using a MPSS in the particle size range is between 20–400 nm, when the instruments are properly calibrated. However, important errors can occur with particles > 400 nm. The few available studies concerning the evaluation of precision and accuracy of LDSA measurements [Citation91–97] indicate remarkable precision and accuracy issues in LDSA results given by different measurement devices; these differences in measurement performances are both method- and size-specific. Available studies also highlighted inadequate reliability of the data when measuring LDSA concentrations. As stated before, this may be because LDSA measurements depend mostly on the characteristics and size distribution of airborne particles, and a measurement bias could be introduced when instruments are factory calibrated using spherical equivalent diameters. Thus it could be difficult to measure and report accurate particle LDSA values when measuring real (heterogeneous) airborne particles. Moreover, the size particle range that can be detected with good precision seems to be tighter than that officially reported, and particle hygroscopicity may cause the lung deposition curves to change significantly as well.[Citation98] Thus, the above-mentioned poor precision and accuracy of the available instruments for the measurement of LDSA point out the need for further research on the topic.
4. Future perspectives
Recently, low-cost, easy-to-use air pollution monitoring technologies have emerged and are advancing quickly, and their use has been encouraged in IAQ monitoring.[Citation99–111] This has been driven by several technology advantages (lower costs, portability, easy deployment, less noise, better signal/noise, lower power consumption, improvements in edge and cloud computing capacity). Recent evidence showed that low-cost air quality devices showed adequate reliability, especially for qualitative air quality analysis in indoor sampling areas. Similarly, miniaturized sensors for the evaluation of indoor/outdoor air pollution could (i) provide a significant enhancement in exposure assessment studies, (ii) increase the spatial and temporal resolution of human exposure data, and (iii) improve citizen awareness and the data-sharing process.[Citation99] However, regular on-site calibration between the low-cost/miniaturized sensing technology and a reference instrument is highly recommended.[Citation112,Citation113] Standard procedures on the measurement of PM with sensors and on their evaluation for enhancing the quality of the data reported and their reliability is a future question that is already being tackled by CEN/TC264/WG42.[Citation114]
Implementing an intelligent model capable of calibrating the devices continuously using machine is also a new trend. In this regard, it should be noted that the use of this calibration method is not yet truly independent because reference instruments are still needed for validation and calibration purposes.
As already mentioned, technical and cost advances with low-cost particle sensors allowed their use in sensor networks, enhancing the possibility of wider application.[Citation115] Indeed, in recent years, AI-based data-mining methods have been employed in indoor air pollution studies in order to analyze the spatiotemporal variation of indoor PM.[Citation116] Recent examples of this kind of application have been reported in the scientific literature. Thus a PM concentration prediction model (via random forest), characterized by high prediction accuracy was developed by Yuchi and coworkers.[Citation117] Similarly, ANN (Artificial Neural Network) models and Kriging methods were used to predict the spatiotemporal variation of indoor PM,[Citation115] as well as a model based on dynamic neural networks, used to predict the time-serial concentration of PM2.5 in a subway station.[Citation118] Even if the measurement of PM concentration would be preferable, modeling can be useful to overcome the financial and logistic constraints of indoor and personal measurements campaigns, contributing to evaluating PM concentration where direct measurements are unavailable.[Citation117] Technology advances are also exploited in building health monitoring and assessment practices. In particular, the Internet of Things (IoT) provides an effective technological advancement, connecting different products installed in residential and commercial environments.[Citation119] Between these different built environment, sensors, embedded systems, actuators and networks can meet the requirements for real-time supervision solutions for healthy building environments, allowing the real-time monitoring of indoor environments.[Citation119]
Although good results can be obtained for PM2.5 measurement by using low cost sensors, there are currently no available sensors for the ultrafine range. Most PM sensors also cannot measure PM10 correctly as their miniature internal pumps are not strong enough to pull them into the measurement chamber. PM10 is even sometime derivate from PM2.5 value and should thus be used with care.
5. Conclusions
Measuring airborne particulate matter indoors is of key importance for personal health because people spend most of their time indoors and due to the harmful effect of particles. Nevertheless, nearly no regulations are yet in place as measuring indoor PM is still challenging. Indeed, due to the multitude of indoor emission sources (e.g., outdoor air infiltration, indoor combustion, printing, care or cleaning products, etc.) particle shape, color, density and composition can be drastically different. Indoor particle dynamics are also complex and subject to high spatial and temporal variability (including: modification of the ventilation rates, sedimentation/resuspension, thermophoresis and diffusion losses, oxidation, coagulation, secondary particle formation, etc.). The knowledge of the spatial variability of indoor PM, typically affecting much more ultrafine and coarse particles than fine aerosols,[Citation6] is also of key importance in the selection of the best sampling type (personal vs. static measurements) and position, in terms of both height from the floor and proximity to potential indoor sources.
Even if particle mass concentration, determined using gravimetric techniques, remains the standard measurement to determine indoor PM concentration, this method and metric is not always optimal. A major problem is that PM mass concentration is dominated by the coarse fraction which is not the most relevant in terms of health. Also referenced PM measurements are a time integrated result over long periods, missing real time information which is an asset for source identification and particulate peak information.
In practice real time alternative instruments are often used. Various instruments are currently available and all have advantages and disadvantages. These different instruments are based on various measurement principles and by definition do not measure the same particle characteristics. Although aerodynamic, equivalent, diffusive, and mobility diameter are often mixed without any particular care; these diameters can be absolutely different for the same particle depending of its shape, color or density. Measurement results are also directly linked to the capacity of the measurement system and this information is frequently not considered. For example comparisons between CPCs with different lower detection limits are not possible, but in practice measurements performed with different CPCs are done without further discussion. Environmental conditions (e.g., temperature, humidity, ventilation rate, etc.) are rarely reported whatever the drastic impact they can have on the final result. Real time instruments are often used indiscriminately for outdoor and indoor applications, despite these instruments have often been calibrated only for outdoor with generally Arizona Road Dust. When used indoor, where outdoor sources are not predominant (e.g., during specific activities like cooking, smoking, cleaning, printing), the internal calibration factor is no longer valid. All these issues may result in very high measurement uncertainty, which can only be limited when correcting for these aspects during the measurement campaign. Particular care should also be taken when comparing measurements performed in different locations or by different instruments. These limitations must also be considered for a correct data interpretation.
Another factor that adds complexity is the fact that for adequately interpreting adequately the origin, the emission/formation factors of PM, specially of UFP, it is required the co-location of UFP-particle size measurements, or the aerosol mass spectrometers with measurements of the speciation of gaseous organic pollutants and atmospheric oxidants, and all this with high time resolution.
More low cost sensors are coming to the market. Good results have been obtained for PM2.5, less for PM10 and no device for UFPs is available yet. Low cost sensors have important advantages in term of much better spatial and temporal resolution. Also, they can be easily carried by a subject for personal exposure assessment. PM sensors will also become ubiquitous IoT components in equipment including vacuums, air cleaners, and air conditioning system controllers. Nevertheless, the metrological quality of sensors is of course lower and they are often used by citizens who are not aware of measurement protocols and thus are sometime not used under the proper conditions. As a result the measurement uncertainty is much higher and results obtained should be interpreted with great care to avoid data misinterpretation.
The choice of the proper technique(s) and monitoring strategy for indoor PM monitoring should comply with the need of obtaining reliable and adequate results, with respect to the objective of the study, and with the commitment, on the part of the evaluator, to know and recognize the pros and cons of each available methodological option.
Acknowledgements
This publication is based upon work from COST Action CA17136 supported by COST (European Cooperation in Science and Technology) (www.cost.eu) for which the authors are grateful. The support and original concept designed by Nicola Carslaw (University of York) is hereby, acknowledged. One of the authors (Regina M. B. O. Duarte) also wishes to acknowledge FCT/MCTES for the financial support to CESAM (UIDP/50017/2020 + UIDB/50017/2020 + LA/P/0094/2020) through national funds.
Disclosure statement
No potential conflict of interest was reported by the authors.
Funding
This work is based upon work from COST Action INDAIRPOLLNET, supported by COST (European Cooperation in Science and Technology). Open access to this paper has been funded by ISSeP.
References
- Bennitt, F. B.; Wozniak, S. S.; Causey, K.; Burkart, K.; Brauer, M. Estimating Disease Burden Attributable to Household Air Pollution: New Methods within the Global Burden of Disease Study. Lancet Glob. Health. 2021, 9, S18. doi:10.1016/S2214-109X(21)00126-1
- Han, Y.; Li, X.; Zhu, T.; Lv, D.; Chen, Y.; Hou, L.; Zhang, Y.; Ren, M. Characteristics and Relationships between Indoor and Outdoor PM2.5 in Beijing: A Residential Apartment Case Study. Aerosol Air Qual. Res. 2016, 16, 2386–2395. doi:10.4209/aaqr.2015.12.0682
- Lakey, P. S. J.; Won, Y.; Shaw, D.; Østerstrøm, F. F.; Mattila, J.; Reidy, E.; Bottorff, B.; Rosales, C.; Wang, C.; Ampollini, L.; et al. Spatial and Temporal Scales of Variability for Indoor Air Constituents. Commun. Chem. 2021, 4, 1–7. doi:10.1038/s42004-021-00548-5
- Oeder, S.; Dietrich, S.; Weichenmeier, I.; Schober, W.; Pusch, G.; Jörres, R. A.; Schierl, R.; Nowak, D.; Fromme, H.; Behrendt, H.; Buters, J. T. M. Toxicity and Elemental Composition of Particulate Matter from Outdoor and Indoor Air of Elementary Schools in Munich, Germany. Indoor Air. 2012, 22, 148–158. doi:10.1111/j.1600-0668.2011.00743.x
- Park, M.; Joo, H. S.; Lee, K.; Jang, M.; Kim, S. D.; Kim, I.; Borlaza, L. J. S.; Lim, H.; Shin, H.; Chung, K. H.; et al. Differential Toxicities of Fine Particulate Matters from Various Sources. Sci. Rep. 2018, 8, 17007.
- Lakey, P. S. J.; Won, Y.; Shaw, D.; Østerstrøm, F. F.; Mattila, J.; Reidy, E.; Bottorff, B.; Rosales, C.; Wang, C.; Ampollini, L.; et al. Spatial and Temporal Scales of Variability for Indoor Air Constituents. Commun. Chem 2021, 4, 1–7.
- Spinazzè, A.; Borghi, F.; Rovelli, S.; Mihucz, V. G.; Bergmans, B.; Cattaneo, A.; Cavallo, D. M. Combined and Modular Approaches for Multicomponent Monitoring of Indoor Air Pollutants. Appl. Spectrosc. Rev. 2021, 0, 1–37. doi:10.1080/05704928.2021.1995405
- ISO - International Organization for Standardization. 2008 ISO 16000-12:2008 - Indoor air — Part 12: Sampling strategy for polychlorinated biphenyls (PCBs), polychlorinated dibenzo-p-dioxins (PCDDs), polychlorinated dibenzofurans (PCDFs) and polycyclic aromatic hydrocarbons (PAHs).
- ISO - International Organization for Standardization. 2019 ISO 16000-37:2019 - Indoor air — Part 37: Measurement of PM2,5 mass concentration.
- Duarte, R. M. B. O.; Gomes, J. F. P.; Querol, X.; Cattaneo, A.; Bergmans, B.; Saraga, D.; Maggos, T.; Di Gilio, A.; Rovelli, S.; Villanueva, F. Advanced Instrumental Approaches for Chemical Characterization of Indoor Particulate Matter. Appl. Spectrosc. Rev. 2021, 0, 1–41. doi:10.1080/05704928.2021.2018596
- Sakellaris, I.; Saraga, D.; Mandin, C.; de Kluizenaar, Y.; Fossati, S.; Spinazzè, A.; Cattaneo, A.; Mihucz, V.; Szigeti, T.; de Oliveira Fernandes, E.; et al. Association of Subjective Health Symptoms with Indoor Air Quality in European Office Buildings: The OFFICAIR Project. Indoor Air. 2021, 31, 426–439. Issue2 . doi:10.1111/ina.12749
- Kruza, M.; McFiggans, G.; Waring, M. S.; Wells, J. R.; Carslaw, N. Indoor Secondary Organic Aerosols: Towards an Improved Representation of Their Formation and Composition in Models. Atmos. Environ. 2020, 240, 117784. doi:10.1016/j.atmosenv.2020.117784
- Pagels, J.; Wierzbicka, A.; Nilsson, E.; Isaxon, C.; Dahl, A.; Gudmundsson, A.; Swietlicki, E.; Bohgard, M. Chemical Composition and Mass Emission Factors of Candle Smoke Particles. J. Aerosol. Sci. 2009, 40, 193–208., doi:10.1016/j.jaerosci.2008.10.005
- Beko, G.; Weschler, C. J.; Wierzbicka, A.; Karottki, D. G.; Toftum, J.; Loft, S.; Clausen, G. Ultrafine Particles: Exposure and Source Apportionment in 56 Danish Homes. dx. Environ. Sci. Technol. 2013, 47, 10240–−10248. doi:10.1021/es402429h
- Weschler, C. J. Ozone's Impact on Public Health: Contributions from Indoor Exposures to Ozone and Products of Ozone-Initiated Chemistry. Environ. Health Perspect. 2006, 114, 1489–1496. doi:10.1289/ehp.9256
- Urso, P.; Cattaneo, A.; Garramone, G.; Peruzzo, C.; Cavallo, D. M.; Carrer, P. Identification of Particulate Matter Determinants in Residential Homes. Build. Environ. 2015, 86, 61–69. doi:10.1016/j.buildenv.2014.12.019
- Li, Z.; Wen, Q.; Zhang, R. Sources, Health Effects and Control Strategies of Indoor Fine Particulate Matter (PM2.5): A Review. Sci. Total Environ. 2017, 586, 610–622. doi:10.1016/j.scitotenv.2017.02.029
- Sarwar, G.; Olson, D. A.; Corsi, R. L.; Weschler, C. J. Indoor Fine Particles: The Role of Terpene Emissions from Consumer Products. J. Air Waste Manag. Assoc. 2004, 54, 367–377. doi:10.1080/10473289.2004.10470910
- Aoki, T.; Tanabe, S. I. Generation of Sub-Micron Particles and Secondary Pollutants from Building Materials by Ozone Reaction. Atmos. Environ. 2007, 41, 3139–3150. doi:10.1016/j.atmosenv.2006.07.053
- Nazaroff, W. W. Indoor Particle Dynamics. Indoor Air. 2004, 14(Suppl 7), 175–183. doi:10.1111/j.1600-0668.2004.00286.x
- Lai, A. C. K. Particle Deposition Indoors: A Review. Indoor Air. 2002, 12, 211–214. doi:10.1046/j.0905-6947.2002.1r159a.x
- Rovelli, S.; Cattaneo, A.; Nuzzi, C. P.; Spinazzè, A.; Piazza, S.; Carrer, P.; Cavallo, D. M. Airborne Particulate Matter in School Classrooms of Northern Italy. Int. J. Environ. Res. Public Health 2014, 11. doi:10.3390/ijerph110201398
- Qian, J.; Peccia, J.; Ferro, A. R. Walking-Induced Particle Resuspension in Indoor Environments. Atmos. Environ. 2014, 89, 464–481. doi:10.1016/j.atmosenv.2014.02.035
- International Commission on Radiological Protection (ICRP). 1994 ICRP Publication 66 - Human Respiratory Tract Model for Radiological Protection.
- Hoover, M. D.; Stefaniak, A. B.; Day, G. A.; Geraci, C. L. 2007 Exposure Assessment Considerations for Nanoparticles in the Workplace. In Nanotoxicology: Characterization, Dosing and Health Effects, Monteiro-Riviere, N.A., Tran, C.L., Eds., CRC Press: Boca Raton, pp. 71–83.
- Global burden of 87 risk factors in 204 countries and territories 1990–2019: A Systematic Analysis for the Global Burden of Disease Study 2019. The Lancet, GLOBAL HEALTH METRICS. October 2020, 396, P1223–1249. doi:10.1016/S0140-6736(20)30752-2
- Seaton, A.; MacNee, W.; Donaldson, K.; Godden, D. Particulate Air Pollution and Acute Health Effects. Lancet 1995, 345, 176–178. doi:10.1016/S0140-6736(95)90173-6
- Donaldson, K.; Stone, V.; Borm, P. J.; Jimenez, L. A.; Gilm our, P. S.; Schins, R. P.; Knaapen, A. M.; Rahman, I.; Faux, S. P.; Brown, D. M.; MacNee, W. Oxidative Stress and Calcium Signaling in the Adverse Effects of Environmental Particles (PM10). Free Radic. Biol. Med. 2003, 34, 1369–1382. doi:10.1016/S0891-5849(03)00150-3
- Shimada, A.; Kawamura, N.; Okajima, M.; Kaewamatawong, T.; Inoue, H.; Morita, T. Translocation Pathway of the Intratracheally Instilled Ultrafine Particles from the Lung into the Blood Circulation in the Mouse. Toxicol. Pathol. 2006, 34, 949–957. anddoi:10.1080/01926230601080502
- Kulkarni, P.; Baron, P. A.; Kulkarni, P.; Baron, P. A. 2011 An Approach to Performing Aerosol Measurements. In Aerosol Measurement: Principles, Techniques, and Applications, 3rd ed., Willeke, K., Eds., John Wiley & Sons, Ltd, pp. 55–65. doi:10.1002/9781118001684.ch5
- ISO - International Organization for Standardization. 2012 ISO 13138:2012 - Air quality — Sampling conventions for airborne particle deposition in the human respiratory system.
- ISO - International Organization for Standardization. 1995 ISO 7708:1995 - Air quality — Particle size fraction definitions for health-related sampling.
- Fine, P. M.; Cass, G. R.; Simoneit, B. R. T. Chemical Characterization of Fine Particle Emissions from the Wood Stove Combustion of Prevalent United States Tree Species. Environ. Eng. Sci. 2004, 21, 705–721. doi:10.1089/ees.2004.21.705
- Minguillón, M. C.; Arhami, M.; Schauer, J. J.; Sioutas, C. Seasonal and Spatial Variations of Sources of Fine and Quasi-Ultrafine Particulate Matter in Neighborhoods near the Los Angeles-Long Beach harbor. Atmos. Environ. 2008, 42, 7317–7328. doi:10.1016/j.atmosenv.2008.07.036
- ISO - International Organization for Standardization. 2021. ISO/DIS 16000-42 - Indoor air—Part 42: Measurement of the particle number concentration by Condensation Particle Counters. Available at: https://www.iso.org/standard/77911.html. (accessed 16 May 2022).
- CEN - European Committee for Standardization. 1993 CEN EN 481:1993 - Workplace atmospheres - Size fraction definitions for measurement of airborne.
- CEN - European Committee for Standardization. 2019 EN 689:2018 + AC:2019 Workplace exposure - Measurement of exposure by inhalation to chemical agents - Strategy for testing compliance with occupational exposure limit values - European Standards.
- ISO - International Organization for Standardization. 2018 ISO - ISO 16000-34:2018 - Indoor air — Part 34: Strategies for the measurement of airborne particles. ISO - International Organization for Standardization.
- Gilmour, M. I.; McGee, J.; Duvall, R. M.; Dailey, L.; Daniels, M.; Boykin, E.; Cho, S.-H.; Doerfler, D.; Gordon, T.; Devlin, R. B. Comparative Toxicity of Size-Fractionated Airborne Particulate Matter Obtained from Different Cities in the United States. Inhal. Toxicol. 2007, 19, 7–16. doi:10.1080/08958370701490379
- Pauluhn, J. Retrospective Analysis of 4-Week Inhalation Studies in Rats with Focus on Fate and Pulmonary Toxicity of Two Nanosized Aluminum Oxyhydroxides (Boehmite) and Pigment-Grade Iron Oxide (Magnetite): The Key Metric of Dose is Particle Mass and Not Particle Surface Area. Toxicology. 2009, 259, 140–148. doi:10.1016/j.tox.2009.02.012
- Atkinson, R. W.; Fuller, G. W.; Anderson, H. R.; Harrison, R. M.; Armstrong, B. Urban Ambient Particle Metrics and Health: A Time-Series Analysis. Epidemiology 2010, 21, 501–511. doi:10.1097/EDE.0b013e3181debc88
- World Health Organization. 2006 WHO Global Air Quality Guidelines: particulate Matter (PM2.5 and PM10), Ozone, Nitrogen Dioxide, Sulfur Dioxide and Carbon Monoxide. World Health Organization. https://apps.who.int/iris/bitstream/handle/10665/345329/9789240034228-eng.pdf?sequence=1&isAllowed=y
- WHO European Centre for Environment and Health. 2010 WHO guidelines for indoor air quality: selected pollutants. Available at: www.euro.who.int. (accessed 12 October 2021).
- European Committee for Standardization (CEN). 2014 EN 12341:2014 Ambient air - Standard gravimetric measurement method for the determination of the PM10 or PM2,5 mass concentration of suspended particulate matter.
- Wang, Z.; Calderón, L.; Patton, A. P.; Sorensen Allacci, M. A.; Senick, J.; Wener, R.; Andrews, C. J.; Mainelis, G. Comparison of Real-Time Instruments and Gravimetric Method When Measuring Particulate Matter in a Residential Building. J. Air Waste Manag. Assoc. 2016, 66, 1109–1120. doi:10.1080/10962247.2016.1201022
- Watson, J. G.; Chow, J. C.; Shah, J. J.; Pace, T. G. The Effect of Sampling Inlets on the PM-10 and PM-15 to TSP Concentration Ratios. J. Air Pollut. Control Assoc. 1983, 33, 114–119. doi:10.1080/00022470.1983.10465552
- Koistinen, K. J.; Kousa, A.; Tenhola, V.; Hänninen, O.; Jantunen, M. J.; Oglesby, L.; Kuenzli, N.; Georgoulis, L. Fine Particle (PM25) Measurement Methodology, Quality Assurance Procedures, and Pilot Results of the EXPOLIS Study. J. Air Waste Manag Assoc. 1999, 49, 1212–1220. doi:10.1080/10473289.1999.10463916
- Cattaneo, A.; Peruzzo, C.; Garramone, G.; Urso, P.; Ruggeri, R.; Carrer, P.; Cavallo, D. Airborne Particulate Matter and Gaseous Air Pollutants in Residential Structures in Lodi Province, Italy. Indoor Air. 2011, 21, 489–500. doi:10.1111/j.1600-0668.2011.00731.x
- Weisel, C. P.; Zhang, J. (.; Turpin, B. J.; Morandi, M. T.; Colome, S.; Stock, T. H.; Spektor, D. M.; Korn, L.; Winer, A.; Alimokhtari, S.; et al. Relationship of Indoor, Outdoor and Personal Air (RIOPA) Study: study Design, Methods and Quality Assurance/Control Results. J. Exp. Sci. Environ. Epidemiol. 2005, 15, 123–137. doi:10.1038/sj.jea.7500379
- Mihucz, V. G.; Szigeti, T.; Dunster, C.; Giannoni, M.; de Kluizenaar, Y.; Cattaneo, A.; Mandin, C.; Bartzis, J. G.; Lucarelli, F.; Kelly, F. J.; Záray, G. An Integrated Approach for the Chemical Characterization and Oxidative Potential Assessment of Indoor PM2.5. Microchem. J. 2015, 119, 22–29. doi:10.1016/j.microc.2014.10.006
- Szigeti, T.; Dunster, C.; Cattaneo, A.; Cavallo, D.; Spinazzè, A.; Saraga, D. E.; Sakellaris, I. A.; de Kluizenaar, Y.; Cornelissen, E. J. M.; Hänninen, O.; et al. Oxidative Potential and Chemical Composition of PM2.5in Office Buildings across Europe - the OFFICAIR Study. Environ. Int. 2016, 92–93, 324–333. doi:10.1016/j.envint.2016.04.015
- Mandin, C.; Trantallidi, M.; Cattaneo, A.; Canha, N.; Mihucz, V. G.; Szigeti, T.; Mabilia, R.; Perreca, E.; Spinazzè, A.; Fossati, S.; et al. Assessment of Indoor Air Quality in Office Buildings across Europe – the OFFICAIR Study. Sci. Total Environ. 2017, 579, 169–178. doi:10.1016/j.scitotenv.2016.10.238
- Babich, P.; Davey, M.; Allen, G.; Koutrakis, P. Method Comparisons for Particulate Nitrate, Elemental Carbon, and PM2.5 Mass in Seven U. S. Cities. J. Air Waste Manag. Assoc. 2000, 50, 1095–1105. doi:10.1080/10473289.2000.10464152
- Cyrys, J.; Dietrich, G.; Kreyling, W.; Tuch, T.; Heinrich, J. PM2.5 Measurements in Ambient Aerosol: Comparison between Harvard Impactor (HI) and the Tapered Element Oscillating Microbalance (TEOM) System. Sci. Total Environ. 2001, 278, 191–197. doi:10.1016/S0048-9697(01)00648-9
- Yanosky, J. D.; MacIntosh, D. L. A Comparison of Four Gravimetric Fine Particle Sampling Methods. J. Air Waste Manag. Assoc. 2001, 51, 878–884. doi:10.1080/10473289.2001.10464320
- Singh, M.; Misra, C.; Sioutas, C. Field Evaluation of a Personal Cascade Impactor Sampler (PCIS). Atmos. Environ. 2003, 37, 4781–4793. doi:10.1016/j.atmosenv.2003.08.013
- Winberry, W. T.; Forehand, L.; Murphy, N. T.; Ceroli, A.; Phinney, B. 1990 Compendium of methods for the determination of air pollutants in indoor air. https://www.osti.gov/biblio/6943454.
- Watson, J. G.; Chow, J. C. 2011 Ambient Aerosol Sampling. In Aerosol Measurement: Principles, Techniques, and Applications, Kulkarni, P., Baron, P.A., Willeke, K., Eds., Wiley, pp 591–614, 3rd ed.
- Watson, J. G.; Tropp, R. J.; Kohl, S. D.; Wang, X.; Chow, J. C. Filter Processing and Gravimetric Analysis for Suspended Particulate Matter Samples. Aerosol Sci. Eng. 2017, 1, 93–105. doi:10.1007/s41810-017-0010-4
- Soo, J. C.; Monaghan, K.; Lee, T.; Kashon, M.; Harper, M. Air Sampling Filtration Media: Collection Efficiency for Respirable Size-Selective Sampling. Aerosol Sci Technol. 2016, 50, 76–87. doi:10.1080/02786826.2015.1128525
- Chow, J. C.; Watson, J. G. Review of Measurement Methods and Compositions for Ultrafine Particles. Aerosol Air Qual. Res. 2007, 7, 121–173. doi:10.4209/aaqr.2007.05.0029
- Brown, A. S.; Yardley, R. E.; Quincey, P. G.; Butterfield, D. M. Studies of the Effect of Humidity and Other Factors on Some Different Filter Materials Used for Gravimetric Measurements of Ambient Particulate Matter. Atmos. Environ. 2006, 40, 4670–4678. doi:10.1016/j.atmosenv.2006.04.028
- Kajino, M.; Winiwarter, W.; Ueda, H. Modeling Retained Water Content in Measured Aerosol Mass. Atmos. Environ. 2006, 40, 5202–5213. doi:10.1016/j.atmosenv.2006.04.016
- Perrino, C.; Canepari, S.; Catrambone, M. Comparing the Performance of Teflon and Quartz Membrane Filters Collecting Atmospheric PM: Influence of Atmospheric Water. Aerosol Air Qual. Res. 2013, 13, 137–147. doi:10.4209/aaqr.2012.07.0167
- Using, A.; Samplers, C.; Fractions, A.; Agents, C.; Concentrations, P, ASTM D6552-06(2021) Standard Practice for Controlling and Characterizing Errors in Weighing Collected. ASTM International (American Society for Testing and Materials), 2011, 06, 1–8. doi:10.1520/D6552-06R21
- McMurry, P. H. A Review of Atmospheric Aerosol Measurements. Atmos. Environ. 2000, 34, 1959–1999. doi:10.1016/S1352-2310(99)00455-0
- Huang, L.; Bohac, S. V.; Chernyak, S. M.; Batterman, S. A. Composition and Integrity of PAHs, Nitro-PAHs, Hopanes and Steranes in Diesel Exhaust Particulate Matter. Water. Air. Soil Pollut. 2013, 224, doi:10.1007/s11270-013-1630-1.
- Tasić, V.; Jovašević-Stojanović, M.; Vardoulakis, S.; Milošević, N.; Kovačević, R.; Petrović, J. Comparative Assessment of a Real-Time Particle Monitor against the Reference Gravimetric Method for PM10 and PM2.5 in Indoor Air. Atmos. Environ. 2012, 54, 358–364. doi:10.1016/j.atmosenv.2012.02.030
- Chung, A.; Chang, D. P. Y.; Kleeman, M. J.; Perry, K. D.; Cahill, T. A.; Dutcher, D.; McDougall, E. M.; Stroud, K. Comparison of Real-Time Instruments Used to Monitor Airborne Particulate Matter. J. Air Waste Manag. Assoc. 2001, 51, 109–120. doi:10.1080/10473289.2001.10464254
- Alves, C.; Nunes, T.; Silva, J.; Duarte, M. Comfort Parameters and Particulate Matter (PM10 and PM2.5) in School Classrooms and Outdoor Air. Aerosol Air Qual. Res. 2013, 13, 1521–1535. doi:10.4209/aaqr.2012.11.0321
- Sioutas, C.; Kim, S.; Chang, M.; Terrell, L. L.; Gong, H. Field Evaluation of a Modified DataRAM Mie Scattering Monitor for Real-Time PM2.5 Mass Concentration Measurements. Atmos. Environ. 2000, 34, 4829–4838. doi:10.1016/S1352-2310(00)00244-2
- Wang, X.; Chancellor, G.; Evenstad, J.; Farnsworth, J. E.; Hase, A.; Olson, G. M.; Sreenath, A.; Agarwal, J. K. A Novel Optical Instrument for Estimating Size Segregated Aerosol Mass Concentration in Real Time. Aerosol Sci. Technol. 2009, 43, 939–950. doi:10.1080/02786820903045141
- Wallace, L. A.; Wheeler, A. J.; Kearney, J.; Van Ryswyk, K.; You, H.; Kulka, R. H.; Rasmussen, P. E.; Brook, J. R.; Xu, X. Validation of Continuous Particle Monitors for Personal, Indoor, and Outdoor Exposures. J. Expo. Sci. Environ. Epidemiol. 2011, 21, 49–64. doi:10.1038/jes.2010.15
- Fissan, H.; Neumann, S.; Trampe, A.; Pui, D. Y. H.; Shin, W. G. Rationale and Principle of an Instrument Measuring Lung Deposited Nanoparticle Surface Area. J. Nanopart. Res. 2006, 9, 53–59. doi:10.1007/s11051-006-9156-8
- Sorensen, C. M.; Gebhart, J.; O’Hern, T. J.; Rader, D. J. 2011 Optical Measurement Techniques: Fundamentals and Applications. In Aerosol Measurement: Principles, Techniques, and Applications, Kulkarni, P., Baron, P.A., Willeke, K., Eds., John Wiley & Sons, Ltd, pp. 269–312, 3rd ed.
- Kangasluoma, J.; Hering, S.; Picard, D.; Lewis, G.; Enroth, J.; Korhonen, F.; Kulmala, M.; Sellegri, K.; Attoui, M.; Petäjä, T. Characterization of Three New Condensation Particle Counters for Sub-3\,nm Particle Detection during the Helsinki CPC Workshop: The ADI Versatile Water CPC, TSI 3777 Nano Enhancer and Boosted TSI 3010. Atmos. Meas. Tech. 2017, 10, 2271–2281. doi:10.5194/amt-10-2271-2017
- Cattaneo, A.; Taronna, M.; Garramone, G.; Peruzzo, C.; Schlitt, C.; Consonni, D.; Cavallo, D. M. Comparison between Personal and Individual Exposure to Urban Air Pollutants. Aerosol Sci. Technol. 2010, 44, 370–379. doi:10.1080/02786821003662934
- Kupc, A.; Bischof, O.; Tritscher, T.; Beeston, M.; Krinke, T.; Wagner, P. E. Laboratory Characterization of a New Nano-Water-Based CPC 3788 and Performance Comparison to an Ultrafine Butanol-Based CPC 3776. Aerosol Sci. Technol. 2013, 47, 183–191. doi:10.1080/02786826.2012.738317
- European Committee for Standardization (CEN). 2016 CEN/TS 16976:2016 : Ambient air - Determination of the Particle Number Concentration of Atmospheric Aerosol.
- ISO - International Organization for Standardization. 2020 ISO 15900:2020 - Determination of particle size distribution — Differential electrical mobility analysis for aerosol particles.
- European Committee for Standardization (CEN). 2020 CEN/TS 17434:2020: Ambient air - Determination of the Particle Number Size Distribution of Atmospheric Aerosol Using a Mobility Particle Size Spectrometer (MPSS).
- Volkwein, J. C.; Maynard, A. D.; Harper, M. 2011 Workplace Aerosol Measurement. In Aerosol Measurement: Principles, Techniques, and Applications, Kulkarni, P., Baron, P.A., Willeke, K., Eds., John Wiley & Sons, Ltd, pp. 571–590, 3rd ed.
- Maynard, A. D.; Kuempel, E. D. Airborne Nanostructured Particles and Occupational Health. J. Nanopart. Res. 2005, 7, 587–614. doi:10.1007/s11051-005-6770-9
- Maynard, A. D.; Aitken, R. J. Assessing Exposure to Airborne Nanomaterials: Current Abilities and Future Requirements. Nanotoxicology 2007, 1, 26–41. doi:10.1080/17435390701314720
- Oberdörster, G.; Stone, V.; Donaldson, K. Toxicology of Nanoparticles: A Historical Perspective. Nanotoxicology 2007, 1, 2–25. doi:10.1080/17435390701314761
- Oberdörster, G.; Oberdörster, E.; Oberdörster, J. Nanotoxicology: An Emerging Discipline Evolving from Studies of Ultrafine Particles. Environ. Health Perspect. 2005, 113, 823–839. doi:10.1289/ehp.7339
- Albuquerque, P. C.; Gomes, J. F.; Bordado, J. C. Assessment of Exposure to Airborne Ultrafine Particles in the Urban Environment of Lisbon, Portugal. J. Air Waste Manag. Assoc. 2012, 62, 373–380. doi:10.1080/10962247.2012.658957
- Fierz, M.; Houle, C.; Steigmeier, P.; Burtscher, H. Design, Calibration, and Field Performance of a Miniature Diffusion Size Classifier. Aerosol. Sci. Technol. 2011, 45, 1–10. doi:10.1080/02786826.2010.516283
- Fierz, M.; Meier, D.; Steigmeier, P.; Burtscher, H. Miniature Nanoparticle Sensors for Exposure Measurement and TEM Sampling. J. Phys. Conf. Ser. 2015, 617, 12034.
- Marra, J.; Voetz, M.; Kiesling, H.-J. Monitor for Detecting and Assessing Exposure to Airborne Nanoparticles. J. Nanopart. Res. 2010, 12, 21–37. doi:10.1007/s11051-009-9695-x
- Todea, A. M.; Beckmann, S.; Kaminski, H.; Asbach, C. Accuracy of Electrical Aerosol Sensors Measuring Lung Deposited Surface Area Concentrations. J. Aerosol. Sci. 2015, 89, 96–109. doi:10.1016/j.jaerosci.2015.07.003
- Asbach, C.; Kaminski, H.; Fissan, H.; Monz, C.; Dahmann, D.; Mülhopt, S.; Paur, H. R.; Kiesling, H. J.; Herrmann, F.; Voetz, M.; Kuhlbusch, T. A. J. Comparison of Four Mobility Particle Sizers with Different Time Resolution for Stationary Exposure Measurements. J. Nanopart. Res. 2009, 11, 1593–1609. doi:10.1007/s11051-009-9679-x
- Asbach, C.; Kaminski, H.; Von Barany, D.; Kuhlbusch, T. A. J.; Monz, C.; Dziurowitz, N.; Pelzer, J.; Vossen, K.; Berlin, K.; Dietrich, S.; et al. Comparability of Portable Nanoparticle Exposure Monitors. Ann. Occup. Hyg. 2012, 56, 606–621.
- Levin, M.; Gudmundsson, A.; Pagels, J. H.; Fierz, M.; Mølhave, K.; Löndahl, J.; Jensen, K. A.; Koponen, I. K. Limitations in the Use of Unipolar Charging for Electrical Mobility Sizing Instruments: A Study of the Fast Mobility Particle Sizer. Aerosol Sci. Technol. 2015, 49, 556–565. doi:10.1080/02786826.2015.1052039
- Levin, M.; Witschger, O.; Bau, S.; Jankowska, E.; Koponen, I. K.; Koivisto, A. J.; Clausen, P. A.; Jensen, A.; Mølhave, K.; Asbach, C.; Jensen, K. A. Can we Trust Real Time Measurements of Lung Deposited Surface Area Concentrations in Dust from Powder Nanomaterials? Aerosol. Air Qual. Res. 2016, 16, 1105–1117. doi:10.4209/aaqr.2015.06.0413
- Leavey, A.; Fang, J.; Sahu, M.; Biswas, P. Comparison of Measured Particle Lung-Deposited Surface Area Concentrations by an Aerotrak 9000 Using Size Distribution Measurements for a Range of Combustion Aerosols. Aerosol Sci. Technol. 2013, 47, 966–978. doi:10.1080/02786826.2013.803018
- Leskinen, J.; Joutsensaari, J.; Lyyränen, J.; Koivisto, J.; Ruusunen, J.; Järvelä, M.; Tuomi, T.; Hämeri, K.; Auvinen, A.; Jokiniemi, J. Comparison of Nanoparticle Measurement Instruments for Occupational Health Applications. J. Nanopart. Res. 2012, 14, 718.
- Asbach, C.; Fissan, H.; Stahlmecke, B.; Kuhlbusch, T. A. J.; Pui, D. Y. H. Conceptual Limitations and Extensions of Lung-Deposited Nanoparticle Surface Area Monitor (NSAM). J. Nanopart. Res. 2009, 11, 101–109. doi:10.1007/s11051-008-9479-8
- Borghi, F.; Spinazzè, A.; Rovelli, S.; Campagnolo, D.; Del Buono, L.; Cattaneo, A.; Cavallo, D. M, Luca Del Buono Miniaturized Monitors for Assessment of Exposure to Air Pollutants: A Review. IJERPH 2017, 14, 909. doi:10.3390/ijerph14080909
- Fanti, G.; Borghi, F.; Spinazzè, A.; Rovelli, S.; Campagnolo, D.; Keller, M.; Cattaneo, A.; Cauda, E.; Cavallo, D. M. Features and Practicability of the Next-Generation Sensors and Monitors for Exposure Assessment to Airborne Pollutants: A Systematic Review. Sensors. 2021, 21, 4513. doi:10.3390/s21134513
- Howard, J.; Murashov, V.; Cauda, E.; Snawder, J. Advanced Sensor Technologies and the Future of Work. Am. J. Ind. Med. 2022, 65, 3–11. doi:10.1002/ajim.23300
- Morawska, L.; Thai, P. K.; Liu, X.; Asumadu-Sakyi, A.; Ayoko, G.; Bartonova, A.; Bedini, A.; Chai, F.; Christensen, B.; Dunbabin, M.; et al. Applications of Low-Cost Sensing Technologies for Air Quality Monitoring and Exposure Assessment: How Far Have They Gone? Environ. Int. 2018, 116, 286–299. doi:10.1016/j.envint.2018.04.018
- Fishbain, B.; Lerner, U.; Castell, N.; Cole-Hunter, T.; Popoola, O.; Broday, D. M.; Martinez Iñiguez, T.; Nieuwenhuijsen, M.; Jovasevic-Stojanovic, M.; Topalovic, D.; et al. An Evaluation Tool Kit of Air Quality Micro-Sensing Units. Sci. Total Environ. 2017, 575, 639–648. doi:10.1016/j.scitotenv.2016.09.061
- Castell, N.; Dauge, F. R.; Schneider, P.; Vogt, M.; Lerner, U.; Fishbain, B.; Broday, D.; Bartonova, A. Can Commercial Low-Cost Sensor Platforms Contribute to Air Quality Monitoring and Exposure Estimates? Environ. Int. 2017, 99, 293–302. doi:10.1016/j.envint.2016.12.007
- Chojer, H.; Branco, P. T. B. S.; Martins, F. G.; Alvim-Ferraz, M. C. M.; Sousa, S. I. V. Development of Low-Cost Indoor Air Quality Monitoring Devices: Recent Advancements. Sci. Total Environ. 2020, 727, 138385. doi:10.1016/j.scitotenv.2020.138385
- Zhang, H.; Srinivasan, R. A Systematic Review of Air Quality Sensors, Guidelines, and Measurement Studies for Indoor Air Quality Management. Sustain. 2020, 12, 9045. doi:10.3390/su12219045
- Kang, Y.; Aye, L.; Ngo, T. D.; Zhou, J. Performance Evaluation of Low-Cost Air Quality Sensors: A Review. Sci. Total Environ. 2022, 818, 151769. doi:10.1016/j.scitotenv.2021.151769
- Kumar, P.; Skouloudis, A. N.; Bell, M.; Viana, M.; Carotta, M. C.; Biskos, G.; Morawska, L. Real-Time Sensors for Indoor Air Monitoring and Challenges Ahead in Deploying Them to Urban Buildings. Sci. Total Environ. 2016, 560-561, 150–159. doi:10.1016/j.scitotenv.2016.04.032
- Schieweck, A.; Uhde, E.; Salthammer, T.; Salthammer, L. C.; Morawska, L.; Mazaheri, M.; Kumar, P. Smart Homes and the Control of Indoor Air Quality. Renew. Sustain. Energy Rev. 2018, 94, 705–718. doi:10.1016/j.rser.2018.05.057
- Jovašević-Stojanović, M.; Bartonova, A.; Topalović, D.; Lazović, I.; Pokrić, B.; Ristovski, Z. On the Use of Small and Cheaper Sensors and Devices for Indicative Citizen-Based Monitoring of Respirable Particulate Matter. Environ. Pollut. 2015, 206, 696–704. doi:10.1016/j.envpol.2015.08.035
- Sá, J. P.; Alvim-Ferraz, M. C. M.; Martins, F. G.; Sousa, S. I. V. Application of the Low-Cost Sensing Technology for Indoor Air Quality Monitoring: A Review. Environ. Technol. Innov. 2022, 28, 102551. doi:10.1016/j.eti.2022.102551
- Lewis, A. Von Schneidemesser, E.; and Peltier, R. Low-Cost Sensors for the Measurement of Atmospheric Composition: overview of Topic and Future Applications, WMO, 2018.
- Peltier, R. E.; Castell, N.; Clements, A. L.; Dye, T.; Hüglin, C.; Kroll, J. H.; Lung, S. C. C.; Ning, Z.; Parsons, M.; Penza, M.; et al. An Update on Low-Cost Sensors for the Measurement of Atmospheric Composition, WMO, 2020. https://library.wmo.int/doc_num.php?explnum_id=10620
- Technical Committee CEN/TC264/ WG 42 - Air Quality - Gas sensors.
- Li, J.; Li, H.; Ma, Y.; Wang, Y.; Abokifa, A. A.; Lu, C.; Biswas, P. Spatiotemporal Distribution of Indoor Particulate Matter Concentration with a Low-Cost Sensor Network. Build. Environ. 2018, 127, 138–147. (November 2017): doi:10.1016/j.buildenv.2017.11.001
- Cho, J. H.; Moon, J. W. Integrated Artificial Neural Network Prediction Model of Indoor Environmental Quality in a School Building. J. Clean. Prod. 2022, 344, 131083. (November 2021): doi:10.1016/j.jclepro.2022.131083
- Yuchi, W.; Gombojav, E.; Boldbaatar, B.; Galsuren, J.; Enkhmaa, S.; Beejin, B.; Naidan, G.; Ochir, C.; Legtseg, B.; Byambaa, T.; et al. Evaluation of Random Forest Regression and Multiple Linear Regression for Predicting Indoor Fine Particulate Matter Concentrations in a Highly Polluted City. Environ. Pollut. 2019, 245, 746–753. doi:10.1016/j.envpol.2018.11.034
- Loy-Benitez, J.; Vilela, P.; Li, Q.; Yoo, C. K. Sequential Prediction of Quantitative Health Risk Assessment for the Fine Particulate Matter in an Underground Facility Using Deep Recurrent Neural Networks. Ecotoxicol. Environ. Saf. 2019, 169, 316–324. (November 2018): doi:10.1016/j.ecoenv.2018.11.024
- Saini, J.; Dutta, M.; Marques, G. Sensors for Indoor Air Quality Monitoring and Assessment through Internet of Things: A Systematic Review. Environ. Monit. Assess. 2021, 193. doi:10.1007/s10661-020-08781-6