
Abstract
The study of salivary manifestation of various health disorders via Raman spectroscopy, as a noninvasive molecular sensing technique to analyze molecular signatures in the saliva projections of health, is an emerging field of investigation of combined spectroscopy-biofluidics for early-diagnostics and monitoring, enabling structural and chemical biomarkers to be monitored overtime to predict prognosis for translation to real-world sensing applications. Here, we review the potential uses in healthcare, illicit drug detection, forensics and dental/orthodontic uses, and expound the specific challenges related to the detection of certain classes of biomolecules or smaller compounds. We highlight the potential of extracellular vesicles, a salivary constituent and its potential as an emerging vehicle for medical applications. Furthermore, portable devices for Raman-saliva based detection are discussed with a specific attention on the associated microfluidic advances for miniaturization and integration of such technologies and multimodal systems are examined. Given the low concentrations of target analytes and thus, the high analytical sensitivity required, surface-enhanced Raman spectroscopy (SERS) methods are noted across the different application areas and for development of portable devices.
1. Introduction
1.1. Overview
Raman spectroscopy and saliva have been emerging as a promising combination of vibrational spectroscopy and biofluid that have the potential for use in point-of-care settings. Bottlenecks to adoption at bedside, roadside, or otherwise, are broadly methodological, with many studies across disciplines lacking standardization in terms of procedures employed, including matters related to collection, storage, salivary pretreatment, Raman spectroscopy set-ups used and measurement protocols (Figure S1, Supplementary material). Moreover, chemometric methods studied are often limited. We have recently discussed the methods in Raman spectroscopy for saliva studies.[Citation1]
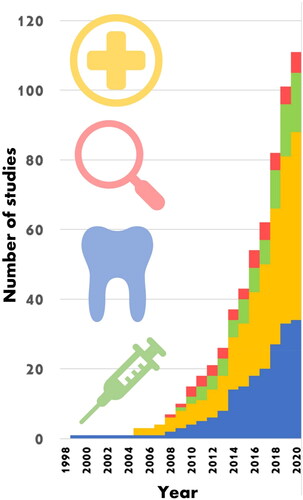
Nevertheless, Raman spectroscopy and saliva are rapidly growing and expanding research fields, as illustrated in , and have been previously researched within many application areas including medicine, dentistry and law enforcement (Tables S1 and S2, Supplementary material). Each application has its own set of requisite analytes, sensitivities, specificities and requirements for integration into existing protocols and thus, the associated challenges. In this review, we predominantly focus on the potential of Raman spectroscopy combined with saliva in the areas of healthcare and illicit drug detection. A dedicated commentary on the specific field of cancer related studies is included with a focused discussion on the potential of extracellular vesicles which can be directly interrogated in saliva samples via Raman spectroscopy, for the specific detection of a wide range of diseases. Application to law enforcement is further given and prominent drug classes are discussed. Forensic and dental applications are also briefly overviewed. Concurrently, advances in portable Raman devices, including microfluidic chips, are introduced alongside developments of the emerging multi-modal analyses. The complimentary nature of Infrared absorption spectroscopy and Raman spectroscopy allows for a more complete understanding of molecular vibration structure of the target analytes to be obtained when both are used; hence, we also provide a comprehensive outline comparing the two techniques.
Figure 1. Cumulative Raman-saliva studies. Each subject area has seen an exponential-like rise in publications particularly since the late 2000s. Bars in (blue) dentistry, (yellow) medicine, (green) drugs and (red) forensics. Included publications are listed in Supporting Information . Based on this observation, it would be expected that total papers on the Raman analysis of saliva to exceed 200 by 2025.
1.2. Comparison of Raman with infrared absorption spectroscopy
Raman spectroscopy (RS), a form of vibrational spectroscopy, provides a unique biomolecular spectral fingerprint of target analytes by exciting molecular bonds within a sample. RS enables the nondestructive quantitative analysis of the chemical composition and structure of analytes. Infrared (IR) absorption spectroscopy on the other hand, relies on small energy absorbances that occur between various vibrational and rotational states. Within vibrational spectroscopies, IR and Raman are complementary techniques when used together. However, Raman remains a naturally weak effect and due to technological advances, IR spectrometers have become the choice spectrometer for vibrational spectroscopies. Notably, IR systems have been latterly benefitting from the ongoing progress in the development of linear variable bandpass filters.[Citation2] While IR spectroscopy remains the leading vibrational spectroscopy technique in terms of miniaturized device development,[Citation3] there are some indications that accuracy and simplified presentations of ease of use in current commercial systems may be exaggerated.[Citation3] Concurrently, in recent years, the handheld Raman spectrometer market has been experiencing a substantial growth.[Citation4,Citation5] Phenomenologically different, IR and Raman are in fact complementary, having different conditions for excitation of molecular bonds (selection rules) and thereby exhibit different spectral peaks in the respective spectra. Whilst IR spectra are impeded by the impact of water absorption, which may obscure analysis of aqueous samples, in contrast, the environment has a very low Raman cross-section. Furthermore, the relatively broad and thus, often overlapping IR bands, can prove problematic in sample identifications. These render Raman scattering as more applicable for aqueous sample analyses and multiplexed detection, especially where unknown compounds are present.
A further avenue where Raman spectroscopy shows continued potential is in its combination with plasmonic metals, which can support surface-confined hybridized electron-light excitations, surface plasmon-polaritons which can couple to photons participating in Raman scattering events and thus, leading to orders of magnitude increase in Raman signal and an increased analytical sensitivity. It is also possible to perform an IR analogue of SERS known as, surface-enhanced infrared absorption spectroscopy (SEIRAS). Here, transitions in the infrared are probed and the enhancement is phonon mediated. While the impact of fluorescence is often reduced in the infrared, the enhancements associated with SEIRAS are considerably more modest (101-103)[Citation6] compared to SERS, i.e., up to 108 for a SERS substrate averaged value[Citation7,Citation8] although some mitigation occurs with the cross-section of IR absorption typically orders of magnitude larger than the Raman cross-section.[Citation6] Currently, the main bottleneck in SERS exploitation lies in the development of economical and reproducible enhancing sub-micron structured substrates, which also need to be fabricated on a large scale. High sensitivity sensing is essential toward diagnostics for the timely detection of subtle physiological changes fundamental to improving patient wellbeing.
2. Healthcare
2.1. What are biomarkers?
Raman spectroscopy opens the possibility of detecting a broad range of substances, and in terms of healthcare, these are often termed biomarkers of disease or medical drug use. Biomarkers are bodily substances, detection of which is often useful for disease identification (diagnostic) or outcome assessment (prognostic) purposes.[Citation9] By measuring differences between normal physiological and altered states, whether due to pathology or pharmacology, treatment decisions can be determined. The potential exists not just for disease determination, but also for the assessment of disease severity (stratification) and indeed, continual monitoring throughout treatment.[Citation10] A greater focus on prevention or even “predisposition testing” is possible.[Citation11] Thus, there is growing interest in biomarkers as they precede phenotypic indicators of disease and may significantly improve survival rates in certain conditions where clinical manifestations come at advanced stages.[Citation12]
In the US, the Food and Drug Administration (FDA), alongside the National Institutes of Health (NIH), has produced a glossary, “Biomarkers, EndpointS and other Tools” (BEST), which describe a biomarker as a defined characteristic that is measured as an indicator of normal biological processes, pathogenic processes, or responses to an exposure or intervention, including therapeutic interventions. BEST offers several types, namely, molecular, histologic, radiographic, or physiologic characteristics, and in seven categories: susceptibility / risk, diagnostic, monitoring, prognostic, predictive, pharmacodynamic / response and safety.[Citation13,Citation14] The World Health Organization (WHO) states a biomarker is any substance, structure, or process that can be measured in the body or its products and influence or predict the incidence of outcome or disease.[Citation13,Citation15]
2.2. Raman and saliva in healthcare studies
A problem in healthcare research is the non-specificity of biomolecules, which is debatably compounded by a base of small studies that focus on specific diseases.[Citation16] For instance, in the context of traumatic brain injury, certain biomarkers may also be indicative of polytrauma or neurodegenerative disease,[Citation9] e.g., Tau, neurofilament light chain, myelin basic protein. For this reason, the full extent of the injury and/or co-morbidities should be noted. In general, this would appear not to be the case within current Raman-saliva studies, many of which are preliminary in nature. Moreover, there is the broad difficulty of patients’ data security, permissions and ethics.[Citation16] Elsewhere, problems may arise in a lack of specificity to the locale of disease, e.g., sialic acid (SA) – a cancer biomarker, is detected in many different types of cancers. Furthermore, healthcare related studies tend to be concerned with changes to Raman peak intensities, or more precisely, relative peak intensity ratio changes rather than the appearance of distinct spectral features. This can make analysis challenging, even with supporting chemometric tools, especially if physiological changes are subtle. In turn, medical and clinical studies can be difficult to power correctly to reach statistical significance.[Citation16–18] This is exacerbated by the difficulty of obtaining large sample numbers for the various studied diseases and much of the current biomarker research, at large, is still restricted to small cohorts.[Citation16]
2.3. Cancer types
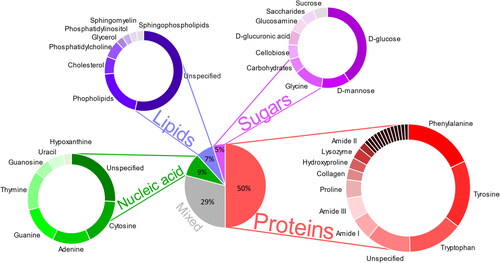
With 19.3 million new cancer cases and almost 10.0 million deaths in 2020, cancer is one of the most prevalent and fatal diseases worldwide.[Citation19] With an estimated 2.3 million cases (11.7%), female breast cancer has surpassed lung cancer as the most diagnosed cancer globally, followed by lung (11.4%), colorectal (10.0%), prostate (7.3%), and stomach (5.6%) cancers.[Citation19] By 2040, the global cancer burden is projected to be 28.4 million cases, a rise of 47% from 2020. The diversity and prevalence of cancer highlights the need for a global escalation in cancer diagnostics, distribution of preventative cancer measurements as well as providing cancer care in those transitioning countries to control the disease.[Citation19] Raman spectroscopy is emerging as a potentially useful clinical aide in cancer diagnostics. RS can identify and differentiate, in a label-free and noninvasive way, the subtle changes in tissue biochemistry associated with disease and cancer progression. The close association of salivary composition to serum metabolites, combined with the wide spectrum of molecules present in saliva provides valuable information for clinical diagnostic applications, of which the main Raman peak assignments relating to cancer diagnostics are illustrated in with further spectral assignments made in Table S3 (Supplementary material). Several studies have attempted spectral analysis of biofluids using Raman spectroscopy for disease diagnosis and screening as it may represent a prospective viable avenue for cancer diagnosis (Figures S2 and S3, Supplementary material). Saliva has been investigated as a diagnostic medium and its analytes (protein, RNA, DNA) as biomarkers in the diagnosis of several malignancies including lung cancer, breast cancer, prostate cancer, ovarian cancer and squamous cell carcinoma.
Figure 2. Raman peak assignment on cancerous saliva samples (n = 732). An overview pie chart of the most prominent peaks in the literature displayed by their biomolecular group. A subset of the Raman-saliva literature with a perceived focus on chemometrics has been analyzed. Further details are included in Supporting Information, and Table S3.
2.3.1. Breast cancer
Breast cancer is the most diagnosed cancer and the leading cause of death in women. Routine diagnostic procedures include histopathological examination of biopsy samples, fluorescence, optical bioluminescence, X-ray mammography, computed tomography, magnetic resonance imaging and ultrasound, which are often time-consuming and costly. Issues include low sensitivity and resolution.[Citation20] To overcome this, Wu et al. developed a noninvasive breast tumor detection method using saliva protein SERS combined with regularized multinomial regression (RMR). Their study indicated diagnostic accuracies of 92.7% (85/97), 95.8% (93/97) and 88.6% (86/97) were acquired, while successfully discriminating among the normal group, the benign breast tumor group and the malignant breast tumor group.[Citation21] Likewise, Feng et al. also exploited the capability of saliva protein analysis, based on membrane purification and SERS for detecting benign and malignant breast tumors. The authors detected subtle but discernible changes in the mean SERS spectra in each of the three groups. Multiclass partial least squares discriminant analysis was used to analyze and classify the saliva protein SERS spectra from healthy subjects, benign breast tumor patients, and malignant breast tumor patients, yielding diagnostic sensitivities of 75.7%, 72.3% and 74.1% as well as specificities of 93.7%, 81.2% and 86.3%, respectively.[Citation22]
Furthermore, Hernández-Arteaga et al. indicate the importance of SA in the diagnosis of breast cancer.[Citation23] The authors evaluated the feasibility of Raman as a method of quantification of SA in saliva using citrate-reduced silver nanoparticles as a SERS substrate. They determined the mean SA concentration was significantly higher among breast cancer patients (18.3 ± 9.4 mg/dL) than in the healthy control group (3.5 ± 1.0 mg/dL) with SERS test sensitivity of 94% and specificity of 98%.[Citation23] In a further study, the authors once again measured SA levels using SERS with tailored citrate-reduced silver nanoparticles, however exhibiting a lower sensitivity and specificity of 80% and 93%, respectively.[Citation23]
2.3.2. Lung cancer
Lung cancer remains the leading cause of cancer mortality, leading to more than 1 million deaths worldwide in 2020. Clinical studies indicate that approximately 80% of patients are diagnosed with advanced lung cancer and with a 5-year survival rate of only 20%.[Citation24] Thus, effective screening and early detection have the potential to decrease lung cancer mortality. Wang et al. demonstrated early detection technology of lung cancer based on SERS. They analyzed 19 lung cancer and 45 healthy patient samples and obtained an accuracy of 96.9% by Logistic Regression Analysis. The authors also detected two prominent peaks of interest, 758 cm-1 and 1244 cm-1.[Citation25] Similarly, Li et al. applied SERS for the detection of lung cancer using silver colloids. The peak variations between the healthy and diseased groups were investigated. The authors determined that lung cancer peaks were largely detected at a lower Raman intensity than those of their healthy counterparts. Principal component analysis (PCA) and linear discriminant analysis (LDA) were used to discriminate between the data sets resulting in an 80% accuracy, 78% sensitivity and 83% specificity.[Citation26] Qian et al. also applied SERS in their new method of lung cancer detection. The authors combined a SERS system with a gold-modified nanochip. Support vector machine and random forest algorithms were used to analyze differences between healthy and diseased data sets. Sensitivity and specificity of Raman spectroscopy data was 100%.[Citation27]
2.3.3. Head and neck cancers
Cancers that are known collectively as head and neck cancers, usually begin in the squamous cells that line the mucosal surfaces of the head and neck.[Citation28] Head and neck cancers can form in the oral cavity, throat (pharynx), voice box (larynx), paranasal sinuses and nasal cavity and salivary glands.[Citation29]
Of the head and neck cancers, oral cancer with seven publications has been the most extensively researched as a Raman salivary disease. Oral cancer involving the lip and oral cavity is the sixth most common type of cancer worldwide.[Citation30] Currently, diagnosis of oral cancer relies on clinical investigation and histopathological examination; however there is a high risk that cancerous lesions developing in hidden areas may go undetected, therefore early detection is key to improving survival rates of patients.[Citation31] Saliva represents an ideal biofluid for research relating to oral and oropharyngeal cancer diagnostics due to its intimate proximity with the oral mucosa.[Citation32] The application of biomarkers for the detection of oral cancer is a challenging prospect, with over 100 different salivary constituents currently suggested as potential salivary biomarkers. The majority of these potential biomarkers are proteins which require highly sensitive methods for detection as they are present at finite concentrations. Therefore, typical analytical techniques such as the enzyme-linked immunosorbent assay (ELISA) and radio-immunoassays are limited in their ability to effectively discriminate oral cancer[Citation33,Citation34] and the research has been moving more toward the detection of biomolecular differences between the normal and diseased states.
One such study by Connolly et al. explored the application of silver nanoparticle-based label-free SERS for biochemical analysis of saliva and oral cell samples from healthy and confirmed oral cancer patients. The study demonstrated the potential of saliva and oral cell SERS combined with PCA-LDA or PCA-linear regression (PCA-LR), revealing a sensitivity of 89% and 68% and a diagnostic accuracy of 73% and 60%, respectively for saliva and oral cells.[Citation35] Rekha et al. applied near-infrared Raman spectroscopic characterization of salivary metabolites in discriminating normal from oral premalignant and malignant conditions. PCA coupled with LDA yielded a diagnostic sensitivity of 96.4% and 93.8% and a specificity of 70.2% and 95.7% in the classification of normal from premalignant and normal from malignant, respectively.[Citation36]
In addition, Fălămaş et al. explored the enhancement of salivary characteristic Raman bands by using label-free, ultrasensitive SERS based on gold nanoparticles. Mixing Au colloidal nanoparticles with dry samples of saliva presented a high variability of signal intensities and frequency shifts. Healthy and oral cancer saliva was differentiated using PCA. The authors also identified thiocyanate Raman modes in saliva samples of both smoking and nonsmoking volunteers and cancer patients, indicating that the cancer group displayed an overall higher level of the 2126 cm-1 band area assigned to C-N stretching vibrations of thiocyanate.[Citation30] Similarly, Jaychandran et al. combined Raman analysis with PC-LDA to discriminate oral pre malignancy and malignancy from normal controls with an accuracy of 93.1% in saliva samples.[Citation37] A further study by Falamas et al. aimed to test a sample preparation method for oral and oropharyngeal cancer diagnosis using micro-Raman and Fourier transform infrared (FTIR) with an accuracy of 90% based on micro-Raman. The authors identified several differences between healthy and cancer patients, with the band at 2064 cm-1 suggested to be assigned to thiocyanate. They observed further cancer-indicative bands at 754 cm-1 (tryptophan), 530 and 927 cm-1 (lysozyme) and 1001 cm-1 (phenylalanine).[Citation30] Fălămaş et al. have further described a newly identified sample protocol for the detection of oral squamous cell carcinoma producing high signal-to-noise ratio Raman spectra.[Citation30] Kah et al. exploited the ability of gold nanoparticles to enhance the Raman signal of bioanalytes in cancer. They developed a self-assembled SERS-active gold nanoparticle monolayer film as a biosensing surface. The authors indicated that the SERS spectra of saliva from the closely packed gold nanoparticle films were discernible from those acquired from normal individuals and oral cancer patients.[Citation12]
Researchers have also focused their efforts on the detection of nasopharyngeal carcinomas (NPC). NPC, a head and neck malignancy, has a particularly high mortality rate in certain regions of south-eastern Asia. The five-year overall survival rate is about 90% for stage I NPC patients. However, the stage IV group has a poor five-year overall survival rate of 30.3%.[Citation38,Citation39] Early detection of NPC remains challenging due to the insidious nature of the cancer and the general inaccessibility of the nasopharynx. Therefore, researchers have started developing noninvasive detection methods based on salivary proteins using SERS,[Citation40] where the authors evaluated the capability of saliva analysis combining membrane protein purification with SERS and PCA-LDA. This method yielded a diagnostic sensitivity of 70.7%, specificity of 70.3% and diagnostic accuracy of 70.5%.[Citation40] Similarly, Feng et al. developed a method of saliva analysis combining membrane protein purification with silver nanoparticle-based SERS for the noninvasive detection of NCP. The authors used cellulase acetate membranes to obtain purified proteins from human saliva and mixed these with silver nanoparticles for SERS analysis. They obtained a higher diagnostic accuracy of 90.2% when combining PCA-LDA.[Citation41] Additional study by Qiu et al. evaluated the use of saliva SERS for the detection of NPC. The authors used silver colloids as the SERS substrate and achieved a diagnostic accuracy of 83.9% with a sensitivity of 86.7% and specificity of 81.3% using PCA-LDA. They also determined several Raman bands of interest at 447, 496, 635, 729, 1134, 1270 and 1448 cm-1, which primarily contained signals associated with proteins, nucleic acids, fatty acids, glycogen and collagen.[Citation42]
2.3.4. Other types of cancer
Raman spectroscopy has shown its versatility for the diagnosis of breast, lung and head and neck cancers however, it has also been demonstrating applications in other types of cancer. Aslam et al. and Zhang et al. focused on using SERS.[Citation43,Citation44] Aslam et al. applied artificial neural networks to classify and predict gastric cancer from SERS data, whilst Zhang et al. manufactured a SERS sensor to analyze eight salivary amino acids of interest in gastric cancer. Maitra et al. explored Raman spectral discrimination in human liquid biopsies toward detecting esophageal stages through to esophageal adenocarcinoma.[Citation45] The authors used PCA, successive projections algorithm or genetic algorithm (GA) followed by quadratic discriminant analysis (QDA), achieving 100% sample classification when using the GA-QDA model.[Citation45] Cottat et al. developed a nanobiosensor to detect manganese super oxide dismutase (MnSOD), as specific biomarker of liver cancer. They applied gold nanostructures (nanocylinders and coupled nanorods) to observe SERS signal of the MnSOD at concentrations down to nM.[Citation46] Hernández-Arteaga et al. previously reported the significance of SA in breast cancer, Zermeño-Nava et al. also reported SA as a predictor of ovarian cancer.[Citation23,Citation47] The authors demonstrated the use of SERS to determine SA levels in saliva using silver nanoparticles. Their results indicated a sensitivity/specificity of 80%/100% with a cutoff of 15.5 mg/dL to distinguish between benign/cancer.[Citation47]
2.4. Other diseases
As well as cancer detection, salivary Raman methods have found applications within many other healthcare studies. For example, Cao et al. developed a potential method for the noninvasive detection of acute myocardial infarction (MI). The authors observed significant differences between healthy and MI Raman bands, yielding a diagnostic sensitivity of 80.4%.[Citation48] Multiple studies have focused on the diagnosis of Sjögren’s syndrome, e.g., Moisoiu et al. combined SERS of saliva with two-dimensional shear wave elasography (2 D-SWE) of the parotid glands whereas Stefancu et al., applied SERS based liquid biopsy of saliva from patients with Sjögren’s syndrome, with silver nanoparticles used as SERS substrate and the data analyzed using PCA-LDA to achieve an overall higher classification accuracy of 94%.[Citation49,Citation50] In addition, Eom et al. used SERS in the diagnosis of Tamiflu-resistant influenza virus.[Citation51] The authors combined SERS-active substrates with urchin gold nanoparticles and oseltamivir hexylthiol, an excellent receptor for the oseltamivir-resistant pandemic H1N1 (pH1N1)/H275Y mutant virus. A further application was identified by Ember et al. in the detection of COVID-19. The authors developed a reagent-free method of detecting COVID-19 combining Raman spectroscopy, machine learning and droplet segmentation to achieve sensitivities of 79 and 84% in males and females and specificities of 75 and 64%, respectively.[Citation52] Carlomagno et al. aimed to discriminate amyotrophic Lateral sclerosis (ALS) onset using Raman spectroscopy to provide a fast, sensitive procedure to efficiently diagnose and monitor the therapeutic and rehabilitative processes.[Citation53] Saliva and Raman have also found applications in screening for Alzheimer’s Disease (AD). Ralbovsky et al. combined Raman hyper-spectroscopy with machine learning to develop a novel method for the diagnosis of AD based on salivary analysis, indicating its remarkable potential for use as a noninvasive, efficient, and accurate (99%) method.[Citation54] Further applications have been identified as a noninvasive alternative procedure for early detection in childhood asthma biomarkers,[Citation55] analysis of thiocyanate in saliva using droplet SERS-microfluidic chip[Citation56] and for the detection of Pseudomonas aeruginosa in saliva using SERS.[Citation57]
2.5. Extracellular vesicle analysis in saliva and current characterization methods
Extracellular vesicles (EVs) are a heterogeneous group of membrane-bound vesicles which vary in submicron size. EVs represent a potential source for biomarker discovery and have been increasingly recognized as strong vehicles of long-range intercellular communication in the body.[Citation58] They can transfer proteins, nucleic acids, and lipids to other cells, thereby influencing the recipient cell function.[Citation59] Initially underappreciated and thought to act as a mechanism of cell disposal, EVs are now considered abundant and stable sources of circulatory biomarkers.[Citation60–62] They provide a snapshot of the cells from which they originate and as such, are depositaries of significant information. Recent research has looked at the use of EVs (in specific, exosomes) as therapeutic vectors functionalized to trigger an immune response in a host, and application to COVID-19 has been identified.[Citation63]
Typically, EV subpopulations are broadly divided into three main groups based on their biogenesis: (a) exosomes, which constitute a homogenous population of spherical vesicles of approximately 30–100 nm; (b) microvesicles, which are large bilayered vesicles 100–1000 nm in diameter; and c) apoptotic bodies that comprise a highly heterogeneous group of bilayered vesicles 800–5000 nm in diameter.[Citation64,Citation65] EVs have been found in the extracellular space as well as circulating through many different body fluids including saliva and blood.[Citation66,Citation67] These biofluids contain non-vesicular macromolecular structures which could interfere with analytical results and thus, EVs isolation and enrichment is a required pre-analytical step for biomedical research.[Citation68] In general, there are three main methodologies used for the isolation and purification of EVs including, ultracentrifugation/differential centrifugation, adsorption to microbeads (immunoaffinity) and size exclusion chromatography.[Citation69–71]
Traditionally, microscopic methods such as atomic force microscopy (AFM), dynamic light scattering (DLS), flow cyto(fluoro)metry, and nanoparticle tracking analysis (NTA) have been used to characterize EVs and measure physical features such as vesicle morphology and size. ELISA may be used for the purpose of specificity, where only antibodies for external epitopes lead to a signal and surface plasmon resonance (SPR) is an easy way to obtain interaction parameters. However, given the importance of EVs in liquid biopsies better quantification of EVs is required. New sensing strategies relying on detection principles including fluorescence, colorimetry and electrochemistry-based technologies, allow for the detection of EVs either with the naked eye or without the requirement of purification steps, promising for the development of future point-of-care (PoC) testing devices.[Citation72] Due to its simplicity, fluorescence is the most popular approach for the detection of EVs. Fluorescent molecules are used as tags to label DNA probes and antibodies thus, enabling the detection of EVs via nucleic acid hybridization and antibody/antigen interactions.[Citation73] Moreover, colorimetric detection allows for direct visual observation of EVs. This simplifies the detection process and reduces the need for bulky instrumentation, fitting for PoC testing.[Citation74] However, there can be significant differences between output data between the different EV characterization techniques, and arguably, there is no gold standard for routine benchtop EV analysis.[Citation71]
Raman spectroscopy offers an alternative method in the analytical study and detection of EVs. Recently, Gualerzi et al. described Raman spectroscopy as a tool to assess the purity of EV stem cell preparations. The authors indicate the ability of Raman to rapidly assess the composition and purity of EVs. The Raman spectral fingerprints obtained from the different sample preparations can discern both the cell source of the EV and which isolation procedure (ultracentrifugation, size exclusion) was applied.[Citation75] A further study by Kwizera et al. describes the use of gold nanorods as a SERS-active platform in the detection of breast cancer cells.[Citation76] Here, exosomes were captured on a miniaturized affinity-based device and target proteins on the EVs were detected using gold nanorods coated with QSY21 Raman reporters. The authors indicated that by using this technique, differences can be observed in the protein profiles of breast cancer cells compared to those normal breast cells. These studies analyze blood samples, but Raman spectroscopy also has the potential for similar EV analysis in saliva.
Notably, tip-enhanced Raman spectroscopy (TERS) might prove a useful technique for EV analysis, having so far been seemingly unexploited in the literature, whether for EVs specifically, or other salivary constituents.[Citation1] TERS opens the possibility of characterizing individual EVs by combining the chemical information provided by Raman scattering, the sensitivity of SERS and the spatial resolution of scanning probe microscopy. This technique uses a scanning tunneling microscope (STM), or AFM set-up, with a plasmonically active tip, which when proximal to analyte molecules and illuminated with light of appropriate wavelength, can produce a SERS effect.[Citation77,Citation78] EV damage however, caused by tip collision or plasmonic heating could be problematic, as could inhomogeneity, should too few measurements be taken.[Citation79] It is worth mentioning, that TERS has a long-standing and well-known problem of reproducible tip manufacture (and thus signal uniformity).
3. Illicit drugs
3.1. Introduction
As many as 250,000,000 people abuse substances worldwide each year,[Citation80] resulting in illicit drug use, costly for law enforcement, healthcare and employment.[Citation81] Not all drugs are consumed illegally, some “abused drugs” are intended for medical purposes, whether they be prescribed or over the counter (OTC) medications.[Citation82] While drugs of various kinds have been well-studied with Raman spectroscopy,[Citation17,Citation83,Citation84] the analysis of drugs in saliva is still an emerging area and is underpinned by the limited classes of compounds typically reported including for instance, stimulants, opioids/opiates, and cannabinoids (). At present, high-cost reagents and time-consuming assays are often employed in the laboratory for drug identification, including for example, gas chromatography with mass spectrometry (GC/MS), high-performance liquid chromatography (HPLC), and ELISA with the more rapid and portable technique of colorimetric testing lacking specificity and being subjective.[Citation31,Citation81,Citation85–95] At the point of need, drug testing often requires fast, inexpensive and selective testing and Raman analysis of saliva offers a potential solution, which in contrast to urine, often contains parent compounds.[Citation81,Citation96] Furthermore, when an illicit compound has been ingested, this can lower analytical sensitivity requirements due to contamination of the oral cavity via direct contact with the illicit substance. Whilst in quantitative studies this may lead to an overestimation of drug concentration in oral fluid levels, this in turn acts as an advantage for qualitative screening when determining any recent exposure to illicit substances.[Citation96] Despite a rise in cases of “drug-driving,” there is currently no roadside drug test[Citation82,Citation97] analogous to that of an alcohol breathalyzer. Detection of drugs in hospitalized patients due to overdose also requires rapid assessment.[Citation82]
Table 1. Details of illicit drug Raman-saliva studies.
In theory, almost any illicit compound can be detected by Raman spectroscopy. In a range of studies, Inscore and Farquharson investigated 80 and 150 different kinds of compounds respectively, including barbiturates, antipsychotics and sedatives.[Citation97,Citation98] Even where differences in molecular structure were found subtle, such as between novel cannabinoids,[Citation96] the sensitivity of RS phenomenon to alterations in molecular bonds did not preclude detection, albeit perhaps an increased emphasis on subsequent chemometric analysis. The real impasse using Raman analysis was the low concentrations in certain saliva samples, coupled with the inherently low Raman cross-section.
Higher sensitivity could be achieved using SERS for saliva studies. However, the molecular affinity to specific plasmonic metals, usually gold or silver, needs to be considered to ensure suitable detection.[Citation91,Citation97–99] In addition, the adsorbate-metal complex may result in spectrally shifted Raman bands, which needs to be taken into a consideration.[Citation100]
In some cases, a modification to the spectral position of the Raman bands in SERS could prove advantageous. From the point of discrimination, for example, between methylphenidate and meperidine with the former adsorbing to gold such that distinct peaks are present.[Citation98] Furthermore, the complex matrix of salivary constituents can easily interfere with the measurement and given the short-range nature of the SERS effect, mitigate any enhancement of the requisite analyte molecules.[Citation88,Citation90] Similar maleffect may be observed with interferent capping agents in nanoparticle SERS studies.[Citation91] In turn, these problems introduce the requirements for pretreatment steps (if not already in place). Such considerations, while generally applicable in analytics,[Citation101] may be especially pertinent where smaller molecules are concerned, such as those in drug studies.
3.2. Stimulants
3.2.1. Methamphetamine
One commonly studied illicit compound with adsorption problems to a metal surface for SERS study is methamphetamine.[Citation81] The compound’s lack of net charge and suitable moieties hinders optimal adsorption to a silver surface,[Citation88] although chemical modification to the molecule,[Citation102] or removal of the capping agent (used to stabilize the colloid suspicion) have been shown to promote a better affinity.[Citation81,Citation103] This has been discussed by Kline et al., where the authors varied excitation wavelengths and capping agents.[Citation91] Hong et al. reported the limit of detection (LoD) in the micromolar range from saliva in an optoplasmonic (i.e., combining optics and plasmonics) SERS system consisting of silane modified SiO2 spheres, functionalized with a carboxyl group, effectively extracting methamphetamine from the complex salivary matrix.[Citation104] Similarly, Su et al. used a CHCl3 extractant with a low Raman cross-section to successfully remove methamphetamine from saliva.[Citation105]
3.2.2. Cocaine
The detection of cocaine formed one of the first commercially device-oriented Raman-saliva studies (alongside benzoylecgonine and barbiturates).[Citation106] As highlighted by Dana et al., cocaine concentrations, along with cocaine metabolites, were found to correlate with those in blood plasma.[Citation107,Citation108] The authors have also highlighted a previous study demonstrating saliva analysis outperforming serum and urine samples for similar cocaine concentrations.[Citation109] As with methamphetamine, cocaine would appear to have a better affinity to gold surfaces than silver. In an additional SERS study on cocaine, Dana et al. detected a decrease in sensitivity of around two orders of magnitude between gold (1 μg/mL) and silver (100 μg/mL) sol-gel-doped capillaries.[Citation110] A similar conclusion was reached by Inscore et al., who observed that while cocaine was active on both gold and silver substrates, the detection limit was 500× lower for gold (100 ppb vs. 50 ppm).[Citation98] This is a remarkable outcome since silver significantly outperforms gold as a plasmonic enhancer across the visible range (>600 nm).[Citation7,Citation111] The appearance of a new cocaine peak and changes to relative peak intensities have also been noted, despite the saliva matrix being adjudged to interfere minimally.[Citation110] One contradicting report however, by Kline et al., noted the absence of cocaine Raman bands in a SERS study with AuNPs (vs. AgNPs), attributing the discrepancy to the plasmonic performance deficit of gold.[Citation91]
Dana et al. deemed pretreatment measures necessary to achieve useful cocaine sensitivities, adding solvent and noting no difference between filtration and centrifugation in causing mucin removal. A subsequent solid-phase extraction step was performed. Sensitivity improvement however was modest (25 μg/mL) and further optimization was required.[Citation110]
In a magnetically induced nanoparticle aggregation SERS study, Yang et al. detected cocaine metabolite benzoylecgonine down to 29 ppb[Citation90] from which the cocaine concentration could be determined. D’Elia et al. opted for a different strategy instead by utilizing UV Raman to detect cocaine to a cutoff value of 10 μg/mL, noting that moving further into the UV (200 nm) could increase analytical sensitivity further.[Citation92] Farquharson et al. used a spectral database of drugs to determine cocaine at 50 ng/mL in spiked saliva, being adjudged similar to structural analogue cocaethylene (ethylbenzoylecgonine), which exhibited a comparable “hit quality index” metric value.[Citation98]
3.2.3. Other stimulants
Many other stimulants have not currently been comprehensively studied by Raman in saliva, notably, 3,4-Methylenedioxymethamphetamine (MDMA), better known as ecstasy/molly. Cotinine, a metabolite of (legal) stimulant nicotine, has been detected to a LoD of 50 nM (8.8 ppb) by Yang et al. in a Raman-saliva investigation[Citation90] and may be easily related to the nicotine concentration[Citation90,Citation112] in the original sample. Occasionally, metabolites can prove advantageous where they provide prominent Raman peaks that are spectrally positioned where they are less obscured by the salivary background signature.[Citation87]
3.3. Morphine, heroin and other derivatives
Heroin (diamorphine) is a common and particularly damaging illicit drug derived from morphine, a product of the opium poppy. The Raman spectrum of heroin is comparatively sparse, yielding only a few distinct signature peaks ().[Citation98] This has not appeared, however, to impair unambiguous detection via comparison with compounds such as methamphetamine, 1-(1-phenylcyclohexyl) piperidine (PCP), 3,4-methylenedioxymethamphetamine (MDMA) or lysergic acid diethylamide (LSD),[Citation98] due to a prominent Raman peak around 600 cm-1. However, in a multi-drug SERS study, Kline et al. noted that detection sensitivity of morphine was often 1–2 orders of magnitude lower than that for methamphetamine and cocaine.[Citation91] Recently, Akçan et al. have investigated the performance of various silver and gold SERS nanoparticles on different surfaces for heroin detection by Raman spectroscopy in saliva, with the AuNPs on a polyaniline surface found to provide the best sensitivity.[Citation95]
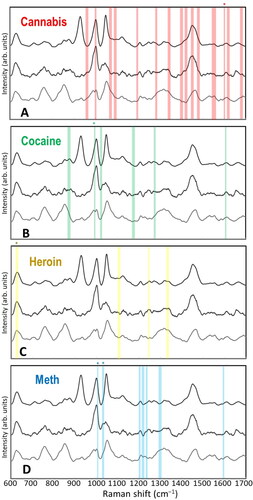
Figure 3. Raman bands analyzed in Raman-saliva studies for common illicit drugs. A. Cannabis, B. Cocaine, C. Heroin, D. Methamphetamine. Most prominent bands marked with *. Background is three saliva spectra for assessment of potential overlap with innate saliva Raman bands (Based on Ref. (Citation91)).
Other morphine derivatives such as oxycodone, codeine, and fentanyl, have been studied in[Citation80,Citation97,Citation98,Citation113] with the latter being well-known to often be mixed with heroin. Shende (2019) et al. noted no change in the spectrum of fentanyl in saliva medium from that mixed in phosphate-buffered saline (PBS), with only a signal intensity decrease of a factor of two (to LoD of 0.5 μg/mL). In the case of codeine however, peak shifts were observed and postulated to be due to the basic nature of saliva (pH ∼8.0) and consequently, the drug’s dissociated form.[Citation113] Farquharson et al. commented on the difficulty in oxycodone detection owing to its structural similarity with other prescription drugs. Using a goodness-of-fit algorithm and a narcotics spectral library, the authors achieved a successful oxycodone identification.[Citation98]
Li et al. used immunochromatographic assay (ICA) test strips in combination with functionalized AuNP SERS to detect morphine to 2.4 × 10⁻⁴ ng/ml outside the salivary medium. Repeatability was studied via multiple measurements with the relative standard deviations found to be 4–5%. Moreover, the selectivity of the assay was confirmed via peak ratio analysis testing against common medications as well as structurally similar compounds including, cocaine, codeine and 6-monoacetylmorphine. The assay proved to be ∼6× more selective for morphine than for other drugs. Initial investigations using spiked saliva have shown a recovery rate within 10% of the actual concentrations (including overestimations). An ICA test strip shelf life in airtight storage conditions of up to one year was determined.[Citation85]
3.4. Cannabis
Cannabis (i.e., marijuana, “weed”) is a popular illicit drug for recreational use, where tetrahydrocannabinol (THC) is the principal psychoactive constituent. In an initial Raman-saliva study, Sivashanmugan et al. noted no noticeable interference from the salivary biomolecules.[Citation86] However, in a subsequent publication, these authors reported a wavenumber shift in the prominent THC Raman band at 1600 cm-1 as well as a new peak at 1621 cm-1 owing to THC’s metabolic changes arising from the saliva medium.[Citation87] The rapid metabolization of THC has also been reported with a concentration decrease from 148 to 82.6 ng/L in saliva within 30 minutes of subject consumption.[Citation86] The researchers obtained a picomolar-range detection of THC and established that its detection in saliva can be used as an accurate indicator of cannabis use, potentially up to several days after the consumption.[Citation87]
A unique challenge with cannabinoids is that they are part of a trend involving the development of novel psychoactive substances (NPS), or “legal highs,” in the form of synthetic cannabinoids (SCBs). Further to the often-difficult legal aspects of policing such compounds, they can also confound conventional detection methods where the alterations to chemical form can reduce analytical selectivity and subsequently, impact the diagnostic accuracy metrics.[Citation96] Raman spectroscopy, with its highly selective nature, provides a technique to circumvent this by eschewing any recognition element and instead relying on the drug’s full spectral signature. For instance, Deriu et al. have recently discriminated between the SCBs: JWH-018, JWH-073, JWH-081 and JWH-122 in saliva using SERS. In detecting SCB JWH-018, the authors noted a LoD in oral fluid of 31 ng/mL (7.7 × 10⁻⁸ M), which approached the observed LoD outside the salivary medium at 0.8 ng/mL (2 × 10⁻⁹ M).[Citation96]
3.5. Illicit / abused drugs summary
It is difficult to predict molecular adsorption behavior a priori.[Citation114] Interestingly, many compounds appear to perform better with gold than silver, including diazepam (Valium) and 3,4-methylenedioxyamphetamine (MDMA). This has been proposed to be because of nitrogen-containing moieties, which have a considerably higher affinity to gold than silver, offsetting the markedly worse plasmonic performance.[Citation91] Some prominent compounds nevertheless are highly active on silver including for instance, the gamma-hydroxybutyric acid (GHB, date rape drug) and lysergic acid diethylamide (LSD).[Citation97] Complementary theoretical studies might be beneficial in such cases, however, may prove too cumbersome where a vast array of NPS and their metabolites are studied. Focused computational chemistry work confined to the subset of prominent (parent) compounds on gold surfaces, perhaps with common metabolites, may be worthwhile.[Citation96] Moreover, full consideration of plasmonic phenomena may be warranted, for example, in the Raman-saliva drugs study of,[Citation91] the authors discussed the likely radiative/non-radiative pathways for plasmonic dephasing and the effect of particle size on resonance wavelength. Such challenges although generic are important for optimization of SERS performance.[Citation91]
The impact of (small amounts of) salivary constituents, chiefly mucins,[Citation96] both as competitors for metal surface sites in SERS studies and as bodies that can “trap” analyte molecules, need to be carefully considered and may warrant additional pretreatment steps.[Citation96,Citation97] This includes methanol addition (well-known protein crash agent), acetic or sulfuric acid and heat or sonication combinations,[Citation106] or a solid phase extraction step.[Citation97,Citation110] It may be a more critical concern where the analyte molecules are relatively small. Optimization of such clean-up processes is vital to avoid unnecessary dilution of the oral fluid and concurrent reduction in analytical sensitivity.[Citation96] Arguably, studies do not frequently enough replicate and report on complex environments (and interactions) in which drug molecules may find themselves.[Citation87] Similarly, while multiple drugs are often present in studies, multiplexed detection mimicking real-world scenarios is lacking, and a multi-component analysis requires reevaluation of possible analytical sensitivities.[Citation105] Furthermore, the chemical assignment of the innate salivary constituents is under-discussed within the Raman-saliva literature for drugs.
Concerning the classification process, Farquharson et al. noted that their ‘method could be improved by using a library tailored to the patient population, such that it is not excessive in size, but includes only those drugs that could be reasonably expected in a sample.’ Also, it may be useful to not only make use of a spectral library of isolated, pure, illicit chemical compounds as in,[Citation98] but also one that includes modified spectra contingent on different surrounding media (e.g., the saliva matrix), use of SERS media, or longitudinally collected data e.g., where different metabolites may appear. More recently, Farquharson and colleagues have produced a spectral library of 39 common drugs analyzed with AuNPs at 785 nm excitation, including opioids, stimulants and sedatives, which are chiefly benzodiazepines. Important Raman peaks were identified and assigned.[Citation113] Where libraries are insufficient, compounds can be identified via more standard analytical techniques and the databases updated to ensure future classification accuracy.[Citation17] In many cases, analysis may require other chemometric approaches such as for instance, the commonly used PCA.[Citation80]
Although beyond the scope of the current review, it is worth noting that chemotherapy drugs (CDs) have also been studied by Farquharson et al..[Citation93,Citation115] Analogous to illicit/abused drug studies, Raman band spectral positional and relative band intensity changes were noted due to interaction of the CD with the (SERS) silver surface. The authors discussed the possibility of using metabolic data from Raman-saliva measurements to inform on optimal patient dose. Orientation effects and background signal from a working device were also examined. In contrast to the detection of larger biomolecules as biomarkers for disease, illicit drug detection often requires a roadside test that must be performed rapidly, ideally, like an alcohol breathalyzer test.[Citation97] Farquharson and Su et al. emphasized the speed (∼15 minutes or less) in a series of device-oriented publications.[Citation105,Citation110,Citation113,Citation115] Raman spectroscopy in itself is amenable to portable devices, and we discuss this in detail in Section 6.
Further study is required to illuminate any challenges that specific drug classes may face. There may not be a “one-size-fits-all” approach and more practical studies which examine multiple drugs simultaneously with a single device would be useful.[Citation91] While heroin, cannabis, and methamphetamine are known to be three of the most abused illicit compounds,[Citation98] the detailed investigation into the potential of Raman for other compounds in saliva is warranted for further study. The current review does not obviate a possible multimodal or multistep approach (as would typically be the case)[Citation81] and this may still be necessary for legal i.e., confirmatory reasons.[Citation82,Citation97] In the US, a 10–50 ppb (10–50 ng/mL) detection limit is required for most drugs.[Citation97,Citation110] As with other analytical fields, the focus is predominantly on the end-user[Citation116] and precise quantification with ultralow sensitivity may not always be necessary. In turn, this could allow research efforts to focus more on multiplexed detection of drug mixtures.[Citation17]
4. Forensic applications
Raman spectroscopy is further an excellent candidate technique for use in forensics and is recognized as an emerging analytical method in forensic sciences and analysis.[Citation117] Critically important within the forensic sciences is the ability to detect and identify traces of body fluids and thus, preserve any DNA that may be present at a crime scene. Many of the current techniques used to identify body fluids are highly destructive preventing further sample analysis and are only specific for a single biofluid. RS, however, allows for nondestructive measurements[Citation94] and can measure and discriminate between a range of biofluids such as blood, sweat, semen and saliva.[Citation118,Citation119] Developments in this field have been led by Lednev et al. with a recent review which focused solely on Raman spectroscopy applications in forensics.[Citation120,Citation121]
Applications of Raman-salivary studies have to date successfully demonstrated the ability to differentiate between genders and age[Citation122,Citation123] and between smokers and nonsmokers.[Citation124] Many of these studies are, however, preliminary in their nature yet, they do establish the ability of Raman as an analytical tool and the potential impact it can deliver in the forensic analysis, particularly where sample size is small, impure, or difficult to extract via alternative methods.
5. Dental/orthodontic applications
In most of the teeth-related dentistry literature, the use of Raman spectroscopy primarily focused on the acquisition and analysis of mineral-related content, for example, dentin[Citation125–129] and alloy,[Citation25,Citation130–133] where saliva was typically used as a passive medium and not the focus of any Raman measurements.[Citation125–156] From the initial 70 published papers which exploited Raman spectroscopy for dental application, 33 used artificial saliva while 21 used saliva collected from humans. Lee et al. however, used both human samples and artificial saliva in their study for cotinine detection.[Citation154] Other papers were either ambiguous or did not provide sufficient information as to what type of saliva was used and/or where it was sourced from. Papers by Daood et al. use artificial saliva in their work; however, there was limited information on its composition and specifications.[Citation126,Citation127] summarizes the details of the chemical compositions and specifications in these studies using artificial saliva.
Table 2. Composition of artificial saliva.
Despite the limited focus on saliva with Raman in dental applications, there were several studies that focused on saliva including for instance, Gonchukov et al., where spectral regions at 1033, 1155, 1525 and 1611 cm-1 were identified as potential biomarkers of periodontitis.[Citation166,Citation167] Furthermore, a review by Calado et al. highlighted Raman spectroscopy as a potential technique in future clinical applications for early detection of oral squamous cell carcinoma.[Citation168] Altuntas and Buyujserin investigated, artificial saliva with different candidate biomarkers for Alzheimer’s incorporating a SERS substrate for beta-amyloid detection in artificial saliva[Citation169] achieving a LoD of 0.5 pg/ml for Aβ.[Citation1–42] This review highlighted that Raman spectroscopy studies with human saliva samples for disease detection and diagnostics remain highly limited.
6. Portable devices, microfluidics and multimodal systems
6.1. Portable devices
There is a growing market interest in portable analytical devices. In a review into disease diagnostics and monitoring, Liu et al. identified the potential of portable devices and saliva for point-of-care (PoC) diagnostics.[Citation170] Romao et al. suggests three steps in the portable process: sample preparation, detection/readout, and interpretation. In sample preparation, the target analyte must be in “acceptable form,” concentration and purity, which may be accomplished by either external measures,[Citation171] as has been done in the context of a portable device in a food technology application,[Citation172] or as an integrated component onto the microfluidic chip. Each approach has its own merit in terms of cost and speed/ease of use. Romao et al. notes that full integration is likely in future portable devices, but complexity and size compromises are probable measures to reduce cost.[Citation171] We note most portable devices appearing in our Raman-saliva literature survey do not use optical fibers with Raman systems, but fiber-coupling may be useful in some cases and has been discussed by Pence.[Citation173]
Regarding analysis interpretation, a simple-to-understand user interface is key for an unambiguous result. This could be contrasted with colorimetric sensors where the test result may be somewhat subjective.[Citation81] Alternatively, wireless communication, including the use of cloud services, could be a better solution to get rapid expert opinion, perhaps even useful as a confirmation.[Citation171,Citation174] Transfer of sensitive health or potentially incriminating data, however, will also raise questions of security.[Citation171,Citation172]
Many current portable biosensing systems are electrochemically or SPR-based.[Citation171] Seitz comments that the real bottleneck for better cost-viability in biosensing systems is not photonic technologies but engineering limitations.[Citation175] Devices must remain low-cost, reliable, fast, sample-preparation-free and perhaps capable of multiplexed analysis.[Citation175] Analogously, Durucan et al. observed that a device performing enhanced Raman measurements must be automated and inexpensive and can provide results within minutes.[Citation176] Romao et al. differentiates between different kinds of PoC devices, firstly, benchtop systems, which are scaled-down versions of more bulky, less portable laboratory equipment, and that can maintain analytical sensitivity and selectivity/specificity but may still require trained operators, and secondly, lab-on-chip (LoC) devices, which are fast, hand-held systems that are largely automated and easy to use for non-specialists.[Citation171] SERS-based chemical detection systems may naturally lend themselves to miniaturization.[Citation81]
Recently Valpapuran et al. presented an integrated (prism-coupled) optical waveguide-SERS system for proposed application to biological substances, which they note may provide more flexibility in terms of the locations which are accessible by optical signals.[Citation10] In one notable study, Meyer et al. solve what is an optical problem in a combined SPR-SERS system by introducing additional lenses (including one in the back-focal plane; excitation phase only) to ensure not only unfocused, orthogonally impinging light at the SPR prism-analyte interface, but also that the backscattered SERS (from the same planar SPR interface) light cone is collected maximally.[Citation111]
Comprehensive details of device fabrication methods, as in Gale et al., are beyond the scope of this review, but we note, are important to keep in mind, for example, the nature of the chip-to-world connections or necessity of passivation steps in the interest of reusability.[Citation81,Citation177] Further, practical studies where bench-top, portable, and hand-held Raman devices are compared, analogous to McVey who reports an analytical study into coriander seeds in the context of NIR absorption spectroscopy.[Citation178] We observe the recent changes to medical device approval in the EU, which practically, mean more early-stage input from clinicians and a goal of increased patient safety.[Citation179]
6.2. Microfluidic Systems
In recent years microfluidics-based technologies have emerged and come to play an essential role in biomedical research. Microfluidic technologies can produce innovative yet practical research tools. Many conventional laboratory methods used in biological research have significant limitations, including expensive and time-consuming assays. Microfluidics, as a technology built for the manipulation of small fluid volumes, has the potential to miniaturize complex and bulky laboratory processes onto a small microchip. A variety of theoretical studies have illustrated the advantages of microfluidic-based lab-on-a-chip (LoC) systems over traditional laboratory tests.[Citation180] Advantages include high throughput with a fast turnaround time of results and consumption of small volumes of samples and reagents,[Citation80] and even integration of portable centrifuges that can easily accommodate the small volumes required.[Citation181] Chip-based enrichment then allows a complete integrated process from sampling to data read-out,[Citation79] as Matheson and coworkers have demonstrated in the identification of a single bacterium.[Citation79] One of the main aims in the microfluidics field is the creation of integrated and portable devices for bedside or roadside use thus, eliminating time-consuming laboratory procedures.[Citation182] Romao et al. claimed that patient demand for more rapid and decentralized care had driven projections for the PoC market to reach 31 billion USD by 2021,[Citation171] mirroring the market growth in hand-held Raman devices [SERS FD Summary Lecture]. Sharma et al. further identified the potential of PoC microfluidic devices in “low resource” settings where their portability, ease-of-use and low-cost might relieve the high burden of disease.[Citation183]
Advances in microfluidic technology have already made a tremendous impact on biological and medical science in areas including drug detection, diagnostics and EV isolation/detection.[Citation160,Citation184–187] More recently, microfluidic technologies have been combined with Raman spectroscopy to simultaneously monitor multiple sample analytes in a single microfluidic channel.[Citation188] Microfluidic Raman spectroscopy has been used thus far in a wide variety of biological and chemical applications, including reaction monitoring, fiber probes, LoC devices and tumor cell identification.[Citation185,Citation189,Citation190] Nevertheless, compared to other spectroscopic methods, microfluidic Raman spectroscopy applications remain limited. In many instances, the strong spectral background from the microfluidic substrate overwhelms the weak Raman signal and thus, requiring minimum background substrate interference, or alternatively, exploitation of SERS substrates for signal enhancement. For instance, Zhou et al. developed a SERS microfluidic platform to concentrate gold nanoparticles and create SERS hot spots at the bottom of a microchannel using nanorod arrays and a pneumatic valve for the detection of bovine serum albumin (BSA) at picomolar levels.[Citation26] This system was also capable of distinguishing cytochrome C from BSA in a mixture of proteins. Lin et al. designed a quick internet-connected SERS microfluidic device with both high sensitivity and selectivity for the detection of a single bacterium.[Citation191] A specific antibody-conjugated SERS tag was combined with a microfluidic dielectrophoretic (DEP) device depicted in .
Figure 4. Portable Raman microfluidic devices. Dielectrophoretic nanoparticle aggregation for on-demand SERS. (a) Schematic representation of DEP-SERS chip with a PDMS microchannel sandwiched between a glass cover and an electrode substrate with pipette tips forming fluidic reservoirs. (b) Illustration of the trap zones (c) Close-up view of a single trap zone. (d) SERS spectra obtained from the DEP-SERS. SERS microfluidic chip for the detection of drugs of abuse in saliva including: (e) Schematic representation of the microfluidic device indicating where the Ag-NP suspension, sample and salt are loaded on to the device and driven through the channel via a vacuum pump. (f) Visualization of the flow-focusing junction using a fluorescent dye. (g) Schematic of the complete reaction. Reprinted with permission from.[Citation81,Citation88]
![Figure 4. Portable Raman microfluidic devices. Dielectrophoretic nanoparticle aggregation for on-demand SERS. (a) Schematic representation of DEP-SERS chip with a PDMS microchannel sandwiched between a glass cover and an electrode substrate with pipette tips forming fluidic reservoirs. (b) Illustration of the trap zones (c) Close-up view of a single trap zone. (d) SERS spectra obtained from the DEP-SERS. SERS microfluidic chip for the detection of drugs of abuse in saliva including: (e) Schematic representation of the microfluidic device indicating where the Ag-NP suspension, sample and salt are loaded on to the device and driven through the channel via a vacuum pump. (f) Visualization of the flow-focusing junction using a fluorescent dye. (g) Schematic of the complete reaction. Reprinted with permission from.[Citation81,Citation88]](/cms/asset/0172169b-0c78-48ae-b2e5-166a7b02e477/laps_a_2130351_f0004_c.jpg)
6.3. Microfluidics, Raman and saliva overview
There has been emerging use for microfluidic Raman in saliva samples, most notably within the field of pharmacology. Andreou et al. described the use of SERS combined with microfluidics to detect drugs of abuse in saliva ().[Citation88] The laminar flow in the device controlled the interactions between silver NPs, salt and the analyte to detect methamphetamine. The analyte diffused into a side stream containing silver NPs whereby the introduction of salt induced aggregation of the silver NPs resulting in the creation of species with a strong SERS signal. The analyte was then separated from the mixture via diffusion in the device. Similarly, Inscore et al., in an 80 illicit drug study, used a fiber optic-coupled portable Raman system with gold and silver nanoparticle sol-gel in capillary tubes for SERS analysis, noting that this set-up could be incorporated into an LoC design. The authors further reported that the addition of an adjacent solid-phase extraction (SPE) capillary can increase the analytical sensitivity by a factor of two for cocaine.[Citation97] In addition, Lawanstiend et al. synthesized nanoporous silver microstructures (np-AgMSs) in a microfluidic system to determine levels of thiocyanate in human saliva.[Citation192] These were used as efficient SERS substrates, where “multipod” np-AgMSs structures provided the highest SERS signal. The authors were pioneers in synthesizing complex mesoporous substrates in contrast to the commonly used spherical SERS colloids.
In a methamphetamine study, Salemmiliani et al. filtered saliva samples through a 0.2 μm-diameter syringe to remove large cells and other particles in order not to clog their microfluidic channels.[Citation81] This whilst preferable to dilution to maintain sensitivity, may come at the cost of sample damage should the process be too aggressive. The authors demonstrated reusability of the Raman-saliva microfluidic system by increasing the electrode AC potential five-fold and injection flowrate four-fold in the cleaning phase.[Citation81] This procedure minimized the silver NP fouling effects and analyte retention, which has been previously recognized as a challenge in microfluidic systems.[Citation56,Citation88,Citation193] Another approach to minimize fouling and thus, any kind of memory effect in the sensor, is a two-phase continuous flow, known as “droplet microfluidics”.[Citation56,Citation194,Citation195] The 1600 cm-1 methamphetamine SERS peak intensity over the dielectrophoretic trap region was shown to decrease by only 10–15% over three clearance cycles.[Citation81] Alternatively, Dies et al. used a microelectrode array, which aggregated plasmonic NPs for SERS saliva analysis, reporting reusability of up to 30 cycles via a simple soap cleaning step.[Citation80] This may be a more straightforward alternative to electrically or magnetically induced aggregation[Citation90] for SERS and easier to incorporate into a microfluidic set-up. On the other hand, consumable options, such as paper-based SERS substrates,[Citation196] which offer no reusability yet are inexpensive, may be preferable if reliably high performance is required.[Citation197]
6.4. Modeling
Multiphysics numerical modeling of microfluidic systems in saliva would be useful, yet it is often overlooked in the literature. Typically, in microfluidic SERS systems there are several concurrent phenomena, namely, the (plasmon-polariton derived) local electric fields around the SERS nanostructures (largely responsible for the SERS effect), thermal effects around said structures as well as possible structure deformations, which in turn will affect the plasmon-polariton modes supported. The interplay of these effects has been noted in a plasmonics context.[Citation198] In addition, supporting numerical analysis of the fluid dynamics may be critically important to optimize the SERS response, especially if the saliva sample is highly viscous as may be the case in ill subjects who overproduce mucins.[Citation199] This ensures that the analyte solution, saliva or otherwise, achieves maximal coverage of the SERS nanostructures, and proximity to the highest local electric fields, during the analyte-fluid injection and measurement phase.
Using a fixed, planar SERS substrate may facilitate faster acquisition of the Raman signal. Wu et al. has shown that a mixture of aqueous analyte and plasmonic nanoparticles must traverse a definite distance before the SERS signal is maximized i.e., nanoparticles and analyte matrix are sufficiently intermixed.[Citation56] Similar conclusions could be found elsewhere.[Citation88,Citation193] Therefore, it is worth reiterating that the fluid dynamics in SERS substrates might require careful modeling. An arrangement that promotes chaotic advection may be beneficial inducing mixing between input solutions.[Citation56] Wu et al. also noted that a continuous flow regime is beneficial for more homogeneous mixing. In this study, the microfluidic channel yielded an RSD of 6.13% (before saliva measurement) while measurements on a comparator metal substrate (n = 16) produced an RSD of 20.2%.[Citation56] Alongside requisite analytical sensitivity and selectivity, multiplexed sensing may be especially important in healthcare where many biomarkers are not exclusive[Citation200] and their simultaneous detection is facilitated in microfluidic set-ups.
6.5. Multi-modal systems and complementary techniques
The deployment of various analytical techniques in combination with Raman spectroscopy may be essential for the accurate and sensitive determination of the required substance when a complex bio-mixture like saliva is being analyzed.[Citation101] Of course, this will need to be balanced against increased cost, time and engineering difficulties.[Citation173] Ultimately, the degree of compromise will depend on the needs of the end-user.[Citation116]
Zhang et al. discussed combining Raman with different techniques, including “chemical approaches” such as chromatography, colorimetry and molecular imprinting (or other affinity molecule-based approaches).[Citation160] It is not clear however, how translatable some of these combinations of techniques might be for incorporation into a portable device for salivary analysis, both practically and economically.[Citation129,Citation160,Citation193] McLaughlin noted that in the field of forensics, a shift toward a “one step confirmatory method that is rapid, portable and nondestructive” would be desirable, while Matheson et al. emphasized the importance of automation from measurement to results in the whole Raman chain.[Citation79,Citation201] Current methods, while providing high analytical sensitivity and selectivity, often require time-consuming laboratory facilities[Citation80] in addition to a multi-tier analysis such as, ELISA followed by a liquid/gas chromatography or mass spectrometry step which further protracts the process.[Citation80]
Zhang et al. detailed combining other spectroscopic techniques with SERS, such as IR absorption, mass spectrometry, X-ray photon spectrometry (XPS) or the lesser-spotted nuclear magnetic resonance spectroscopy (NMR).[Citation187] Other correlative characterization methods exist including, Raman and scanning electron microscopy (SEM) or AFM.[Citation202,Citation203] AFM and SEM are non-optical techniques providing topographical information but with respective benefits on the depth of field, contrast on flatter surfaces as well as medium of operation. Many SEMs also incorporate an energy-dispersive X-ray spectroscopy (EDX) detector for chemical composition analysis. For instance, Paluszkiewicz used EDX to corroborate Raman and IR measurements in a study on the effect of immersing dental cement in artificial saliva showing the formation of phosphates at the cement surface.[Citation138] Furthermore, Raman/SERS and scanning near-field optical microscopy (SNOM) can be performed to provide information on the local electric fields around nanostructures to evaluate SERS performance. However, the bulky experimental apparatus required for many of the above precludes the portable use. Further techniques could provide useful complementary information while are also portable, including optical coherence tomography, which can permit faster Raman acquisition times.[Citation79]
A broad range of analytical techniques are now available to scientists, clinicians, and law enforcement. Raman analysis of saliva samples offers ease of use combined with rapid analysis and portable solutions, thereby complementing existing techniques used in routine testing within both the clinical and forensic settings. For example, in the context of traumatic brain injury (TBI), Dadas et al. noted that ‘the complexity of TBI has led to an equally intricate field of diagnostic and prognostic tools’, explicitly mentioning electroencephalographic recordings.[Citation9] In healthcare applications and the biomedical fields, it may be that a combination of Raman spectroscopy with subsequent histopathological analysis to discern chemical abnormalities associated with early-stage anatomical foci would prove useful.[Citation9] Recently, Popp et al. demonstrated that the combined use of Raman spectroscopy with more conventional biomarker identification methods can significantly increase diagnostic accuracies.[Citation156]
7. Conclusions
Raman spectroscopy and saliva present a promising combination for translation to real-world use. In this review, we have surveyed Raman-saliva applications in healthcare, illicit and abused drugs identification, law enforcement forensics and dental/orthodontic uses. Emphasis has also been on the extracellular vesicles offering an exciting offshoot with the possibility of accurate disease diagnostic applications via Raman spectroscopy from within saliva. Challenges in these areas and those associated with specific biomolecules or smaller compounds have been discussed. In the context of healthcare applications, the non-specificity of biomarkers has been highlighted as a particular challenge highlighting the need for interdisciplinary collaborative research to further advance this field. This echoes the views of Poste et al. who has pointed out that, ‘Biomarker discovery should be a component of large research networks, involving industry and experts in molecular biology, genetics, analytical chemistry, computation, engineering, clinical trial design, epidemiology, statistics, regulation and health-care economics’.[Citation16]
In the context of Illicit drug detection, different classes of compounds have been highlighted to present distinct challenges in terms of pre-processing steps and suitability for SERS analysis. The further specific need of this field for rapid, portable devices, which have been discussed also in the context of Raman and saliva, could further incorporate the emerging area of microfluidics with the integrated use of Raman-saliva. This is concluded to not necessarily preclude the use of additional techniques, which may act as complimentary and confirmatory tools for diagnostics.
In summary, Raman, SERS and their miniaturization and integration with portable detection systems are converging areas and combined with an easily accessible biofluid such as saliva, which can convey rich physiological and pharmacological information, lay the platform for an impactful emerging field and a breadth of applications.
Supplemental Material
Download MS Word (1 MB)Acknowledgments
MH is grateful for Prof. Marek Procházka, Faculty of Mathematics and Physics, Charles University in Prague, for a copy of his book Surface-Enhanced Raman Spectroscopy: Bioanalytical, Biomolecular and Medical Applications, which stimulated an interest in bio-SERS studies.
Disclosure statement
The authors declare no conflict of interest.
Data availability statement
All data used in meta-analyses are available in Table S1 in Supporting Information.
Additional information
Funding
References
- Hardy, M.; Kelleher, L.; de Carvalho Gomes, P.; Buchan, E.; Chu, H. O. M.; Goldberg Oppenheimer, P. Methods in Raman Spectroscopy for Saliva Studies—A Review. Appl. Spectrosc. Rev. 2022, 57, 177–233. doi:10.1080/05704928.2021.1969944
- Bombara, D.; Williams, C.; Borg, S.; Kim, H. J. Automated Real-Time Spectral Characterization of Phase-Change Tunable Optical Filters Using a Linear Variable Filter and Infrared Camera. 2021. http://arxiv.org/abs/2102.11028.
- Yan, H.; Bangxing, H.; Seisler, H. W. Handheld near-Infrared Spectrometers: Reality and Empty Promises. Spectrscopy 2020, 35, 15–18.
- Vardaki, M. Z.; Georg Schulze, H.; Serrano, K.; Blades, M. W.; Devine, D. V.; Turner, R. F. B. Assessing the Quality of Stored Red Blood Cells Using Handheld Spatially Offset Raman Spectroscopy with Multisource Correlation Analysis. Spectrochim. Acta - Part A Mol. Biomol. Spectrosc. 2022, 276.
- Coic, L.; Sacré, P.-Y.; Dispas, A.; Dumont, E.; Horne, J.; De Bleye, C.; Fillet, M.; Hubert, P.; Ziemons, E. Evaluation of the Analytical Performances of Two Raman Handheld Spectrophotometers for Pharmaceutical Solid Dosage Form Quantitation. Talanta 2020, 214, 120888. doi:10.1016/j.talanta.2020.120888
- Ataka, K.; Heberle, J. Biochemical Applications of Surface-Enhanced Infrared Absorption Spectroscopy. Anal. Bioanal. Chem. 2007, 388, 47–54. doi:10.1007/s00216-006-1071-4
- Le Ru, E. C.; Blackie, E.; Meyer, M.; Etchegoin, P. G. Surface Enhanced Raman Scattering Enhancement Factors: A Comprehensive Study. J. Phys. Chem. C 2007, 111, 13794–13803. doi:10.1021/jp0687908
- Blackie, E. J.; Le Ru, E. C.; Etchegoin, P. G. Single-Molecule Surface-Enhanced Raman Spectroscopy of Nonresonant Molecules. J. Am. Chem. Soc. 2009, 131, 14466–14472. doi:10.1021/ja905319w
- Dadas, A.; Washington, J.; Diaz-Arrastia, R.; Janigro, D. Biomarkers in Traumatic Brain Injury (TBI): A Review. Neuropsychiatr. Dis. Treat. 2018, 14, 2989–3000. doi:10.2147/NDT.S125620
- Valpapuram, I.; Candeloro, P.; Coluccio, M.; Parrotta, E.; Giugni, A.; Das, G.; Cuda, G.; Di Fabrizio, E.; Perozziello, G. Waveguiding and SERS Simplified Raman Spectroscopy on Biological Samples. Biosensors-Basel 2019, 9, 37. doi:10.3390/bios9010037
- Hagner, M.; Wang, J.; Benzaquen, S. Comparing Endobronchial-Ultrasound Guided Miniforceps Biopsy to Needle Aspiration for Diagnostic Yield and Molecular Testing at a Single Biopsy Site. Chest 2019, 156, A923. doi:10.1016/j.chest.2019.08.864
- Kah, J. C. Y.; Kho, K. W.; Lee, C. G. L.; James, C.; Sheppard, R.; Shen, Z. X.; Soo, K. C.; Olivo, M. C. Early Diagnosis of Oral Cancer Based on the Surface Plasmon Resonance of Gold Nanoparticles. Int. J. Nanomedicine. 2007, 2, 785–798.
- Pastare, D.; Bennour, M. R.; Polunosika, E.; Karelis, G. Biomarkers of Multiple Sclerosis. TOIJ. 2019, 9, 1–13. doi:10.2174/1874226201909010001
- USFDA. BEST: Biomarkers, EndpointS and Other Tools. 2019.
- WHO. World Health Organization & International Programme on Chemical Safety. Biomarkers and risk assessment : concepts and principles / published under the joint sponsorship of the United Nations environment Programme, the International Labour Organisation, an [Internet]. 1993. Available from: https://apps.who.int/iris/handle/10665/39037.
- Poste, G. Bring on the Biomarkers. Nature 2011, 469, 156–157. doi:10.1038/469156a
- Jones, L. E.; Stewart, A.; Peters, K. L.; McNaul, M.; Speers, S. J.; Fletcher, N. C.; Bell, S. E. J. Infrared and Raman Screening of Seized Novel Psychoactive Substances: A Large Scale Study of >200 Samples. Analyst 2016, 141, 902–909. doi:10.1039/c5an02326b
- Ransohoff, D. F.; Gourlay, M. L. Sources of Bias in Specimens for Research about Molecular Markers for Cancer. J. Clin. Oncol. 2010, 28, 698–704. doi:10.1200/JCO.2009.25.6065
- Sung, H.; Ferlay, J.; Siegel, R. L.; Laversanne, M.; Soerjomataram, I.; Jemal, A.; Bray, F. Global Cancer Statistics 2020: GLOBOCAN Estimates of Incidence and Mortality Worldwide for 36 Cancers in 185 Countries. CA. A Cancer J. Clin. 2021, 71, 209–249. doi:10.3322/caac.21660
- Githaiga, J. I.; Angeyo, H. K.; Kaduki, K. A.; Bulimo, W. D.; Ojuka, D. K. Quantitative Raman Spectroscopy of Breast Cancer Malignancy Utilizing Higher-Order Principal Components: A Preliminary Study. Sci. African 2021, 14.
- Wu, W.; Gong, H.; Liu, M.; Chen, G.; Chen, R. Noninvasive Breast Tumors Detection Based on Saliva Protein Surface Enhanced Raman Spectroscopy and Regularized Multinomial Regression. In Proceedings - 2015 8th International Conference on BioMedical Engineering and Informatics, BMEI 2015. 2016. p. 214–218.
- Feng, S.; Huang, S.; Lin, D.; Chen, G.; Xu, Y.; Li, Y.; Huang, Z.; Pan, J.; Chen, R.; Zeng, H. Surface-Enhanced Raman Spectroscopy of Saliva Proteins for the Noninvasive Differentiation of Benign and Malignant Breast Tumors. Int. J. Nanomedicine. 2015, 10, 537–547. doi:10.2147/IJN.S71811
- Hernández-Arteaga, A.; de Jesús Zermeño Nava, J.; Kolosovas-Machuca, E. S.; Velázquez-Salazar, J. J.; Vinogradova, E.; José-Yacamán, M.; Navarro-Contreras, H. R. Diagnosis of Breast Cancer by Analysis of Sialic Acid Concentrations in Human Saliva by Surface-Enhanced Raman Spectroscopy of Silver Nanoparticles. Nano. Res. 2017, 10, 3662–3670. doi:10.1007/s12274-017-1576-5
- American Cancer Society. Cancer Statistics. 2021. https://www.cancer.org.
- Wang, Y.; Hua, L.; Wang, Y.; Cui, Z.; Chen, A.; Zhang, Y. A New Method for the Early Detection of the Lung Cancer by the Saliva Tests Using Surface-Enhanced Raman Spectroscopy. In International Symposium on Signal Processing Biomedical Engineering, and Informatics (Spbei 2013). 2014. p. 866–873.
- Li, X.; Yang, T.; Ding, J. Surface Enhanced Raman Spectroscopy (SERS) of Saliva for the Diagnosis of Lung Cancer. Guang Pu Xue Yu Guang Pu Fen Xi 2012, 32, 391–393.
- Qian, K.; Wang, Y.; Hua, L.; Chen, A.; Zhang, Y. New Method of Lung Cancer Detection by Saliva Test Using Surface-Enhanced Raman Spectroscopy. Thorac. Cancer. 2018, 9, 1556–1561. http://doi.org/10.1111/1759-7714.12837.
- Chow, L. Q. M. Head and Neck Cancer. N Engl. J. Med. 2020, 382, 60–72. http://doi.org/10.1056/NEJMra1715715.
- Son, E.; Panwar, A.; Mosher, C. H.; Lydiatt, D. Cancers of the Major Salivary Gland. J. Oncol. Pract. 2018, 14, 99–108. doi:10.1200/JOP.2017.026856
- Fălămaș, A.; Rotaru, H.; Hedeșiu, M. Surface-Enhanced Raman Spectroscopy (SERS) Investigations of Saliva for Oral Cancer Diagnosis. Lasers Med. Sci. 2020, 35, 1393–1401. doi:10.1007/s10103-020-02988-2
- Zapata, F.; Gregório, I.; García-Ruiz, C. Body Fluids and Spectroscopic Techniques in Forensics: A Perfect Match? J. Forensic Med. 2015, 1, 1000101.
- Ram, S.; Siar, C. H. Chemiluminescence as a Diagnostic Aid in the Detection of Oral Cancer and Potentially Malignant Epithelial Lesions. Int. J. Oral Maxillofac. Surg. 2005, 34, 521–527. doi:10.1016/j.ijom.2004.10.008
- Hu, S.; Loo, J. A.; Wong, D. T. Human Saliva Proteome Analysis. Ann. N. Y. Acad. Sci. 2007, 1098, 323–329. doi:10.1196/annals.1384.015
- Wang, S.; Qin, Y.; Zou, Z. Determination of Liver Cancer Biomarkers by Surface-Enhanced Raman Scattering Using Gold-Silica Nanoparticles. Anal. Lett. 2016, 49, 1209–1220. doi:10.1080/00032719.2015.1098656
- Connolly, J. M.; Davies, K.; Kazakeviciute, A.; Wheatley, A. M.; Dockery, P.; Keogh, I.; Olivo, M. Non-Invasive and Label-Free Detection of Oral Squamous Cell Carcinoma Using Saliva Surface-Enhanced Raman Spectroscopy and Multivariate Analysis. Nanomedicine 2016, 12, 1593–1601. http://dx.doi.org/10.1016/j.nano.2016.02.021.
- Rekha, P.; Aruna, P.; Brindha, E.; Koteeswaran, D.; Baludavid, M.; Ganesan, S. Near-Infrared Raman Spectroscopic Characterization of Salivary Metabolites in the Discrimination of Normal from Oral Premalignant and Malignant Conditions. J. Raman Spectrosc. 2016, 47, 763–772. doi:10.1002/jrs.4897
- Jaychandran, S.; PK, M.; Ganesan, S. Raman Spectroscopic Analysis of Blood, Urine, Saliva and Tissue of Oral Potentially Malignant Disorders and Malignancy-A Diagnostic Study. Int. J. Oral Craniofacial Sci. 2016, 11–14.
- Su, S.-F.; Han, F.; Zhao, C.; Chen, C.-Y.; Xiao, W.-W.; Li, J.-X.; Lu, T.-X. Long-Term Outcomes of Early-Stage Nasopharyngeal Carcinoma Patients Treated with Intensity-Modulated Radiotherapy Alone. Int. J. Radiat. Oncol. Biol. Phys. 2012, 82, 327–333. doi:10.1016/j.ijrobp.2010.09.011
- Ma, J.; Mai, H. Q.; Hong, M. H.; Min, H. Q.; Mao, Z. D.; Cui, N. J.; Lu, T. X.; Mo, H. Y. Results of a Prospective Randomized Trial Comparing Neoadjuvant Chemotherapy plus Radiotherapy with Radiotherapy Alone in Patients with Locoregionally Advanced Nasopharyngeal Carcinoma. J. Clin. Oncol. 2001, 19, 1350–1357. doi:10.1200/JCO.2001.19.5.1350
- Lin, X.; Lin, D.; Ge, X.; Qiu, S.; Feng, S.; Chen, R. Noninvasive Detection of Nasopharyngeal Carcinoma Based on Saliva Proteins Using Surface-Enhanced Raman Spectroscopy. J. Biomed. Opt. 2017, 22, 1–6. doi:10.1117/1.JBO.22.10.105004
- Feng, S.; Lin, D.; Lin, J.; Huang, Z.; Chen, G.; Li, Y.; et al. Saliva Analysis Combining Membrane Protein Purification with Surface-Enhanced Raman Spectroscopy for Nasopharyngeal Cancer Detection. Appl. Phys. Lett. 2014, 104.
- Qiu, S.; Xu, Y.; Huang, L.; Zheng, W.; Huang, C.; Huang, S.; Lin, J.; Lin, D.; Feng, S.; Chen, R.; et al. Non-Invasive Detection of Nasopharyngeal Carcinoma Using Saliva Surface-Enhanced Raman Spectroscopy. Oncol. Lett. 2016, 11, 884–890. doi:10.3892/ol.2015.3969
- Aslam, M. A.; Due, C.; Liu, M.; Wang, K.; Cui, D. Classification and Prediction of Gastric Cancer from Saliva Diagnosis Using Artificial Neural Network. Eng. Lett. 2021, 29.
- Zhang, Y.; Wang, Z.; Jiang, T.; Wang, Y. Biomimetic Regulation of Dentine Remineralization by Amino Acid in Vitro. Dent. Mater. 2019, 35, 298–309. doi:10.1016/j.dental.2018.11.026
- Maitra, I.; Morais, C. L. M.; Lima, K. M. G.; Ashton, K. M.; Date, R. S.; Martin, F. L. Raman Spectral Discrimination in Human Liquid Biopsies of Oesophageal Transformation to Adenocarcinoma. J. Biophotonics. 2020, 13, e201960132–e201960132. doi:10.1002/jbio.201960132
- Cottat, M.; D’Andrea, C.; Yasukuni, R.; Malashikhina, N.; Grinyte, R.; Lidgi-Guigui, N.; Fazio, B.; Sutton, A.; Oudar, O.; Charnaux, N.; et al. High Sensitivity, High Selectivity SERS Detection of MnSOD Using Optical Nanoantennas Functionalized with Aptamers. J. Phys. Chem. C 2015, 119, 15532–15540. doi:10.1021/acs.jpcc.5b03681
- Zermeño-Nava, J. d J.; Martínez-Martínez, M. U.; Rámirez-de-Ávila, A. L.; Hernández-Arteaga, A. C.; García-Valdivieso, M. G.; Hernández-Cedillo, A.; José-Yacamán, M.; Navarro-Contreras, H. R. Determination of sialic acid in Saliva by Means of Surface-Enhanced Raman Spectroscopy as a Marker in Adnexal Mass Patients: Ovarian Cancer vs Benign Cases. J. Ovarian Res. 2018, 11, 61. doi:10.1186/s13048-018-0433-9
- Cao, G.; Chen, M.; Chen, Y.; Huang, Z.; Lin, J.; Lin, J.; Xu, Z.; Wu, S.; Huang, W.; Weng, G.; et al. A Potential Method for Non-Invasive Acute Myocardial Infarction Detection Based on Saliva Raman Spectroscopy and Multivariate Analysis. Laser Phys. Lett. 2015, 12, 125702. doi:http://dx.doi.org/10.1088/1612-2011/12/12/125702
- Moisoiu, V.; Badarinza, M.; Stefancu, A.; Iancu, S. D.; Serban, O.; Leopold, N.; et al. Combining Surface-Enhanced Raman Scattering (SERS) of Saliva and Two-Dimensional Shear Wave Elastography (2D-SWE) of the Parotid Glands in the Diagnosis of Sjogren’s Syndrome. Spectrochim ACTA PART A-MOLECULAR Biomol. Spectrosc. 2020, 235.
- Stefancu, A.; Badarinza, M.; Moisoiu, V.; Iancu, S. D.; Serban, O.; Leopold, N.; Fodor, D. SERS-Based Liquid Biopsy of Saliva and Serum from Patients with Sjogren’s Syndrome. Anal. Bioanal. Chem. 2019, 411, 5877–5883. doi:10.1007/s00216-019-01969-x
- Eom, G.; Hwang, A.; Kim, H.; Yang, S.; Lee, D. K.; Song, S.; Ha, K.; Jeong, J.; Jung, J.; Lim, E.-K.; et al. Diagnosis of Tamiflu-Resistant Influenza Virus in Human Nasal Fluid and Saliva Using Surface-Enhanced Raman Scattering. ACS Sens. 2019, 4, 2282–2287. doi:10.1021/acssensors.9b00697
- Ember, K.; Daoust, F.; Mahfoud, M.; Dallaire, F.; Ahmad, E. Z.; Tran, T.; et al. Saliva-Based Detection of COVID-19 Infection in a Real-World Setting Using Reagent-Free Raman Spectroscopy and Machine Learning. J. Biomed. Opt 2022, 27,
- Carlomagno, C.; Banfi, P. I.; Gualerzi, A.; Picciolini, S.; Volpato, E.; Meloni, M.; Lax, A.; Colombo, E.; Ticozzi, N.; Verde, F.; et al. Human Salivary Raman Fingerprint as Biomarker for the Diagnosis of Amyotrophic Lateral Sclerosis. Sci. Rep. 2020, 10, doi:10.1038/s41598-020-67138-8
- Ralbovsky, N. M.; Halámková, L.; Wall, K.; Anderson-Hanley, C.; Lednev, I. K. Screening for Alzheimer’s Disease Using Saliva: A New Approach Based on Machine Learning and Raman Hyperspectroscopy. J. Alzheimers. Dis. 2019, 71, 1351–1359. doi:10.3233/JAD-190675
- Zamora-Mendoza, B. N.; Espinosa-Tanguma, R.; Ramírez-Elías, M. G.; Cabrera-Alonso, R.; Montero-Moran, G.; Portales-Pérez, D.; Rosales-Romo, J. A.; Gonzalez, J. F.; Gonzalez, C. Surface-Enhanced Raman Spectroscopy: A Non Invasive Alternative Procedure for Early Detection in Childhood Asthma Biomarkers in Saliva. Photodiagnosis Photodyn. Ther. 2019, 27, 85–91. 10.1016/j.pdpdt.2019.05.009.
- Wu, L.; Wang, Z.; Zong, S.; Cui, Y. Rapid and Reproducible Analysis of Thiocyanate in Real Human Serum and Saliva Using a Droplet SERS-Microfluidic Chip. Biosens. Bioelectron. 2014, 62, 13–18. http://dx.doi.org/10.1016/j.bios.2014.06.026.
- Žukovskaja, O.; Jahn, I. J.; Weber, K.; Cialla-May, D.; Popp, J. Detection of Pseudomonas aeruginosa Metabolite Pyocyanin in Water and Saliva by Employing the SERS Technique. Sensors (Switzerland) 2017, 17, 1704. doi:10.3390/s17081704
- Yáñez-Mó, M.; Siljander, P. R.-M.; Andreu, Z.; Bedina Zavec, A.; Borràs, F. E.; Buzas, E. I.; Buzas, K.; Casal, E.; Cappello, F.; Carvalho, J.; et al. Biological Properties of Extracellular Vesicles and Their Physiological Functions. Journal of Extracellular Vesicles 2015, 4, 27066–27060. doi:10.3402/jev.v4.27066
- Borges, F. T.; Melo, S. A.; Özdemir, B. C.; Kato, N.; Revuelta, I.; Miller, C. A.; Gattone, V. H.; LeBleu, V. S.; Kalluri, R. TGF-β1-Containing Exosomes from Injured Epithelial Cells Activate Fibroblasts to Initiate Tissue Regenerative Responses and Fibrosis. J. Am. Soc. Nephrol. 2013, 24, 385–392. doi:10.1681/ASN.2012101031
- Gámez-Valero, A.; Lozano-Ramos, S. I.; Bancu, I.; Lauzurica-Valdemoros, R.; Borràs, F. E. Urinary Extracellular Vesicles as Source of Biomarkers in Kidney Diseases. Front. Immunol. 2015, 6, 6. doi:10.3389/fimmu.2015.00006
- Taylor, D. D.; Gercel-Taylor, C. MicroRNA Signatures of Tumor-Derived Exosomes as Diagnostic Biomarkers of Ovarian Cancer. Gynecol. Oncol. 2008, 110, 13–21. doi:10.1016/j.ygyno.2008.04.033
- Thompson, Martin MW. Extracellular vesicles in neurodegenerative disease-pathogenesis to biomarkers. 2016.
- Alzahrani, F. A.; Saadeldin, I. M.; Ahmad, A.; Kumar, D.; Azhar, E. I.; Siddiqui, A. J.; Kurdi, B.; Sajini, A.; Alrefaei, A. F.; Jahan, S.; et al. The Potential Use of Mesenchymal Stem Cells and Their Derived Exosomes as Immunomodulatory Agents for COVID-19 Patients. Stem. Cells Int. 2020, 2020, 1–11. doi:10.1155/2020/8835986
- Caruso, S.; Poon, I. K. H. Apoptotic Cell-Derived Extracellular Vesicles: More than Just Debris. Front. Immunol. 2018, 9, doi:10.3389/fimmu.2018.01486
- van Niel, G.; D'Angelo, G.; Raposo, G. Shedding Light on the Cell Biology of Extracellular Vesicles. Nat. Rev. Mol. Cell Biol. 2018, 19, 213–228. doi:10.1038/nrm.2017.125
- Hu, G.; Drescher, K. M.; Chen, X. M. Exosomal miRNAs: Biological Properties and Therapeutic Potential. Front. Genet. 2012, 3,
- Gonda, D. D.; Akers, J. C.; Kim, R.; Kalkanis, S. N.; Hochberg, F. H.; Chen, C. C.; Carter, B. S. Neuro-Oncologic Applications of Exosomes, Microvesicles, and Other Nano-Sized Extracellular Particles. Neurosurgery 2013, 72, 501–510. doi:10.1227/NEU.0b013e3182846e63
- Shao, H.; Im, H.; Castro, C. M.; Breakefield, X.; Weissleder, R.; Lee, H. New Technologies for Analysis of Extracellular Vesicles. Chem. Rev. 2018, 118, 1917–1950. doi:10.1021/acs.chemrev.7b00534
- Witwer, K. W.; Buzás, E. I.; Bemis, L. T.; Bora, A.; Lässer, C.; Lötvall, J. Standardization of Sample Collection, Isolation and Analysis Methods in Extracellular Vesicle Research. J. Extracell. Vesicles 2013, 2.
- Vlassov, A. V.; Magdaleno, S.; Setterquist, R.; Conrad, R. Exosomes: Current Knowledge of Their Composition, Biological Functions, and Diagnostic and Therapeutic Potentials. Biochim. Biophys. Acta. 2012, 1820, 940–948. doi:10.1016/j.bbagen.2012.03.017
- Müller, G. Novel Tools for the Study of Cell Type-Specific Exosomes and Microvesicles. J. Bioanal. Biomed. 2012, 4, 46–60.
- Yoshioka, Y.; Kosaka, N.; Konishi, Y.; Ohta, H.; Okamoto, H.; Sonoda, H.; Nonaka, R.; Yamamoto, H.; Ishii, H.; Mori, M.; et al. Ultra-Sensitive Liquid Biopsy of Circulating Extracellular Vesicles Using ExoScreen. Nat. Commun. 2014, 5, 3591. doi:10.1038/ncomms4591
- Zhao, Z.; Yang, Y.; Zeng, Y.; He, M. A Microfluidic ExoSearch Chip for Multiplexed Exosome Detection towards Blood-Based Ovarian Cancer Diagnosis. Lab. Chip. 2016, 16, 489–496. doi:10.1039/c5lc01117e
- Maiolo, D.; Paolini, L.; Di Noto, G.; Zendrini, A.; Berti, D.; Bergese, P.; Ricotta, D. Colorimetric Nanoplasmonic Assay to Determine Purity and Titrate Extracellular Vesicles. Anal. Chem. 2015, 87, 4168–4176. doi:10.1021/ac504861d
- Gualerzi, A.; Kooijmans, S. A. A.; Niada, S.; Picciolini, S.; Brini, A. T.; Camussi, G.; et al. Raman Spectroscopy as a Quick Tool to Assess Purity of Extracellular Vesicle Preparations and Predict Their Functionality. J. Extracell. Vesicles 2019, 8.
- Kwizera, E. A.; O'Connor, R.; Vinduska, V.; Williams, M.; Butch, E. R.; Snyder, S. E.; Chen, X.; Huang, X. Molecular Detection and Analysis of Exosomes Using Surface-Enhanced Raman Scattering Gold Nanorods and a Miniaturized Device. Theranostics 2018, 8, 2722–2738. doi:10.7150/thno.21358
- Deckert-Gaudig, T.; Taguchi, A.; Kawata, S.; Deckert, V. Tip-Enhanced Raman Spectroscopy-from Early Developments to Recent Advances. Chem. Soc. Rev. 2017, 46, 4077–4110. doi:10.1039/c7cs00209b
- Mahapatra, S.; Li, L.; Schultz, J. F.; Jiang, N. Tip-Enhanced Raman Spectroscopy: Chemical Analysis with Nanoscale to Angstrom Scale Resolution. J. Chem. Phys. 2020, 153, 10902.
- Matheson, E. J.; Hamilton, S. M.; Kyser, K. Shallow Groundwater Salinization of the Niagara Peninsula, Ontario, Canada. GEEA. 2018, 18, 155–174. doi:10.1144/geochem2017-072
- Dies, H.; Raveendran, J.; Escobedo, C.; Docoslis, A. Rapid Identification and Quantification of Illicit Drugs on Nanodendritic Surface-Enhanced Raman Scattering Substrates. Sensors Actuators B Chem. 2018, 257, 382–388. doi:http://dx.doi.org/10.1016/j.snb.2017.10.181
- Salemmilani, R.; Piorek, B. D.; Mirsafavi, R. Y.; Fountain, A. W.; III Moskovits, M.; Meinhart, C. D. Dielectrophoretic Nanoparticle Aggregation for on-Demand Surface Enhanced Raman Spectroscopy Analysis. Anal. Chem. 2018, 90, 7930–7936. doi:10.1021/acs.analchem.8b00510
- Barnett, N.; Rathmell, C. Detecting Drugs in Saliva. Opt. Photonik 2015, 10, 31–34. doi:10.1002/opph.201500040
- Hodges, C. M.; Hendra, P. J.; Willis, H. A.; Farley, T. Fourier Transform Raman Spectroscopy of Illicit Drugs. J. Raman Spectrosc. 1989, 20, 745–749. doi:10.1002/jrs.1250201108
- Ryder, A. G.; O’Connor, G. M.; Glynn, T. J. Identifications and Quantitative Measurements of Narcotics in Solid Mixtures Using near-IR Raman Spectroscopy and Multivariate Analysis. J. Forensic Sci. 1999, 44, 1013–1019.
- Li, W.; Li, X.; Yang, T.; Guo, X.; Song, Y. Detection of Saliva Morphine Using Surface-Enhanced Raman Spectroscopy Combined with Immunochromatographic Assay. J. Raman Spectrosc. 2020, 51, 642–648. doi:10.1002/jrs.5822
- Sivashanmugan, K.; Zhao, Y.; Wang, A. X. Tetrahydrocannabinol Sensing in Complex Biofluid with Portable Raman Spectrometer Using Diatomaceous SERS Substrates. Biosensors 2019, 9, 125–111. doi:10.3390/bios9040125
- Sivashanmugan, K.; Squire, K.; Tan, A.; Zhao, Y.; Kraai, J. A.; Rorrer, G. L.; Wang, A. X. Trace Detection of Tetrahydrocannabinol in Body Fluid via Surface-Enhanced Raman Scattering and Principal Component Analysis. ACS Sens. 2019, 4, 1109–1117. doi:10.1021/acssensors.9b00476
- Andreou, C.; Hoonejani, M. R.; Barmi, M. R.; Moskovits, M.; Meinhart, C. D. Rapid Detection of Drugs of Abuse in Saliva Using Surface Enhanced Raman Spectroscopy and Microfluidics. ACS Nano. 2013, 7, 7157–7164. doi:10.1021/nn402563f
- Qu, D.; Wang, Y.; Chen, A.; Zheng, W.; Liu, J.; Jiao, Y.; et al. New Method for Screening Drug Addicts Based on Surface-Enhanced Raman Spectroscopy Technology. IEEE 4th Int. Conf. Bioinforma. Biomed. Eng. 2010, 1–3.
- Yang, T.; Guo, X.; Wang, H.; Fu, S.; Wen, Y.; Yang, H. Magnetically Optimized SERS Assay for Rapid Detection of Trace Drug-Related Biomarkers in Saliva and Fingerprints. Biosens. Bioelectron. 2015, 68, 350–357. doi:10.1016/j.bios.2015.01.021
- Kline, N. D.; Tripathi, A.; Mirsafavi, R.; Pardoe, I.; Moskovits, M.; Meinhart, C.; Guicheteau, J. A.; Christesen, S. D.; Fountain, A. W. Optimization of Surface-Enhanced Raman Spectroscopy Conditions for Implementation into a Microfluidic Device for Drug Detection. Anal. Chem. 2016, 88, 10513–10522. doi:10.1021/acs.analchem.6b02573
- D'Elia, V.; Montalvo, G.; Ruiz, C. G.; Ermolenkov, V. V.; Ahmed, Y.; Lednev, I. K. Ultraviolet Resonance Raman Spectroscopy for the Detection of Cocaine in Oral Fluid. Spectrochim. Acta. A Mol. Biomol. Spectrosc. 2018, 188, 338–340. doi:10.1016/j.saa.2017.07.010
- Farquharson, S.; Shende, C.; Inscore, F. E.; Maksymiuk, P.; Gift, A. Analysis of 5-Fluorouracil in Saliva Using Surface-Enhanced Raman Spectroscopy. J. Raman Spectrosc. 2005, 36, 208–212. doi:10.1002/jrs.1277
- Vandenabeele, P.; Edwards, H. G. M.; Jehlička, J. The Role of Mobile Instrumentation in Novel Applications of Raman Spectroscopy: Archaeometry, Geosciences, and Forensics. Chem. Soc. Rev. 2014, 43, 2628–2649. doi:10.1039/c3cs60263j
- Akçan, R.; Yildirim, M. Ş.; Ilhan, H.; Güven, B.; Tamer, U.; Sağlam, N. Surface Enhanced Raman Spectroscopy as a Novel Tool for Rapid Quantification of Heroin and Metabolites in Saliva. Turk. J. Med. Sci. 2020, 50, 1470–1479. doi:10.3906/sag-1912-196
- Deriu, C.; Conticello, I.; Mebel, A. M.; McCord, B. Micro Solid Phase Extraction Surface-Enhanced Raman Spectroscopy (mu-SPE/SERS) Screening Test for the Detection of the Synthetic Cannabinoid JWH-018 in Oral Fluid. Anal. Chem. 2019, 91, 4780–4789. doi:10.1021/acs.analchem.9b00335
- Inscore, F.; Shende, C.; Sengupta, A.; Huang, H.; Farquharson, S. Detection of Drugs of Abuse in Saliva by Surface-Enhanced Raman Spectroscopy (SERS). Appl. Spectrosc. 2011, 65, 1004–1008. doi:10.1366/11-06310
- Farquharson, S.; Shende, C.; Sengupta, A.; Huang, H.; Inscore, F. Rapid Detection and Identification of Overdose Drugs in Saliva by Surface-Enhanced Raman Scattering Using Fused Gold Colloids. Pharmaceutics 2011, 3, 425–439. doi:10.3390/pharmaceutics3030425
- Ye, Z.; Li, C.; Xu, Y.; Bell, S. E. J. Exploiting the Chemical Differences between Ag and Au Colloids Allows Dramatically Improved SERS Detection of “Non-Adsorbing” Molecules. Analyst 2019, 144, 448–453. doi:10.1039/c8an01927d
- Baia, M.; Astilean, S.; Iliescu, T. Raman and SERS Investigations of Pharmaceuticals. Heidelberg: Springer; 2008.
- Goodacre, R. The Blind Men and the Elephant: Challenges in the Analysis of Complex Natural Mixtures. Faraday Discuss. 2019, 218, 524–539. doi:10.1039/c9fd00074g
- Sulk, R. A.; Corcoran, R. C.; Carron, K. T. Surface-Enhanced Raman Scattering Detection of Amphetamine and Methamphetamine by Modi® Cation with 2-Mercaptonicotinic Acid. Appl. Spectrosc. 1999, 53, 954–959. doi:10.1366/0003702991947603
- Xu, L. J.; Zong, C.; Zheng, X. S.; Hu, P.; Feng, J. M.; Ren, B. Label-Free Detection of Native Proteins by Surface-Enhanced Raman Spectroscopy Using Iodide-Modified Nanoparticles. Anal. Chem. 2014, 86, 2238–2245. doi:10.1021/ac403974n
- Hong, Y.; Zhou, X.; Xu, B.; Huang, Y.; He, W.; Wang, S.; Wang, C.; Zhou, G.; Chen, Y.; Gong, T. Optoplasmonic Hybrid Materials for Trace Detection of Methamphetamine in Biological Fluids through SERS. ACS Appl. Mater. Interfaces 2020, 12, 24192–24200. doi:10.1021/acsami.0c00853
- Su, M.; Jiang, Y.; Yu, F.; Yu, T.; Du, S.; Xu, Y.; Yang, L.; Liu, H. Mirrorlike Plasmonic Capsules for Online Microfluidic Raman Analysis of Drug in Human Saliva and Urine. ACS Appl. Bio. Mater. 2019, 2, 3828–3835. doi:10.1021/acsabm.9b00425
- Shende, C.; Huang, H.; Farquharson, S. 2014 Detection of Illicit Drugs in Impaired Driver Saliva by a Field-Usable SERS Analyzer. In Smart Biomedical and Physiological Sensor Technology Xi, Cullum, BM and McLamore, ES (Eds.). (Proceedings of SPIE; vol. 9107). doi:10.1117/12.2054284
- Scheidweiler, K. B.; Kolbrich Spargo, E. A.; Kelly, T. L.; Cone, E. J.; Barnes, A. J.; Huestis, M. A. Pharmacokinetics of Cocaine and Metabolites in Human Oral Fluid and Correlation with Plasma Concentrations after Controlled Administration. Ther. Drug Monit. 2010, 32, 628–637. doi:10.1097/FTD.0b013e3181f2b729
- Dams, R.; Choo, R. E.; Lambert, W. E.; Jones, H.; Huestis, M. A. Oral Fluid as an Alternative Matrix to Monitor Opiate and Cocaine Use in Substance-Abuse Treatment Patients. 2007.
- Schramm, W.; Craig, P. A.; Smith, R. H.; Berger, G. E. Cocaine and Benzoylecgonine in Saliva, Serum, and Urine. Clin. Chem. 1993, 39, 481–487.
- Dana, K.; Shende, C.; Huang, H.; Farquharson, S. Rapid Analysis of Cocaine in Saliva by Surface-Enhanced Raman Spectroscopy. J. Anal. Bioanal. Tech. 2015, 6, 1–5. doi:10.4172/2155-9872.1000289
- Meyer, S. A.; Le Ru, E. C.; Etchegoin, P. G. Combining Surface Plasmon Resonance (SPR) Spectroscopy with Surface-Enhanced Raman Scattering (SERS). Anal. Chem. 2011, 83, 2337–2344. doi:10.1021/ac103273r
- Leggett, R.; Lee-Smith, E. E.; Jickells, S. M.; Russell, D. A. “Intelligent” Fingerprinting: Simultaneous Identification of Drug Metabolites and Individuals by Using Antibody-Functionalized Nanoparticles. Angew. Chem. Int. Ed. Engl. 2007, 46, 4100–4103. doi:10.1002/anie.200700217
- Shende, C.; Farquharson, A.; Brouillette, C.; Smith, W.; Farquharson, S. Quantitative Measurements of Codeine and Fentanyl on a Surface-Enhanced Raman-Active Pad. Molecules 2019, 24, 2578. doi:10.3390/molecules24142578
- Tripathi, S.; Tabor, R. F. Modeling Two-Rate Adsorption Kinetics: Two-Site, Two-Species, Bilayer and Rearrangement Adsorption Processes. J. Colloid Interface Sci. 2016, 476, 119–131. doi:10.1016/j.jcis.2016.05.007
- Farquharson, S.; Gift, A.; Shende, C.; Inscore, F.; Ordway, B.; Farquharson, C.; Murren, J. Surface-Enhanced Raman Spectral Measurements of 5-Fluorouracil in Saliva. Molecules 2008, 13, 2608–2627. doi:10.3390/molecules13102608
- Aitchison, H.; Aizpurua, J.; Arnolds, H.; Baumberg, J.; Bell, S.; Bonifacio, A.; Chikkaraddy, R.; Dawson, P.; de Nijs, B.; Deckert, V.; et al. Analytical SERS: general Discussion. Faraday Discuss. 2017, 205, 561–600. doi:10.1039/c7fd90096a
- Zapata, F.; Fernández De La Ossa, Á.; García-Ruiz, C. Emerging Spectrometric Techniques for the Forensic Analysis of Body Fluids. Trends Anal. Chem. 2015, 64, 53–63. doi:http://dx.doi.org/10.1016/j.trac.2014.08.011
- Sikirzhytski, V.; Virkler, K.; Lednev, I. K. Discriminant Analysis of Raman Spectra for Body Fluid Identification for Forensic Purposes. Sensors (Basel) 2010, 10, 2869–2884. doi:10.3390/s100402869
- Muro, C. K.; de Souza Fernandes, L.; Lednev, I. K. Sex Determination Based on Raman Spectroscopy of Saliva Traces for Forensic Purposes. Anal. Chem. 2016, 88, 12489–12493. https://pubs.acs.org/sharingguidelines. doi:10.1021/acs.analchem.6b03988
- Virkler, K.; Lednev, I. K. Analysis of Body Fluids for Forensic Purposes: From Laboratory Testing to Non-Destructive Rapid Confirmatory Identification at a Crime Scene. Forensic Sci. Int. 2009, 188, 1–17. doi:10.1016/j.forsciint.2009.02.013
- Amin, M. O.; Al-Hetlani, E.; Lednev, I. K. Trends in Vibrational Spectroscopy of Fingermarks for Forensic Purposes. TrAC 2021, 143.
- Muro, C. K.; Doty, K. C.; Fernandes, L. d S.; Lednev, I. K. Forensic Body Fluid Identification and Differentiation by Raman Spectroscopy. FORENSIC Chem. 2016, 1, 31–38. doi:10.1016/j.forc.2016.06.003
- Buchan, E.; Kelleher, L.; Clancy, M.; Stanley Rickard, J. J.; Oppenheimer, P. G. Spectroscopic Molecular-Fingerprint Profiling of Saliva. Anal. Chim. Acta. 2021, 1185.
- Al-Hetlani, E.; Halámková, L.; Amin, M. O.; Lednev, I. K. Differentiating Smokers and Nonsmokers Based on Raman Spectroscopy of Oral Fluid and Advanced Statistics for Forensic Applications. J. Biophotonics. 2020, 13, e201960123–e201960123. doi:10.1002/jbio.201960123
- Seredin, P. V.; Goloshchapov, D. L.; Prutskij, T.; Ippolitov, Y. A. A Simultaneous Analysis of Microregions of Carious Dentin by the Methods of Laser-Induced Fluorescence and Raman Spectromicroscopy. Opt. Spectrosc. 2018, 125, 803–809. doi:10.1134/S0030400X18110267
- Daood, U.; Tsoi, J. K. H.; Neelakantan, P.; Matinlinna, J. P.; Omar, H. A. K.; Al-Nabulsi, M.; Fawzy, A. S. In Vitro Assessment of Ribose Modified Two-Step-Etch-and-Rinse Dentine Adhesive. Dent. Mater. 2018, 34, 1175–1187. doi:10.1016/j.dental.2018.05.005
- Daood, U.; Matinlinna, J. P.; Fawzy, A. S. Synergistic Effects of VE-TPGS and Riboflavin in Crosslinking of Dentine. Dent. Mater. 2019, 35, 356–367. doi:10.1016/j.dental.2018.11.031
- Seredin, P.; Goloshchapov, D.; Ippolitov, Y.; Vongsvivut, J. Spectroscopic Signature of the Pathological Processes of Carious Dentine Based on FTIR Investigations of the Oral Biological Fluids. Biomed. Opt. Express. 2019, 10, 4050–4058. https://www.osapublishing.org/viewmedia.cfm?uri=boe-10-8-4050&seq=0&html=true. doi:10.1364/BOE.10.004050
- Zhang, A.; Chang, J.; Chen, Y.; Huang, Z.; Alfranca, G.; Zhang, Q.; Cui, D. Spontaneous Implantation of Gold Nanoparticles on Graphene Oxide for Salivary SERS Sensing. Anal. Methods 2019, 11, 5089–5097. doi:10.1039/C9AY01500K
- Trolic, I. M.; Todoric, Z.; Acev, D. P.; Makreski, P.; Pejova, B.; Spalj, S. Effects of the Presence of Probiotic Bacteria in the Aging Medium on the Surface Roughness and Chemical Composition of Two Dental Alloys. Microsc. Res. Tech. 2019, 82, 1384–1391. doi:10.1002/jemt.23290
- Calderon Moreno, J. M.; Popa, M.; Ivanescu, S.; Vasilescu, C.; Drob, S. I.; Neacsu, E. I.; Popa, M. V. Microstructure, Mechanical Properties, and Corrosion Resistance of Ti-20Zr Alloy in Undoped and NaF Doped Artificial Saliva. Met. Mater. Int. 2014, 20, 177–187. doi:10.1007/s12540-013-6031-x
- Hussein, M. A.; Yilbas, B.; Kumar, A. M.; Drew, R.; Al-Aqeeli, N. Influence of Laser Nitriding on the Surface and Corrosion Properties of Ti-20Nb-13Zr Alloy in Artificial Saliva for Dental Applications. J. Materi. Eng. Perform. 2018, 27, 4655–4664. doi:10.1007/s11665-018-3569-2
- Ameer, M. A.; Khamis, E.; Al-Motlaq, M. Electrochemical Behaviour of Recasting Ni-Cr and Co-Cr Non-Precious Dental Alloys. Corros. Sci. 2004, 46, 2825–2836. doi:10.1016/j.corsci.2004.03.011
- Xiao, Y.; Karttunen, M.; Jalkanen, J.; Mussi, M. C. M.; Liao, Y.; Grohe, B.; Lagugné-Labarthet, F.; Siqueira, W. L. Hydroxyapatite Growth Inhibition Effect of Pellicle Statherin Peptides. J. Dent. Res. 2015, 94, 1106–1112. doi:10.1177/0022034515586769
- Zheng, P.; Li, M.; Jurevic, R.; Cushing, S. K.; Liu, Y.; Wu, N. A Gold Nanohole Array Based Surface-Enhanced Raman Scattering Biosensor for Detection of Silver(I) and Mercury(II) in Human Saliva. Nanoscale 2015, 7, 11005–11012. doi:10.1039/c5nr02142a
- Silva Soares, L. E.; Silva Soares, A. L.; De Oliveira, R.; Nahorny, S. The Effects of Acid Erosion and Remineralization on Enamel and Three Different Dental Materials: FT-Raman Spectroscopy and Scanning Electron Microscopy Analysis. Microsc. Res. Tech. 2016, 79, 646–656. doi:10.1002/jemt.22679
- Condò, R.; Cerroni, L.; Pasquantonio, G.; Mancini, M.; Pecora, A.; Convertino, A.; Mussi, V.; Rinaldi, A.; Maiolo, L. A Deep Morphological Characterization and Comparison of Different Dental Restorative Materials. Biomed Res. Int. 2017, 2017, 7346317. doi:10.1155/2017/7346317
- Paluszkiewicz, C.; Kwiatek, W. M.; Długoń, E.; Wesełucha-Birczyńska, A.; Piccinini, M. Surface Study of Selected Biomaterials Using Vibrational Spectroscopy. Acta Phys. Pol. A 2009, 115, 533–536. doi:10.12693/APhysPolA.115.533
- Ubaldini, A. L. M.; Pascotto, R. C.; Sato, F.; Soares, V. O.; Zanotto, E. D.; Baesso, M. L. Effects of Bioactive Agents on Dentin Mineralization Kinetics after Dentin Bleaching. Oper. Dent. 2020, 45, 286–296. doi:10.2341/18-272-L
- Urban, V. M.; Machado, A. L.; Vergani, C. E.; Giampaolo, E. T.; Pavarina, A. C.; de Almeida, F. G.; Cass, Q. B. Effect of Water-Bath Post-Polymerization on the Mechanical Properties, Degree of Conversion, and Leaching of Residual Compounds of Hard Chairside Reline Resins. Dent. Mater. 2009, 25, 662–671. doi:10.1016/j.dental.2008.10.017
- Galvão, R. A.; Santa-Cruz, L. A. d.; Barreto, P. B.; Horta, M. K. d S.; Andrade, A. M. H. d.; Moura, F. J.; Aguilar, M. S.; Peripolli, S. B.; Campos, J. B. d.; Arruda, I. R. d S.; Machado, G. Electrochemical Single-Step Obtention and Characterization of a Biomimetic TiO2-HA NTs Covered by Chitosan. J. Mater. Res. 2019, 34, 1868–1878. doi:10.1557/jmr.2019.23
- Foscaldo, T.; dos Santos, G. B.; Miragaya, L. M.; Garcia, M.; Hass, V.; da Silva, E. M. Effect of HEMA Phosphate as an Alternative to Phosphoric Acid for Dentin Treatment Prior to Hybridization with Etch-and-Rinse Adhesive Systems. J. Adhes. Dent. 2016, 18, 425–434.
- Hu, S.; Gao, Y.; Wu, Y.; Guo, X.; Ying, Y.; Wen, Y.; Yang, H. Raman Tracking the Activity of Urease in Saliva for Healthcare. Biosens. Bioelectron. 2019, 129, 24–28. 10.1016/j.bios.2018.12.059.
- Sa, Y.; Chen, D.; Liu, Y.; Wen, W.; Xu, M.; Jiang, T.; Wang, Y. Effects of Two in-Office Bleaching Agents with Different pH Values on Enamel Surface Structure and Color: An In Situ vs. In Vitro Study. J. Dent. 2012, 40, e26–34–e34. doi:10.1016/j.jdent.2012.02.010
- Breschi, L.; Maravic, T.; Comba, A.; Cunha, S. R.; Loguercio, A. D.; Reis, A.; Hass, V.; Cadenaro, M.; Mancuso, E.; Mayer-Santos, E.; et al. Chlorhexidine Preserves the Hybrid Layer in Vitro after 10-Years Aging. Dent. Mater. 2020, 36, 672–680. doi:10.1016/j.dental.2020.03.009
- Marangoni-Lopes, L.; Rovai-Pavan, G.; Steiner-Oliveira, C.; Nobre-Dos-Santos, M. Radiotherapy Reduces Microhardness and Mineral and Organic Composition, and Changes the Morphology of Primary Teeth: An in Vitro Study. Caries. Res. 2019, 53, 296–304. https://pubmed.ncbi.nlm.nih.gov/30317232/. doi:10.1159/000493099
- Seredin, P. V.; Goloshchapov, D. L.; Ippolitov, Y. A.; Vongsvivut, J. (P.). A Spectroscopic Study of Changes in the Secondary Structure of Proteins of Biological Fluids of the Oral Cavity by Synchrotron Infrared Microscopy. Opt. Spectrosc. 2019, 127, 1002–1010. doi:10.1134/S0030400X19120221
- Bonon, A. J.; Weck, M.; Bonfante, E. A.; Coelho, P. G. Physicochemical Characterization of Three Fiber-Reinforced Epoxide-Based Composites for Dental Applications. Mater. Sci. Eng. C Mater. Biol. Appl. 2016, 69, 905–913. doi:10.1016/j.msec.2016.07.002
- Jinlong, L.; Tongxiang, L. Improved Corrosion Resistance of 316L Stainless Steel by Nanocrystalline and Electrochemical Nitridation in Artificial Saliva Solution. Appl. Surf. Sci. 2015, 359, 158–165.
- Tsuda, H.; Arends, J. Raman-Spectra of Human Dental Calculus. J. Dent. Res. 1993, 72, 1609–1613. doi:10.1177/00220345930720121401
- Wachesk, C. C.; Trava-Airoldi, V. J.; Da-Silva, N. S.; Lobo, A. O.; Marciano, F. R. The Influence of Titanium Dioxide on Diamond-Like Carbon Biocompatibility for Dental Applications. J. Nanomater. 2016, 2016, 1–7. doi:10.1155/2016/8194516
- Braga, S. R. M.; de Faria, D. a.; de Oliveira, E.; Sobral, M. A. P. Morphological and Mineral Analysis of Dental Enamel after Erosive Challenge in Gastric Juice and Orange Juice. Microsc. Res. Tech. 2011, 74, 1083–1087. https://pubmed.ncbi.nlm.nih.gov/21538693/. doi:10.1002/jemt.20998
- Braga, S. R. M.; de Oliveira, E.; Sobral, M. A. P. Effect of Neodymium:yttrium-Aluminum-Garnet Laser and Fluoride on the Acid Demineralization of Enamel. J. Investig. Clin. Dent. 2017, 8. https://pubmed.ncbi.nlm.nih.gov/26283312/.
- Lee, J.-S.; Jeong, D.-W.; Tae Byun, Y. Porphyrin Nanofiber/Single-Walled Carbon Nanotube Nanocomposite-Based Sensors for Monitoring Hydrogen Peroxide Vapor. Sensors Actuators B Chem. 2020, 306, 127518. doi:10.1016/j.snb.2019.127518
- Iijima, M.; Hashimoto, M.; Kohda, N.; Nakagaki, S.; Muguruma, T.; Endo, K.; Mizoguchi, I. Crystal Growth on Bioactive Glass Sputter-Coated Alumina in Artificial Saliva. Dent. Mater. J. 2013, 32, 775–780. doi:10.4012/dmj.2013-120
- Popp, J.; Mäyerhöfer, Wille, G.; Schmidt, U.; Hollricher, O.; Strom, A. R. Recent Developments in Detection for Microfluidic Systems. Anal. Chem. 2021, 4(1):A923–A923.
- Zaharia, A.; Plescan, V. G.; Anghel, E. M.; Musat, V. Human Dentine Remineralization under Non-Colagen Materials Action. Rev. Chim. 2017, 68, 928–932. doi:10.37358/RC.17.5.5583
- Zaharia, A.; Muşat, V.; Anghel, E. M.; Atkinson, I.; Mocioiu, O.-C.; Buşilă, M.; Pleşcan, V. G. Biomimetic Chitosan-Hydroxyapatite Hybrid Biocoatings for Enamel Remineralization. Ceram. Int. 2017, 43, 11390–11402. doi:10.1016/j.ceramint.2017.05.346
- Zhou, H.; Pandya, J. K.; Tan, Y.; Liu, J.; Peng, S.; Muriel Mundo, J. L.; et al. Role of Mucin in Behavior of Food-Grade TiO2 Nanoparticles under Simulated Oral Conditions. J. Agric. Food Chem. 2019. doi:https://doi.org/10.1021/acs.jafc.9b01732
- Zhang, Y.; Zhao, S.; Zheng, J.; He, L. Surface-Enhanced Raman Spectroscopy (SERS) Combined Techniques for High-Performance Detection and Characterization. Trends Anal Chem [Internet]. 2017, 90, 1–13. doi:http://dx.doi.org/10.1016/j.trac.2017.02.006
- Zhang, X.; Geng, H.; Gong, L.; Zhang, Q.; Li, H.; Zhang, X.; Wang, Y.; Gao, P. Modification of the Surface of Titanium with Multifunctional Chimeric Peptides to Prevent Biofilm Formation via Inhibition of Initial Colonizers. Int. J. Nanomedicine. 2018, 13, 5361–5375. doi:10.2147/IJN.S170819
- Hua, F.; Yan, J.; Zhao, S.; Yang, H.; He, H. In Vitro Remineralization of Enamel White Spot Lesions with a Carrier-Based Amorphous Calcium Phosphate Delivery System. Clin. Oral Investig. 2020, 24, 2079–2089. doi:10.1007/s00784-019-03073-x
- Silveira, J.; Coutinho, S.; Marques, D.; Castro, J.; Mata, A.; Carvalho, M. L.; Pessanha, S. Raman Spectroscopy Analysis of Dental Enamel Treated with Whitening Product – Influence of Saliva in the Remineralization. Spectrochim. Acta. A Mol. Biomol. Spectrosc. 2018, 198, 145–149. doi:10.1016/j.saa.2018.03.007
- Osorio, R.; Toledano-Osorio, M.; Osorio, E.; Aguilera, F. S.; Padilla-Mondéjar, S.; Toledano, M. Zinc and Silica Are Active Components to Efficiently Treat in Vitro Simulated Eroded Dentin. Clin. Oral Investig. 2018, 22, 2859–2870. doi:10.1007/s00784-018-2372-7
- Li, Y.; Wang, K.; He, P.; Huang, B. X.; Kovacs, P. Surface‐Enhanced Raman Spectroelectrochemical Studies of Corrosion Films on Implant Co–Cr–Mo Alloy in Biosimulating Solutions. J. Raman Spectrosc. 1999, 30, 97–103. doi:10.1002/(SICI)1097-4555(199902)30:2<97::AID-JRS352>3.0.CO;2-X
- Gonchukov, S.; Sukhinina, A.; Bakhmutov, D.; Minaeva, S. Raman Spectroscopy of Saliva as a Perspective Method for Periodontitis Diagnostics. Laser Phys. Lett. 2012, 9, 73–77. doi:10.1002/lapl.201110095
- Gonchukov, S.; Sukhinina, A.; Bakhmutov, D.; Biryukova, T.; Tsvetkov, M.; Bagratashvily, V. Periodontitis Diagnostics Using Resonance Raman Spectroscopy on Saliva. Laser Phys. Lett. 2013, 10, 75610. doi:10.1088/1612-2011/10/7/075610
- Calado, G.; Behl, I.; Daniel, A.; Byrne, H. J.; Lyng, F. M. Raman Spectroscopic Analysis of Saliva for the Diagnosis of Oral Cancer: A Systematic Review. Transl. Biophotonics 2019, 1, 12185.
- Altuntas, S.; Buyukserin, F. Fabrication of thioflavin-T-Modified Nanopillared SERS Substrates for Ultrasensitive Beta-Amyloid Peptide Detection. J. Raman Spectrosc. 2018, 49, 1247–1256. doi:http://doi.org/10.1002/jrs.5376
- Liu, J.; Duan, Y. Saliva: A Potential Media for Disease Diagnostics and Monitoring. Oral Oncol. 2012, 48, 569–577. http://dx.doi.org/10.1016/j.oraloncology.2012.01.021.
- Romao, V. C.; Martins, S. A. M.; Germano, J.; Cardoso, F. A.; Cardoso, S.; Freitas, P. P. Lab-on-Chip Devices: Gaining Ground Losing Size. ACS Nano. 2017, 11, 10659–10664. doi:10.1021/acsnano.7b06703
- Lin, H.-Y.; Huang, C.-H.; Park, J.; Pathania, D.; Castro, C. M.; Fasano, A.; Weissleder, R.; Lee, H. Integrated Magneto-Chemical Sensor for on-Site Food Allergen Detection. ACS Nano 2017, 11, 10062–10069. doi:10.1021/acsnano.7b04318
- Pence, I.; Mahadevan-Jansen, A. Clinical Instrumentation and Applications of Raman Spectroscopy. Chem. Soc. Rev. 2016, 45, 1958–1979. doi:10.1039/c5cs00581g
- Germano, J.; Martins, V. C.; Cardoso, F. A.; Almeida, T. M.; Sousa, L.; Freitas, P. P.; Piedade, M. S. A Portable and Autonomous Magnetic Detection Platform for Biosensing. Sensors (Basel) 2009, 9, 4119–4137. doi:10.3390/s90604119
- Seitz, P. Photonics – Accelerating highly sensitive disease detection. Photonics for Medical Diagnostics Conference. 2020. Available from: https://ktn-uk.org/events/photonics-for-medical-diagnostics/.
- Durucan, O.; Wu, K.; Viehrig, M.; Rindzevicius, T.; Boisen, A. Nanopillar-Assisted SERS Chromatography. ACS Sens. 2018, 3, 2492–2498. doi:10.1021/acssensors.8b00887
- Gale, B.; Jafek, A.; Lambert, C.; Goenner, B.; Moghimifam, H.; Nze, U.; Kamarapu, S. A Review of Current Methods in Microfluidic Device Fabrication and Future Commercialization Prospects. Inventions 2018, 3, 60. doi:10.3390/inventions3030060
- McVey, C.; Gordon, U.; Haughey, S. A.; Elliott, C. T. Assessment of the Analytical Performance of Three near-Infrared Spectroscopy Instruments (Benchtop, Handheld and Portable) through the Investigation of Coriander Seed Authenticity. Foods 2021, 10, 956. doi:10.3390/foods10050956
- Ben-Menahem, S. M.; Nistor-Gallo, R.; Macia, G.; von Krogh, G.; Goldhahn, J. How the New European Regulation on Medical Devices Will Affect Innovation. Nat. Biomed. Eng. 2020, 4, 585–590. doi:10.1038/s41551-020-0541-x
- Jahn, I. J.; Žukovskaja, O.; Zheng, X.-S.; Weber, K.; Bocklitz, T. W.; Cialla-May, D.; Popp, J. Surface-Enhanced Raman Spectroscopy and Microfluidic Platforms: Challenges, Solutions and Potential Applications. Analyst 2017, 142, 1022–1047. doi:10.1039/c7an00118e
- Zhang, L.; Resasco, D. E. Single-Walled Carbon Nanotube Pillars: A Superhydrophobic Surface. Langmuir 2009, 25, 4792–4798. doi:10.1021/la8040264
- Mogensen, K. B.; Klank, H.; Kutter, J. P. Recent Developments in Detection for Microfluidic Systems. Electrophoresis 2004, 25, 3498–3512. doi:10.1002/elps.200406108
- Sharma, B.; Ma, K.; Glucksberg, M. R.; Van Duyne, R. P. Seeing through Bone with Surface-Enhanced Spatially Offset Raman Spectroscopy. J. Am. Chem. Soc. 2013, 135, 17290–17293. doi:10.1021/ja409378f
- El-Zahry, M. R.; Refaat, I. H.; Mohamed, H. A.; Lendl, B. Sequential SERS Determination of Aspirin and Vitamin C Using in Situ Laser-Induced Photochemical Silver Substrate Synthesis in a Moving Flow Cell. Anal. Bioanal. Chem. 2016, 408, 4733–4741. doi:10.1007/s00216-016-9562-4
- Dochow, S.; Krafft, C.; Neugebauer, U.; Bocklitz, T.; Henkel, T.; Mayer, G.; Albert, J.; Popp, J. Tumour cell identification by Means of Raman Spectroscopy in Combination with Optical Traps and Microfluidic Environments. Lab. Chip. 2011, 11, 1484–1490. doi:10.1039/c0lc00612b
- Iliescu, F. S.; Vrtačnik, D.; Neuzil, P.; Iliescu, C. Microfluidic Technology for Clinical Applications of Exosomes. Micromachines 2019, 10, 392. doi:10.3390/mi10060392
- Zhang, W.; Guo, S.; Pereira Carvalho, W. S.; Jiang, Y.; Serpe, M. J. Portable Point-of-Care Diagnostic Devices. Anal. Methods 2016, 8, 7847–7867. doi:10.1039/C6AY02158A
- Ashok, P. C.; Singh, G. P.; Rendall, H. A.; Krauss, T. F.; Dholakia, K. Waveguide Confined Raman Spectroscopy for Microfluidic Interrogation. Lab. Chip. 2011, 11, 1262–1270. doi:10.1039/c0lc00462f
- Walker, P. A.; Morris, M. D.; Burns, M. A.; Johnson, B. N. Isotachophoretic Separations on a Microchip. Normal Raman Spectroscopy Detection. Anal. Chem. 1998, 70, 3766–3769. doi:10.1021/ac980195h
- Quang, L. X.; Lim, C.; Seong, G. H.; Choo, J.; Do, K. J.; Yoo, S.-K. A Portable Surface-Enhanced Raman Scattering Sensor Integrated with a Lab-on-a-Chip for Field Analysis. Lab. Chip. 2008, 8, 2214–2219. doi:10.1039/b808835g
- Lin, X.; Hasi, W.-L.-J.; Lou, X.-T.; Lin, S.; Yang, F.; Jia, B.-S.; Cui, Y.; Ba, D.-X.; Lin, D.-Y.; Lu, Z.-W.; et al. Rapid and Simple Detection of Sodium Thiocyanate in Milk Using Surface-Enhanced Raman Spectroscopy Based on Silver Aggregates. J. Raman Spectrosc. 2014, 45, 162–167. doi:10.1002/jrs.4436
- Lawanstiend, D.; Gatemala, H.; Nootchanat, S.; Eakasit, S.; Wongravee, K.; Srisa-Art, M. Microfluidic Approach for in Situ Synthesis of Nanoporous Silver Microstructures as on-Chip SERS Substrates. Sensors Actuators B Chem. 2018, 270, 466–474. doi:10.1016/j.snb.2018.05.051
- Yu, B.; Ge, M.; Li, P.; Xie, Q.; Yang, L. Development of Surface-Enhanced Raman Spectroscopy Application for Determination of Illicit Drugs: Towards a Practical Sensor. Talanta 2019, 191, 1–10. doi:10.1016/j.talanta.2018.08.032
- Song, H.; Chen, D. L.; Ismagilov, R. F. Reactions in Droplets in Microfluidic Channels. Angew. Chem. Int. Ed. Engl. 2006, 45, 7336–7356. doi:10.1002/anie.200601554
- Strehle, K. R.; Cialla, D.; Rösch, P.; Henkel, T.; Köhler, M.; Popp, J. A Reproducible Surface-Enhanced Raman Spectroscopy Approach. Online SERS Measurements in a Segmented Microfluidic System. Anal. Chem. 2007, 79, 1542–1547. doi:10.1021/ac0615246
- Hoppmann, E. P.; Yu, W. W.; White, I. M. Highly Sensitive and Flexible Inkjet Printed SERS Sensors on Paper. Methods 2013, 63, 219–224. http://dx.doi.org/10.1016/j.ymeth.2013.07.010.
- Díaz-Liñán, M. C.; García-Valverde, M. T.; López-Lorente, A. I.; Cárdenas, S.; Lucena, R. Silver Nanoflower-Coated Paper as Dual Substrate for Surface-Enhanced Raman Spectroscopy and Ambient Pressure Mass Spectrometry Analysis. Anal. Bioanal. Chem. 2020, 412, 3547–3557. 10.1007/s00216-020-02603-x.
- Taylor, R. W.; Lee, T.-C.; Scherman, O. A.; Esteban, R.; Aizpurua, J.; Huang, F. M.; Baumberg, J. J.; Mahajan, S. Precise Subnanometer Plasmonic Junctions for SERS within Gold Nanoparticle Assemblies Using Cucurbit[n]Uril “Glue”. ACS Nano. 2011, 5, 3878–3887. doi:10.1021/nn200250v
- Gracie, K.; Pang, S.; Jones, G. M.; Faulds, K.; Braybrook, J.; Graham, D. Detection of Cortisol in Serum Using Quantitative Resonance Raman Spectroscopy. Anal. Methods 2017, 9, 1589–1594. doi:10.1039/C6AY03296F
- Rickard, J. J. S.; Di-Pietro, V.; Smith, D. J.; Davies, D. J.; Belli, A.; Oppenheimer, P. G. Rapid Optofluidic Detection of Biomarkers for Traumatic Brain Injury via Surface-Enhanced Raman Spectroscopy. Nat. Biomed. Eng. 2020, 4, 610–623. doi:10.1038/s41551-019-0510-4
- McLaughlin, G.; Doty, K. C.; Lednev, I. K. Raman Spectroscopy of Blood for Species Identification. Anal. Chem. 2014, 86, 11628–11633. doi:10.1021/ac5026368
- Strom, A. R.; Brangwynne, C. P. The Liquid Nucleome – Phase Transitions in the Nucleus at a Glance. J. Cell. Sci. 2019, 132.
- Wille, G.; Schmidt, U.; Hollricher, O. RISE: Correlative Confocal Raman and Scanning Electron Microscopy. Confocal Raman Microscopy.2018. p. 559–580