
 ?Mathematical formulae have been encoded as MathML and are displayed in this HTML version using MathJax in order to improve their display. Uncheck the box to turn MathJax off. This feature requires Javascript. Click on a formula to zoom.
Abstract
Accessing tree species information is required for making appropriate decisions in forest management. 3D photo-interpretation using high spatial resolution aerial imagery is used to provide information on tree species in the province of Quebec. However, the shortage of qualified interpreters and the increasing costs of 3D photo-interpretation have affected the production of the forest inventory. In this study, we employed deep and machine learning models to classify nine tree species (i.e., paper birch, yellow birch, red maple, poplar, black spruce, white spruce, tamarack, jack pine, and balsam fir). We used a combination of spectral and vertical structural information extracted from 30-cm aerial imagery and airborne light detection and ranging (LiDAR) data in a forested area in Quebec, Canada. The results indicated that Dense Convolution Network (DenseNet) achieved the best overall accuracy of 78%, outperforming machine learning methods by 5%. In addition, the models’ performance was independently assessed using permanent and temporary ground sample plots, acknowledging the superiority of DenseNet in terms of overall accuracy (73%) in predicting the dominant species. Our results suggest that the combination of aerial imagery and airborne LiDAR data, using deep learning approaches, can be applied to accurately map tree species.
RÉSUMÉ
L’accès aux informations géospatiales sur les espèces d’arbres permet de prendre des décisions éclairées en aménagement forestier. La photo-interprétation 3D à l’aide d’imagerie aérienne de très haute résolution spatiale est utilisée pour fournir des informations sur les espèces d’arbres dans la province de Québec. Cependant, la pénurie d’interprètes qualifiés et l’augmentation des coûts de photo-interprétation 3D ont affecté la production de l’inventaire forestier. Dans cette étude, nous avons utilisé des méthodes d’apprentissage profond et d’apprentissage automatique pour classer neuf groupes d’espèces d’arbres (soit le bouleau à papier, le bouleau jaune, l’érable rouge, le peuplier, l’épinette noire, l’épinette blanche, le mélèze, le pin gris et le sapin baumier). Nous avons utilisé une combinaison d’informations structurelles spectrales et verticales extraites d’imagerie aérienne de 30 cm et de données LiDAR dans une superficie forestière de 9 100 km2 au Québec, Canada. Nos résultats ont montré que DenseNet a obtenu la meilleure précision globale de 78%, surpassant les méthodes d’apprentissage automatique de 5%. De plus, les performances des modèles ont été évaluées de manière indépendante à l’aide de placettes-échantillons permanentes et temporaires, montrant la supériorité du modèle DenseNet en termes de précision globale (73%) pour la prédiction des espèces dominantes. Nos résultats suggèrent que la combinaison d’imagerie aérienne et de données LiDAR aéroportées, en utilisant des approches d’apprentissage profond, peut être appliquée pour classer avec précision les espèces d’arbres.
Introduction
Providing accurate and up-to-date forest information at an operational scale is vital for sustainable forest management that yields social, economic, and ecological benefits. Tree species maps can be used for a wide range of applications such as forest resources inventories, wildlife habitat mapping and monitoring, biodiversity assessment and monitoring, estimating timber stocks, and monitoring of invasive plant species (Fassnacht et al. Citation2016; Michałowska and Rapiński Citation2021; Pu Citation2021). Additionally, various studies have underlined the significance of tree species information, which can be utilized either as input for species-specific allometric models or species-specific growth and yield models (Michałowska and Rapiński Citation2021). Accessing tree species information can efficiently help to maximize forests’ economic value and ecological function. Moreover, an accurate and detailed forest species map is required for preventing and monitoring drought, fire, and other forest disturbances caused by climate change (Ballanti et al. Citation2016; Franklin and Miller Citation2010). As a result, producing a precise tree species map can be considered a valuable source of information for a wide range of forest ecology, biodiversity and managerial applications (Lechner et al. Citation2020). Earth observations (EO) from remote sensing provide invaluable opportunities for studies requiring land use and land cover information. The progress of remote sensing technology has provided a significant and valuable data source for tree species identification in tropical, sub-tropical, temperate, and boreal forests (Shen and Cao Citation2017; Pereira Martins-Neto et al. Citation2023; Ferreira et al. Citation2019; Queinnec et al. Citation2023). Using remote sensing datasets, such as optical satellite imagery, light detection and ranging (LiDAR), and aerial images captured from helicopters or airborne vehicles, remains an active research area for mapping tree species across extensive geographic regions.
Recent rapid advances in remote sensing technology have settled it as a practical alternative to traditional field-based surveys, which are labor-intensive, costly, and not always applicable for determining tree species composition in vast areas. Spectral imagery and Light Detection and Ranging (LiDAR) data have been frequently and successfully used for tree species identification in tropical, sub-tropical, temperate, and boreal forests (Shen and Cao Citation2017; Pereira Martins-Neto et al. Citation2023; Ferreira et al. Citation2019; Queinnec et al. Citation2023). Many studies examined the pros and cons of using LiDAR, multispectral and hyperspectral data alone for tree species classification (Heinzel and Koch Citation2011; Shi et al. Citation2018; Dalponte et al. Citation2013). LiDAR data offers several advantages over optical data in terms of decreasing occlusions and shading effects, making it suitable for assessing vertical tree attributes to provide forest inventory information such as tree species, timber volume and biomass (Beland et al. Citation2019; Michałowska and Rapiński Citation2021). While LiDAR data is valuable for capturing detailed three-dimensional information about forest structure, it is limited in providing spectral characteristics of the trees, making it challenging to distinguish between tree species with similar structural but different spectral properties. Furthermore, it remains expensive to acquire high-density point clouds for extensive geographical areas (Beland et al. Citation2019). Aerial images, on the other hand, have been commonly employed for this purpose, providing spatial context details; however, they can be affected by shadows and brightness artifacts, influenced by factors like atmospheric conditions and acquisition timing (Fassnacht et al. Citation2016; Korpela et al. Citation2014). Combining spatial context details and spectral information provided by spectral imagery and vertical structural information from LiDAR data has been shown an efficient approach for tree species identification (Fassnacht et al. Citation2016; Matsuki et al. Citation2015). Since 2009, there have been active acquisitions of airborne LiDAR data in the Quebec province, primarily for forest inventory and planning purposes. Furthermore, the Government of Quebec routinely acquires multispectral digital aerial photos from the managed forest in the southern part of the Quebec province. This can be considered a valuable resource for monitoring forests, especially tree species classification, which is a challenging task in complex and vast boreal forests.
In the last decade, deep learning (DL) methods have achieved remarkable milestones in a wide variety of tasks such as land use and land cover classification, object detection, and scene classification (Ma et al. Citation2019). End-to-end learning, which refers to a model that learns all the steps between the initial input phase and the final output result, is a significant advantage of DL compared to machine learning methods. The basic idea of DL is to allow the model itself to automatically develop a hierarchy of features during training, bypassing the need for hand-crafted ones. DL methods leverage the rich information captured in textural and visual features, along with spectral information, to automatically emulate the visual-based tree species classification. Among popular DL models, Convolutional Neural Networks (CNNs) have emerged as a dominant choice for various applications in remote sensing (Ghanbari et al. Citation2021). Their success, especially in tasks such as classification and object detection, can be assigned to their potential to provide spatial context by capturing intricate spatial relationships between pixels. Furthermore, traditional parametric and non-parametric machine learning algorithms, such as support vector machines (SVM), Extreme Gradient Boosting (XGBoost), and random forest (RF), find extensive application in the realm of tree species classification using a variety of remote sensing data (Shen and Cao Citation2017), with good accuracy. These automatic methods have the potential to be more consistent and faster compared to prevalent traditional approaches such as visual photo interpretation and field-based surveys. In light of these considerations, the utilization of DL and ML techniques appears as a promising avenue to effectively tackle the complexity of tree species classification within natural forests using remote sensing data on regional, national and global scales. These approaches pave the way for automated, efficient, and precise tree species identification through remote sensing data (Bolyn et al. Citation2022; Nezami et al. Citation2020; Natesan et al. Citation2020; Paoletti et al. Citation2019; La Rosa et al. Citation2021).
Covering over 10% of the earth’s land surface, the boreal forest is acknowledged for its diverse ecosystem and notable economic, social, and biological importance. Additionally, within Quebec, the boreal shield ecozone is known as the largest among vegetation zones, accounting for roughly 70% of the province’s total territory. Since the last century, photo interpretation has been used as a practical approach to provide forest inventory information in Quebec. Although photo interpretation based on remote sensing data is more affordable and rapid than traditional field surveys, the precision depends on skilled and experienced photo interpreters for determining forest species composition. Moreover, the shortage of qualified photo-interpreters, along with the lengthy procedure of manual photo interpretation, affect the production of up-to-date tree species information in the province of Quebec. Automated identification of tree species from various remote sensing data can thus be considered as a viable replacement of traditional approaches such as field-based surveys and photo interpretation for tree species classification in vast areas (Bolyn et al. Citation2022; Qin et al. Citation2022). Effective tools using high spatial remote sensing data and contemporary machine/deep learning algorithms could help address this issue. Quebec’s sustainable forest management practices would thus greatly benefit from accurate and up-to-date information that helps forest managers to make suitable local and regional decisions. To this effect, Varin et al. (Citation2020) compared the performance of five different algorithms such as support vector machine, random forest (RF), k-nearest neighbor, classification and regression tree, and linear discriminant analysis to identify species using WorldView-3 data in a broadleaf forest in Quebec, Canada. The RF provided the best performance to classify 11 tree species at the tree level.
Determining which classifier to use in order to perform tree species classification is an important aspect when dealing with the complexity of natural boreal forests. Large-scale real-world data is not perfect and often suffers from various noise effects and dataset ambiguities (Feng et al. Citation2023). It can consist of various types of variability, such as high variability in illumination conditions found in aerial imagery due to the solar angle and camera viewpoint. In addition, the reference data provided through various methods, including ground surveying and visual interpretation, could introduce uncertainties into remote sensing data products when using large-scale datasets (Olofsson et al. Citation2014; Kendall and Gal Citation2017). Although various deep learning and conventional machine learning approaches have been assessed for tree species classification using different remote sensing datasets, their performance in classifying tree species within a vast boreal forest using common aerial imagery and LiDAR data has not been thoroughly investigated. Therefore, it is valuable to evaluate the performance of different classifiers over large geographical area to show the suitability and robustness of existing DL and ML methods to provide a practical framework (Fassnacht et al. Citation2023). The evaluated framework can be used as a valuable tool for providing tree species information to assist and support forest inventory efforts.
While automated approaches have shown good capacity in some studies using small datasets, extracting the desired tree species information from large-scale multi-source remote sensing datasets in practical scenarios is still an ongoing area of research (Fassnacht et al. Citation2023). This gap has led to the continued use of traditional photo interpretation techniques over diverse geographic regions. This study aimed to assess the performance of deep and machine learning approaches for the classification of nine dominant tree species across a vast area within Quebec’s boreal forests using 30 cm aerial imagery and 2.5
airborne LiDAR data. The primary motivation was to establish a robust and accurate framework for mapping tree species to support photo interpreters in providing and updating the eco-forest inventory. The most innovative contribution involves assessing deep learning approaches, namely Dense Convolutional Network (DenseNet), Residual Network (ResNet), and Swin Transformer, in the context of tree species classification from large-scale aerial imagery and LiDAR data. In addition, the effectiveness of combining aerial imagery and LiDAR-derived metrics was evaluated. Furthermore, we compared the performance of deep learning approaches (CNN and transformers) with machine learning methods (RF, SVM, and XGBoost).
Material and methods
Study area
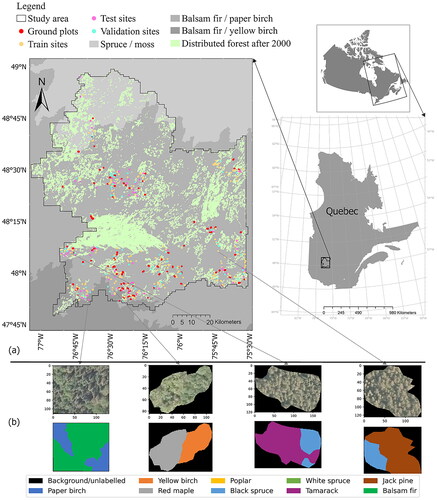
Quebec represents 27% of the total area under sustainable forest management standards in Canada, and 28% of forest products by value come from the province of Quebec (Canadian Forest Service Citation2022). The study area is located in the province of Quebec, Canada () east of Val-d’Or city. The average daily temperatures exhibit a monthly range of −14.6 °C to 17.4 °C. In terms of precipitation, the region receives an annual average of 929 mm, based on weather data collected between 1981 and 2010. It mostly belongs to the balsam fir-paper birch bioclimatic domain in Quebec boreal forest. Paper birch (Betula papyrifer Marsh), balsam fir (Abies balsamea (L.) Mill), black spruce (Picea mariana (Mill.) BSP), tamarack (Larix laricina (Du Roi) K. Koch), white spruce (Picea glauca (Moench) Voss), yellow birch (Betula alleghaniensis Britt), jack pine (Pinus banksiana Lamb.), red maple (Acer rubrum L) and poplars (dominantly Populus tremuloides) are the primary tree species groups. The yellow birch and red maple are relatively scarce and grow in the southern part of the domain. Mixed white spruce, balsam fir, jack pine, poplar and birch stands can be found in mesic sites in this area. In sub-hydric and hydric habitats, you can find other species such as black spruce and tamarack.
Figure 1. Study area: east of Val-d’Or city, Quebec province, Canada. (a) The location of the study area and reference data provided by photo interpretation. The ground plots have been used for independent validation in this study. Bioclimatic domains of Quebec province and disturbances information provided by Ministère des Ressources naturelles et des Forêts (MINISTÈRE DES RESSOURCES NATURELLES ET DES FORÊTS Citation2017). (b) Examples of aerial imagery with a spatial resolution of 30 cm and the corresponding reference data provided by photo interpretation.
Airborne imagery and laser scanner data
Cloud-free aerial spectral images were acquired over the study area in the summer of 2017 by an UltraCamX sensor. This sensor provided four wide spectral bands (blue, green, red and near infrared) with a spatial resolution of 30 cm. The multispectral camera captured images with an extent of 3770 × 5770 pixels and a focal length of the camera set at 100.50 mm. Images were radiometrically corrected and orthorectified using optimal camera calibration observations, transformation parameters and ground control points by the provider. The aerial LiDAR data was acquired in the summer of 2017 by a Leica ALS70-HP sensor with an average point density of 2.5. Two flight plans were applied to acquire data in the lowest cloudy condition: the first with an altitude, pulse repetition frequency, and side overlap of 800 m, 175 kHz, and 20%, and the second with 1600 m, 330 kHz, and 20%. Each applied plan covered a proportion of the study area without overlap by considering the lowest cloud condition. The absolute horizontal and vertical accuracies were 50 and 25 cm, respectively. Thirty-seven metrics were extracted from the raw point cloud, with a grid size of 5 m for the study area. We used percentiles of the height distribution and the proportions of returns in different height strata which depict the vertical structure. Shi et al. (Citation2018); Queinnec et al. (Citation2023) reported that the percentiles of the height distribution, which indicate the height value below which a specific percentage of the laser pulses fall, are among the important LiDAR metrics to increase species discrimination performance. Furthermore, statistical measures and features that characterize point distribution, encompassing the maximum, mean, standard deviation, kurtosis, and skewness have been applied in this study (Michałowska and Rapiński Citation2021). LiDAR metrics were resampled using the nearest neighbor method to the spatial resolution of spectral bands (30 cm). shows the variables used in this study.
Table 1. List of predictor variables used in this study.
Reference data
The labeled dataset used in this study has been created using photo interpretation techniques by the Ministère des Ressources naturelles et des Forêts (MRNF). The tree species were identified by a team of senior expert photo-interpreters using delineating homogeneous areas with the same height and density cover, which were applied as a reference to extract the data in desired areas. The procedure consisted of localizing sites based on the desired species using aerial photographs that met specific criteria. The selected sites are located in mature stands that haven’t been affected by disturbances in previous years (). Three factors were considered by photo interpreters to delineate the sites: (i) each site should at least have an area of 400 m2, (ii) two sites of the same species should be at least 1000 m apart from each other, and (iii) site must be located in stands with an average tree height taller than 7 meters. Given the inherent uncertainty in using photo interpretation techniques to generate reference classification data, the following criteria have been considered to mitigate these uncertainties and treat them as the gold standard (Olofsson et al. Citation2014). To minimize errors inherent in the photo interpretation process, consensus among photo interpreters was taken into consideration when selecting and extracting reference data from a site. A critical step in reducing potential errors involved reaching an agreement on a site between the producer’s photo interpreter and another designated member of the group, serving as a reviewer (Olofsson et al. Citation2014). Sites that did not have this agreement were not included in the reference dataset. To ensure that the spatial autocorrelation is mitigated (Kattenborn et al. Citation2022), the MRNF made sure to keep each of the photo-interpreted sites a minimum distance of one kilometer apart. shows examples of reference data provided by photo interpreters. It’s worth mentioning that more than 250 aerial photos have been used by photo interpreters to extract reference data, which provided real-world data variation, mainly including deviations in the illumination of aerial imagery in a large-scale scenario. The interpretation procedure resulted in a database containing 354 distinct sites (), characterized by diverse sizes ranging from 400 m2 to 7000 m2, with a median size of 900 m2.
Independent assessment plots
Ground plots have been selected to evaluate the performance of models as an external and independent validation dataset to predict dominant species (red dots in ). The plots consist of permanent plots and fifth inventory temporary plots measured by the Ministère des Ressources naturelles et des Forêts du Québec. The plots were circular, with a radius of 11.28 m. Plots with an observed class proportion (basal area) for desired species greater than or equal to 40% were selected. Furthermore, plots that overlapped with extracted reference data by photo interpreters, were discarded. Plots dominated by black spruce (150 plots), paper birch (66 plots), and balsam fir (47 plots) met the mentioned criteria. The true label for the plot has been annotated with the highest basal area, while the predicted label is determined based on the most frequently predicted label among the pixels in that plot.
Methods
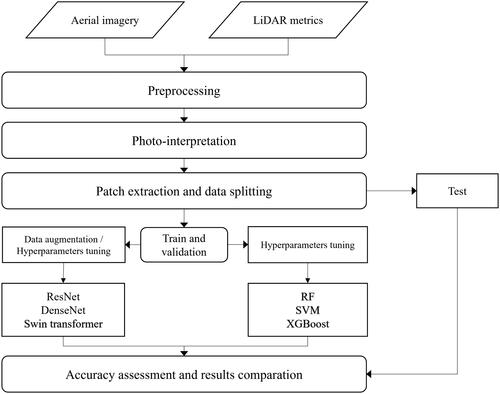
presents a flow diagram that illustrates the methods employed in this study. Homogeneous areas, which were delineated by photo interpreters, were matched to aerial imagery and LiDAR-derived metrics. Subsequently, appropriate samples were extracted for DL and ML models. Then three DL and three ML models were built using different dataset combinations. Accuracy metrics were calculated from the test dataset to compare DL and ML approaches and demonstrate each modality’s potential for tree species classification.
Figure 2. Flow diagram of tree species classification procedure in this study.
Data preparation
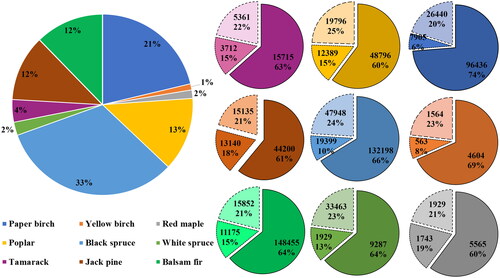
The proposed framework is a pixel-level classification using deep learning approaches. The input data for deep learning approaches is a small neighborhood space (patch) integrated data cube around the target pixel. The technique is based on extracting small three-dimensional patches of a fixed size W × W × C, where W is the spatial neighborhood considered and C is the number of bands. The classification is performed using more than the information of a single pixel. Patch extraction is frequently applied as a common and practical approach in different spectral-spatial state-of-the-art supervised classifications using different types of datasets and in various tasks (Arndt and Lunga Citation2021; Jamali and Mahdianpari Citation2022). This patch extraction technique lets us assess the importance of spatial features provided by DL models compared to common machine learning approaches (). The input data size is a hyperparameter that must be adjusted based on the nature of the dataset (i.e., size and resolution) and models. Previous studies have demonstrated that using a larger patch size W can improve the performance of DL approaches based on adjacency around the target pixel for different classification tasks such as land use, land cover classification and tree species classification (Arndt and Lunga Citation2021; Zhang et al. Citation2020). However, a larger patch size W selection can increase computational time on top of reducing accuracy, especially for pixels located at the corners or edges of a class that can be the boundary of crown of two different tree species. In this study, three different input sizes (32 × 32, 24 × 24, and 16 × 16) were evaluated to find the optimal value. The 354 sites were independent, randomly selected and divided into training, validation, and test sets. In this study, proportions were 60%, 20%, and 20% respectively. Each site provided by photo-interpreters was exclusively assigned to only one of the training, validation, or testing subsets. The applied condition resulted in having spatially disjoint train, validation, and test subsets, to prevent over-optimistic accuracy assessment that might compromise the models’ ability to generalize to truly unseen data (Mäyrä et al. Citation2021; Kattenborn et al. Citation2022; Tampu et al. Citation2022). Furthermore, considering a distance of 1 kilometer between sites in the photo interpretation process to create reference data mitigates the spatial autocorrelation in the applied approaches (Kattenborn et al. Citation2022). The applied condition led to the distribution of training, validation, and test data for each class, as illustrated in .
Figure 3. Sample extraction strategy used in this study: (a) Example of a site, (b) Example patches (samples) for DL models, and (c) Sample extraction strategy for DL and ML approaches.
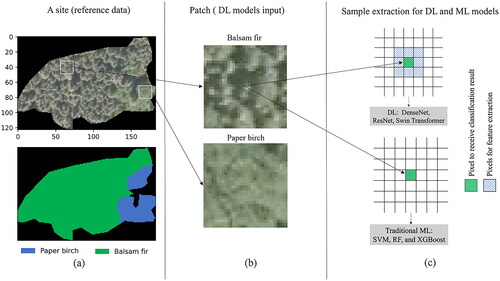
Figure 4. Distribution of samples (total: 614582) for training (solid border and high color saturation), validation (square dot border and medium color saturation), and testing (dash border and low color saturation) for each tree species class.
Deep learning approaches
In this study, three different state-of-the-art neural architectures, i.e., DenseNet, ResNet and Swin Transformer are applied. Various ResNet models and shallow networks have shown a good capacity for classifying tree species (Guo et al. Citation2022). ResNet-50 was applied in this study as it demonstrated a strong capacity for pixel-based land use and land cover classification (Naushad et al. Citation2021) and individual tree species classification (Li et al. Citation2021). DenseNet (Dense Convolutional Network), which takes advantage of dense, multi-layer skip connections was proposed based as an upgrade to ResNet in 2017 (Huang et al. Citation2017). DenseNet not only has the advantage of ResNet, such as amplification of the propagation of features and reducing the vanishing gradient problem, but is also efficient because of its low number of network parameters. When gradients vanish, updating the weights of early layers becomes challenging, resulting in slow or negligible learning. This bottleneck in the learning process has been addressed and improved in newly introduced deep learning networks. In our experiments, we employed a DenseNet-121 architecture that consists of four dense blocks. At the end of the network, extracted features using DenseNet and ResNet backbones (feature-extracting network) were followed by a global average pooling layer, then fed to a dense layer with a softmax activation function. Softmax generates a vector of probabilities for each class. Each value in the vector represents the likelihood of the input data belonging to a particular class. This helps in classifying the input into one of the available classes based on the highest probability.
Transformers have been applied in natural language processing (NLP) because of their long-range attention mechanism, training stability and scalability. Transformers were subsequently applied to the image domain with the Vision Transformer (ViT). Liu et al. (Citation2021) further improved ViT by proposing the Swin Transformer, which uses a hierarchical construction technique to resolve the computational challenges associated with ViT. The patch partition, patch merging, linear embedding, and Swin Transformer blocks are 4 components of a Swin Transformer hierarchical architecture. These elements allow enough flexibility to deal with variations in the scale of visual entities, which is an important challenge in the domain of computer vision compared to domain of language for transformer models. Previous vision transformers used a single low-resolution image to produce the features map of a single scale and applied the self-attention mechanism globally.
Experimental settings
All DL models were implemented using the Python TensorFlow library. Adam was used as the optimizer for all DL models with the parameters β1 = 0.9, β2 = 0.999, ϵ = which are recommended in various classification tasks (Smith Citation2018). Also, we used 0.001 as the initial learning rate and a learning rate scheduler to reduce the learning rate with a factor of 0.2 and patience of 2 when reaching the learning plateau (i.e., no further model improvement). Focal loss was applied as the loss function for DL models with a γ = 2. It is an improved version of the cross-entropy loss function that helps to deal with class imbalance (Lin et al. Citation2017). For instance, the focal loss function focuses on hard misclassified samples and downweights easy-classified ones. We also employed early stopping as a regularization method to avoids overfitting. Furthermore, we used a maximum training iteration of 100 epochs and a batch size of 128 patches. Data augmentation is a popular technique that can help a model to generalize to unseen data, by applying relevant image transformations. In our case, these would consist of geometric, and brightness adjustments, for instance. We employed the following data augmentation techniques during training: flipping, rotating, and changing brightness and contrast. It should be mentioned that the experiments were mainly done with dual Intel Xeon E5-2650 v4 @ 2.2 GHz, a Graphical Processing Unit (GPU) of NVIDIA Tesla V100 32GB. shows the hyperparameters that were used for the Swin Transformer model in this study.
Table 2. Swin Transformer hyperparameters.
Machine learning approaches
For comparing with deep learning methods, we selected three commonly used machine learning techniques for tree species identification using remote sensing data. These included random forest (RF) and support vector machines (SVM), which achieved great success in classifying high dimensional remote sensing data. Thanks to bagging, which involves training many classifiers (decision trees) on data subsets to reduce classification variance and ensure efficient computation, the RF method is effective for remote sensing data classification. Each pixel is classified by majority voting of grouped trees in an algorithm based on predictor variables (Breiman Citation2001). SVM, using kernel functions to transform data into higher dimensions through an efficient and less computationally complex technique known as the kernel trick, is also well adapted for classification tasks employing high dimensional remote sensing data. In addition, SVM uses maximum margin hyperplane techniques in the training data to provide the best hyperplane that separates different classes (Cortes and Vapnik Citation1995). Extreme Gradient Boosting (XGboost) is an ensemble machine learning approach that has recently become studied in the field of remote sensing (Georganos et al. Citation2018). The ensemble method, used to create and aggregate decision trees is the main difference between RF and gradient boosting. The gradient boosting uses the boosting technique which means that each tree is built sequentially and improves the deficiencies of the previous one.
Experimental settings
Selecting optimal hyperparameters is a critical task in machine learning. It can significantly affect the obtained accuracy in different classification tasks. The Randomized search was applied to select the optimal hyperparameters for RF, SVM and XGboost models using five-fold random cross-validation and 15 iterations. Randomized search is a common hyperparameter tuning technique which is less costly compared to grid search in terms of computing power and time. It involves randomly selecting hyperparameter values from predefined ranges and assessing the machine learning model’s performance using these randomly selected configurations, iterating through this process for a number of trials. Experiments for conventional machine learning models were mainly run on a dual Intel Xeon E5-2683 v4 processor running at 2.1 GHz with 125 GB of random access memory (RAM). The RandomizedSearchCV parameters used in the different ML algorithms are shown in .
Table 3. Random search parameters used in the ML models.
Evaluation metrics
Different accuracy metrics were calculated based on the models’ predictions to evaluate the performance of each approach. The F1-score, producer’s accuracy (PA, also known as recall), user’s accuracy (UA, also known as precision), as well as the Overall Accuracy (OA) and Kappa index (K), were selected as the evaluation metrics in this study. UA and PA are metrics that indicate the ratio of accurately classified pixels for a particular class concerning the pixels classified as that class by the model in the case of UA, or identified as that class in the reference data for PA. Furthermore, F1 is the harmonic mean of UA and PA:
(1)
(1)
(2)
(2)
(3)
(3)
(4)
(4)
(5)
(5)
where
is the observed agreement and
is the expected agreement by chance. TP, TN, FN, FP and N are true positives, true negatives, false negatives, false positives, and the total number of samples, respectively.
Results
Effect of different modalities on tree species classification accuracy
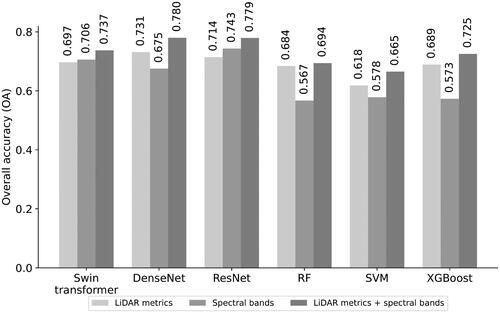
To verify the effectiveness of different modalities, including spectral information obtained by aerial imagery and LiDAR-derived metrics, each modality, either individually or combined, was used. Results showed that combining datasets containing both spectral bands and LiDAR-derived metrics provided the best overall accuracy (OA) for all evaluated classifiers compared to using each data type alone (). Swin Transformer utilizing a combination of aerial imagery bands and LiDAR-derived metrics showed improvement by 1% and 4% of OA compared to spectral and LiDAR data separately. DenseNet obtained OA= 0.78, which is 5% and 10% higher than using LiDAR and imagery datasets alone, respectively. Based on these results, using spectral bands alone resulted in slightly lower classification accuracies (4%) for ResNet than combining the datasets. An overall accuracy of 71% was achieved by LiDAR data alone, which is 7% lower than using all 41 variables (LiDAR metrics + spectral bands) as inputs for ResNet. DL methods clearly outperformed the ML models when just spectral bands were given to the models as inputs. Taking advantage of the spatial context in addition to the spectral information by DL models is considered a significant advantage over ML methods to classify tree species using only the spectral bands. Among the machine learning approaches, the highest overall accuracy improvement was obtained by XGBoost using the combined spectral and vertical information with a gain of OA = 16% compared to just spectral bands. demonstrates that LiDAR metrics as separate inputs provided better accuracy using machine learning approaches than spectral bands alone, which can be due to the limited number of spectral bands of the optical data coming from a single pixel.
Figure 5. Obtained results using different data sources and combination approach by evaluated classifiers in terms of overall accuracy.
Effect of input size on DL classification performance
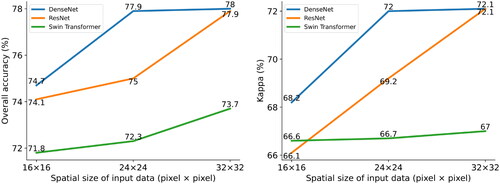
The DL models were trained and validated using three different input sizes to evaluate the impact of input size on classification results. shows the overall accuracy and kappa index by DL approaches using 16 × 16, 24 × 24, and 32 × 32 vicinity pixels of each target pixel as the input of the model. Based on the obtained results using different patch sizes W (16, 24, and 32), DenseNet, Swin Transformer and ResNet showed better performance using an input size of W = 32.
Figure 6. Effect of patch size W on deep learning models classification performance.
Results of deep learning and machine learning models
Photo interpretation reference data
In this study, three deep learning models (Swin Transformer, DenseNet-121 and ResNet-50) and three classical machine learning classifiers (RF, SVM and XGBoost) have been evaluated to assess the capacity of the machine and state-of-the-art deep learning methods to classify nine tree species. shows the UA, PA and F-1 scores obtained with different classifiers using combinations of LiDAR and spectral data. DenseNet-121 slightly outperformed the ResNet-50 with an OA and kappa of 78% and 0.721, respectively, using LiDAR metrics and spectral bands, and achieving the best performance among the evaluated models (). All classes were identified with F1-scores higher than 0.5 except for yellow birch by DenseNet. Swin Transformer achieved an overall accuracy of 73.7% and kappa of 0.67. DenseNet achieved a F1-score of 0.93, 0.82, 0.78, 0.77, and 0.72 for black spruce, jack pine, poplar, red maple, and tamarack, respectively. The XGBoost achieved the best results among machine learning approaches with an OA and K of 72.5% and 0.649. Compared with RF and SVM, the overall accuracy of XGBoost is improved by 4% and 6%, respectively. DL models’ performance is significantly better compared to the ML approaches for identifying red maple, tamarack, and jack pine. Regarding the F1- score, the DenseNet model obtained higher concurrence than XGBoost by 4%, 39%, 6%, 2%, 39%, 29%, 10%, and 16% for paper birch, red maple, poplar, black spruce, white spruce, tamarack, jack pine and balsam fair, respectively among predicted labels and reference dataset provided by photo interpreters. The relatively low number of samples of yellow birch and white spruce in the dataset (less than 4 percent based on ) is the principal reason for the low performance of different classifiers for these two classes as well as the high level of structural and spectral similarity shared between them and other species in the same genus. shows the normalized confusion matrices of test data for different classifiers using the combination of LiDAR-derived metrics and spectral bands. The confusion matrices can help determine which species are more problematic for classification. The misclassification of white spruce and yellow birch is the most problematic by DL models as well as ML models.
Figure 7. Obtained producer accuracy, user accuracy and F1-score for different classes using a combination of LiDAR metrics and spectral bands by different classifiers.
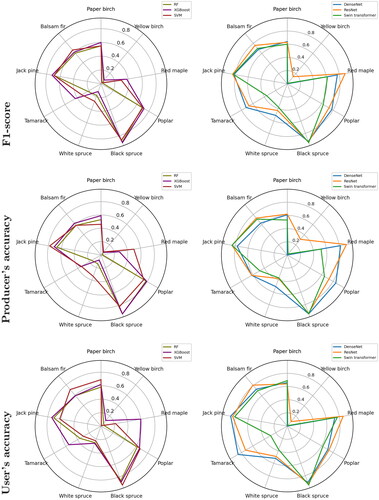
Figure 8. Normalized confusion matrixes obtained based on test samples using combination of LiDAR and spectral bands by the different methods. UA: user’s accuracy and PA: producer’s accuracy.
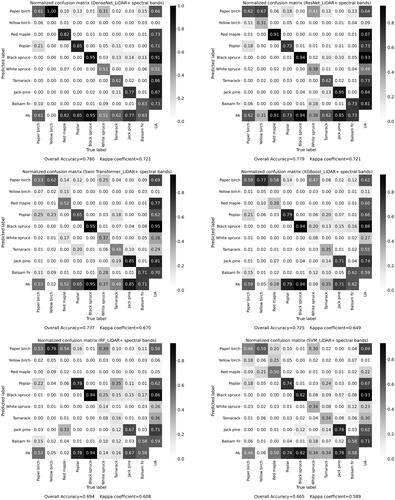
Table 4. Obtained overall accuracy and kappa index by different methods. The best and median class for each model is determined based on the obtained F1-score.
In terms of computational time, XGBoost had the shortest training times among the evaluated methods. Training DenseNet took 12.8 hours, which is nearly 2 and 5 hours longer than Swin Transformer and ResNet, respectively. It’s worth noting that the training time for conventional machine learning approaches includes the total time spent on randomized search for hyperparameter tuning and model training. The computation times for training and classification are presented in .
Table 5. Computational time for different methods.
Independent accuracy assessment using ground plots
The ground plots (in total 263) were used to independently evaluate the performance of DL and ML models. The DenseNet classified the dominated plots by paper birch, black spruce, and balsam fir with a f1-score of 0.65, 0.77, and 0.59 respectively and an OA of 73% (). Furthermore, in terms of average F1-score, DenseNet achieved the highest accuracy among evaluated classifiers for predicting the dominant tree species. The obtained results based on ground plots confirm the superiority of DL models over ML models in providing the dominant tree species using the combination of LiDAR metrics and spectral bands. Furthermore, the produced map of one example plot for each class is shown in . The predictions for ground plots demonstrate that our approach can successfully map tree species in mixed forest stands within the study area.
Figure 9. Map produced by DenseNet for three independently ground plot examples. (a) RGB image, (b) fields measurement of basal area per species (c) predicted map using DenseNet (d) predicted covering pixel per species.
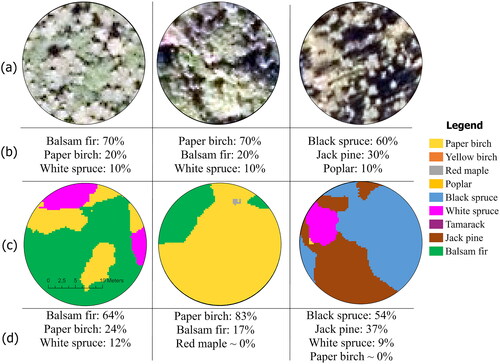
Table 6. Producer accuracy (PA), user accuracy (UA), overall accuracy (OA), kappa index (K) and F1-score were obtained by different methods using the field-dominant species information and the frequently predicted class in evaluated ground plots.
Separability analysis of deep learning models and mapping tree species groups
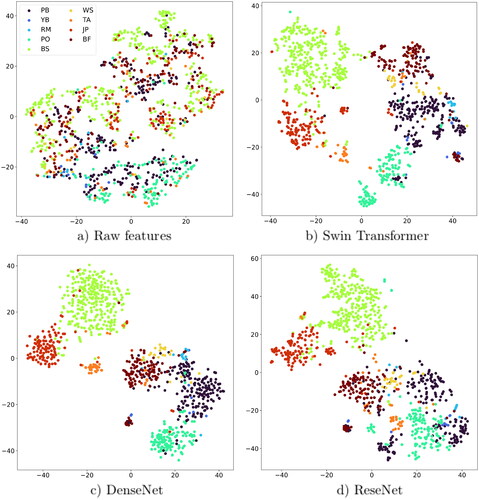
The DL networks’ behavior, illustrated by t-SNE (t-Distributed Stochastic Neighbor Embedding) was employed for interpreting and visualizing the extracted features. The t-SNE is a nonlinear dimension reduction that performs better than PCA to visualize high dimensional data. This algorithm is commonly used to downscale high-dimensional feature maps to a low-dimensional space (i.e., 2D) (van der Maaten and Hinton Citation2008). To do so, 1000 samples were selected randomly from the test samples, and the output of the last layer of each DL model or the raw data itself is shown in using the t-SNE method. The raw data is a combination of spectral bands and LiDAR metrics for the target pixel.
Figure 10. Embedding features distribution shown by t-SNE of 1000 randomly selected samples of datasets (PB: paper birch, YB: yellow birch, RM: red maple, PO: poplar, BS: black spruce, WS: white spruce, TA: tamarack, JP: jack pine and BF: balsam fair).
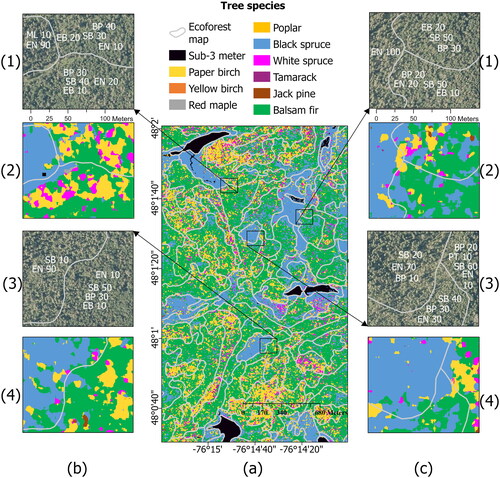
We employed DenseNet as the most effective model to produce a tree species group map. shows the produced map overlaid with forest stands from the eco-forest map. The eco-forest map is generated through the interpretation of aerial photographs and ground control points, forming part of the eco-forest inventory of southern Quebec. The resulting map predominantly covers pure stands of balsam fir and black spruce, along with mixed stands of black spruce, balsam fir, and paper birch. depict exemplars of stands, RGB aerial imagery, and their corresponding predicted species using DenseNet. It should be mentioned that the prediction is performed for pixels with a P99 value more than 3 m.
Figure 11. (a) Tree species map produced by DenseNet overlaid with forest stands produced by their inventory (photo-interpreted) species groups. (b,c).1 and 3: Original RGB orthoimage.2 and 4: Predicted map using DenseNet.The numbers provided alongside each species show the proportion of crown closure occupied by that specific species within the stand. SB: balsam fir, BP: paper birch, EN: black spruce, EB: white spruce, PT: Poplar.
Discussion
In this study, we applied deep/machine learning approaches for mapping tree species using a combination of aerial photography and airborne LiDAR. A comprehensive analysis for patch-based classification using three DL models and three machine learning models was performed. This study focused on nine species in a vast and complex forest environment in the province of Quebec, Canada. Our results indicate that deep learning models were more effective in classifying tree species using a combination of different modalities rather than each one alone, compared to machine learning models. DL models performed generally well to separate the coniferous species jack pine, black spruce, and balsam fir that are considered, commercially important for timber industry. All the classes are identified by DenseNet and ResNet with F1-scores higher than 61%, except white spruce and yellow birch. The misclassification of white spruce and yellow birch can be due to the relatively low number of training samples for these two classes compared to the others, as well as the high level of similarity shared among them and other species within the same genus (e.g., yellow birch with paper birch and white spruce with black spruce). The substantial confusion among poplar and paper birch, predicted by the DL and ML models, may be also due to high similarity of the tree structure especially canopy closure and high chlorophyll content among these two species, as acknowledged in previous studies (Dalponte et al. Citation2012; Viinikka et al. Citation2020). Nonetheless, according to the number of samples, the significant classes were less discriminable by the ML algorithms compared to the DL models. The accuracy of mapping the most common species, black spruce, was found to be higher (F1-score= 93%) than previous studies, e.g. 60% (Queinnec et al. Citation2023), 92% (Zagajewski et al. Citation2021), and 81% (Hościło and Lewandowska Citation2019). The large number of training samples of black spruce, which made up a significant proportion of the area (representing 35% of the species volume in this area), was crucial for making accurate predictions.
The choice between using tree-level, area-based, or stand-level forest inventory methods depends on the specific information requirements of the end users. While some users may require detailed estimates of species composition, in other cases, knowledge of dominant species may be sufficient to fulfill information needs (Queinnec et al. Citation2023). Several studies showed optimizing results for individual tree segmentation and tree species classification at tree level using remote sensing data in mixed-wood and deciduous forests (Qin et al. Citation2022; Shi et al. Citation2021). But, extracting individual trees in boreal forests requires high LiDAR density, which can be costly and limited to a local area. Boreal forests are characterized by high tree density and complexity, which makes it difficult to identify individual trees accurately. Moreover, the presence of tree clusters, where smaller trees are surrounded by very tall ones, can lead to a significant reduction in accuracy since LiDAR sensors may perceive these clusters as single trees. The efficient application of the evaluated framework facilitates the updating and production of tree species information within forest inventory datasets, meeting the essential need of forest managers and policy makers to assess the long-term impacts of forest management strategies. In addition, the results based on an independent ground dataset confirmed the generalization and robustness of the applied approach for predicting dominant tree species. In predicting the dominant tree species, such as paper birch, black spruce, and balsam fir using ground plots, DL outperformed machine learning methods, highlighting the effectiveness of the new Deep Neural Network for large-scale tree species classification tasks. The methodology implemented in this study can be used to produce spatially explicit tree species information with fine spatial resolution, supporting management-level decision-making over a large spatial extent.
A few recent studies have demonstrated the potential of deep learning approaches for tree species classification using different remote sensing data sources. For example, Mäyrä et al. (Citation2021) used airborne hyperspectral to classify tree species in the boreal forest of Finland at tree level. Their results showed that 3D-CNN provides the best accuracy with an OA of 87% to classify European aspen, Scots pine, Norway spruce, and birch compared to machine learning models. Moreover, a study by Illarionova et al. (Citation2021) confirmed the potential of a CNN-based model and demonstrated promising results for improving the classification accuracy of four tree species using Sentinel-2 imagery in the Russian boreal forests. They report an average F1-score of 0.76 through the use of a two-stage procedure based on markup adjustment. Directly comparing obtained accuracy is not possible due to differences in datasets, classifiers, and number of classes. However, the current study has illustrated a noticeable improvement in OA using DL compared to ML models. This finding is consistent with the mentioned studies, highlighting the great potential of DL approaches for tree species classification. Among the evaluated machine learning models, including RF, SVM, and XGBoost, XGBoost achieved superior performance in both OA and computational efficiency (). This advantage relies on using parallel and distributed computation, resulting in shorter training times compared to SVM and RF. Furthermore, the use of a training loss function and regularization in XGBoost enhances its generalization and performance, as demonstrated in recent studies in remote sensing classification tasks (Welle et al. Citation2022).
Although hyperspectral data showed good capacities for tree species classification in complex areas with a high diversity of species (Marrs and Ni-Meister Citation2019; Mäyrä et al. Citation2021; Shi et al. Citation2021; Zhang et al. Citation2020), aerial photographs still are desired in many countries for different forestry applications because of benefits such as lower costs for deployment and data acquisition compared to hyperspectral data. This study showed the capability of making use of commonly available remote sensing data in Quebec province, specifically low-density LiDAR data and aerial imagery, to classify tree species in an integrated manner. The obtained results confirm the advantage of using a combination of LiDAR-derived structure and spectral information from aerial imagery data over using each modality alone to improve the tree species classification. Although DL models performed better than ML models when using only LiDAR metrics as inputs, the improvement was not as significant as when using aerial imagery alone. This could be due to the lower spatial details provided by LiDAR metrics compared to imagery data for DL patch-based classifiers. Furthermore, demonstrates that LiDAR metrics as separate inputs provided better accuracy using machine learning models than spectral bands alone, which can be because of the limited number of spectral bands (4 bands) of imagery data. The superiority of DenseNet using LiDAR metrics compared to spectral bands can be attributed to the architecture of DenseNet-121, which has a deep network with numerous layers. Nonetheless, the limited number of samples may have constrained its ability to fully capture spatial information from imagery data alone. Some studies also mention potential redundancy introduced by the dense connections in DenseNet when there is a low number of input channels (Ma et al. Citation2018). One possible direction for future research would be to evaluate the effect of spatial resolution compared to channel information in different deep learning models for tree species classification. The metrics derived from point clouds can portray the three-dimensional structural properties of the canopy as a significant descriptor to discriminate similar tree species (Clark et al. Citation2011; Shen and Cao Citation2017; Queinnec et al. Citation2023). This can be confirmed by reported results from Shi et al. (Citation2018) by achieving an overall accuracy (OA) of 66.5% for classifying 6 tree species. Their findings showed that a reasonable level of accuracy could be achieved by using only airborne LiDAR data for mapping tree species in a natural mixed forest. In our study, providing more complete biophysical and biochemical properties of trees by the combination of LiDAR metrics and spectral bands offer a more comprehensive understanding of tree characteristics in vast and complex boreal Quebec Forest.
Spatial and spectral resolution significantly affect the tree species classification accuracy. Fine-grained spatial details and features can be captured by deep learning approaches using high spatial resolution data as valuable features. However, some species can only be accurately identified by detailed spectral information utilizing a higher level of spectral resolution. As mentioned, acquiring high spatial hyperspectral data for a vast area is expensive and not currently feasible for regional, national and global level forest management. Access to high-quality satellite hyperspectral data will soon become available to the science and biodiversity monitoring community, providing an important avenue for future research in tree species classification using hyperspectral data for upscaling purposes. Vangi et al. (Citation2021) evaluated the capacity of spaceborne hyperspectral data compared to Sentinel-2 as multispectral data with a finer spatial resolution for forest type classification. Their results showed that it does not appear that the coarser resolution of hyperspectral data has negatively affected the separability of the classes. Furthermore, Ghosh et al. (Citation2014) and Liu et al. (Citation2020) showed that higher spatial resolution of hyperspectral data does not always result in better accuracy for tree species classification using machine learning models. Utilizing hyperspectral data with deep learning approaches to classify tree species in boreal forests would be an interesting research direction.
From the results of T-SNE mapping illustrated in , employing deep neural network (DNN) based frameworks resulted in significant improvements of intraclass compactness and interclass separability compared to the raw input. This is caused by the fact that the DNNs are able to extract fine-grained structural-spectral features from highly similar classes, such as jack pine and black spruce for coniferous species and among paper birch and poplar for deciduous. In addition, using data augmentation techniques significantly enhances the robustness of DNNs in handling the inherent variability and uncertainties often present in real-world remote sensing data as well as capturing spatial information and visual features. It should be noted that the class-based feature separation in DenseNet and ResNet is performed slightly better than the one of Swin Transformer. In this regard, it can be inferred that the high capacity of feature extraction of Swin Transformer may not necessarily yield a better performance for our collected dataset. Moreover, due to the limited labeled data, the substantial computational complexity of the Transformer-based architecture can further hinge the classifier to reach a reasonable performance, similar to ResNet and DenseNet. Given the fact that various remote sensing classification tasks require training of DNN from scratch, it can be concluded that the well-known ResNet and DensNet can perform more consistently and reliably. Recent findings from Dimitrovski et al. (Citation2023) showed that DenseNet and ResNet models consistently perform well across various tasks when models were trained from scratch. On the other hand, the Swin Transformer model, along with other transformer architectures, ranked lower in performance compared to DenseNet and ResNet. Furthermore, a patch size of 32 resulted in the best overall accuracy for DL models, effectively capturing neighboring canopy information to discriminate between tree species, while also avoiding computational overhead in the processing paradigm. Li et al. (Citation2021) demonstrated that increasing the window size beyond 32 in pixel dimensions, particularly with high-resolution WorldView-2 images, did not result to improved accuracy in tree species classification for all evaluated species, such as maple, spruce, and pine. Based on their study, the crown length of evaluated species can be adequately captured within this window size.
The effectiveness of deep learning techniques relies significantly on the quantity and quality of data (O’Mahony et al. Citation2020). However, creating extensive sets of annotated data to show the maximum capacity of deep learning methods is a highly demanding, time-intensive, and costly process, especially for tree species classification using multi-source remote sensing data. To tackle with limited amount of labeled data, employing self-supervised learning (SSL) for earth observation applications such as tree species classification raised considerable attention. SSL, compared to traditional unsupervised methods, uses supervision signals that are automatically generated from the data itself. Advantage of SSL to train models is that the learned features could be leveraged via fine-tuning for the final task, with its limited labeled data. This could tackle the non-effectiveness of pre-training models provided by prior methods in the context of transfer learning since they usually are pre-trained on datasets that exhibit a large domain gap with aerial forest imagery. For instance, Natesan et al. (Citation2020) showed that transfer knowledge from the ImageNet dataset did not yield good fit learning curves and performance for tree species classification using high-resolution imagery from unmanned aerial vehicles. The utilization of abundant and inexpensive unlabeled samples generated with self-supervised/semi-supervised learning is a promising research avenue to exploit the advantages of multi-source remote sensing for tree species classification.
Conclusion
In this study, we applied several deep and machine learning approaches to map tree species using the most commonly used form of remotely sensed data for forestry applications in a large area () of the Quebec’s boreal forest. By combining aerial imagery and LiDAR data, the study aimed to improve the accuracy and efficiency of the classification process. The evaluation of different deep neural networks, such as DenseNet, ResNet and Swin Transformer, along with machine learning methods (i.e., RF and SVM, and XGBoost), provided insights into the performance and potential of each approach. The three DL models clearly outperformed ML approaches for pixel-based tree species classification in terms of both overall accuracies and per-class F1-score. The ResNet and DenseNet provided OA of 78% which is 4%, 9%, 11%, and 5% higher than Swin Transformer, RF, SVM and, XGBoost respectively. The highest obtained per-class F1- score by DenseNet was obtained for black spruce, jack pine, poplar, tamarack, and red maple with 0.93, 0.82, 0.78, and 0.77. Although improvement by integrating spectral bands and LiDAR metrics varied depending on the different classifiers from 1% to 16% improvement in OA, all the classifiers achieved better classification accuracy compared to when using each dataset individually. Except for DenseNet, DL methods showed higher capacity to classify tree species using the imagery data compared to LiDAR data alone. On the other hand, the accuracies of the three ML models (RF, SVM, and XGBoost) using only the LiDAR metrics were significantly higher than using the imagery data alone, potentially due to the limited number of spectral bands to address the complexity of tree species classification. Furthermore, an independent analysis to predict dominant species using ground plots confirmed the high generalization capacity of DL models, particularly DenseNet, when compared to ML models. Our results suggest that the combination of aerial imagery and airborne LiDAR data, using DL approaches, can be applied to accurately classify tree species. Our results could contribute to the increased adoption of automated approaches, especially new state-of-the-art DNNs, for tree species classification within operational forest inventory and monitoring programs in the future. This, in turn, could be used to map the distribution of tree species, providing important information to support decision-making and forest planning, aiding in the development of effective strategies for sustainable forestry and conservation in large forested areas.
Acknowledgement
We acknowledge the contribution of the Ministère des Ressources naturelles et des Forêts du Québec for providing data access.
Disclosure statement
The authors declare no conflict of interest.
Additional information
Funding
References
- Arndt, J., and Lunga, D. 2021. “Large-scale classification of urban structural units from remote sensing imagery.” IEEE Journal of Selected Topics in Applied Earth Observations and Remote Sensing, Vol. 14: pp. 1–24. doi:10.1109/JSTARS.2021.3052961.
- Ballanti, L., Blesius, L., Hines, E., and Kruse, B. 2016. “Tree species classification using hyperspectral imagery: A comparison of two classifiers.” Remote Sensing, Vol. 8 (No. 6): pp. 445. doi:10.3390/rs8060445.
- Beland, M., Parker, G., Sparrow, B., Harding, D., Chasmer, L., Phinn, S., Antonarakis, A., and Strahler, A. 2019. “On promoting the use of lidar systems in forest ecosystem research.” Forest Ecology and Management, Vol. 450: pp. 117484. doi:10.1016/j.foreco.2019.117484.
- Bolyn, C., Lejeune, P., Michez, A., and Latte, N. 2022. “Mapping tree species proportions from satellite imagery using spectral–spatial deep learning.” Remote Sensing of Environment, Vol. 280: pp. 113205. doi:10.1016/j.rse.2022.113205.
- Breiman, L. 2001. “Random forests.” Machine Learning, Vol. 45 (No. 1): pp. 5–32. doi:10.1023/A:1010933404324.
- Canadian Forest Service. 2022. “The state of Canada’s forests: Annual report 2022.” last modified date March 21, 2023, https://natural-resources.canada.ca/our-natural-resources/forests/state-canadas-forests-report/16496/.
- Clark, M.L., Roberts, D.A., Ewel, J.J., and Clark, D.B. 2011. “Estimation of tropical rain forest aboveground biomass with small-footprint lidar and hyperspectral sensors.” Remote Sensing of Environment, Vol. 115 (No. 11): pp. 2931–2942. doi:10.1016/j.rse.2010.08.029.
- Cortes, C., and Vapnik, V. 1995. “Support-vector networks.” Machine Learning, Vol. 20 (No. 3): pp. 273–297. doi:10.1023/A:1022627411411.
- Dalponte, M., Bruzzone, L., and Gianelle, D. 2012. “Tree species classification in the Southern Alps based on the fusion of very high geometrical resolution multispectral/hyperspectral images and LiDAR data.” Remote Sensing of Environment, Vol. 123: pp. 258–270. doi:10.1016/j.rse.2012.03.013.
- Dalponte, M., Orka, H.O., Gobakken, T., Gianelle, D., and Naesset, E. 2013. “Tree species classification in boreal forests with hyperspectral data.” IEEE Transactions on Geoscience and Remote Sensing, Vol. 51 (No. 5): pp. 2632–2645. doi:10.1109/TGRS.2012.2216272.
- Dimitrovski, I., Kitanovski, I., Kocev, D., and Simidjievski, N. 2023. “Current trends in deep learning for earth observation: An open-source benchmark arena for image classification.” ISPRS Journal of Photogrammetry and Remote Sensing, Vol. 197: pp. 18–35. doi:10.1016/j.isprsjprs.2023.01.014.
- Fassnacht, F.E., Latifi, H., Stereńczak, K., Modzelewska, A., Lefsky, M., Waser, L.T., Straub, C., and Ghosh, A. 2016. “Review of studies on tree species classification from remotely sensed data.” Remote Sensing of Environment, Vol. 186: pp. 64–87. doi:10.1016/j.rse.2016.08.013.
- Fassnacht, F.E., White, J.C., Wulder, M.A., and Næsset, E. 2023. “Remote sensing in forestry: current challenges, considerations and directions.” Forestry: An International Journal of Forest Research, Vol. 97 (No. 1): pp. 11–37. doi:10.1093/forestry/cpad024.
- Feng, W., Long, Y., Wang, S., and Quan, Y. 2023. “A review of addressing class noise problems of remote sensing classification.” Journal of Systems Engineering and Electronics, Vol. 34 (No. 1): pp. 36–46. doi:10.23919/JSEE.2023.000034.
- Ferreira, M.P., Wagner, F.H., Aragão, L.E.O.C., Shimabukuro, Y.E., and de Souza Filho, C.R. 2019. “Tree species classification in tropical forests using visible to shortwave infrared WorldView-3 images and texture analysis.” ISPRS Journal of Photogrammetry and Remote Sensing, Vol. 149: pp. 119–131. doi:10.1016/j.isprsjprs.2019.01.019.
- Franklin, J., and Miller, J. A. 2010. Mapping Species Distributions: Spatial Inference and Prediction. Cambridge: Cambridge University Press.
- Georganos, S., Grippa, T., Vanhuysse, S., Lennert, M., Shimoni, M., Kalogirou, S., and Wolff, E. 2018. “Less is more: Optimizing classification performance through feature selection in a very-high-resolution remote sensing object-based urban application.” GIScience & Remote Sensing, Vol. 55 (No. 2): pp. 221–242. doi:10.1080/15481603.2017.1408892.
- Ghanbari, H., Mahdianpari, M., Homayouni, S., and Mohammadimanesh, F. 2021. “A meta-analysis of convolutional neural networks for remote sensing applications.” IEEE Journal of Selected Topics in Applied Earth Observations and Remote Sensing, Vol. 14: pp. 3602–3613. doi:10.1109/JSTARS.2021.3065569.
- Ghosh, A., Fassnacht, F.E., Joshi, P.K., and Koch, B. 2014. “A framework for mapping tree species combining hyperspectral and LiDAR data: Role of selected classifiers and sensor across three spatial scales.” International Journal of Applied Earth Observation and Geoinformation, Vol. 26 (No. 1): pp. 49–63. doi:10.1016/j.jag.2013.05.017.
- Guo, X., Li, H., Jing, L., and Wang, P. 2022. “Individual tree species classification based on convolutional neural networks and multitemporal high-resolution remote sensing images.” Sensors (Basel, Switzerland), Vol. 22 (No. 9): pp. 3157. doi:10.3390/s22093157.
- Heinzel, J., and Koch, B. 2011. “Exploring full-waveform LiDAR parameters for tree species classification.” International Journal of Applied Earth Observation and Geoinformation, Vol. 13 (No. 1): pp. 152–160. doi:10.1016/j.jag.2010.09.010.
- Hościło, A., and Lewandowska, A. 2019. “Mapping forest type and tree species on a regional scale using multi-temporal Sentinel-2 data.” Remote Sensing, Vol. 11 (No. 8): pp. 929. doi:10.3390/rs11080929.
- Huang, G., Liu, Z., Van Der Maaten, L., and Weinberger, K. Q. 2017. “Densely connected convolutional networks.” In 2017 IEEE Conference on Computer Vision and Pattern Recognition (CVPR), Los Alamitos, CA, USA, July, pp. 2261–2269. IEEE Computer Society. doi:10.1109/CVPR.2017.243.
- Illarionova, S., Trekin, A., Ignatiev, V., and Oseledets, I. 2021. “Neural-based hierarchical approach for detailed dominant forest species classification by multispectral satellite imagery.” IEEE Journal of Selected Topics in Applied Earth Observations and Remote Sensing, Vol. 14: pp. 1810–1820. doi:10.1109/JSTARS.2020.3048372.
- Jamali, A., and Mahdianpari, M. 2022. “Swin Transformer and deep convolutional neural networks for coastal wetland classification using Sentinel-1, Sentinel-2, and LiDAR data.” Remote Sensing, Vol. 14 (No. 2): pp. 359. doi:10.3390/rs14020359.
- Kattenborn, T., Schiefer, F., Frey, J., Feilhauer, H., Mahecha, M.D., and Dormann, C.F. 2022. “Spatially autocorrelated training and validation samples inflate performance assessment of convolutional neural networks.” ISPRS Open Journal of Photogrammetry and Remote Sensing, Vol. 5: pp. 100018. doi:10.1016/j.ophoto.2022.100018.
- Kendall, A., and Gal, Y. 2017. “What uncertainties do we need in Bayesian deep learning for computer vision?” CoRR, Vol. abs/1703.04977.
- Korpela, I., Mehtätalo, L., Markelin, L., Seppänen, A., and Kangas, A. 2014. “Tree species identification in aerial image data using directional reflectance signatures.” Silva Fennica, Vol. 48 (No. 3): pp. 1087. doi:10.14214/sf.1087.
- La Rosa, L.E.C., Sothe, C., Feitosa, R.Q., Maria de Almeida, C., Schimalski, M.B., and Oliveira, D.A.B. 2021. “Multi-task fully convolutional network for tree species mapping in dense forests using small training hyperspectral data.” ISPRS Journal of Photogrammetry and Remote Sensing, Vol. 179: pp. 35–49. doi:10.1016/j.isprsjprs.2021.07.001.
- Lechner, A.M., Foody, G.M., and Boyd, D.S. 2020. “Applications in remote sensing to forest ecology and management.” One Earth, Vol. 2 (No. 5): pp. 405–412. doi:10.1016/j.oneear.2020.05.001.
- Li, H., Hu, B., Li, Q., and Jing, L. 2021. “Cnn-based individual tree species classification using high-resolution satellite imagery and airborne lidar data.” Forests, Vol. 12 (No. 12): pp. 1697. doi:10.3390/f12121697.
- Lin, T.Y., Goyal, P., Girshick, R., He, K., and Dollar, P. 2017. “Focal loss for dense object detection.” IEEE Transactions on Pattern Analysis and Machine Intelligence, Vol. 42 (No. 2): pp. 318–327. doi:10.48550/arxiv.1708.02002.
- Liu, M., Yu, T., Gu, X., Sun, Z., Yang, J., Zhang, Z., Mi, X., Cao, W., and Li, J. 2020. “The impact of spatial resolution on the classification of vegetation types in highly fragmented planting areas based on unmanned aerial vehicle hyperspectral images.” Remote Sensing, Vol. 12 (No. 1): pp. 146. doi:10.3390/rs12010146.
- Liu, Z., Lin, Y., Cao, Y., Hu, H., Wei, Y., Zhang, Z., Lin, S., and Guo, B. 2021. “Swin Transformer: Hierarchical vision transformer using shifted windows.” CoRR, Vol. abs/2103.14030. doi:10.48550/arXiv.2103.14030.
- Ma, L., Liu, Y., Zhang, X., Ye, Y., Yin, G., and Johnson, B.A. 2019. “Deep learning in remote sensing applications: A meta-analysis and review.” ISPRS Journal of Photogrammetry and Remote Sensing, Vol. 152: pp. 166–177. doi:10.1016/j.isprsjprs.2019.04.015.
- Ma, N., Zhang, X., Zheng, H.-T., and Sun, J. 2018. “ShuffleNet V2: Practical guidelines for efficient CNN architecture design.” CoRR, Vol. abs/1807.11164.
- Marrs, J., and Ni-Meister, W. 2019. “Machine learning techniques for tree species classification using co-registered LiDAR and hyperspectral data.” Remote Sensing, Vol. 11 (No. 7): pp. 819. doi:10.3390/rs11070819.
- Matsuki, T., Yokoya, N., and Iwasaki, A. 2015. “Hyperspectral tree species classification of japanese complex mixed forest with the aid of lidar data.” IEEE Journal of Selected Topics in Applied Earth Observations and Remote Sensing, Vol. 8 (No. 5): pp. 2177–2187. doi:10.1109/JSTARS.2015.2417859.
- Mäyrä, J., Keski-Saari, S., Kivinen, S., Tanhuanpää, T., Hurskainen, P., Kullberg, P., Poikolainen, L., et al. 2021. “Tree species classification from airborne hyperspectral and LiDAR data using 3D convolutional neural networks.” Remote Sensing of Environment, Vol. 256: pp. 112322. doi:10.1016/j.rse.2021.112322.
- Michałowska, M., and Rapiński, J. 2021. “A review of tree species classification based on airborne LiDAR data and applied classifiers.” Remote Sensing, Vol. 13 (No. 3): pp. 353. doi:10.3390/rs13030353.
- MINISTÈRE DES RESSOURCES NATURELLES ET DES FORÊTS. 2017. “Carte écoforestière à jour.” Last modified February 19, 2024, https://www.donneesquebec.ca/recherche/dataset/carte-ecoforestiere-avec-perturbations/.
- Natesan, S., Armenakis, C., and Vepakomma, U. 2020. “Individual tree species identification using dense convolutional network (Densenet) on multitemporal RGB images from UAV.” Journal of Unmanned Vehicle Systems, Vol. 8 (No. 4): pp. 310–333. doi:10.1139/juvs-2020-0014.
- Naushad, R., Kaur, T., and Ghaderpour, E. 2021. “Deep transfer learning for land use and land cover classification: A comparative study.” Sensors (Basel, Switzerland), Vol. 21 (No. 23): pp. 8083. doi:10.3390/s21238083.
- Nezami, S., Khoramshahi, E., Nevalainen, O., Pölönen, I., and Honkavaara, E. 2020. “Tree species classification of drone hyperspectral and RGB imagery with deep learning convolutional neural networks.” Remote Sensing, Vol. 12 (No. 7): pp. 1070. doi:10.3390/rs12071070.
- Olofsson, P., Foody, G.M., Herold, M., Stehman, S.V., Woodcock, C.E., and Wulder, M.A. 2014. “Good practices for estimating area and assessing accuracy of land change.” Remote Sensing of Environment, Vol. 148: pp. 42–57. doi:10.1016/j.rse.2014.02.015.
- O’Mahony, N., Campbell, S., Carvalho, A., Harapanahalli, S., Hernandez, G. V., Krpalkova, L., Riordan, D., and Walsh, J. 2020. “Deep learning vs. traditional computer vision.” In Advances in Computer Vision, edited by Kohei Arai and Supriya Kapoor, pp. 128–144. Cham: Springer International Publishing.
- Paoletti, M.E., Haut, J.M., Plaza, J., and Plaza, A. 2019. “Deep learning classifiers for hyperspectral imaging: A review.” ISPRS Journal of Photogrammetry and Remote Sensing, Vol. 158: pp. 279–317. doi:10.1016/j.isprsjprs.2019.09.006.
- Pereira Martins-Neto, R., Garcia Tommaselli, A.M., Nobuhiro Imai, N., Honkavaara, E., Miltiadou, M., Saito Moriya, E.A., and David, H.C. 2023. “Tree Species Classification in a Complex Brazilian Tropical Forest Using Hyperspectral and LiDAR Data.” Forests, Vol. 14 (No. 5): pp. 945. doi:10.3390/f14050945.
- Pu, R. 2021. “Mapping tree species using advanced remote sensing technologies: A state-of-the-art review and perspective.” Journal of Remote Sensing, Vol. 2021: pp. 1–26. doi:10.34133/2021/9812624.
- Qin, H., Zhou, W., Yao, Y., and Wang, W. 2022. “Individual tree segmentation and tree species classification in subtropical broadleaf forests using UAV-based LiDAR, hyperspectral, and ultrahigh-resolution RGB data.” Remote Sensing of Environment, Vol. 280: pp. 113143. doi:10.1016/j.rse.2022.113143.
- Queinnec, M., Coops, N.C., White, J.C., Griess, V.C., Schwartz, N.B., and McCartney, G. 2023. “Mapping dominant boreal tree species groups by combining area-based and individual tree crown LiDAR metrics with Sentinel-2 data.” Canadian Journal of Remote Sensing, Vol. 49 (No. 1): pp. 2130742. doi:10.1080/07038992.2022.2130742.
- Shen, X., and Cao, L. 2017. “Tree-species classification in subtropical forests using airborne hyperspectral and LiDAR data.” Remote Sensing, Vol. 9 (No. 11): pp. 1180. doi:10.3390/rs9111180.
- Shi, Y., Wang, T., Skidmore, A.K., and Heurich, M. 2018. “Important LiDAR metrics for discriminating forest tree species in Central Europe.” ISPRS Journal of Photogrammetry and Remote Sensing, Vol. 137: pp. 163–174. doi:10.1016/j.isprsjprs.2018.02.002.
- Shi, Y., Wang, T., Skidmore, A.K., Holzwarth, S., Heiden, U., and Heurich, M. 2021. “Mapping individual silver fir trees using hyperspectral and LiDAR data in a Central European mixed forest.” International Journal of Applied Earth Observation and Geoinformation, Vol. 98: pp. 102311. doi:10.1016/j.jag.2021.102311.
- Smith, L.N. 2018. “A disciplined approach to neural network hyper-parameters: Part 1 - learning rate, batch size, momentum, and weight decay.” CoRR, Vol. abs/1803.09820. doi:10.48550/arXiv.1803.09820.
- Tampu, I.E., Eklund, A., and Haj-Hosseini, N. 2022. “Inflation of test accuracy due to data leakage in deep learning-based classification of OCT images.” Scientific Data, Vol. 9 (No. 1): pp. 580. doi:10.1038/s41597-022-01618-6.
- van der Maaten, L., and Hinton, G. 2008. “Visualizing data using t-SNE.” Journal of Machine Learning Research, Vol. 9 (No. 86): pp. 2579–2605.
- Vangi, E., D’Amico, G., Francini, S., Giannetti, F., Lasserre, B., Marchetti, M., and Chirici, G. 2021. “The new hyperspectral satellite PRISMA: Imagery for forest types discrimination.” Sensors (Basel, Switzerland), Vol. 21 (No. 4): pp. 1182. doi:10.3390/s21041182.
- Varin, M., Chalghaf, B., and Joanisse, G. 2020. “Object-based approach using very high spatial resolution 16-band worldview-3 and LiDAR data for tree species classification in a broadleaf forest in Quebec, Canada.” Remote Sensing, Vol. 12 (No. 18): pp. 3092. doi:10.3390/rs12183092.
- Viinikka, A., Hurskainen, P., Keski-Saari, S., Kivinen, S., Tanhuanpää, T., Mäyrä, J., Poikolainen, L., Vihervaara, P., and Kumpula, T. 2020. “Detecting European Aspen (Populus tremula L.) in boreal forests using airborne hyperspectral and airborne laser scanning data.” Remote Sensing, Vol. 12 (No. 16): pp. 2610. doi:10.3390/rs12162610.
- Welle, T., Aschenbrenner, L., Kuonath, K., Kirmaier, S., and Franke, J. 2022. “Mapping dominant tree species of German forests.” Remote Sensing, Vol. 14 (No. 14): pp. 3330. doi:10.3390/rs14143330.
- Zagajewski, B., Kluczek, M., Raczko, E., Njegovec, A., Dabija, A., and Kycko, M. 2021. “Comparison of random forest, support vector machines, and neural networks for post-disaster forest species mapping of the Krkonoše/Karkonosze transboundary biosphere reserve.” Remote Sensing, Vol. 13 (No. 13): pp. 2581. doi:10.3390/rs13132581.
- Zhang, B., Zhao, L., and Zhang, X. 2020. “Three-dimensional convolutional neural network model for tree species classification using airborne hyperspectral images.” Remote Sensing of Environment, Vol. 247: pp. 111938. doi:10.1016/j.rse.2020.111938.