
ABSTRACT
The objective of this paper is to provide an overview of the present status and procedures related to surface precipitation observations at Environment and Climate Change Canada (ECCC). This work was done to support the ongoing renewal of observation systems and networks at the Meteorological Service of Canada. The paper focusses on selected parameters, namely, accumulated precipitation, precipitation intensity, precipitation type, rainfall, snowfall, and radar reflectivity. Application-specific user needs and requirements are defined and captured by World Meteorological Organization (WMO) Expert Teams at the international level by Observing Systems Capability Analysis and Review (OSCAR) and WMO Integrated Global Observing System (WIGOS), and by ECCC user engagement initiatives within the Canadian context. The precipitation-related networks of ECCC are separated into those containing automatic instruments, those with human (manual) observers, and the radar network. The unique characteristics and data flow for each of these networks, the instrument and installation characteristics, processing steps, and limitations from observation to data distribution and storage are provided. A summary of precipitation instrument-dependent algorithms that are used in ECCC's Data Management System is provided. One outcome of the analysis is the identification of gaps in spatial coverage and data quality that are required to meet user needs. Increased availability of data, including from long-serving manual sites, and an increase in the availability of precipitation type and snowfall amount are identified as improvements that would benefit many users. Other recognized improvements for in situ networks include standardized network procedures, instrument performance adjustments, and improved and sustained access to data and metadata from internal and external networks. Specific to radar, a number of items are recognized that can improve quantitative precipitation estimates. Increased coverage for the radar network and improved methods for assessing and portraying radar data quality would benefit precipitation users.
Résumé
[Traduit par la rédaction] Cet article vise à fournir un aperçu de la situation et des procédures présentes qui caractérisent les observations en surface de précipitations que recueille Environnement et Changement climatique Canada. Nous avons entrepris ce travail en soutien à la mise à jour continue des systèmes et des réseaux d’observation du Service météorologique du Canada. L’article porte sur des paramètres choisis, notamment l’accumulation, l’intensité et le type de précipitations, les chutes de pluie et de neige, et la réflectivité radar. Les besoins et les exigences spécifiques aux utilisateurs sont définis et recueillis à l’échelle internationale par des équipes d’experts relevant de l’Organisation météorologique mondiale à l’aide de l’Outil d’analyse de la capacité des systèmes d’observation (OSCAR) et du Système mondial intégré des systèmes d’observation de l’OMM (WIGOS), et dans le cadre d’initiatives d’ECCC en matière de participation des utilisateurs suivant le contexte canadien. Les réseaux pluviométriques d’ECCC se divisent selon la méthode d’observation : des instruments automatiques, des observations manuelles (intervention humaine) et des radars. Nous énumérons les caractéristiques particulières et le transfert de données associés à chacun des réseaux, les caractéristiques des instruments et de leur installation, les étapes de traitement et les limites touchant l’observation, la dissémination, l’archivage, etc. Un résumé des algorithmes spécifiques à chaque instrument pluviométrique qu’utilise le système de gestion des données d’ECCC figure aussi ici. L’analyse révèle entre autres les lacunes qui touchent la couverture spatiale et la qualité des données qui sont nécessaires pour combler les besoins des utilisateurs. Nous déterminons que les améliorations suivantes profiteraient à nombre d’utilisateurs : l’augmentation de l’offre de données, incluant celles des sites manuels en service depuis longtemps, l’augmentation de l’offre quant au type de précipitations et à la quantité de neige. D’autres améliorations visant les réseaux in situ incluent des procédures normalisées, le réglage du fonctionnement des instruments, et un accès amélioré et soutenu aux données et aux métadonnées à partir de réseaux internes et externes. En ce qui concerne les radars, nous soulignons un certain nombre de points qui pourraient améliorer les estimations de quantité de précipitations. Une couverture élargie du réseau de radars et des méthodes améliorées pour évaluer et représenter la qualité des données radar profiteraient aux utilisateurs de données pluviométriques.
1 Introduction
Precipitation is a key parameter in the context of climate and weather, and it is a major component of the hydrological cycle. Precipitation measurements have direct applications in meteorology and climatology and are used by a broad range of applications, such as agriculture, hydrology, and disaster management, as well as in the planning and management of environmental, natural, and urban resources.
In Canada, Environment and Climate Change Canada (ECCC; a summary of initialisms used can be found in Appendix D) is the governmental department responsible for monitoring precipitation at the national level. Precipitation measurements are used by ECCC to support both scientific studies and to provide service in the context of climate, weather, and water management. Data are provided to external users in Canada in a variety of organizations at different jurisdictional levels (e.g., municipal, provincial, and federal). As a member of the World Meteorological Organization (WMO), ECCC shares precipitation measurements with other weather and climate centres and submits data to be included in the global WMO dataset. Besides operation of traditional ground-based precipitation sensors, ECCC also operates a ground-based network of weather radars in Canada. Measurements of radar reflectivity can be converted to precipitation intensity and accumulation with relatively fine spatial and temporal coverage.
The primary objective of this paper is to provide a snapshot of the current ECCC ground-based precipitation observation network and to present the measurement, analyses, and distribution capacity in Canada. The path the observations take from their collection locations to their final distribution and storage in archives is outlined. The operational precipitation data flow description will indicate some of the existing gaps in the networks and data processing methods. The social and economic impact analysis of precipitation data is outside the scope of this paper, except as an input to the network gaps assessment.
The material presented here aims to provide essential information to current and future users of precipitation data and products. We focus on the following surface precipitation variables: precipitation intensity, accumulated precipitation, precipitation type, rainfall, snowfall, and radar reflectivity. Not included in this work are fog and visibility, icing (flux of water freezing onto surfaces), wetting (from fog, dew, and trace precipitation for agriculture purposes), snow on the ground, snow water equivalent, and snow cover. Each observational field (parameters) will be described by properties such as spatial (horizontal) resolution, frequency of observation, data timeliness, accuracy, and data format. A single field may have different requirements depending on the area of application. The definition of precipitation parameters adopted in this paper is presented in Section 2, and a description of the available ECCC networks is provided in Section 3. The stations are sorted by main operational characteristics into three groups: stations containing automatic instruments, locations with a human observer (manual observing network), and the radar network. A spatial gap analysis is also provided separately for the surface station and radar networks. The focus of Section 4 is the historical overview of instruments used in the networks, the data processing, filtering, and quality control steps for the operational instruments within ECCC’s networks, together with the limitations. Section 5 is devoted to the availability and final distribution of the observed precipitation data. Section 6 provides an overall summary of this work. For completeness, the description of operational instruments and their characteristics are given in Appendices A to C.
2 Definitions of the observed precipitation parameters
Precipitation is commonly defined as any product of atmospheric water vapour condensation deposited at the Earth's surface. The International Meteorological Vocabulary (IMV; WMO, Citation1992) defines precipitation as “hydrometeors consisting of a fall of an ensemble of particles.” Precipitation types include rain, sleet, snow, and drizzle, plus less common occurrences such as hail, ice, snow pellets, diamond dust, and freezing rain. In this work we will consider precipitation to be falling particles that produce a water flux onto the Earth's surface and not include phenomena, such as dew or icing, caused by fog blown onto surfaces. Precipitation intensity or rate is expressed as the vertical depth of water (or water equivalent in the case of solid types of precipitation) that reaches the ground during relatively short periods, on the order of minutes. The accumulated precipitation in this context is the integrated rate reaching the ground over longer time intervals, on the order of hours and days. This is the baseline observation that can be measured with either automatic or manual gauges.
The two major categories of precipitation are liquid (e.g., rain, drizzle, freezing drizzle, and freezing rain) and solid (e.g., snow, snow pellets, snow grains, ice pellets, ice crystals, and hail) (Environment Canada, Citation2015). Because traditional automated gauges, such as weighing gauges or tipping buckets, cannot distinguish between solid or liquid states of precipitation, additional information from auxiliary optical or other present weather sensors are required to help distinguish precipitation type.
Rainfall is defined in the IMV as the amount of precipitation that is measured by means of a rain gauge (WMO, Citation1992). In the Canadian Manual of Surface Weather Observations (MANOBS; Environment Canada, Citation2015), rainfall is the liquid catch of the rain gauge measured to determine the amount of rain, drizzle, freezing rain, freezing drizzle, and hail that has fallen. Subsequently, the amount of water accumulated from these types of precipitation is recorded as “rainfall.” Rainfall can be measured directly with manual Type B and Nipher gauges. Data from heated gauges that melt solid precipitation and measure the equivalent rainfall rate are considered to be accumulated precipitation without type distinction.
Snowfall amount is the amount of snow that has fallen in a given period of time. It is determined by measuring and averaging the depth of new snow in several places. As far as possible, the depth of new snow is measured in spots where the snow has fallen undisturbed by wind (Environment Canada, Citation2015). Similarly, snowfall is defined in the IMV as the depth of fresh snow deposited on the ground during a specific period (WMO, Citation1992). Snowfall can be measured directly with a manual snow ruler or less directly by using ultrasonic sensors that sense changes occurring in the surface height.
Radar reflectivity factor (Z) can be considered as a distinct field because it is an electromagnetic property of precipitation. It can be related to surface intensity using assumptions about the observed particles and their distribution. The units of Z are typically in decibels relative to Z (dBZ) (10 logZ = 1 dBZ), which references the measured reflectivity to the reflectivity from a 1 mm rain drop in each cubic metre.
3 Canadian precipitation networks
Canada is a geographically large and environmentally diverse country that presents many difficulties in the establishment of precipitation observation sites especially in remote areas, such as the Arctic. It is a challenge to sustain a cost-effective observing system over this area that reconciles the requirements of many different users. Some sample applications within ECCC are the severe weather warning program and climate research and services. Weather forecasters in the Storm Prediction Centres (SPCs) require precipitation intensity, total accumulation, and snowfall water equivalent for their work. With the exception of conditions near 0°C, forecasters have identified greater spatial density and more frequent observations as more important than accuracy. In contrast, climate requires longevity and homogeneity of historical precipitation records with high quality and minimal interruptions. Both users identify precipitation phase as being important in their work and, in particular, the distinction between rain and snow.
Measurements of precipitation over Canada from many sensors, including weather radar, are integrated into an analysis tool called the regional Canadian Precipitation Analysis (CaPA) (Mahfouf, Brasnett, & Gagnon, Citation2007), which produces operational 6 h and 24 h 10 km gridded accumulation maps. A large number of users and applications in Canada use CaPA products including the Canadian Land Data Analysis System (also known as CaLDAS), which provides surface initial precipitation conditions to drive numerical weather prediction (NWP) models, such as the ECCC 2.5 km High-Resolution Deterministic Prediction System (Milbrandt, Citation2014).
The operational observation system of the Meteorological Service of Canada (MSC), part of ECCC, is composed of a set of networks that can be separated into three main categories: stations containing only automatic instruments, the human-observing network, and the radar network. A brief summary of surface networks is presented in and . The full list of stations can be found in the supplemental material at https://doi.org/10.1080/07055900.2018.1433627. In this section we also present results from a recent gap analysis that is being used in the context of renewing ECCC observing systems.
Fig. 1 Locations of the 1735 surface weather stations across Canada with a Needs Index map in the background as of September 2016. For further details on stations see , and the station list can be found in the supplementary files. Needs Index scenarios were created based on the relative ranking and weighting of various factors and considerations for hydrometeorological monitoring, including weather and climate-related risks, as well as potential socio-economic impacts.
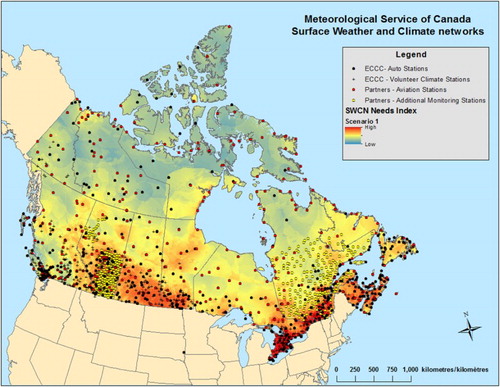
Table 1. The stations sorted into four main categories within the Surface Weather and Climate monitoring network with their description and the list of observed parameters as of September 2016. RCS stations are a subset of ALL stations and GSN stations are a subset of RCS stations (GSN ⊂ RCS ⊂ ALL).
a Automatic Station Networks
The automatic station network operated by ECCC consists of 585 fully automated stations, including both Surface Weather and Reference Climate Stations (RCS). Parameters that are typically observed at these locations are air temperature, humidity, precipitation accumulation, precipitation intensity, snow depth, air pressure, and wind speed and direction. Most locations are inspected once or twice annually. Of the total network, 240 RCS and 71 Global Climate Observing System (GCOS) Surface Network (GSN) locations are protected (from closure) to fulfill specific climate research requirements, especially stations in data-sparse areas in the Arctic and in the boreal region of Canada.
The volunteer climate network of ECCC, formally called the Cooperative Climate Network (CCN), is a network of volunteer climate observers using high quality sensors provided and maintained by MSC. Of the 465 CCN stations, 17 are protected RCS sites.
The Aviation Monitoring Station network consists of 304 stations operated by NAV CANADA and the Department of National Defence (DND). Observations are used directly to support flight operations and in the preparation of Terminal Aerodrome Forecasts. Based on operational characteristics, aviation monitoring stations can be further sub-divided into three major types: NAV CANADA Automated Weather Observing System (NC AWOS), NAV CANADA Human Weather Observing System (NC HWOS), and NAV CANADA Limited Weather Information System (NC LWIS). Precipitation instruments used in these networks include heated tipping bucket rain gauges (TBRG), optical rain gauges, present weather sensors, visibility sensors, and freezing rain sensors (NavCan, Citation2016a, Citation2016b). While NC AWOS locations are fully automated, HWOS stations are semi-automated with a human observer at the site; LWIS measures only wind, altimeter setting, temperature, and dew point, with no precipitation observations taken. At automated sites, DND aviation stations use ECCC-approved legacy AWOS instruments and ECCC instruments at manual stations. Of the total of 304 stations, 41 RCS and 16 GSN stations are protected.
The partner stations network (381) is the combination of automated weather and manual climate stations operated by partner organizations that also provide data to ECCC. Major partners include the Province of Alberta (Agriculture Drought Monitoring and Climate Monitoring) with 166 stations and the Réseau Météorologique Coopératif du Québec with 215 stations as of September 2016. The partner network does not include any RCS or GSN stations.
There are essentially three types of instruments used for automatic measurement of total precipitation amount in Canada, namely weighing gauges, TBRGs, and optical sensors (Nitu & Wong, Citation2010; WMO, Citation2008). For automated snowfall observations, an ultrasonic snow depth sensor can be applied by detecting the distance change between the ground and the sensor. These will be described further in Section 4.b. The typical MSC automated station includes one weighing gauge, one tipping bucket instrument, and one ultrasonic snow depth sensor for the measurement of precipitation accumulation, precipitation intensity, and snowfall, respectively. The Belfort weighing gauge is still in use at approximately 30 locations in Canada.
b Manual Observing Networks
Manual precipitation observations are taken at about 600 volunteer, aviation, and partner sites across Canada. The majority of these stations have Type B cylindrical shape non-recording gauges for rainfall measurements and snow ruler or Nipher snow gauges for snowfall observations. One major advantage that Canadian manual observations have over observations from many countries is the availability of separate rainfall and snowfall data that can be used in further application and analysis.
Analysis of climate trends requires long periods of homogeneous records, and ECCC has established its RCS network to meet this need. Canada selected its first seven RCSs as early as 1966 (WMO, Citation1966). The updated WMO guidelines (WMO, Citation1986) recommended that the selected stations be permanent and well-managed, with few changes in site, instrumentation, or observing procedures and that they be unaffected by densely populated areas. These stations should also have quality-controlled records of daily temperature and precipitation and a spatial density of two to ten stations per 250,000 km2. After five years, the extended list of 254 RCS locations were declared protected in 1994 during the climate network rationalization exercise (Environment Canada, Citation1996).
To reduce the dependency of the RCS network on third parties, the department initiated a climate network modernization project in 1996. If no suitable nearby RCS replacement station was available, locations perceived to be at risk of closure in the future were automated using a tested, uniformly managed, standardized set of instruments. In 1998, a subset of 72 RCS stations was designated as part of the GCOS Surface Network (Peterson, Daan, & Jones, Citation1997). During the following years the list of RCS and GSN stations was further refined and new automated stations were added in data-sparse areas in the Arctic and in the boreal region of Canada (Milewska & Vincent, Citation2016). As of 2016 the number of RCSs and GSN stations stood at 298 and 87, respectively, and 80.5% (240) of RCSs are automated ().
Although the NC HWOS aviation monitoring network has a human observer at the site, a large portion of this network employs automatic gauges rather than manual gauges. Additionally, the Canadian Air and Precipitation Monitoring Network (CAPMoN), operated by ECCC, still uses the old-style Type B and Nipher manual observation gauges at about 40 locations across Canada. This network is designed to study the regional patterns and trends of atmospheric pollutants, such as acid rain, smog, particulate matter, and mercury, in both air and precipitation.
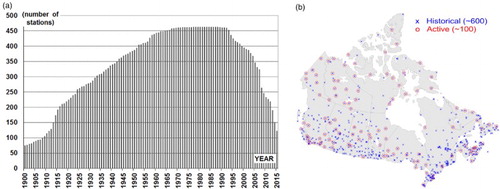
The decline of the manual observation network is obvious; the tendency can be clearly followed in the timeline and availability of the Adjusted and Homogenized Canadian Climate Dataset (AHCCD) precipitation time series. In the early 1990s a large set of manual stations (495) with the longest records was selected to be used for climate change detection purposes (Mekis & Hogg, Citation1999). Later several of these locations were automated or closed. After a decade the AHCCD station list was updated and nearby or relocated stations joined (Mekis & Vincent, Citation2011), but in several cases no alternative manual site was available. The updated figure from Mekis and Vincent (Citation2011) with six additional years (a) shows the further decreasing trend. Another example of the shrinking manual network is the reduced number of manual snowfall observations. In spite of demonstrated good results from the Nipher snow gauges (Goodison, Louie, & Yang, Citation1998) the number of active Nipher gauges across Canada had decreased to about 100 (b) in 2016.
Fig. 2 The decline of the manual station network in Canada: (a) temporal coverage of AHCCD adjusted precipitation stations based on the longest 463 annual observation sites (by permission of the Canadian Meteorological and Oceanographic Society) and (b) Nipher gauge locations, both past and present as of 2016.
c Radar Network
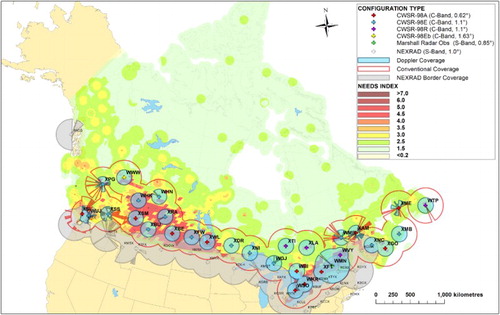
The Canadian Weather Radar Network (CWRN) consists of 31 weather radars, 29 of which are owned and operated by ECCC and two by DND. Additional radar data are received from McGill University and the United States (US) Next Generation Weather Radar (NEXRAD) network ( and ). The full list of stations can be found in the supplemental material to this paper. The ECCC network comprises C-band radars (5 cm wavelength) while the other radars are S-band (10 cm wavelength). Further subdivision is based on beam widths and antennas; for details see radar instrument characteristics in Appendix C. Collectively these radars cover most of the Canadian population centres. Coverage is nominally to a range of 256 km for non-Doppler data and 120 km for Doppler data, but some areas within that nominal range, where the radar beam is blocked by topography, buildings, etc., may be unavailable.
Table 2. Main categories of ECCC's MSC active radar network as of May 2016.
The NEXRAD system, operated by the US National Weather Service and the US Military, is a network of 160 Doppler S-band radars found throughout the United States and in selected overseas locations. Many of these radars cover parts of Canada and water basins draining into Canada. As of 2013 these radars have been upgraded to dual-polarization capability. The NEXRAD radar coverage extends to approximately 230 km, and a selected set of long-range products is available up to approximately 460 km. The ECCC receives and processes NEXRAD Level-III products derived from Level-II base volume scan data. The extent of the network is illustrated in , and its capacity is summarized in .
d Network Design and Analysis
To meet a diverse set of requirements within Canada, ECCC aims to design and operate its own networks. In addition, ECCC is committed, to the extent possible, to implement and operate their observing systems in accordance with WMO standards and recommendations.
The WMO Integrated Global Observing System (WIGOS) is a new framework of standards and recommended practices (WMO, Citation2018d). Within WIGOS, the evolution of monitoring systems is guided by the Rolling Review of Requirements (RRR) process (WMO, Citation2018c) and supported through the Observing Systems Capability Analysis and Review (OSCAR) tools, which compile information on evolving requirements from users across different application areas (WMO, Citation2018a, Citation2018b); OSCAR aims to offer guidance for network design and management by providing a compilation of user requirements for different applications and integrated across the several geophysical quantities. The list of variables related to surface precipitation identified by OSCAR within the scope of this overview include precipitation intensity, precipitation type and 24 h accumulation, and snow depth. The associated requirements (spatial, temporal, timeliness, etc.) identified in OSCAR are summarized in , sorted by major application areas. For further details on the individual variables and application requirements please consult https://www.wmo-sat.info/oscar/.
Table 3. Summary of precipitation-related requirements from OSCAR. Ranges are provided for requirements either varied regionally or across various groups associated within a certain application.
Approaches to hydrometeorological network design vary broadly among application and program areas (e.g., severe weather forecasting versus climate trend analysis) with no simple or common design guidelines to meet the varying needs of each application area. Observing system design and optimization methods need to consider a hierarchy of approaches relevant for specific program drivers and priorities. Many studies have been conducted for rain-gauge network design using a variety of methods including statistical approaches, such as spatial correlation (Nazaripour & Daneshvar, Citation2017), multivariate and geostatistics (Dai & Ye, Citation2015; Putthividhya & Tanaka, Citation2012; Seo, Siddique, & Ahnert, Citation2014; Shaghaghian & Abedini, Citation2013), entropy (Chen, Wei, & Yeh, Citation2008; Karimi-Hosseini, Bozorg Haddad, & Mariño, Citation2011; Vivekanandan & Jagtap, Citation2012; Xu et al., Citation2015), and state-space stochastic models (Ndiritu, Citation2013). However, few of these studies considered socio-economic factors, such as population density, location, growth, critical infrastructure, transportation, or other local and regional needs.
The ECCC Network Design Unit is responsible for developing recommendations for the improved design of the organization's monitoring networks. The Network Design Unit has developed a Strategic Planning and Networks Design process that has been certified by the International Organization for Standardization (Q2-700-031). The process involves developing and understanding monitoring drivers and requirements, comparing requirements with monitoring capabilities, and developing monitoring design recommendations. To support the renewal of ECCC's ground-based observation network, various analyses have been conducted to detail monitoring requirements and to identify and prioritize gaps. This involved consultation with users and scientific experts. The minimum requirements related to precipitation from these analyses are summarized in .
Table 4. Summary of precipitation-related minimum requirements from various ECCC applications. Ranges are provided in some instances where requirements either varied regionally or across various groups associated within a certain application.
Because High Impact Weather (HIW) is a particular priority of the MSC, the Network Design Unit needed an objective way to quantify users’ needs and to study the spatial variations of HIW risks and their potential socio-economic impacts. Based on a Geographic Information System (GIS), the Network Design Unit developed a Needs Index methodology that uses an adaptable geospatial approach to spatially characterize and combine various factors and drivers of importance for hydrometeorological monitoring. The process involves (i) defining an area or domain of interest, (ii) identifying and assembling relevant factors and factor groups that best represent the monitoring design criteria chosen, (iii) applying geoprocessing tools to transform and standardize data from different sources and format them into a common scale, and (iv) developing aggregated Needs Index scenarios by applying various weights or priority settings to the factor and factor groups through an Analytical Hierarchy Process (AHP; Saaty, Citation1990). The weights or priorities are generally obtained and analyzed through a user engagement process. Subsequent network analyses (e.g., gap identification and prioritization) can then be performed by overlaying existing network and/or station locations onto the Needs Index scenarios that have been developed and through the integration of application-defined spatial requirements for parameters. A key advantage of this approach is that it provides a means to easily communicate the relative HIW risk at a given monitoring site on a scale of 0–9 (0 being low risk and 9 being high risk), and it is possible to rank the location in terms of weather risk relative to potential socio-economic impacts.
The Needs Index approach was applied during recent analyses of both ECCC's Surface Weather and Climate Network (SWCN) and Canadian Weather Radar Network as described in the following sections.
1 Surface weather and climate precipitation network
Recently, in support of the MSC's Monitoring Renewal project, a spatial analysis of the SWCN was conducted. The purpose of the study was to identify areas for the potential expansion of ECCC's SWCN. This study involved a spatial gap analysis of existing ECCC automatic stations relative to program-defined requirements (e.g., severe weather, NWP, and climate). A Needs Index geospatial model (as described in Section 3.d) was developed to facilitate the prioritization of the identified gap areas. For this particular analysis, several factor groups were integrated into the Needs Index including weather and climate change, as well as social and economic activities. The full list of factors used for the Monitoring Renewal analysis is presented in (Burrows & Kochtubajda, Citation2010; Cheng et al., Citation2013). It is important to note that although non-precipitation weather factors (e.g., strong winds, lightning, and tornadoes) were included in the analysis, the results are relevant and applicable for precipitation monitoring.
Fig. 3 Canadian operational radar network coverage including blockages with Needs Index map in the background. For further details see . Needs Index scenarios were created based on the relative ranking and weighting of various factors for hydrometeorological monitoring, including weather and climate-related risks, as well as potential socio-economic impacts.
The results of the Needs Index method applied to the renewal analysis of the SWCN are plotted in as a background layer. Areas of relatively “higher” need for monitoring (based on the factor layers considered in the analysis) are represented by the warmer red colours and areas of relatively “lower” need are represented by cooler blue colours.
The higher monitoring densities and spatial coverage in the south address many of the high need areas associated with increased population and economic activity. However, the results obtained indicate large spatial monitoring gaps across Canada, especially in sparsely populated but resource-rich and environmentally sensitive northern areas. The MSC is working towards addressing these gaps through the Network Renewal (potential 40 new stations) and the Network of Networks (NoN) programs, which also involve improved access to data from stations operated by non-ECCC organizations, such as provincial, territorial, and municipal governments. Furthermore, the study recognized that the representativeness of a single in situ precipitation observation over a given (typically 200 km) distance is very uncertain (particularly in mountainous environments) because of the highly variable nature of precipitation occurrence and spatial distribution. The combination of SWCN locations with additional stations operated by partner organizations could address some of the gaps identified in the network.
2 Canadian weather radar network
The primary objective of the CWRN is to help forecasters issue severe weather warnings. Detailed user needs and gap analyses were performed by the Network Design Unit (Paul Joe, personal communication, 2014) in support of the CWRN Modernization Project. A similar Needs Index to that for the SWCN described in the previous section was developed using a combination of factors including HIW (e.g., tornadoes, severe thunderstorms, summer convective storms, and winter storms), social factors (e.g., population density and urban centres), and critical infrastructure and transportation corridors (e.g., major railways, roads, airports, and energy pipelines; ).
Six Needs Index scenarios were developed for this study to test the sensitivity of the spatial distribution of radar coverage needs. This was achieved through the integration of spatial data from different factor groups/layers using a variety of priorities and/or weights determined by users and subject matter experts including forecasters, scientists, and radar experts. The background layer on illustrates a Needs Index scenario map produced using equal weighting for the aforementioned factor groupings. Areas of relatively higher need for monitoring (based on the factor layers considered in the analysis) are represented by the warmer brown colours and areas of relatively lower need represented by cooler greens. A gap analysis was then conducted to identify areas outside the current coverage of the CWRN and near-border US NEXRAD radars for general coverage (assumed radius = 250 km) and Doppler coverage (radius = 110 km), respectively (). The analysis identified the top Doppler coverage gap areas as Wainwright and Sundre in Alberta, Bruce Peninsula and Haliburton in Ontario, and Swift Current in Saskatchewan.
Fig. 4 List of factors included in the GIS-based Needs Index analysis: * indicates factors included in both SWCN and CWRN analysis, ** indicates factors included only in SWCN analysis, and *** indicates factors included only in CWRN analysis.
4 Description of instruments used in the networks for precipitation observation
In this section we describe in more detail the instruments used in Canada to perform precipitation measurements along with a short historical perspective. The focus is on the division between automated and human-operated sensors and the implications. While automation represents cost savings, it also imposes challenges in terms of data quality and availability. A cost-effective balance is always difficult and requires constant evaluation. For completeness, a description of the technology currently employed by the ECCC radar network is also provided. Note that Canada is currently in the process of renewing its radar network. Discussion of the future Canadian radar network is outside the scope of this paper.
a Historical Overview of Instruments Used in the Networks
includes the timeline for precipitation instruments used operationally within the recent history of the SWCN. The discussion includes only the gauges presently employed; detailed descriptions of historical and recent rain and snow gauges can be found in Devine and Mekis (Citation2008).
Fig. 5 Evolution of ECCC's operationally used precipitation-observing instruments.
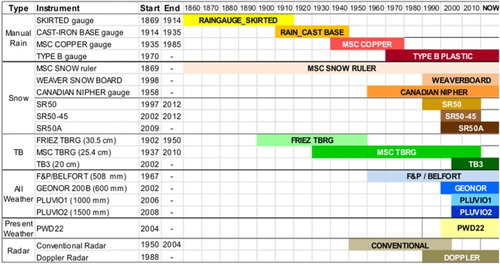
Manual rain gauges are the source of legacy observations in Canada. The four manual rain gauges, often called standard rain gauges, in chronological order of adoption are (1) the skirted gauge; (2) the cast-iron base gauge; (3) the MSC copper gauge; and (4) the Type B gauge. The operational large capacity Type B rain gauge was introduced in the 1970s (AES, Citation1971), and when the internal receiver's resolution was improved from 0.01 inches to 0.1 mm in the late 1970s, a higher precision could be reached.
Astronomer Christopher Wren first invented tipping bucket technology in the seventeenth century (Strangeways, Citation2007). In 2002 the current TB3 gauges began to replace the MSC TBRGs throughout the network (AES, Citation1981; Hydrological Services, Citation1994).
For snow observations, freshly fallen snow has been measured with the standard wooden snow ruler from the beginning of the observation period (). To keep the snowfall measurement area consistent, the MSC-approved white Weaverboard introduced in 1998 can be used as an observer's aid for measuring the depth of newly fallen snow (Environment Canada, Citation2015). The Canadian Nipher gauge was introduced in the 1960s as a parallel gauge at all manual first-order stations and at a number of climate stations for winter snowfall measurements.
The Fischer & Porter (F&P) all-weather gauge was introduced into the network around 1965. This is manufactured by Belfort Instruments and, thus, it is widely known as the Belfort gauge. The F&P/Belfort gauge was part of the original AWOS configuration installed at several locations across Canada. After field testing in 2001, the Geonor T-200B precipitation gauge was selected as the replacement for the F&P/Belfort gauge throughout the Canadian network. Approximately 35 operational F&P/Belfort gauges remain in the Canadian network.
In the 1990s the station modernization program introduced several changes throughout the networks. Automated snow depth observations started using the SR50 then SR50A ultrasonic snow depth sensor installed 2 m above ground. The 600 mm capacity Geonor T-200B and the larger 1000 mm capacity Pluvio1 weighing gauge first appeared operationally in the 2002–2006 period in Canada.
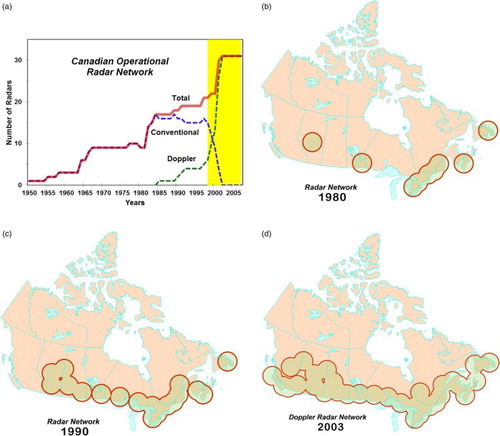
Individual weather radars were first installed in Canada in the 1950s and have evolved into a network of 31 radars (). Before 2000, most operational radars were non-Doppler types operated individually with the primary role of detecting local severe weather. In the 1998–2004 period there was a major project to modernize and standardize the network. All radars were converted to Doppler processing using nearly identical electronics everywhere, and the data were collected in regional weather centres. The adoption of new Doppler signal processors led to significant improvements in data quality, and standardization led to better maintenance and calibration procedures. In parallel with the hardware upgrade, a large software project combined the diverse radar processing systems into a single Unified Radar Processor (URP) radar system—also known as the Canadian Radar Decision Support System (CARDS)—with the explicit intent of using the radars as a network. Allowance was also made to include radar products from US NEXRAD. With the advent of the URP came the creation of composite products covering the regions of Canada or even North America, including the computation of precipitation accumulations from reflectivity products. Further details on the evaluation of the Canadian radar network are described in Joe and Lapczak (Citation2002).
Fig. 6 Evolution of ECCC's operationally used radar networks. The light-yellow band indicates the 1998–2004 period when all radars were converted to Doppler processing. The radar network remained static from 2004 until the end of 2016.
b Data Processing, Quality Control and Product Generation
It is recognized by ECCC that applications using precipitation data require an in-depth understanding of the data sources, as well as the anticipated quality and availability of the precipitation variables. One of the WMO WIGOS recommendations is the association of metadata with each dataset, which includes the description of the observed variable, the conditions under which it was observed, the measurement technique used, and the way the data were processed (WMO, Citation2015). However, adoption of metadata as recommended requires significant effort and remains under development in ECCC. Therefore, the management of precipitation data at ECCC remains complex. Furthermore, ECCC collects and uses data from partner stations, which are provided on a volunteer basis. In this section we will describe these.
The ECCC operational precipitation data flow includes processing, filtering, and quality control steps at several levels. The major stages are collection at the observation sites, data transmission to the central location, pre-archive processing within headquarters, and archive operations. Data flow is somewhat different for manual observations because of the human involvement in several parts of the process. A schematic representation of the precipitation-related data flow is shown in .
Fig. 7 Idealized precipitation data stewardship flow chart. The yellow boxes represent Monitoring and Data Services of MSC and the blue boxes represent ECCC's Science and Technology Branch.
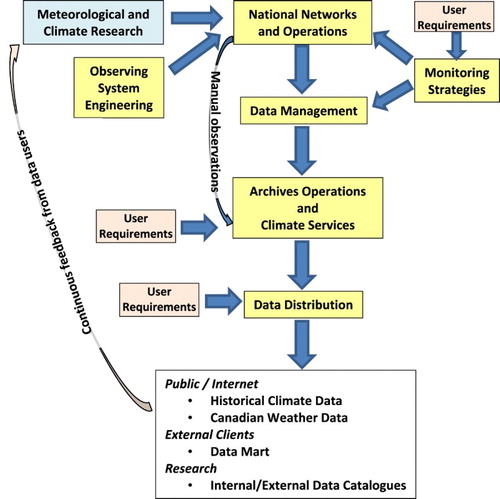
Network design and maintenance is also part of the data flow in which the internal and external user requirements described earlier play an important role. The National Networks and Operations units receive input from the Observing System Engineering, Meteorological and Climate Research, and Monitoring Strategies units. Descriptions of the functionality of the above MSC and ECCC units are outside the scope of this paper. The user requirements are also included in several planning and operational steps. This section aims to provide an overview of precipitation processing stages from the original measurements to the end products, so users can properly interpret them. Detailed discussion starts at the observing sites when observations are taken. For completeness, the operational instruments’ models, measurement technologies, and installation characteristics are also given in Appendices A–C.
1 Automatic gauges
Digital data processing is used for all automated stations. The processing step details, including internal sampling, processing, and output characteristics are provided in Appendix A. Next the generated output fields are sent to on-site dataloggers. Campbell Scientific (Canada) Corporation's dataloggers (CR3000 is currently the most common, gradually replacing the CR23X) are responsible for communicating with the sensors at the automated weather stations. The National Datalogger software program also performs basic sampling and filtering tasks at each location for all sensors in ECCC's network. Sampling intervals can be set by the datalogger software. There have been some updates (fixes of software bugs, communications, etc.) over time but generally the processing algorithms have remained static for many years. Complete details on the datalogger sampling and processing algorithms are available from the internal datalogger processing reference documents.
After the collection of observations and local processing at the site, all information is sent to the Canadian Meteorological Centre (CMC) central collecting unit. Processing of any new surface weather observation products is now performed within the Data Management System (DMS), which is the key program platform used for real-time data acquisition, standardization, quality assessment, and product generation including observations, forecasts, and warnings. It has become MSC's primary disseminator of meteorological data to internal and external clients. Because several decisions are made by the DMS, this paper attempts to provide a summary of issues related to generating precipitation products by element and data path.
The incoming raw data pass through multiple phases or processing stages within the DMS. Each phase has an associated XML output. In the raw phase, the incoming messages from different networks are in their original ASCII or in Binary Universal Form for the Representation of meteorological data (BUFR; Environment and Climate Change Canada, Citation2016; ). Note that the classification of networks is different here compared with the original four operational categories. First, all incoming information is converted into an XML product. In the decode phase, the data are standardized. The decoded XML is then put through any number of enhanced, quality assessment and/or product generation phases to add further value. Finally, the Surface Weather Observation XML (SW-OB-XML; also known as SWOB product is created. The SWOB is a simplified XML product that focuses on core elemental data without the clutter and complexity of auxiliary content, such as non-critical metadata and detailed quality assessment. Although the SWOB XML is intended for machine-to-machine data transmission, the format and clarity of this self-descriptive format is easily human-readable without any specific training or knowledge of markup languages.
Table 5. Surface Weather Observation XML (SW-OB-XML) products.
Generally, the quality assessment process of the DMS is completed in five levels: (1) acquisition and data processing; (2) automated basic real-time checks including presence, integrity, range, and temporal consistency checks; (3) comprehensive automated near real-time checks with spatial consistency check added to the previous checks; (4) basic non-real-time manual checks; and (5) all other checks after receiving user's needs and feedback. Additional to the incoming native flags (Suppressed, Error, Suspect), several flags are added for any suspicious data and further flags are added during quality control (Missing, Error, Doubtful, and Inconsistency). Often specific flags are used based on the elements; for example, in the case of precipitation trace (T), accumulated (A), and estimated (E) flags are added. These can be extended based on user requirements.
Within the DMS each variable has a distinct path. The DMS always applies a clear distinction between “precipitation” (which implies a measurement of all forms of liquid and frozen precipitation) and “rainfall” (which is just the liquid state). The designation of a measurement as either precipitation or rainfall is determined by the instrument in use. The official precipitation elements come from all-weather sensors capable of operating year-round (e.g., Geonor and Pluvio). For rainfall and rate of rainfall measurements the most commonly used sensor is the tipping bucket gauge. An exception to this rule is granted when a station has only a tipping bucket gauge installed, and then the tipping bucket rainfall measurement may be used as a proxy in derived precipitation elements as long the dew point temperature exceeds 1°C or the air temperature is greater than or equal to 4.5°C. This rule was implemented by the DMS in fall 2014. After analyzing the performance of the algorithm, it was found to be too conservative and resulted in the loss of reportable liquid precipitation on numerous occasions. As a result, the DMS modified the threshold air temperature to be greater than or equal to 0.5°C, and this has been the operational threshold since early November 2015.
For the Geonor T-200B weighing gauge, using all three vibrating wire transducers to weigh the collection bucket instead of a single transducer adds further quality control possibilities. This configuration provides redundancy, as well as helps eliminate errors that can be introduced due to diurnal thermal variations or due to an unlevel instrument. As of 2016, the DMS uses the simplistic approach of using the first “good” precipitation value of the three outputs by the datalogger. In this context “good” means that all the quality control (QC) flags had “clear” values (i.e., the value is not suspect, not an error, and not suppressed). If the first value had any issues, then the second value is evaluated and so on. Before selecting a single precipitation value as the official product, real-time quality assessment is also completed on the value. The total daily precipitation is derived from the hourlies. The Surface Synoptic Observation (SYNOP) requirement has strict rules for completeness of the hourlies. One or more missing hours may result in the loss of the daily precipitation computation (Dale Boudreau, personal communication, 2016).
The lack of metadata on instrumentation from partner stations does not allow the ability to distinguish between precipitation and rainfall or the ability to validate what is referred to as “precipitation” from an all-weather instrument. In the case of the Aviation Monitoring network, NAV CANADA AWOS stations currently use heated TBRGs to report precipitation, which can compromise the accuracy of measuring both liquid and frozen precipitation. Precipitation in summer mostly comes from the TBRG and in winter the source is the PWD22 present weather sensor, which has the capability of observing total precipitation. This serves NAV CANADA's aviation purpose of determining precipitation type and occurrence but leaves considerable uncertainty regarding the quality of precipitation observations.
The depth of snow on the ground is measured at automatic stations using either single or triple configuration SR50A snow depth sensors. Theoretically the automated sensor can be used to measure new snowfall by calculating the height differential in the snow depth between measurement times; however, since December 2013, snowfall from automatic MSC stations is no longer derived (Fischer, Citation2011). It was also decided that because of the highly variable nature of snow depth, the effects of wind on measurements, and the unreliability of using differentials from a single point, that snowfall would not be derived for any stations with a single SR50A. However, a provision was made that snowfall could be derived for triple configuration stations assuming an official value computed using a verified triple configuration algorithm. To date, no such approved algorithm has been provided to the DMS.
2 Manual gauges
Precipitation amounts observed at MSC-equipped volunteer climate stations are sent to collection centres electronically. The precision, sampling frequency, actual gauge-dependent procedures, and output fields of the operational manual gauges can be found in Appendix B. This reporting is typically done using a web-based or mobile application; the most commonly used application is the Windows Interactive Data Entry (WinIDE) for weather data entry. Observers are expected to input observed conditions in accordance with MANOBS. The output is a BUFR message that is not human readable ().
The Cooperative Online Temperature and Precipitation (COOLTAP) entry system is another web-based application that has been used to collect climate information since 2004. Observations from COOLTAP include maximum and minimum temperatures, rainfall, snowfall, and snow depth data taken once or twice daily. Data entered by users are first stored and then synchronized in the COOLTAP database every few minutes.
Observers without Internet access enter their observations via a touch-tone telephone reporting system called the Interactive Voice Recording (ONTAP-IVR) system. The AgWeather (Citation2017) interface, used mainly in Quebec and the Atlantic Maritimes, is another option for entering observations and obtaining short-term forecasts. The partner station network is a mixture of automated and volunteer stations with the characteristics described earlier.
3 Radars
Given the individual radar characteristics described in Appendix C, volume scans from the ECCC, DND, and the McGill radars are transmitted from their respective sites once in every 10-, 10-, and 5-minute scan cycles, respectively, to regional product distribution systems. These volume scans, along with US NEXRAD Level-III products, are forwarded to regional URP systems and NinJo forecaster workstations to support operational forecasting.
The CWRN data are distributed in near real time to a number of processing centres, with data expected to arrive within about one minute of the end collection. Depending on the background computational load, data processing is completed within several minutes. Subsequently, multi-radar maps are produced at regional and continental scales. Multi-radar products (for example regional composite images and storm identification products) are produced either when all radars are available or after a fixed time based on typical maximum data latency (for the possibility of radars not being in service). The URP products are then distributed to forecaster workstation systems for display, to ECCC web pages, to quantitative systems like CaPA, and to other external clients. In the context of quantitative precipitation estimation (QPE), the primary URP system is the national version run at the CMC, which processes all radars in North America.
Radar precipitation products fall into two main categories: “maps” of radar reflectivity at the observational heights converted to instantaneous precipitation rate and derived precipitation accumulations based on instantaneous rate summaries. Presently ECCC uses only two fixed conversions from radar reflectivity to precipitation intensity: the Marshall Palmer formula is always used for rain with no attempt to distinguish between convective or stratiform rain, and snowfall reflectivity relation is always used for snow. Operational systems do not attempt to decide whether the targets are snow or rain, and the end user is expected to select the appropriate product to reflect the particle type at a given time and location. To minimize issues from excessive reflectivities caused by hail or unfiltered non-meteorological targets, a modified conversion table is used for QPE applications in which all weak echoes are zeroed (because they are more likely to be insects or other non-meteorological targets) and in which the rain rate is limited to a maximum (150 mm h−1) (for large reflectivities).
Products from the PRECIPitation ExTended (PRECIP-ET) module are most commonly used in QPE applications. They combine the Doppler corrected data within the first 120 km and the uncorrected reflectivity from a non-Doppler scan out to 256 km. The module attempts a number of tests on the data to decide whether pixels should be rejected. There is an attempt to flag rays that seem to be full of spurious data (say the sun or radio interference) or suspiciously empty. There is also an assessment of whether a lack of echo at long ranges is a result of missing precipitation or because the beam is too high to measure any expected precipitation. The module can also use blockage maps to flag areas where radar signals are obscured completely or significantly by objects like buildings and hills. Currently the PRECIP-ET module is used to generate radar reflectivity maps displayed on the public ECCC weather information website and as input to accumulations in products like CaPA (Fortin, Roy, Donaldson, & Mahidjiba, Citation2015).
c Limitations
1 Automatic gauges
Although automation of stations is a cost-saving alternative, the current state of technology is such that this practice imposes limitations in terms of data quality and availability. Furthermore, the lack of detailed metadata limits the possibilities for corrections of some of those limitations. We also note that different users require different data quality levels. Therefore, the purpose is to provide awareness of data limitations for potential users without any attempt to discuss their implications in depth.
Automatic precipitation instruments must operate in a variety of challenging environmental conditions. Precipitation weighing gauges are susceptible to a number of limitations including precipitation type identification (snow, ice, mixed, etc.), precipitation accretion on the gauge orifice (Colli, Lanza, Rasmussen, & Thériault, Citation2016a, Citation2016b), and evaporation of the bucket contents. Other challenges are wind-induced bucket vibrations, gauge transducer temperature dependence (vibrating wire or load cell), transducer non-linearity with bucket load, foreign debris and insects entering the gauge, transducer and gauge calibration, and snow capping. Snow capping over the precipitation gauge orifice delays the period of recorded precipitation (by multiple days in some cases) and tends to reduce the overall precipitation increase.
Gauge performance is affected by sensitivity of the vibrating wire frequency to temperature (Duchon, Citation2008; Lamb, Citation2009). High-frequency wind-induced vibrations lead to rapid fluctuations in the precipitation output. Small decreases in precipitation can also be due to evaporation of the contents of the precipitation bucket. Temperature fluctuations resulting from diurnal solar radiation or rapid frontal passage can contribute to changes in the accumulated transducer output during non-precipitating periods. The accuracy of precipitation output is limited by the ability to distinguish precipitation accumulation from fluctuations due to wind, temperature, and evaporation. Quality control procedures, which include averaging, introducing a noise rejection threshold, and determining the rate of change limits for each sensor, are intended to address these influences; however, they can also negatively affect the quality of the observations (OSE MSC Engineering Bulletin, Citation2015a).
The measurement of solid precipitation during the winter and shoulder seasons is particularly difficult. Solid precipitation falling during windy periods can be carried over the gauge with the wind flow, limiting the amount of precipitation captured by the gauge. As an example, the catch efficiency can be reduced below 50% during solid precipitation events using a Single Alter shield around the Geonor gauge with wind speeds above 4 m s−1 (Colli et al., Citation2015; Thériault et al., Citation2015; Thériault, Rasmussen, Ikeda, & Landolt, Citation2012).
The difficulty of snowfall measurement was recognized by WMO when the Solid Precipitation Intercomparison Experiment (SPICE) was initiated in 2013; SPICE is an international multi-site intercomparison of instruments and observation systems for the measurement of solid precipitation. One of its main objectives is the assessment of a wide range of instruments under various climates. The responses of several gauge and shield configurations were studied operationally under certain environmental conditions. Transfer functions were developed to adjust gauge measurements, specific to individual configurations and climate regimes using available overlapping reference gauges and ancillary measurements (wind, temperature, and precipitation type; Kochendorfer, Nitu, et al., Citation2017; Kochendorfer, Rasmussen, et al., Citation2017; Wolff et al., Citation2015; Wong, Citation2012; Yang, Citation2014).
Data quality gaps are primarily related to the measurement of solid precipitation when wind speed affects the ability of instruments to detect and accurately measure fallen precipitation (Rasmussen et al., Citation2012). This is a compounding issue because several gauge and shield configurations are in use operationally, each having its own response to the influence of environmental conditions. Accurate metadata for precipitation observations could significantly improve the current precipitation data quality gaps.
Data gaps are also created when automatic station sensors are suppressed during servicing and erroneously are not unsuppressed immediately following. Alternatively, data quality can be compromised when automatic station data are not suppressed during servicing and erroneous data (e.g., associated with Geonor recharging) are recorded. The Pluvio1 precipitation gauge uses an internal processing algorithm to correct for changes due to wind-induced vibrations, evaporation, and temperature; however, the applied algorithm is not documented. Under certain conditions, including incorrect gauge charging or excessive gauge vibrations, false precipitation may be generated (OSE MSC Engineering Bulletin, Citation2015b).
Despite these limitations, weighing gauges provide a good estimate of precipitation accumulation for all seasons. By contrast, heated tipping bucket gauges used in the measurement of solid precipitation are susceptible to significant losses because of low catch efficiency, precipitation evaporation, and adhesion to the funnel (Nitu & Wong, Citation2010).
The performance of automatic tipping bucket gauges for intensity measurement of precipitation is limited because the slow or partial filling of the bucket leads to a substantial delay in reporting. Furthermore, the adhesion and evaporation of precipitation from the funnel, adhesion of precipitation to the filter, absorption of dirt and debris around the filter, splashing from the precipitation base or ground, and calibration of the bucket mechanism also cause errors. Additionally, the tipping bucket gauges noticeably underestimate intense storm event rainfall totals relative to weighing-bucket gauges (Duchon & Biddle, Citation2010).
The measurement of snowfall using the SR50A snow depth sensor is susceptible to a number of sources of error including temporal and spatial variations resulting from shifting snow, snow settling, wind erosion, wind deposition, sublimation, and representativeness of the measured snow locations to the typical site conditions. More challenges include suspended, windblown snow interfering with the reflected pulse of the sensor, wind-induced sensor vibrations, and the vertical air temperature profile between sensor and snowpack. Furthermore, the influence of sensor mounting (base, arm) on measured snowpack, sensor perpendicularity to the target, target size larger than the sensor beam, and the ability of the snow target to match nearby ground conditions for snow retention all pose certain challenges.
The derivation of snowfall amount from the triple configuration SR50A ultrasonic snow depth sensor at the automatic stations has been studied (Durocher, Citation2011; Fischer, Citation2011) but needs to be further validated before implementation. As described earlier in Section 4.b, direct snowfall observation will continue to be excluded from ECCC automatic station observations until further improvements are developed for this parameter.
Until the mid-2000s, ECCC played a leading role in aviation weather observations in Canada; this responsibility was then assumed entirely by NAV CANADA. Because the automatic observation of weather and precipitation type is not an aviation priority, it has been discontinued at NAV CANADA stations.
2 Manual gauges
Manual gauges have their own fundamental challenges. Each time rain stops for a few hours, the funnel dries, and the wetting loss is repeated. Once the rain has entered the receiver or the tipping bucket assembly, it is subject to evaporation until the measurement is completed. While relative humidity during rainfall periods may be close to 100%, during daytime the temperature will rise inside the gauge increasing evaporation. Wind also adds to this evaporative loss.
The loss due to wind is the single largest source of undercatch for manual rain gauges. Because of wind effect, the rain falls sideways but the flux of raindrops through a horizontal area (the vertical mass flux density) remains the same irrespective of the wind-induced speed increase. The increased speed and angle of fall of the raindrops will exaggerate the splash-out. The gauge also acts as an aerodynamic obstruction and some drops, especially small ones, can be carried completely past the orifice (Sevruk & Klemm, Citation1989). The drop size distribution of the rainfall collected is changed because many of the very small drops are swept away, but the large drops are retained.
The Type B rain gauge minimizes retention loss by having an internal graduate, but there are losses from rain drops adhering to the walls of its narrow graduate. Based on field experiments, corrections to account for wind undercatch, evaporation, and wetting losses can be applied for each observation (Devine & Mekis, Citation2008; Metcalfe, Routledge, & Devine, Citation1997).
The report on precipitation intercomparison (Goodison et al., Citation1998) demonstrated good results for the Nipher shield in minimizing wind undercatch; however, the available Nipher gauge observations are low (less than 100; b). The most important issues affecting manual ruler observations of the depth of new snowfall amount are the blowing and drifting of snow and the melting or rapid settling of snow when it reaches the ground (Goodison, Ferguson, & McKay, Citation1981). The rapid settling likely introduces a systematic underestimate of the liquid water equivalent of snowfall if a constant density of 100 kg m−3 (i.e., ratio of 10 to 1) is assumed for fresh snowfall, as is the practice in Canada.
Work has been done to correct manual observations. For example, the AHCCD daily rain and snow dataset includes adjustments for the Type B rain gauge (corrections to account for wind undercatch, evaporation, and gauge-specific wetting losses), and adjustments for snow density (fresh snow density estimated using coincident Nipher gauge and snow ruler measurements; Mekis & Brown, Citation2010). The dataset also includes corrections for trace precipitation (assigned a value greater than zero based on trace occurrence and weather type information; Mekis, Citation2005; Mekis & Vincent, Citation2011) and adjustments for accumulated amounts.
3 Radars
Radar is a remote sensing technology, which means that precipitation is estimated indirectly by means of its electromagnetic properties. Operational weather radars measure the velocity spectrum of returned power, which can be used to create an estimated echo strength corrected for echoes from stationary targets, such as buildings.
All weather radars have range-dependent limitations for surface QPE estimation. Beam size increases with range, and consequently the beam may not be uniformly filled with precipitation. Also, the sampling is being increasingly done far above the surface with increasing range, so the detected precipitation rate has increasingly less relation to the surface precipitation. The guideline applied for realistic reliable maximum range surface QPE is in the range of 100 km (which is approximated by the Doppler coverage seen earlier in ). This rule needs to be adjusted for the type of precipitation events, for example, shallow winter precipitation might be undetectable beyond only 60 km whereas deep convection precipitation might be reliably detected up to 150 km or more.
All CWRN radars need to assume the type of targets being measured (stratiform rain, convective rain, snow, hail, etc.) and then climatological relationships between returned power and precipitation rates need to be applied. The spatial variability of the echoes, together with external information, such as temperature, can be used to better specify the targets. Because of the unknown precipitation type, presently two sets of radar accumulation products (6, 12, and 24 h) are created from hourly observations using two different assumptions: all echoes are from rain or all echoes are from snow.
Another limitation of radar remote sensing is that the measurements are made aloft rather than at the surface where data are usually desired. Climatological relationships and current profiles of reflectivity near the radar can be used to extrapolate data to the surface but if the echo is far aloft, it greatly increases the uncertainty of such “vertical profile of reflectivity” (VPR) adjustments.
The current ten-minute operation cycle is probably longer than desirable for detecting rainfall accumulations for summer convective weather, whereas a radar cycle of four to six minutes would be more appropriate. The operational radar processing application URP has yet to address the correction for vertical variation in reflectivity (VPR adjustments) and spatiotemporal interpolation to compensate for unseen echo motion between ten-minute observations. Other future enhancements could include radar rainfall estimation adjustment based on past comparison to precipitation gauges, allowance for different precipitation regimes (rain, snow, or “bright band”), and identification and correction of signal attenuation by heavy precipitation.
In terms of assessing data quality, URP does not have systematic rainfall quality estimation for each specific pixel at a specific time. Individual processing modules for each product may apply their own quality processing depending on product requirements. The system could benefit from a single consistent data QC stream for all products. The identification and representation of bad or missing data are other improvement areas for URP. In the original raw radar data (Interactive Radar Information System (IRIS) format) reflectivity arrives as 1-byte data for which zero is assigned to special observations with two separate meanings for either non-measurable echoes (no reflection) or rejected data. For precipitation purposes the “no echo” should mean no precipitation, whereas “rejected” implies a lack of information at the given location. To address this issue, PRECIP-ET applies a series of QC tests and separates these two different meanings into either “no significant precipitation” or “no information.” Presently, the majority of downstream modules are not yet able to make use of this important distinction, including precipitation accumulation derivation. Because all zero radar values are simply converted to a precipitation rate of zero and added to the accumulation, the accumulation product cannot distinguish a situation with no precipitation from a pixel located behind a mountain without any precipitation information.
Current radar hardware monitoring is less systematic than it could be because of operational and hardware limitations. During scheduled maintenance or, in cases of obvious trouble, technicians perform an on-site electronic check of reflectivity parameters, but there is no real-time check of reflectivity calibration. Next generation radars should include more built-in test equipment to improve the ability to monitor hardware performance and to develop better methodologies for detecting and interpreting abnormalities in reported observations.
5 Data archiving and availability
Raw and quality-controlled station observations, raw radar volume scans, and a subset of URP products are archived and managed by the MSC's Archive Operations and Climate Services (). Hourly surface station observations arrive within about one hour for any near-real-time or real-time applications. This hour includes processing at the station, transfer time, and the time it takes for DMS to create the product (e.g., SWOB) from the raw observation. In this data flow the DMS time is only of the order of a second.
Observations from different instruments are stored in different formats in the national archive. Weighing gauge data are available in the hourly archive; the total hourly precipitation is derived from the 15-minute intervals by computing the difference between 15-minute weights at the beginning and the end. The tipping bucket data are available in hourly and daily format. Data from the volunteer climate stations are stored under three different daily archive elements depending on the time of entry and level of QC (like irregularly keypunched information from the manual network or decoded synoptic messages). The total daily precipitation amount is derived either from 6-hourly synoptic data or from the daily rain and snow observations.
The station archive process has two major streams: data arrive in either digital or hardcopy format. Within the digital stream, the source of observations can be the DMS or the legacy application. As of now, data from the DMS have only basic quality assessment completed, and no further action is taken to analyze and correct the data before archiving. For legacy systems, the observations mainly arrive from WinIDE or the Multipurpose Information Display System known as the MIDS interface. Suspicious data are flagged in the legacy automatic quality assurance system but remain unchanged. Each identified case is further analyzed by manual QC and the actual value changed only when justified. Presently, the manual QC includes daily synoptic data and old legacy DND stations but not NAV CANADA stations. No QC is performed on data arriving from the COOLTAP entry system.
Significant work is required to enter the hardcopy information into the digital archive. The digitization includes paper formats from TBRG gauges, unprocessed volunteer observations (need to be extracted and keypunched), pictures (to be scanned), and microfilm. Because the Type B standard rain gauges provide very accurate daily accumulated amounts, TBRG observations co-located with standard gauges are adjusted to agree with daily amounts. The legacy non-real-time TBRG strip chart network also requires manual annotation of the charts, which is essential because of the support to Intensity Duration Frequency (IDF) curves generation. After the new data are entered and uploaded, automated quality assessment and manual QC are completed.
Volume scans for the majority of CWRN radars are archived from 2005 to the present although some start as early as 1997. Internal users can query archived historical radar data by accessing an MSC internal website. All volume scans and products that are distributed are permanently stored by CMC.
The majority of the station data and metadata are stored in the national archive ARKEON database (including digital data, images, raw volume scans, together with selected GIF images and metadata, for both stations and radar) and at CMC's Central File Server archive (for radar). Additionally, the Climate Hardcopy archive and the Climate Historical archive database also store station images, microfilms, station information, and further data. Challenges related to data archiving include the need for centralized storage for technical information and improved documentation pertaining to instrumentation accuracy.
One of the key user requirements is the metadata availability and accessibility. Presently, ECCC has multiple internal and incomplete metadata resources; the availability of observations’ metadata is difficult and limited even within ECCC. Real-time metadata databases are only partially updated. The DMS has its own metadata repository used for daily tasks. In ECCC the new Metadata Repository (MR) database and web application project was initiated in 2014 with the objective of storing and managing metadata and also of mirroring other internal information sources, and making it accessible to clients. The MR project is under development and the planned first phase operational release is scheduled for April 2018. As part of this new release all ECCC and third-party station metadata will be gradually transferred to the MR.
Metadata for Canadian weather radars is maintained by MSC's Radar and Upper Air Division. Most metadata, including radar hardware settings, are also included in the headers of the volume scans.
Station precipitation observations, related metadata, and products are distributed at different levels of detail and formats to the public, to external clients, and to the research community. The major public access point is ECCC's Weather Information website (http://weather.gc.ca/) including the equally popular Historical Climate Data Online page (http://climate.weather.gc.ca/) with over 3 million visits in 2015. For external clients, recent data are available on the ECCC DataMart (http://dd.weatheroffice.ec.gc.ca/) and the Aviation Weather (AvWx) (http://www.1144.ca/AvWx.aspx) external page for Aviation Weather Stations. For research, the internal ECCC Data Catalogue and the new external Government of Canada's Open Data Portal (http://open.canada.ca/data/en/dataset) contain specialized large datasets. Although the weather information website cannot handle mass downloads, this new Open Data Portal includes several processed and often adjusted rainfall and snowfall datasets for a large number of stations suitable for direct time series analysis. Special data and metadata are also available on request through ECCC's Climate Services Centre.
Production and distribution of national radar products are handled by CMC's Implementation and Operational Services (CMOI); CMOI is responsible for the operational support of automated forecasting and prediction systems at MSC and external clients. Data and customized products are generated and distributed by CMOI to the ECCC public weather website, ECCC GeoMet website, ECCC DataMart, and to operational NWP-based systems such as CaPA and the Integrated Nowcasting System (Landry et al., Citation2012).
In addition to the MSC networks, there are many other environmental monitoring networks operated by external organizations for specific purposes, such as the Community Collaborative Rain, Hail & Snow Network (CoCoRaHS) Canada (http://data.cocorahs.org/cocorahs/maps/?country=CAN), AgWeather Quebec (http://www.agrometeo.org/index.php), and CAPMoN. These observations are not currently integrated into ECCC datasets. As an example, the CoCoRaHS Canada (started in the United States but now has over 300 locations in Canada) network of volunteers working together to measure precipitation across the nation (https://www.cocorahs.org/canada.aspx) is a valuable addition to the available networks. The MSC has recognized the need to work in cooperation with other data providers to enhance the department's ability to increase the overall availability of weather and climate data for all users. The NoN collaborative and multi-participant approach was introduced in the 2010s to encourage participants to share and improve the quality of data and facilitate this process for the benefit of all involved.
Finally, there are many more precipitation observations that are recorded but not incorporated into any of the aforementioned systems. For example, historical TBRG records and other paper weather forms are valuable to a wide range of clients, such as climate, various research areas, case studies, assessments, and engineering design, but they have not been digitized to date.
6 Summary
Precipitation at the surface is one of the most important parameters from a meteorological observing system. It is also extremely challenging to measure because of its high spatial variability and the many forms in which precipitation can occur. In this overview we have reviewed the systems used by ECCC to acquire, process, archive, and distribute Canadian precipitation data. Precipitation accumulation, precipitation intensity, precipitation type, rainfall, snowfall, and radar reflectivity were discussed in detail. Other precipitation-related parameters and satellite-based observations were out of the scope of this paper. This review was written with the end user in mind; therefore, it includes details that help users understand the applied methodologies and limitations of precipitation observations.
The three main categories of ECCC operational networks were described: automatic, manual observing stations, and radar. A clear distinction was made between automatic weather stations operated by ECCC, volunteer climate stations, and the networks operated by partner agencies (e.g., NAV CANADA, provinces of Alberta and Quebec) that report their observations to ECCC. Maps and detailed summaries were provided for each category.
The precipitation-related user communities and application areas were summarized at international and national scales. User needs and requirements have been captured by WMO OSCAR and WIGOS surveys at the international level and by ECCC surveys within Canada. Gap analysis results using the Needs Index approach developed by ECCC's Network Design Unit were provided. Given the size of Canada and the highly variable nature of precipitation occurrence and intensity, the existing networks have substantial gaps for many applications. This study highlighted the need for increasing cooperation with other data providers (e.g., CoCoRaHS and NoNs), which would increase the overall availability of weather and climate data. Assessment of observational and data quality needs indicated that the availability of precipitation type and snowfall amount from in situ operational automatic stations managed by ECCC is very limited.
A historical review of instruments used throughout the networks was provided. The review highlighted the decreasing number of manual stations with long-term good quality records that are essential to ECCC's mandate to detect climate change.
To provide an overview of how the final data and products are created, a detailed description of data flow from data collection at the observing site (e.g., gauge-level software) to pre-archive processing, quality assurance, and archiving was provided. The standard configuration of ECCC's automatic stations was also described. The differences between automatic gauge and manual observation procedures were specifically explained. For the assessment of observation quality and precision, major surface instrument characteristics and operational mechanisms were included. A parallel view was given of the radar system. The major data and metadata distributors to the public, to external clients, and to research communities were also provided in this paper. This overview found that standardized procedures for installation, maintenance, and calibration of instruments across the network could help ensure a more consistent level of data quality.
Furthermore, precipitation has a level of uncertainty at the source due to the weather-dependent errors associated with individual instrument performance (e.g., wind-induced error, freezing conditions, and spatial variability) especially for solid precipitation. Climate and gauge-dependent catch efficiency algorithms using wind, supplementary instruments, and temperature compensation can be developed that require appropriate additional sensors installed close to the precipitation sensors. Additional information from auxiliary optical or other sensors to distinguish precipitation type would allow further improvements in catch efficiency correction.
The Data Management System, which is ECCC's crucial program platform used for real-time data assessment and product generation, was described in detail. To facilitate the overall precipitation data quality assessment, each observation's distinct path set by instrument-dependent rules and algorithms within the DMS was summarized; the DMS is continuously evolving. For both surface instruments and weather radar, work is underway to better assess uncertainties in precipitation estimates, to identify gaps, and to make data-quality-related information available to users. Improved and sustained access to data and metadata from all networks operated by internal and external organizations should also be a primary focus. The ongoing Metadata Repository project at ECCC aims to gradually resolve this issue.
A number of plans to utilize radars for improved QPE have been formulated by ECCC. These include a move to dual-polarization technology and a reduction in radar collection cycles from ten to five or six minutes. There is work underway to increase granularity of quality estimates to more clearly distinguish between immeasurably small signals, rejected data, and missing data, together with the dynamic estimation of the quality of the rain estimate in each pixel at a specific time. It is hoped to broaden the use of non-radar measurements, such as precipitation gauge observations, in radar-based QPE analysis.
One potential way to increase precipitation coverage over Canada's more remote areas could be satellite mission integration employing passive and active technologies for precipitation measurements from space. This approach will require improvements in technology and processing to meet Canadian requirements and an international commitment to ongoing operational instruments.
Supplemental data
Supplemental data for this article can be accessed at https://dx.doi.org/10.1080/07055900.2018.1433627.
Acknowledgements
The authors wish to acknowledge Dale Boudreau for his contribution to pre-archive processing and Kim Gravelle from the Surface Weather and Aviation Network, who contributed to the improved network descriptions. Further, the authors are grateful to the two anonymous reviewers for their helpful comments and suggestions that have helped improve the manuscript.
Disclosure statement
No potential conflict of interest was reported by the authors.
ORCID
Eva Mekis http://orcid.org/0000-0002-2011-2400
References
- AES. (1971). CMS rain gauge type B (non-recording) (1st ed.). Instrument manual 43.
- AES. (1981). Tipping bucket rain gauge system, TM 04-01-03. Toronto: Environment Canada. Retrieved from ftp://132.156.10.144/ad/EMS/Anita/MSCreports/msc/TM04-01-03%28E%29%20tbrg.pdf
- AgWeather. (2017). AgWeather Quebec. Retrieved from http://www.agrometeo.org/index.php
- Burrows, W. R., & Kochtubajda, B. (2010). A decade of cloud-to-ground lightning in Canada: 1999–2008. Part 1: Flash density and occurrence. Atmosphere-Ocean, 48, 177–194. doi: 10.3137/AO1118.2010
- Chen, Y. C., Wei, C., & Yeh, H. C. (2008). Rainfall network design using kriging and entropy. Hydrological Processes, 22, 330–346.
- Cheng, V. Y., Arhonditsis, G. B., Sills, D. M., Auld, H., Shephard, M. W., Gough, W. A., & Klaassen, J. (2013). Probability of tornado occurrence across Canada. Journal of Climate, 26(23), 9415–9428. doi: 10.1175/JCLI-D-13-00093.1
- Colli, M., Lanza, L. G., Rasmussen, R., & Thériault, J. M. (2016a). The collection efficiency of shielded and unshielded precipitation gauges. Part I: CFD airflow modeling. Journal of Hydrometeorology, 17(1), 231–243. doi: 10.1175/JHM-D-15-0010.1
- Colli, M., Lanza, L. G., Rasmussen, R., & Thériault, J. M. (2016b). The collection efficiency of shielded and unshielded precipitation gauges. Part II: Modeling particle trajectories. Journal of Hydrometeorology, 17(1), 245–255. doi: 10.1175/JHM-D-15-0011.1
- Colli, M., Rasmussen, R., Thériault, J. M., Lanza, L. G., Baker, C. B., & Kochendorfer, J. (2015). An improved trajectory model to evaluate the collection performance of snow gauges. Journal of Applied Meteorology and Climatology, 54(8), 1826–1836. doi: 10.1175/JAMC-D-15-0035.1
- Dai, H., & Ye, M. (2015). Variance-based global sensitivity analysis for multiple scenarios and models with implementation using sparse grid collocation. Journal of Hydrology, 528, 286–300. doi: 10.1016/j.jhydrol.2015.06.034
- Devine, K. A., & Mekis, E. (2008). Field accuracy of Canadian rain measurements. Atmosphere-Ocean, 46(2), 213–227. doi: 10.3137/ao.460202
- Duchon, C. E. (2008). Using vibrating-wire technology for precipitation measurements. In S. Michaelides (Ed.), Precipitation: Advances in measurement, estimation and prediction. Berlin, Heidelberg: Springer. doi: 10.1007/978-3-540-77655-0_2
- Duchon, C. E., & Biddle, C. J. (2010). Undercatch of tipping-bucket gauges in high rain rate events. Advances in Geosciences, 25, 11–15. doi: 10.5194/adgeo-25-11-2010
- Durocher, Y. (2011). Deriving snowfall observations from the snow depth sensor for the Canadian Reference Climate Stations network (RCS). Environment Canada Internal document, Contract # KM044-10-1350. Downsview: Environment Canada.
- Environment Canada. (1996). Climate network rationalization (Internal Report). National Weather Services Directorate. Downsview: Environment Canada.
- Environment Canada. (2015). MANOBS (Manual of Surface Weather Observations). (7th ed.) ISBN: 978-1-100-25445-6, Downsview: Environment Canada.
- Environment and Climate Change Canada. (2016). Surface weather observation XML (SW-OB-XML): Client user guide. Retrieved from http://dd.weatheroffice.gc.ca/observations/doc/SWOB-ML_Product_User_Guide_v7.1_e.pdf
- Fischer, A. P. (2011). The measurement factors in estimating snowfall derived from snow cover surfaces using acoustic snow depth sensors. Journal of Applied Meteorology and Climatology, 50(3), 681–699. doi: 10.1175/2010JAMC2408.1
- Fortin, V., Roy, G., Donaldson, N., & Mahidjiba, A. (2015). Assimilation of radar quantitative precipitation estimations in the Canadian precipitation analysis (CaPA). Journal of Hydrology, 531, 296–307. doi: 10.1016/j.jhydrol.2015.08.003
- Goodison, B. E., Ferguson, H. L., & McKay, G. A. (1981). Comparison of point snowfall measurement techniques. In D. M. Gray, & M. D. Male (Eds.), Handbook of snow (pp. 200–210). Tarrytown, New York: Pergamon.
- Goodison, B. E., Louie, P. Y. T., & Yang, D. (1998). WMO solid precipitation measurement intercomparison–Final Report (Instruments and Observing Methods Report No.67 WMO/TD-No. 872). Geneva: World Meteorological Organization.
- Hydrological Services. (1994). Instruction manual tipping bucket raingauge model TB3 (Available from Hydrological Services PTY Ltd, PO Box 332, Liverpool, Australia).
- Joe, P., & Lapczak, S. (2002). Evolution of the Canadian operational radar network. In Proceedings of ERAD (pp. 370–382). EMS, Delft: Copernicus GmbH.
- Karimi-Hosseini, A., Bozorg Haddad, O., & Mariño, M. A. (2011). Site selection of raingauges using entropy methodologies. Water Management, 164(7), 321–333.
- Kochendorfer, J., Nitu, R., Wolff, M., Mekis, E., Rasmussen, R., Baker, B., … Yang, D. (2017). Analysis of single-Alter-shielded and unshielded measurements of mixed and solid precipitation from WMO-SPICE. Hydrology and Earth System Sciences, 21(7), 3525–3542. doi: 10.5194/hess-21-3525-2017
- Kochendorfer, J., Rasmussen, R., Wolff, M., Baker, B., Hall, M. E., Meyers, T., … Leeper, R. (2017). The quantification and correction of wind-induced precipitation measurement errors. Hydrology and Earth System Sciences, 21(4), 1973–1989. doi: 10.5194/hess-21-1973-2017
- Lamb, H. H. (2009). Temperature correction algorithm for Geonor weighing gauge with three transducers. In Proceedings of eighth symposium on the urban environment. Phoenix, AZ: American Meteorological Society. Retrieved from https://ams.confex.com/ams/pdfpapers/148618.pdf
- Landry, C., Deschenes, J.-F., Huang, L., Isaac, G., Nguyen, L. C., Talbot, D., & Talbot, J.-P. (2012). INCS: Integrated Nowcasting System. 3rd WMO international symposium on nowcasting and very-short range forecasting (Rio de Janeiro, Brazil, 6-10 August). Retrieved from http://www.labhidro.iag.usp.br/wsn12/papers/for13.pdf
- Mahfouf, J. F., Brasnett, B., & Gagnon, S. (2007). A Canadian Precipitation Analysis (CaPA) project: Description and preliminary results. Atmosphere-Ocean, 45(1), 1–17. doi: 10.3137/ao.v450101
- Mekis, E. (2005). Adjustments for trace measurements in Canada. In Proceedings, 15th Conference on Applied Climatology (pp. 20–24). Savannah: American Meteorological Soc. Retrieved from https://ams.confex.com/ams/pdfpapers/92155.pdf
- Mekis, E., & Brown, R. (2010). Derivation of an adjustment factor map for the estimation of the water equivalent of snowfall from ruler measurements in Canada. Atmosphere-Ocean, 48(4), 284–293. doi: 10.3137/AO1104.2010
- Mekis, E., & Hogg, W. D. (1999). Rehabilitation and analysis of Canadian daily precipitation time series. Atmosphere-Ocean, 37(1), 53–85. doi: 10.1080/07055900.1999.9649621
- Mekis, E., & Vincent, L. A. (2011). An overview of the second generation adjusted daily precipitation dataset for trend analysis in Canada. Atmosphere-Ocean, 49(2), 163–177. doi: 10.1080/07055900.2011.583910
- Metcalfe, J. R., Routledge, B., & Devine, K. (1997). Rainfall measurement in Canada: Changing observational methods and archive adjustment procedures. Journal of Climate, 10(1), 92–101. doi: 10.1175/1520-0442(1997)010<0092:RMICCO>2.0.CO;2
- Milbrandt, J. (2014). Technical note for the High Resolution Deterministic Prediction System 4.0.0 (Tech. Report). Downsview: Environment Canada.
- Milewska, E. J., & Vincent, L. A. (2016). Preserving continuity of long-term daily maximum and minimum temperature observations with automation of reference climate stations using overlapping data and meteorological conditions. Atmosphere-Ocean, 54(1), 32–47. doi: 10.1080/07055900.2015.1135784
- NavCan. (2016a). Navigation Canada automated weather observation system components. Retrieved from http://www.navcanatm.ca/en/navcanmet/awos.aspx
- NavCan. (2016b). Navigation Canada human weather observation system components. Retrieved from http://www.navcanatm.ca/en/navcanmet/hwos.aspx
- Nazaripour, H., & Daneshvar, M. R. M. (2017). Rain gauge network evaluation and optimal design using spatial correlation approach in arid and semi-arid regions of Iran. Theoretical and Applied Climatology, 129(3-4), 1255–1261. doi: 10.1007/s00704-016-1853-3
- Ndiritu, J. (2013). Using data-derived perturbations to incorporate uncertainty in generating stochastic areal rainfall from point rainfall. Hydrological Sciences Journal, 58(8), 1704–1717. doi: 10.1080/02626667.2013.840726
- Nitu, R., & Wong, K. (2010). CIMO survey on national summaries of methods and instruments for solid precipitation measurement at automatic weather stations (WMO/TD-No. 1544). Geneva: World Meteorological Organization (WMO).
- OSE MSC Engineering Bulletin. (2015a). Automated weather stations (AWS), surface weather network Pluvio1 Gauge: Operational recommendations (Technical Report). Downsview: Environment Canada.
- OSE MSC Engineering Bulletin. (2015b). Surface weather network: Precipitation gauge charge recommendations for use in automated weather stations (AWS), precipitation gauge charge summary, July 15, 2015 (Technical Report). Downsview: Environment Canada.
- OTT. (2015). Technical description: Rain gauge Pluvio with pulse output. 70.010.001.T.E. 02-1003. Retrieved from http://www.fondriest.com/pdf/ott_pluvio_manual.pdf
- Peterson, T., Daan, H., & Jones, P. (1997). Initial selection of a GCOS surface network. Bulletin of the American Meteorological Society, 78(10), 2145–2152. doi: 10.1175/1520-0477(1997)078<2145:ISOAGS>2.0.CO;2
- Putthividhya, A., & Tanaka, K. (2012). Optimal rain gauge network design and spatial precipitation mapping based on geostatistical analysis from co-located elevation and humidity data. International Journal of Environmental Science and Development, 3(2), 124–129. doi: 10.7763/IJESD.2012.V3.201
- Rasmussen, R., Baker, B., Kochendorfer, J., Meyers, T., Landolt, S., Fischer, A. P., … Smith, C. (2012). How well are we measuring snow: The NOAA/FAA/NCAR winter precipitation test bed. Bulletin of the American Meteorological Society, 93(6), 811–829. doi: 10.1175/BAMS-D-11-00052.1
- Saaty, T. L. (1990). How to make a decision: The analytic hierarchy process. European Journal of Operational Research, 48(1), 9–26. doi: 10.1016/0377-2217(90)90057-I
- Seo, D. J., Siddique, R., & Ahnert, P. (2014). Objective reduction of rain gauge network via geostatistical analysis of uncertainty in radar-gauge precipitation estimation. Journal of Hydrologic Engineering, 20(4), 04014050 1–13. doi: 10.1061/(ASCE)HE.1943-5584.0000969
- Sevruk, B., & Klemm, S. (1989). Types of standard precipitation gauges. In Proceedings of international workshop on precipitation measurement (Vol. 227236, pp. 227–236). St. Moritz: WMO/IAHS/ETH.
- Shaghaghian, M. R., & Abedini, M. J. (2013). Rain gauge network design using coupled geostatistical and multivariate techniques. Scientia Iranica, 20(2), 259–269.
- Strangeways, I. (2007). Precipitation: Theory, measurement and distribution. New York: Cambridge University Press.
- Thériault, J. M., Rasmussen, R., Ikeda, K., & Landolt, S. (2012). Dependence of snow gauge collection efficiency on snowflake characteristics. Journal of Applied Meteorology and Climatology, 51(4), 745–762. doi: 10.1175/JAMC-D-11-0116.1
- Thériault, J. M., Rasmussen, R., Petro, E., Trépanier, J. Y., Colli, M., & Lanza, L. G. (2015). Impact of wind direction, wind speed, and particle characteristics on the collection efficiency of the double fence intercomparison reference. Journal of Applied Meteorology and Climatology, 54(9), 1918–1930. doi: 10.1175/JAMC-D-15-0034.1
- Vivekanandan, N., & Jagtap, R. S. (2012). Evaluation and selection of rain gauge network using entropy. Journal of the Institution of Engineers (India): Series A, 93(4), 223–232. doi: 10.1007/s40030-013-0032-0
- WMO. (1966). Climatic change (Technical Note No. 79, Report of a Working Group of the Commission for Climatology. World Meteorological Organization, WMO - No. 195. TP. 100). Geneva.
- WMO. (1986). Guidelines on the selection of Reference Climatological Stations (RCSs) from the existing climatological station network (World Meteorological Organization, World Climate Programme series, WCP-116, WMO/TD-No. 130). Geneva.
- WMO. (1992). International meteorological vocabulary (2nd ed.). WMO No.182. Geneva: World Meteorological Organization.
- WMO. (2008). Guide to hydrological practices (WMO No. 168). Geneva: World Meteorological Organization.
- WMO. (2015). WIGOS metadata standard manual, Resolution 26; Attachment to Appendix 2.4, World Meteorological Organization, WMO No.1157, Geneva (pp. 370–448).
- WMO. (2018a). OSCAR: List of all requirements. Retrieved from http://www.wmo-sat.info/oscar/requirements
- WMO. (2018b). Welcome to OSCAR. Retrieved from http://www.wmo-sat.info/oscar/
- WMO. (2018c). Rolling review of requirements. Retrieved from http://www.wmo.int/pages/prog/www/OSY/GOS-RRR.html
- WMO. (2018d). WMO Integrated Global Observing System (WIGOS). Retrieved from https://www.wmo.int/pages/prog/www/wigos/index_en.html
- Wolff, M. A., Isaksen, K., Petersen-Øverleir, A., Ødemark, K., Reitan, T., & Brækkan, R. (2015). Derivation of a new continuous adjustment function for correcting wind-induced loss of solid precipitation: Results of a Norwegian field study. Hydrology and Earth System Sciences, 19(2), 951–967. doi: 10.5194/hess-19-951-2015
- Wong, K. (2012). Performance of several present weather sensors as precipitation gauges (WMO TECO, pp. 16–18). Retrieved from https://www.wmo.int/pages/prog/www/IMOP/publications/IOM-109_TECO-2012/Session1/P1_30_Wong_Performance_Wx_Sensors_Precip_Gauges.pdf
- Xu, H., Xu, C. Y., Sælthun, N. R., Xu, Y., Zhou, B., & Chen, H. (2015). Entropy theory based multi-criteria resampling of rain gauge networks for hydrological modelling–A case study of humid area in southern China. Journal of Hydrology, 525(1), 138–151. doi: 10.1016/j.jhydrol.2015.03.034
- Yang, D. (2014). Double fence intercomparison reference (DFIR) vs. Bush gauge for “true” snowfall measurement. Journal of Hydrology, 509, 94–100. doi: 10.1016/j.jhydrol.2013.08.052
Appendix A: Automated precipitation gauge characteristics
This section contains a description of the operational automatic gauge instruments and their installation at ECCC's SWCN and NAV CANADA's Aviation Monitoring Network. also includes further instrument-dependent processing characteristics, such as sampling and processing times completed at the site before the output fields are generated.
Table A1. Automated precipitation gauge configurations, installation, and processing characteristics at ECCC's SWCN and NAV CANADA's Aviation Monitoring Network. * indicates that the instrument platform can be much higher depending on typical snow cover. P stands for precipitation.
The Geonor T-200B weighing gauge operates using a bucket and tray load suspended by three vibrating wire transducers (Duchon, Citation2008). The load and equivalent precipitation accumulation is calculated from the frequency of vibration for each transducer with quadratic frequency dependence between the vibrating frequency and the applied load. Each transducer is provided with three calibration constants for deriving the equivalent precipitation from the measured transducer frequency. The gauge is securely mounted on a Geonor pedestal to limit the influence of wind-induced vibrations. Each vibrating wire transducer is sampled periodically: every five seconds for five minutes out of every 15 minutes. The outputs from the datalogger are raw weight, filtered weight, and total precipitation amounts for each of the three vibrating wire transducers.
The similarly shaped OTT Pluvio1 precipitation gauge operates by measuring the bucket load transferred through a load transfer mechanism to a load cell (OTT, Citation2015). An internal processor produces a pulse output for each 0.1 mm increase in precipitation accumulation. The gauge is securely mounted to reduce wind-induced vibrations of the gauge. The sensor's 0.1 mm pulses are sampled once every five seconds and the number of pulses is summed to calculate the 15- and 60-minute total precipitation. The accumulated precipitation and intensity are generated for each interval.
The F&P/Belfort gauge is also a weighing-type gauge in which the weight of the rainfall caught by a bucket is converted into a potentiometer resistance. The gauge continuously weighs the bucket content and records the data on a punched paper tape or on a paper chart recorder. The weighing gauge is sampled once every five seconds and the accumulated precipitation and intensity is generated for each 15- and 60-minute interval.
Weighing gauges are charged annually (or as required) with a mixture of propylene glycol, methanol, and oil to prevent freezing of the bucket mixture and prevent evaporation over time. When the precipitation level approaches the gauge capacity, the bucket must be emptied and the gauge recharged. During maintenance activities the gauge and tray level are verified using a known precipitation load. Additionally, the bucket clearance is verified with the transducer wires.
The Hydrological Services TB3 tipping bucket consists of a 200 mm receiver, a funnel, a filter, a syphon, and a bucket mechanism. Precipitation captured within the funnel drains through the filter and syphon into the bucket mechanism that tips back and forth as each side fills with water. Buckets can be either metal or plastic. Each tip corresponds to 0.2 mm of precipitation. The precipitation intensity is derived from the number of tips over a given period. The TB3s are quite sensitive and they feature low friction sealed roller bearings and magnetically activated mercoid switches. Maintenance activities for the TB3 tipping bucket include cleaning debris captured in the funnel and filter, levelling the gauge, setting the bucket mechanism stops, and field-verifying the gauge performance.
The TBRGs operated at NAV CANADA Aviation Monitoring network sites have similar basic operational characteristics but are installed with a small Single Alter wind shield around the gauge. These gauges are heated to extend their operation into the cold seasons. The recorded sampling time of the tipping bucket rain gauge is again five seconds; however, 1- and 60-minute segments are created for processing.
The Vaisala PWD22 present weather detector for the NAV CANADA network is used primarily to report precipitation type at airport locations. The PWD22 detects the presence or absence of precipitation and estimates type and intensity. More specifically the PWD22 combines a forward scattering meter, a capacitive rain sensor, and a temperature sensor for determining precipitation type and rate. The PWD22 emits infrared light and measures scattered light in a sample volume. Hydrometeors that fall through the sample volume cause peaks in the optical signal and these peaks are analyzed by calculating amplitude change distribution. By analyzing the amplitudes of the peaks, the precipitation rate can be calculated. The reported types include rain, freezing rain, drizzle, freezing drizzle, mixed rain and snow, snow, ice pellets, and unknown precipitation. The sampling time is five seconds with a 1-minute processing time. As output, precipitation type and precipitation intensity are provided every ten minutes. Additionally, one- and ten-minute outputs of average visibility are delivered.
The Campbell Scientific SR50/SR50A ultrasonic snow depth sensor determines distance to a target by sending ultrasonic pulses and listening for an echo. The response area is within a 30° beam angle from the central axis with the sensor generally responding to the closest target to the sensor (i.e., it does not measure the mean height within the response area). Snow depth is calculated by subtracting the measured distance to the snowpack from the installation height. The sensor must be installed at a sufficient distance from the mounting post such that it does not interfere with the conical ultrasonic measurement beam and at a height such that the minimum distance to the snowpack is greater than 1 m. The speed of the ultrasonic pulse through the air varies with temperature and can be corrected with an air temperature measurement. For the arrangement of three SR50A ultrasonic snow depth sensors: sensor 1 is sampled every five seconds while sensors 2 and 3 are sampled alternately for five seconds. As output, the average over five minutes is generated for each of the three sensors and intervals.
Several combinations of gauge and wind shield configurations are used across the Canadian network. Precipitation gauges in the MSC network are installed with Single Alter or Tretyakov shields to improve their catch efficiency, particularly for solid precipitation during periods of high winds (Goodison et al., Citation1998).
Appendix B: Manual precipitation gauge characteristics
This section contains a description of operational manual gauges, installation, and major processing characteristics at ECCC's SWCN.
At volunteer climate and HWOS aviation stations the human observer typically measures rain using the 270 mm capacity manual Type B rain gauge mounted relatively low at 40 cm above the ground to reduce the effect of wind on gauge catch (). For the Type B gauge, the rainfall amount can be read directly from the container graduate then poured out.
Snowfall is measured using a traditional snow ruler and Weaverboard (if available). The snow ruler is made of wood or iron, is 1 m long, and is marked in centimetres and fifths (i.e., to the nearest 0.2 cm). The 40 cm dowel is mounted perpendicular to the base of the Weaverboard's centre for the purpose of ease of locating and lifting it out of the snowpack. After the snowfall measurement has been recorded, the measurement area is swept clean to ensure that the next new snowfall can be recorded accurately. The measurements are made at several points that appear representative of the immediate area and then averaged (Environment Canada, Citation2015).
Table B1. Manual precipitation gauge configurations, installation, and processing characteristics at ECCC's SWCN.
The Nipher gauge can be used to measure snowfall manually during winter. This can include mixed precipitation and occasionally rainfall. It is the standard manual instrument for measuring fresh snowfall water equivalent at approximately 100 stations in Canada (as of 2016). The Nipher gauge is installed 152 cm above the surface, and the measurement is obtained by melting the snow that falls into its receiver. The curvature of the receiver is completely surrounded by an aluminum exponential horn that deflects lateral airflow downward. For the Nipher gauge the snow is melted first then poured into a graduate to record the water equivalent of the freshly fallen snow.
The sampling times taken by human observers are regulated by each network: typically once or twice daily for the CCN or more often for aviation locations. The required precision is 0.1 mm for rain and 0.1 cm for snow. The weather observers at NC HWOS stations use Type B and/or Nipher gauges and report accumulated rain, snow, and/or total precipitation at 6-hourly intervals.
Appendix C: Radar characteristics
The Canadian weather radar operational network consists of 31 C-band radars and one S-band radar. The CWRN C-band radars () have nearly identical scanning strategies, signal processing (from Vaisala), and post-processing, but the antennas and towers differ, which leads to differing angular resolutions and sensitivities. Apart from two dual-polarized radars in development mode, the network measures reflectivity and radial Doppler velocity. In some scans the reflectivities are Doppler corrected, whereby radial velocity information is used to separate echo power into fractions from moving and unmoving targets. On the assumption that the unmoving component is from ground clutter (e.g., trees, hills, and buildings), it can be subtracted when the interest is meteorological targets. There are two limitations of Doppler clutter removal: some non-meteorological targets are not removed, such as birds and insects, as well as clutter from waves on water, or moving vehicles, and successful recovery of the moving component is only possible if its power is not overwhelmed by the stationary component. Depending on the exact configuration, the weather is not detectible when its received power is much less than 1% of the power from clutter. In practice this means that in some locations only moderate-to-strong precipitation can be detected and the effective sensitivity is lower than the electronic sensitivity of the radar at that range. In addition, in areas where the radial velocity of the meteorological targets is near-zero the system can erroneously assign some meteorological signal to clutter.
Antennas of the ECCC C-band radars have three sizes, which provide different angular beam widths: 11 radars with antennas from Andrews (98A) with 0.62-degree beams, 18 radars with antennas from Enterprise or Ratheon (98E/R) with 1.1-degree beams, and one older Enterprise antenna with a 1.63-degree beam (). The beam width, in combination with local terrain, determines the lowest angle used at each site, with lower angles possible for narrow beams. Because precipitation tends to be shallower in summer than in winter, lower angles are used in the cold season at most radars. The contract S-band radar at McGill University has a 0.85-degree beam. The S-band NEXRAD radars have 0.95-degree beam widths and lowest elevations at 0.5 degrees. The longer 10 cm wavelength provides better penetration of heavy precipitation.
Calibration of the ECCC radars is done electronically by measuring outgoing power before the antenna and by injecting known signals into the receiver chain. There is no direct comparison to external targets. Pointing of the antennas is verified using the known location of the sun. Various statistics on radar hardware subcomponents are collected regularly for hardware monitoring and automated warning reports are issued if various parameters go beyond the acceptable range.
Two ECCC radars have been upgraded to dual-polarization for assessment and research; however, operational processing does not yet exploit the extra information for precipitation products. The first step in using dual-polarization will likely be for QC of reflectivity data and then it will be used explicitly in precipitation rate estimation.
Currently, ECCC radars operate and provide data on a ten-minute cycle from which reflectivity and intensity products are created. The time series of precipitation estimates is a series of snapshots of 0.1 s averages at a spatial scale on the order of approximately 1 km × 1 km. The McGill radar has a hybrid five-minute scan, and US NEXRAD scan patterns vary from five to twelve minutes depending on the type of weather.