
 ?Mathematical formulae have been encoded as MathML and are displayed in this HTML version using MathJax in order to improve their display. Uncheck the box to turn MathJax off. This feature requires Javascript. Click on a formula to zoom.
ABSTRACT
This study investigates the response of the subtropical gyre circulation in the North Pacific Ocean to quadrupled CO2 using the Community Earth System Model, version 1 (CESM1). In particular, an overriding technique is applied to isolate and quantify the effects of wind stress and thermal warming caused by CO2 emissions. Results show that, in response to the increase in CO2, the total mass transport in the subtropical gyre is reduced by approximately 11%. This reduction results mainly from negative anomalies of the wind stress curl over the subtropical region, with a smaller contribution from the thermal warming effect. Furthermore, a detailed analysis finds that the change in the subtropical gyre is baroclinic in nature [i.e., the gyre appears to be spin-up in the upper ocean (above 300 m) but spin-down in the lower thermocline (from 300 to 1500 m)]. This reversal between the upper ocean and lower thermocline is a result of the thermal warming effect, which intensifies ocean stratification, hindering the transfer of momentum from the upper layers to the lower layers and leading to an acceleration of the gyre in the upper ocean but a deceleration in the lower thermocline. Another feature of the response of the subtropical gyre to quadrupled CO2 is the respective poleward and equatorward movements of its northern and southern boundaries, which is a result of the change in the zero wind stress curl lines.
Résumé
[Traduit par la rédaction] Nous examinons dans cette étude la réaction de la circulation subtropicale du tourbillon de l’océan Pacifique Nord au quadruplement du CO2, et ce, à l’aide de la version 1 du modèle communautaire du système terrestre (CESM1). Notamment, nous appliquons une technique qui isole et quantifie les effets de la tension du vent et du réchauffement thermique que causent les émissions de CO2. Les résultats montrent qu’en réaction à l’augmentation du CO2, le transport total de masse dans le tourbillon subtropical diminue d’environ 11%. Cette réduction résulte principalement d’anomalies négatives du rotationnel de la tension du vent dans la région subtropicale, avec une contribution moindre du réchauffement thermique. De plus, une analyse détaillée révèle que la modification du tourbillon subtropical est de nature barocline: le tourbillon semble être en surgyration dans le haut de l’océan (au-dessus de 300 m), mais en dégyration dans la thermocline inférieure (de 300 m à 1500 m). Cette inversion entre les couches supérieures de l’océan et la thermocline inférieure découle du réchauffement thermique, qui intensifie la stratification de la mer, et ainsi entrave le transfert de mouvement des couches supérieures vers les couches inférieures, entraînant une accélération du tourbillon dans les niveaux supérieurs, mais un ralentissement dans la thermocline inférieure. En outre, les limites nord et sud du tourbillon subtropical découlant de l’augmentation par un facteur quatre du CO2 se déplacent respectivement vers les pôles et vers l’équateur, en raison de la modification du contour du rotationnel nul de la tension du vent.
1 Introduction
Since the Industrial Revolution, the concentration of carbon dioxide (CO2) in the atmosphere has been rising steadily and will continue to rise in the foreseeable future (IPCC, Citation2014). Under increasing CO2, climate models have projected significant atmospheric and oceanic changes, including an extension of the Hadley circulation (Lu, Vecchi, & Reichler, Citation2007), a weakening of the Walker circulation (e.g., Held & Soden, Citation2006; Vecchi & Soden, Citation2007; Zhang & Song, Citation2006), a poleward shift of the jet stream and storm tracks (e.g., Lorenz & Deweaver, Citation2007; Yin, Citation2005), a series of responses of sea surface temperature (SST) and associated rainfall that includes surface-warming patterns with the weakest warming occurring over the southeastern subtropics, maximum warming occurring along the equator, a banded SST structure over the northern subtropics and an equatorial maximum in SST warming with a band of pronounced rainfall increase (Xie et al., Citation2010), an enhancement of upper-ocean stratification (e.g., Capotondi, Alexander, Bond, Curchitser, & Scott, Citation2012; Cravatte, Delcroix, Zhang, McPhaden, & Leloup, Citation2009; Deser, Phillips, & Alexander, Citation2010), and an El Niño-like SST warming pattern in the equatorial Pacific (e.g., Luo, Lu, Liu, & Liu, Citation2015; van Oldenborgh, Philip, & Collins, Citation2005; Vecchi & Wittenberg, Citation2010).
Significant changes in the atmosphere–ocean system are also evident in the observations. For example, based on temperature profiles from the World Ocean Database 2001 (Conkright et al., Citation2002), Levitus, Antonov, and Boyer (Citation2005) found that the heat content of the world ocean (0–3000 m) increased from 1955 to 1998. One substantiated change in the atmosphere–ocean system during this warming period was an abrupt shift in its basic state over the North Pacific during the late 1970s (e.g., Deser, Alexander, & Timlin, Citation1996; Miller, Cayan, Barnett, Graham, & Oberhuber, Citation1994; Stephens, Levitus, Antonov, & Boyer, Citation2001; Zhang & Levitus, Citation1997). Studies have been conducted to elucidate the physical processes and mechanisms responsible for the climate shift (e.g., Deser et al., Citation1996; Latif & Barnett, Citation1994; McPhaden & Zhang, Citation2002; Miller et al., Citation1994; Wu, Lee, & Liu, Citation2005). Results show that the atmosphere played a dominant role in forcing the shift (via surface heat fluxes, entrainment, and advection by Ekman currents), while ocean circulation changes (e.g., the slowdown in the meridional overturning circulation in the upper Pacific Ocean since the 1970s) were found to have an additional effect on the shift. Further, some of the analyses suggest that the observed climate shift in the 1970s might have been caused by changes in external forcing superimposed on the natural variability of the Pacific climate system (Meehl, Hu, & Santer, Citation2009).
Given the climatic influence of the North Pacific subtropical oceanic gyre, it is crucial to know how the gyre will respond to climate warming. Previous studies have identified significant changes in the North Pacific Ocean in a warmer climate, including a shallower mixed-layer depth in most regions (Jang, Park, Park, & Yoo, Citation2011; Luo & Rothstein, Citation2011), a significant intensification of the SST annual cycle (Chen & Wang, Citation2015), a weakening of the subtropical countercurrent (Luo & Rothstein, Citation2011; Wang, Liu, Xu, & Xie, Citation2013; Xie, Xu, Liu, & Kobashi, Citation2011; Xu, Xie, & Liu, Citation2012; Xu, Xie, & Liu, Citation2013; Xu, Xie, Liu, & Kobashi, Citation2012), a northward shift of the Kuroshio Extension (KE), an overall slowdown in the subtropical gyre (Luo & Rothstein, Citation2011), and a weakening of the mode water (Li & Luo, Citation2016; Luo, Rothstein, & Zhang, Citation2009; Xu et al., Citation2013). Regarding the response of the subtropical gyre circulation, through an analysis of 11 climate models from the Coupled Model Intercomparison Project, phase 3 (CMIP3), Zhang, Church, Platten, and Monselesan (Citation2014) found that the North Pacific subtropical gyre is projected to spin down in the subsurface ocean because of the change in surface wind stress. However, by examining the CMIP5 solutions together with performing numerical experiments, Wang, Xie, Huang, and Chen (Citation2015) concluded that global warming induces an intensification of the subtropical gyre at the surface but a weakening in the lower thermocline, which is dominated by buoyancy flux change with little contribution from the wind stress effect. In short, the studies of Zhang, Church, et al. (Citation2014) and Wang et al. (Citation2015) found that the subtropical gyre circulation has a baroclinic response to global warming. Zhang, Church, et al. (Citation2014) attributed this to wind stress forcing; however, Wang et al. (Citation2015) concluded that this response is dominated by thermal forcing with little contribution from the wind stress effect. The overriding experiments in this study are designed to clarify the forcing mechanism responsible for the above baroclinic response.
In this study, we examine the response of the North Pacific Ocean subtropical gyre circulation to CO2 quadrupling using the National Center for Atmospheric Research’s (NCAR’s) Community Earth System Model, version 1 (CESM1), with a particular focus on the relative importance of changes in the surface wind stress and buoyancy flux for such a response. More specifically, an overriding technique is employed as a diagnostic tool to isolate and evaluate the role of wind stress change in the robust features of the gyre circulation changes in the North Pacific. This overriding technique has been used successfully to understand the formation processes for SST warming and thermocline shoaling in the tropical Pacific under climate warming scenarios (e.g., Liu, Luo, Lu, & Wan, Citation2017; Lu & Zhao, Citation2012; Luo, Liu, & Lu, Citation2018).
The paper is organized as follows. Section 2 describes the models and experiments. Section 3 presents the modelled oceanic changes in the subtropical North Pacific Ocean. Section 4 discusses the formation mechanisms of these changes, and Section 5 provides a summary.
2 Models and experiments
a Overriding Experiments with CESM1
The models and experiments used in this study are the same as those in Luo et al. (Citation2018). In detail, the CESM1 includes the latest version of the Community Atmosphere Model, version 5 (CAM5), the Community Land Model, version 4 (CLM4), and the Parallel Ocean Program, version 2 (POP2). The horizontal resolution of CAM5 and CLM4 is 1.9° latitude × 2.5° longitude, with 26 atmospheric layers in the vertical. The horizontal resolution of the ocean is a nominal 1°, telescoped meridionally to approximately 0.3° at the equator. Vertically, it has 60 uneven levels with the thickness varying from 10 m near the surface to 250 m at the bottom.
The CESM1 experiment consists of two baseline runs and three partially coupled runs (). The two baseline runs are the pre-industrial control (CTRL) run and the abruptly quadrupled CO2 (4×CO2) run, both of which are initialized from a long pre-industrial control run (available from NCAR) and integrated for 95 years. b shows changes in the wind stress and its curl under CO2 quadrupling. Consistent with previous climate model projections (e.g., Xie et al., Citation2010; Zhang, Church, et al., Citation2014) and CMIP5 simulations (a), the modelled wind changes over the North Pacific feature broad cyclonic wind stress curl changes over the subtropical North Pacific interior (between 20° and 35°N) and anticyclonic wind stress curl changes over the poleward edge of the subtropical gyre (about 35°–45°N). Through overriding the time series of surface wind stress saved from the baseline runs, three partially coupled runs (τ1c1, τ1c4, and τ4c4) are conducted to isolate and quantify the effect of the wind stress and the thermal warming effect of CO2 emissions (i.e., the effect resulting from buoyancy flux change). Specifically, the partially coupled runs are implemented using the following steps. We denote the fully coupled baseline runs as 1× for the CTRL run and 4× for the 4×CO2 run, and the overriding variables from these two runs are first output at the frequency of air–sea coupling (daily in the case of CESM1 (CAM5)). We consider two variables in this study: wind stress (τ) and CO2 (c). Next, a suite of overriding experiments () is implemented to isolate the effect of the variable we are interested in. For example, to isolate climate response without wind stress feedback, we repeated the 4×CO2 experiment but with the wind stress prescribed from the CTRL run. We name this overriding run τ1c4, denoting wind stress from 1× but the CO2 level from 4×.
Fig. 1 Changes in wind stress (vectors; N m−2) and its curl (coloured shading; 10−8 N m−3) under CO2 quadrupling with (a) CMIP5 model ensemble mean and (b) CESM1 (4×CO2 minus CTRL). A mean of model years 41–90 of each run is used for analysis.
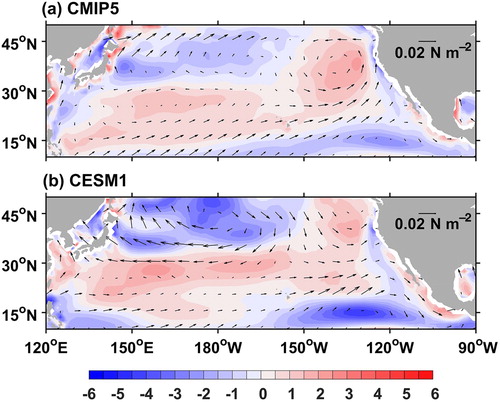
Table 1. CESM1 and POP2 experiments.
The overriding technique has the advantage of simulating the climate response without targeted feedbacks and processes. Ideally, the difference between the 4× and τ1c4 runs would produce the feedback effect of the wind stress change. However, the overriding τ1c4 run should not be compared directly with the fully coupled 4× run because the overriding of wind stress interferes with the natural coupling process and causes a drift in the model climate. To address the issue of climate drift caused by overriding, the 4× case needs to be rerun by prescribing the wind stress field as τ4× but intentionally shifted by one year (labelled τ4c4), with its time series being perturbed to interrupt the temporal coherence between the wind stress and the oceanic condition. An overriding τ4× run without the time shift would simply be a replication of the 4× run. This drift must be identified and excluded in the attribution of the relevant feedbacks, which can be achieved by comparing the overriding runs because the same drift induced by overriding is present in all such runs, and the difference between any two of them should eliminate the drift. For example, the wind stress effect in the quadrupled CO2 climate change simulations should be isolated through the operation (τ4c4 – 4×CO2) – (τ1c4 – 4×CO2), which is the same as τ4c4 – τ1c4. Therefore, the climate drifts, which should not be part of the response, are eliminated by the cancellation of drifts in both τ4c4 – 4×CO2 and τ1c4 – 4×CO2. Note that the time shift of the τ4× run can be either one year or any integer number of years. A shift of a few months is not an option because it would interrupt the seasonal cycle in the simulation. In the same way, an overriding rerun for the CTRL case is also conducted to form another overriding baseline called τ1c1. More details on the overriding technique can be found in Lu and Zhao (Citation2012) and Luo et al. (Citation2018).
In summary, the overriding method enables a linear decomposition of the total response to CO2 quadrupling in the fully coupled model into two additive components: one induced by the wind stress change (τ4c4 – τ1c4) and the other by thermal warming forcing of CO2 emissions (τ1c4 – τ1c1). In addition, the total climate response (4×CO2 – CTRL) can be replicated by the sum of two contributions (τ4c4 – τ1c1). The overriding experiments are integrated for 94 years, and a mean of model years 41–90 of each run is used for analysis. For each variable, the change is defined as the difference between the two corresponding experiments; for example, the wind stress change in is calculated by averaging the wind stress over model years 41–90 in the 4×CO2 run minus the same 50-year period average in the CTRL run. In addition, a Student’s t-test is performed to determine the significance of the changes, and the results show that the changes in each variable are generally statistically significant at the 99% confidence level. Note that the significance level is not shown in all figures for the sake of clarity except a.
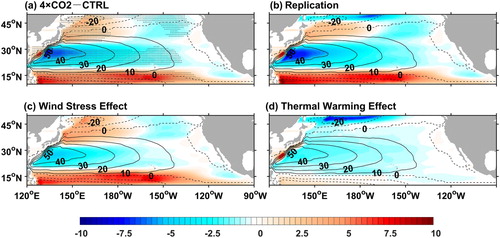
Fig. 2 Changes in the North Pacific subtropical total mass transport streamfunction (colour shading; 1 Sv = 106 m3 s−1) in the overriding experiments with CESM1: (a) total response (4×CO2 minus CTRL), (b) replication of total response (τ4c4 minus τ1c1), (c) wind stress effect (τ4c4 minus τ1c4), and (d) thermal warming effect (τ1c4 minus τ1c1). The black contours show the streamfunction distribution in the CTRL run. The mean of model years 41–90 of each run is taken for analysis. Stippling in (a) indicates significance at the 99% confidence level from a Student’s t-test.
b Warming Experiments with POP2
In order to further examine the response of the subtropical oceanic gyre to the surface warming alone, we restore the SST anomalies towards a uniform 3.2 K in the SST perturbation experiment with POP2. The value 3.2 K is the average of the global SST warming during years 100–150 in the abrupt 4×CO2 experiment using the Community Climate System Model, version 4 (CCSM4).
Specifically, the POP2 experiment includes two runs (). The control run (CTRL_POP) is forced by restoring the surface conditions towards climatology derived from the CCSM4 CMIP5 piControl experiment averaged over the nearly equilibrated last 100 years. The piControl is the pre-industrial control simulation, in which greenhouse gases (GHGs), aerosols, ozone, and solar irradiance are fixed at 1850. This simulation extends over 1000 years after a spin-up to ensure that the model has reached a quasi-equilibrium state except for the abyssal ocean. The perturbation run (PERT_POP) uses the same surface conditions as CTRL_POP except for a uniform restoration temperature anomaly of 3.2 K being added to the target temperature. The ocean-only experiments are integrated for 50 years, and a mean of model years 31–50 for each run is used for analysis.
3 Modelled oceanic changes in the subtropical North Pacific
a Total Mass Transport Streamfunction
To quantify changes in the North Pacific subtropical gyre circulation, we calculate the total mass transport streamfunction, which is defined as(1)
(1) The streamfunction is obtained by integrating meridional velocity
vertically from the bottom to the surface and zonally from the eastern to the western boundary; x and z are the zonal and vertical coordinates, respectively.
The dominant feature of the oceanic response in the North Pacific is a slowdown in the subtropical gyre circulation (a), with a decrease of 6 Sv (1 Sv = 106 m3 s−1) or 11% in the mass transport from 55 Sv in the CTRL run to 49 Sv in the 4×CO2 run. This result is consistent with climate model projections (e.g., Luo & Rothstein, Citation2011; Zhang, Church, et al., Citation2014) and the CMIP5 simulations. shows the response of the North Pacific subtropical total mass transport streamfunction to abruptly quadrupled CO2 in eight CMIP5 climate models and their ensemble mean. It is clear that the North Pacific subtropical gyre changes feature a remarkable slowdown in the subtropical gyre circulation in all the individual models. The full response in the subtropical gyre circulation is well reproduced in the overriding replication experiment (comparing b with a). The replication of the subtropical gyre circulation response to CO2 quadrupling can be decomposed further into the wind stress effect (c) and the thermal warming effect (d).
Fig. 3 Changes in the North Pacific subtropical total mass transport streamfunction (colour shading; 1 Sv = 106 m3 s−1) in response to quadrupled CO2 from eight individual CMIP5 models [CCSM4, Centre National de Recherches Météorologiques Coupled Global Climate Model, version 5 (CNRM-CM5), Commonwealth Scientific and Industrial Research Organization-Mark 3.6.0 (CSIRO-Mk3.6.0), Geophysical Fluid Dynamics Laboratory-Earth System Model, version 2G (GFDL-ESM2G), Geophysical Fluid Dynamics Laboratory-Earth System Model, version 2M (GFDL-ESM2M), Goddard Institute for Space Studies Model E2, coupled with the Russell ocean model (GISS-E2-R), Hadley Centre Global Environmental Model, version 2, with an Earth System component (HadGEM2-ES), and L’Institut Pierre-Simon Laplace Coupled Model, version 5A, medium resolution (IPSL-CM5A-MR)] and their ensemble mean. A mean of model years 41–90 of each run is used for analysis.
![Fig. 3 Changes in the North Pacific subtropical total mass transport streamfunction (colour shading; 1 Sv = 106 m3 s−1) in response to quadrupled CO2 from eight individual CMIP5 models [CCSM4, Centre National de Recherches Météorologiques Coupled Global Climate Model, version 5 (CNRM-CM5), Commonwealth Scientific and Industrial Research Organization-Mark 3.6.0 (CSIRO-Mk3.6.0), Geophysical Fluid Dynamics Laboratory-Earth System Model, version 2G (GFDL-ESM2G), Geophysical Fluid Dynamics Laboratory-Earth System Model, version 2M (GFDL-ESM2M), Goddard Institute for Space Studies Model E2, coupled with the Russell ocean model (GISS-E2-R), Hadley Centre Global Environmental Model, version 2, with an Earth System component (HadGEM2-ES), and L’Institut Pierre-Simon Laplace Coupled Model, version 5A, medium resolution (IPSL-CM5A-MR)] and their ensemble mean. A mean of model years 41–90 of each run is used for analysis.](/cms/asset/f1f97253-dca6-43c7-9e01-dede0eae8abd/tato_a_1666701_f0003_oc.jpg)
It is clear from c and d that both the wind stress and thermal warming effects contribute to the decrease in the mass transport in the subtropical gyre. For the wind stress effect, the decrease in the mass transport is induced by the positive anomalies of wind stress curl over the subtropical North Pacific (in the latitudinal band between 20° and 35°N), which is the signature of the wind response to CO2 quadrupling (b). It is intriguing that, without the wind change, the thermal warming effect (d) also produces a slowdown in the subtropical gyre, similar to that induced by the wind stress effect. This will be discussed further in Section 4.
b Zonal Velocity
shows changes in the zonal velocity averaged between 140° and 180°E. A remarkable response of the subtropical gyre features a northward shift of its northern boundary (i.e., the KE) and a southward shift of its southern boundary (i.e., the North Equatorial Current (NEC)). As the climate warms, the poleward expansion of the oceanic subtropical gyre in the North Pacific has been identified in both climate models (e.g., Saenko, Fyfe, & England, Citation2005; Zhang, Church, et al., Citation2014) and reanalysis products (Wu et al., Citation2012), which is consistent with the expansion of the Hadley circulation (e.g., Lu et al., Citation2007) and can be indicated as a northward movement of the zero wind stress curl line in the mid-latitudes (). Accompanying this change in current is a strong warming of the poleward flank of the temperature front associated with the KE (not shown). In contrast, the southward shift of the NEC is consistent with a southward movement of the zero wind stress curl line in the tropics (). The wind stress effect can reach approximately 1000 m depth.
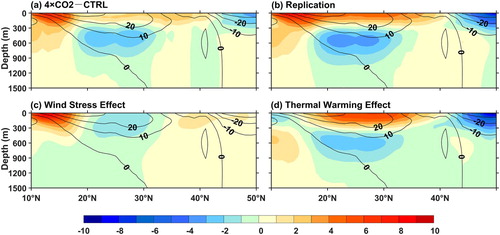
Fig. 4 Changes in zonal currents (colour shading, cm s−1) zonally averaged over 140°E–180° in the overriding experiments with CESM1: (a) total response (4×CO2 minus CTRL), (b) replication of total response (τ4c4 minus τ1c1), (c) wind stress effect (τ4c4 minus τ1c4), and (d) thermal warming effect (τ1c4 minus τ1c1). The superimposed black contours show the zonal velocity distribution in the CTRL run (solid lines for eastward and dashed lines for westward). The black (red) vertical lines in (a) indicate the average positions of the core of the KE and NEC, respectively, in the CTRL run (4×CO2). The position of the core of the KE (NEC) is defined as the latitude of the maximum westward (eastward) velocity averaged in the upper 250 m between 30° and 40°N (10° and 20°N). A mean of model years 41–90 of each run is used for analysis.
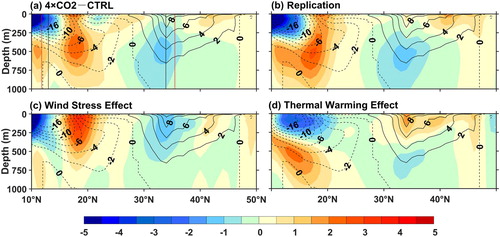
Fig. 5 Wind stress curl (N m−3) zonally averaged over the North Pacific basin for the CTRL run (black curve), CO2 quadrupling run (red curve), and changes between the CTRL and CO2 quadrupling runs (4×CO2 minus CTRL, blue curve). A mean of model years 41–90 of each run is used for analysis.
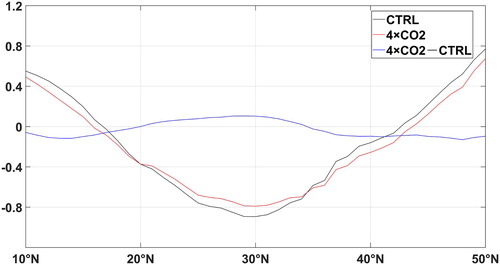
The response of the subtropical gyre’s boundaries can be understood as below. Under a warmer climate, the position of peak westerlies, or equivalently the latitudinal position of zero wind stress curl, shifts obviously poleward by about 1° (). According to the Sverdrup balance,(2)
(2) where v is the meridional flow velocity,
is the meridional transport, which is equal to the vertical integrate of v,
is density of sea water,
is the planetary vorticity gradient and
is the wind stress curl. The Sverdrup balance presents the relationship between the meridional flow velocity and wind stress curl. The poleward shift of the wind stress curl will induce a poleward expansion of the subtropical gyre. Similarly, the wind stress curl at low latitudes shifts southward, leading to the equatorward shift of the NEC (). Actually, here the Sverdrup balance is used to qualitatively explain how a movement of the zero wind stress line will shift the gyre boundary, and the degree of the gyre boundary’s shift may not match well with that of the zero wind stress line’s movement.
In contrast to the gyre’s expansion induced by the wind stress effect, the thermal warming effect produces an enhancement of the circulation over the upper ocean of approximately 300 m but a reduction in the circulation below 300 m (d).
c Regional Dynamic Height
In this section, we calculate the change in dynamic height (DH) to investigate the response of the vertical structure of the North Pacific subtropical gyre to CO2 quadrupling; DH is a frequently used parameter that can be calculated from water properties as follows (e.g., Zhang, Church, et al., Citation2014):(3)
(3) where p1 and p2 are two reference pressure levels (p2 is 2 × 10⁷ Pa in this study), S is salinity, T is temperature, p is pressure, and
is the specific volume anomaly:
(4)
(4) where
is the density, and DH has units of dynamic metres (1 dyn m = 10 m2 s−2). It is very convenient to use the DH for studying dynamic topography at different depths. To focus on the spatial distribution, regional means (depth-dependent space average in the North Pacific basin in the area bounded by 10°–60°N and 120°E–90°W) are removed from the DH fields at each depth. In the following, we call this Regional DH (RDH). In the northern hemisphere, the flow direction around the high value centre of RDH is clockwise, and the geostrophic velocity is large where RDH isolines are dense.
Changes in zonal averaged RDH across the North Pacific Ocean are shown in . It is clear that the RDH over the subtropical region features a positive change from the surface to approximately 300 m and a negative change from 300 m to approximately 1500 m (a and b). This indicates that, under CO2 quadrupling, the subtropical gyre is projected to spin up in the upper ocean but spin down in the lower thermocline. The overriding experiments indicate that this vertical feature of the RDH change in the total response is mainly a result of the thermal warming effect, while the wind stress effect results in a negative change (i.e., the weakened gyre circulation) throughout the water column from the surface until about 1500 m depth (c).
Fig. 6 Changes in regional dynamic height change (dyn cm with reference to 2 × 10⁷ Pa) zonally averaged over the North Pacific basin in the overriding experiments with CESM1: (a) total response (4×CO2 minus CTRL), (b) replication of total response (τ4c4 minus τ1c1), (c) wind stress effect (τ4c4 minus τ1c4), and (d) thermal warming effect (τ1c4 minus τ1c1). The superimposed black contours show the distribution of RDH in the CTRL run. A mean of model years 41–90 of each run is used for analysis.
d Subtropical Gyre Circulation: Upper Ocean Versus Lower Thermocline
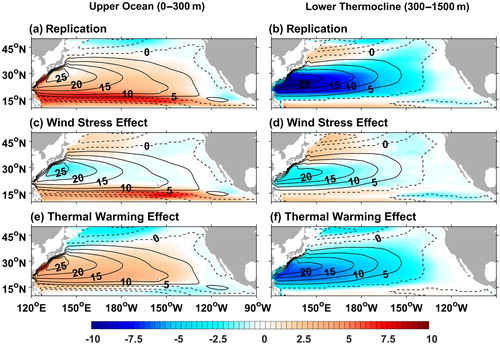
The results on the changes in the zonal currents and RDH have shown that CO2 quadrupling in the atmosphere induces an acceleration of the North Pacific subtropical gyre circulation in the upper ocean (shallower than 300 m) but a deceleration in the lower thermocline (from 300 to 1500 m) and that these changes result mainly from the thermal warming effect of CO2 emissions, while the wind stress change produces a slowdown in the gyre circulation from the surface to 1500 m. In this section, we discuss changes in the mass transport streamfunction in the upper and lower layers. Results from the fully coupled simulations show that, under CO2 quadrupling, the mass transport increases by 1.2 Sv or approximately 4% in the upper gyre (a) but decreases by 9.0 Sv or 30% in the lower gyre (b). Results from the overriding experiments indicate that this transport change is clearly dominated by the thermal warming effect, which induces an increase of 3.4 Sv in transport in the upper gyre (e) and a decrease of 6.5 Sv in the lower gyre (f), while the wind stress effect leads to a decrease in transport for both the upper and lower layers (c and d). Specifically, the wind stress change and thermal warming change explain roughly one-quarter and three-quarters of the total reduction in the transport in the lower thermocline, respectively (comparing d and f with b). In addition, these results highlight, once again, the dominant effect of thermal warming in the upper ocean of the subtropical gyre circulation under climate warming. This differs from the response of the upper ocean to climate warming in the tropics, for which the wind effect appears to be more important (e.g., Luo et al., Citation2015, Citation2018; Timmermann, Mcgregor, & Jin, Citation2010).
Fig. 7 Change in the North Pacific subtropical streamfunction (colour shading, 1 Sv = 106 m3 s−1) of the upper ocean (0–300 m, left column) and lower thermocline (300–1500 m, right column) in the overriding experiments with CESM1: (a) and (b) replication of total response (τ4c4 minus τ1c1), (c) and (d) wind stress effect (τ4c4 minus τ1c4), and (e) and (f) thermal warming effect (τ1c4 minus τ1c1). The black contours show the streamfunction distribution in the CTRL run. A mean of model years 41–90 of each run is used for analysis.
4 Forcing mechanism
Our experiments with the fully coupled CESM1 have indicated the remarkable changes in the North Pacific subtropical oceanic gyre under CO2 quadrupling, including (i) an overall slowdown in the gyre circulation, (ii) a northward shift of its northern boundary and a southward shift of its southern boundary, and (iii) an acceleration of the gyre in the upper ocean (shallower than 300 m) but a deceleration of the gyre in the lower thermocline (from 300 to 1500 m).
The first two changes can be understood as a direct response to the wind stress change. In more detail, the increase in CO2 induces positive anomalies of the wind stress curl over the North Pacific subtropical region, which leads to a decrease in the mechanical energy supply to the ocean circulation and thus a slowdown in the subtropical gyre circulation. Another signature of the response of the wind stress curl to the increase in CO2 is its zero line in the mid-latitudes (tropics) moving poleward (equatorward), which results in a northward (southward) shift of the KE (NEC).
However, the change in wind stress alone is not sufficient to explain the third change in the subtropical gyre circulation. With the help of the overriding experiments, we have identified that the reversal of the gyre in the upper ocean and lower thermocline is mainly a result of the effect of the thermal warming forcing (i.e., the change in buoyancy flux from the atmosphere to the ocean in the subtropical gyre of the North Pacific). In addition, the thermal warming effect also contributes to the overall slowdown in the subtropical gyre circulation.
Our findings on the baroclinic response to climate warming with a spin-up (spin-down) of the subtropical gyre in the upper ocean (lower thermocline) are consistent with previous theoretical and modelling studies. For example, Sun, Wu, and Qiu (Citation2013) examined the response of the inertial recirculation to intensified stratification due to global warming in a two-layer quasi-geostrophic ocean circulation model. Their modelling results showed that the transport increases (decreases) in the surface (bottom) layer. By exploring the potential vorticity dynamics of the recirculation, they found that the momentum transfer from the surface layer to the bottom layer is restrained because of the intensification of stratification; thus, the surface-layer recirculation develops both in size and in intensity, while the bottom-layer recirculation weakens. Based on the ocean general circulation and ventilated thermocline models, Wang et al. (Citation2015) found that, under global warming, both intensified stratification and downward heat mixing contribute to the weakening of the subtropical gyre in the lower thermocline, with little contribution from wind change. Through an analysis of the CMIP5 simulations, Zhang, Wang, and Mu (Citation2017) investigated the response of the KE and its southern recirculation gyre to global warming and found that the intensified stratification shoals the thermocline depth and restrains convection, thus hindering the transfer of momentum from the upper ocean to the deeper ocean strengthening upper ocean circulation.
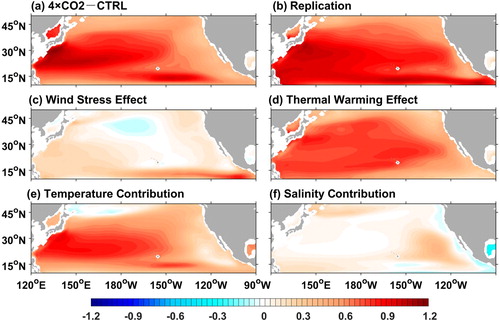
shows the response of the stratification over the subtropical North Pacific to CO2 quadrupling in our overriding experiments. The stratification is computed as a difference in potential density between 600 and 200 m. As the climate warms, ocean stratification is significantly enhanced over the subtropical region (a and b), which is in good agreement with previous studies (e.g., Capotondi et al., Citation2012; Cravatte et al., Citation2009; Deser et al., Citation2010). The overriding experiments indicate that this enhancement of stratification is mainly a result of the thermal warming effect (d), with a minor contribution from the wind stress effect (c).
Fig. 8 Change in stratification (g m−3) in the overriding experiments with CESM1: (a) total response (4×CO2 minus CTRL), (b) replication of total response (τ4c4 minus τ1c1), (c) wind stress effect (τ4c4 minus τ1c4), and (d) thermal warming effect (τ1c4 minus τ1c1). And the contribution of (e) temperature and (f) salinity changes to the stratification changes. Stratification is defined as the potential density difference between 600 and 200 m (g m−3). A mean of model years 41–90 of each run is used for analysis.
Following Capotondi et al. (Citation2012) and Zhang et al. (Citation2017), the relative influences of the temperature and salinity changes on the density changes are estimated as follows:(5)
(5)
(6)
(6) where
and
are the salinity and temperature in τ1c1,
and
are the salinity and temperature in τ4c4, and
and
are the density changes due to temperature and salinity changes, respectively. Comparing e and f with 8b, it is clear that the temperature change is the major contributor to the change in stratification in the central and western subtropics, while the changes in both temperature and salinity are equally important for the stratification change in the far eastern subtropical region.
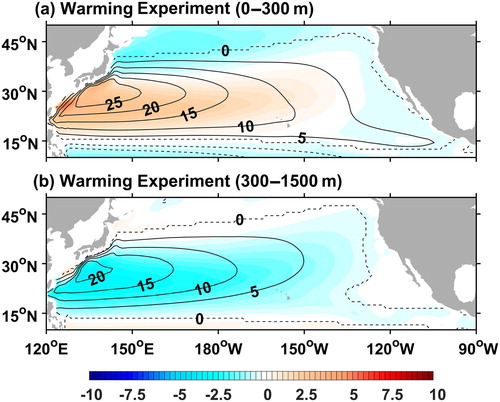
It is worth noting that the increased atmospheric CO2 concentration in the coupled system leads not only to a warming of the ocean but also to changes in wind over the North Pacific, which can also contribute to changes in stratification. To further verify the response of the North Pacific subtropical gyre to surface warming, a pair of warming experiments with POP2 is performed. shows the response of the mass transport in the upper ocean and lower thermocline of the subtropical North Pacific to 3.2 K warming. It is clear that the mass transport increases in the upper ocean (above 300 m) but decreases in the lower thermocline (from 300 to 1500 m), which is consistent with the results from the overriding experiments. This further confirms that it is indeed the thermal warming that accelerates (decelerates) the subtropical gyre in its upper (lower) layers. In addition, the experiments using POP2 also show that the ocean response is insensitive to the spatial distribution of surface warming, which is consistent with the findings of Wang et al. (Citation2015).
Fig. 9 Change in the North Pacific subtropical streamfunction (colour shading, 1 Sv = 106 m3 s−1) of the (a) upper ocean and (b) lower thermocline in the warming experiments with POP2 (PERT_POP minus CTRL_POP). The black contours show streamfunction distribution in CTRL_POP. A mean of model years 31–50 of each run is used for analysis.
In conclusion, both the wind stress curl change and the thermal warming effect make important contributions to the baroclinic change in the subtropical circulation gyre under global warming. Specifically, the cyclonic wind stress change decreases momentum supply to the North Pacific subtropical gyre, and the thermal warming effect largely enhances the stratification, which acts to hinder the transfer of momentum from the surface layer to the lower layer leading to an acceleration (deceleration) of the subtropical oceanic gyre in its upper (lower) layers.
5 Summary
Climate models project a slowdown in the subtropical gyre circulation in the North Pacific under global warming. However, there is disagreement on its forcing mechanism. While some studies (e.g., Zhang, Church, et al., Citation2014) suggested it is a result of the wind stress change, others (Wang et al., Citation2015) found the slowdown results mainly from thermal warming.
In this study, we have examined the response of the North Pacific subtropical gyre to quadrupled CO2 using CESM1. Results from our fully coupled experiments show an overall slowdown in the subtropical gyre circulation, which is consistent with previous studies. However, further analysis finds that the subtropical gyre is actually intensified in the upper ocean (above 300 m) but weakened in the lower thermocline (from 300 to 1500 m). In addition, in response to the increase in CO2, the northern and southern boundaries of the subtropical gyre move poleward and equatorward, respectively.
To identify the underlying mechanisms, a newly developed overriding technique was employed to isolate and quantify the effects of wind stress and thermal warming. Results from our overriding experiments indicate that, although the thermal warming has a positive contribution, the overall slowdown in the subtropical gyre is dominated by the change in the wind stress curl, which appears to increase over the subtropical region under quadrupled CO2. However, it is thermal warming that leads to the baroclinic response to the increase in CO2 with a spin-up of the subtropical gyre in the upper ocean and a spin-down in the lower thermocline, respectively. This is caused by an enhancement of ocean stratification resulting from thermal warming, which acts to hinder the transfer of momentum from the upper layers to the lower layers and eventually accelerates the upper-ocean circulation but decelerates the lower ocean circulation of the subtropical gyre in the North Pacific. Regarding latitudinal movement of the subtropical gyre boundaries, it is a result of the change in the wind stress curl, whose zero lines in the mid-latitudes and the tropics shift poleward and equatorward, respectively, under CO2 quadrupling.
One direct consequence of the subtropical gyre circulation change is its effect on the thermocline structure in the tropical Pacific, which has been shown by our numerical experiments and discussed in detail in our previous studies (Luo, Lu, Liu, & Garuba, Citation2017, Citation2018). For example, both the overriding and ocean-only experiments suggest that the equatorial thermocline change stems partly from the weakening of the subtropical cells under global warming. In fact, the connection between the tropical thermocline and the subtropical circulation in the Pacific Ocean is also evident in observations. For example, Zhang, Rothstein, and Busalacchi (Citation1998) found that Pacific mid-latitude decadal variations were a source of tropical upper-ocean warming after 1976, which was in turn responsible for the increase in the frequency and intensity of El Niño events since 1976 (Guilderson & Schrag, Citation1998; Zhang et al., Citation1998).
Finally, we would like to point out that the CESM1 models are not eddy resolving and this may cause doubt about its ability to simulate the subtropical gyre and its changes under global warming. Many recent studies have shown that eddies make significant contributions to the mixing and transport of salt, heat, and biogeochemical tracers across the global oceans (e.g., Chelton, Gaube, Schlax, Early, & Samelson, Citation2011; Zhang, Wang, et al., Citation2014).
Acknowledgements
We thank two anonymous reviewers and the editor for their helpful comments and suggestions that have enabled us to significantly improve this article. We thank Wei Liu for providing the outputs of the overriding experiments.
Disclosure statement
No potential conflict of interest was reported by the authors.
Additional information
Funding
References
- Capotondi, A., Alexander, M. A., Bond, N. A., Curchitser, E. N., & Scott, J. (2012). Enhanced upper ocean stratification with climate change in the CMIP3 models. Journal of Geophysical Research: Oceans, 117, C04031. doi: 10.1029/2011JC007409
- Chelton, D. B., Gaube, P., Schlax, M. G., Early, J. J., & Samelson, R. M. (2011). The influence of nonlinear mesoscale eddies on near-surface oceanic chlorophyll. Science, 334, 328–332. doi: 10.1126/science.1208897
- Chen, C., & Wang, G. (2015). Role of North Pacific mixed layer in the response of SST annual cycle to global warming. Journal of Climate, 28, 9451–9458. doi: 10.1175/JCLI-D-14-00349.1
- Conkright, M. E., Antonov, J. I., Baranova, O., Boyer, T. P., Garcia, H. E., Gelfeld, R., … Stephens, C. (2002). NOAA Atlas NESDIS 2: World Ocean Database 2001, Volume 1: Introduction (S. Levitus, Ed.). Silver Spring, MD: U.S. Government Printing Office.
- Cravatte, S., Delcroix, T., Zhang, D., McPhaden, M. J., & Leloup, J. (2009). Observed freshening and warming of the western Pacific Warm Pool. Climate Dynamics, 33, 565–589. doi: 10.1007/s00382-009-0526-7
- Deser, C., Alexander, M. A., & Timlin, M. S. (1996). Upper-ocean thermal variations in the North Pacific during 1970–1991. Journal of Climate, 9, 1840–1855. doi: 10.1175/1520-0442(1996)009<1840:UOTVIT>2.0.CO;2
- Deser, C., Phillips, A. S., & Alexander, M. A. (2010). Twentieth century tropical sea surface temperature trends revisited. Geophysical Research Letters, 37, L10701. doi: 10.1029/2010GL043321
- Guilderson, T. P., & Schrag, D. P. (1998). Abrupt shift in subsurface temperatures in the tropical Pacific associated with changes in El Niño. Science, 281, 240–243. doi: 10.1126/science.281.5374.240
- Held, I. M., & Soden, J. (2006). Robust response of the hydrological cycle to global warming. Journal of Climate, 19, 5686–5699. doi: 10.1175/JCLI3990.1
- IPCC. (2014). Climate change 2014: Synthesis report. Contribution of Working Groups I, II and III to the fifth assessment report of the Intergovernmental Panel on Climate Change. Geneva, Switzerland: IPCC.
- Jang, C. J., Park, J., Park, T., & Yoo, S. (2011). Response of the ocean mixed layer depth to global warming and its impact on primary production: A case for the North Pacific Ocean. ICES Journal of Marine Science, 68, 996–1007. doi: 10.1093/icesjms/fsr064
- Latif, M., & Barnett, T. P. (1994). Causes of decadal climate variability over the North Pacific and North America. Science, 266, 634–637. doi: 10.1126/science.266.5185.634
- Levitus, S., Antonov, J. I., & Boyer, T. P. (2005). Warming of the world ocean, 1955–2003. Geophysical Research Letters, 32, L02604. doi: 10.1029/2004GL021592
- Li, X., & Luo, Y. (2016). Response of North Pacific eastern subtropical mode water to greenhouse gas versus aerosol forcing. Advances in Atmospheric Sciences, 33(4), 522–532. doi: 10.1007/s00376-015-5092-9
- Liu, F., Luo, Y., Lu, J., & Wan, X. (2017). Response of the tropical Pacific Ocean to El Niño versus global warming. Climate Dynamics, 48, 935–956. doi: 10.1007/s00382-016-3119-2
- Lorenz, D. J., & Deweaver, E. T. (2007). Tropopause height and zonal wind response to global warming in the IPCC scenario integrations. Journal of Geophysical Research: Atmospheres, 112, D10119. doi: 10.1029/2006JD008087
- Lu, J., Vecchi, G. A., & Reichler, T. (2007). Expansion of the Hadley cell under global warming. Geophysical Research Letters, 34(6), L06805. doi: 10.1029/2006GL028443
- Lu, J., & Zhao, B. (2012). The role of oceanic feedback in the climate response to doubling CO2. Journal of Climate, 25(21), 7544–7563. doi: 10.1175/JCLI-D-11-00712.1
- Luo, Y., Liu, F., & Lu, J. (2018). Response of the equatorial Pacific thermocline to climate warming. Ocean Dynamics, 68(11), 1419–1429. doi: 10.1007/s10236-018-1209-x
- Luo, Y., Lu, J., Liu, F., & Garuba, O. (2017). The role of ocean dynamical thermostat in delaying the El Niño-like response over the equatorial Pacific to climate warming. Journal of Climate, 30, 2811–2827. doi: 10.1175/JCLI-D-16-0454.1
- Luo, Y., Lu, J., Liu, F., & Liu, W. (2015). Understanding the El Niño-like oceanic response in the tropical Pacific to global warming. Climate Dynamics, 45, 1945–1964. doi: 10.1007/s00382-014-2448-2
- Luo, Y., & Rothstein, L. M. (2011). Response of the Pacific Ocean circulation to climate change. Atmosphere-Ocean, 49(3), 235–244. doi: 10.1080/07055900.2011.602325
- Luo, Y., Rothstein, L. M., & Zhang, R. (2009). Response of Pacific subtropical-tropical thermocline water pathways and transports to global warming. Geophysical Research Letters, 36(36), 67–80.
- McPhaden, M. J., & Zhang, D. (2002). Slowdown of the meridional overturning circulation in the upper Pacific Ocean. Nature, 415, 603–608. doi: 10.1038/415603a
- Meehl, G. A., Hu, A., & Santer, B. D. (2009). The mid-1970s climate shift in the Pacific and the relative roles of forced versus inherent decadal variability. Journal of Climate, 22(3), 780–792. doi: 10.1175/2008JCLI2552.1
- Miller, A. J., Cayan, D. R., Barnett, T. P., Graham, N. E., & Oberhuber, J. M. (1994). The 1976–77 climate shift of the Pacific Ocean. Oceanography, 7, 21–26. doi: 10.5670/oceanog.1994.11
- Saenko, A. O., Fyfe, J. C., & England, M. H. (2005). On the response of the oceanic wind-driven circulation to atmospheric CO2 increase. Climate Dynamics, 25(4), 415–426. doi: 10.1007/s00382-005-0032-5
- Stephens, C., Levitus, S., Antonov, J., & Boyer, T. P. (2001). On the Pacific Ocean regime shift. Geophysical Research Letters, 28, 3721–3724. doi: 10.1029/2000GL012813
- Sun, S., Wu, L., & Qiu, B. (2013). Response of the inertial recirculation to intensified stratification in a two-layer quasigeostrophic ocean circulation model. Journal of Physical Oceanography, 43(7), 461–470. doi: 10.1175/JPO-D-12-0111.1
- Timmermann, A., Mcgregor, S., & Jin, F. F. (2010). Wind effects on past and future regional sea level trends in the southern Indo-Pacific. Journal of Climate, 23(16), 4429–4437. doi: 10.1175/2010JCLI3519.1
- van Oldenborgh, G. J., Philip, S. Y., & Collins, M. (2005). El Niño in a changing climate: A multi-model study. Ocean Science, 1, 81–95. doi: 10.5194/os-1-81-2005
- Vecchi, G. A., & Soden, J. (2007). Global warming and the weakening of the tropical circulation. Journal of Climate, 20, 4316–4340. doi: 10.1175/JCLI4258.1
- Vecchi, G. A., & Wittenberg, A. T. (2010). El Niño and our future climate: Where do we stand? Wiley Interdisciplinary Reviews: Climate Change, 1(2), 260–270.
- Wang, G., Xie, S. P., Huang, R. X., & Chen, C. (2015). Robust warming pattern of global subtropical oceans and its mechanism. Journal of Climate, 28, 8574–8584. doi: 10.1175/JCLI-D-14-00809.1
- Wang, L., Liu, Q., Xu, L. X., & Xie, S. P. (2013). Response of mode water and subtropical countercurrent to greenhouse gas and aerosol forcing in the North Pacific. Journal of Ocean University of China, 12(2), 222–229. doi: 10.1007/s11802-013-2193-x
- Wu, L., Cai, W., Zhang, L., Nakamura, H., Timmermann, A., Joyce, T., … Giese, B. (2012). Enhanced warming over the global subtropical western boundary currents. Nature Climate Change, 2, 161–166. doi: 10.1038/nclimate1353
- Wu, L., Lee, D. E., & Liu, Z. (2005). The 1976/77 North Pacific climate regime shift: The role of subtropical ocean adjustment and coupled ocean–atmosphere feedbacks. Journal of Climate, 18(23), 5125–5140. doi: 10.1175/JCLI3583.1
- Xie, S. P., Deser, C., Vecchi, G. A., Ma, J., Teng, H., & Wittenberg, A. T. (2010). Global warming pattern formation: Sea surface temperature and rainfall. Journal of Climate, 23(4), 966–986. doi: 10.1175/2009JCLI3329.1
- Xie, S. P., Xu, L., Liu, Q., & Kobashi, F. (2011). Dynamical role of mode water ventilation in decadal variability in the central subtropical gyre of the North Pacific. Journal of Climate, 24(4), 1212–1225. doi: 10.1175/2010JCLI3896.1
- Xu, L. X., Xie, S. P., & Liu, Q. (2012). Mode water ventilation and subtropical countercurrent over the North Pacific in CMIP5 simulations and future projections. Journal of Geophysical Research, 117, C12009. doi: 10.1029/2012JC008377
- Xu, L. X., Xie, S. P., Liu, Q., & Kobashi, F. (2012). Response of the North Pacific subtropical countercurrent and its variability to global warming. Journal of Oceanography, 68, 127–137. doi: 10.1007/s10872-011-0031-6
- Xu, L., Xie, S. P., & Liu, Q. (2013). Fast and slow responses of the North Pacific mode water and subtropical countercurrent to global warming. Journal of Ocean University of China, 12(2), 216–221. doi: 10.1007/s11802-013-2189-6
- Yin, J. (2005). A consistent poleward shift of the storm tracks in simulations on 21st century climate. Geophysical Research Letters, 32(18), L18701. doi: 10.1029/2005GL023684
- Zhang, M., & Song, H. (2006). Evidence of deceleration of atmospheric vertical overturning circulation over the tropical Pacific. Geophysical Research Letters, 33, L12701. doi: 10.1029/2006GL025942
- Zhang, R.-H., & Levitus, S. (1997). Structure and cycle of decadal variability of upper-ocean temperature in the North Pacific. Journal of Climate, 10, 710–727. doi: 10.1175/1520-0442(1997)010<0710:SACODV>2.0.CO;2
- Zhang, R.-H., Rothstein, L. M., & Busalacchi, A. J. (1998). Origin of upper-ocean warming and El Niño change on decadal time scales in the tropical Pacific Ocean. Nature, 391, 879–883. doi: 10.1038/36081
- Zhang, X., Church, J. A., Platten, S. M., & Monselesan, D. (2014). Projection of subtropical gyre circulation and associated sea level changes in the Pacific based on CMIP3 climate models. Climate Dynamics, 43(1-2), 131–144. doi: 10.1007/s00382-013-1902-x
- Zhang, X., Wang, Q., & Mu, M. (2017). The impact of global warming on Kuroshio Extension and its southern recirculation using CMIP5 experiments with a high-resolution climate model MIROC4h. Theoretical and Applied Climatology, 127, 815–827. doi: 10.1007/s00704-015-1672-y
- Zhang, Z., Wang, W., & Qiu, B. (2014). Oceanic mass transport by mesoscale eddies. Science, 345, 322–324. doi: 10.1126/science.1252418