
Abstract
Setosphaeria turcica
causes Northern corn leaf blight (NCLB). In this study, 92 isolates of S. turcica were collected from naturally infected corn fields at 57 sites within China to determine physiological race composition and genetic diversity. Based on the reaction of differential hosts, isolates were divided into 14 physiological races (0, 1, 2, 12, 3, 13, 23, N, 1N, 2N, 3N, 13N, 23N, 123N). Races 0 and 1 were dominant, found with frequencies of 34.78% and 28.26%, respectively. This study was the first to identify race 123N in Heilongjiang province, implying possible loss of corn variety resistance to the NCLB pathogen. A total of 64 loci were obtained from eight pairs of primers by sequence-related amplified polymorphism (SRAP), of which 44 were polymorphic, accounting for 68.75% of the loci. Molecular markers showed that 92 isolates could be categorized into four groups with a similarity coefficient of 0.82, indicating abundant genetic diversity. Further analysis of genetic similarity and genetic distance of each geographical population revealed that the populations from Northeast, North, and Northwest China exhibited high similarities to each other, while exhibiting a large genetic distance with those from Southwest China. Analysis of molecular variance indicated that 81.54% of the genetic variation among isolates was derived from individuals within the geographical population (P < 0.001). The cluster analyses suggested that there was no distinct correlation among physiological races, genetic variation and geographic sources. This study provides a basis for understanding trends in S. turcica distribution and control of NCLB in China.
Résumé
Setosphaeria turcica cause l’helminthosporiose du Nord du maïs (HNM). Dans cette étude, 92 isolats de S. turcica ont été collectés dans des champs naturellement infectés, situés à 57 endroits en Chine pour déterminer la composition des races physiologique et la diversité génétique. En se basant sur la réaction d’hôtes différentiels, les isolats ont été divisés en 14 races physiologiques (0, 1, 2, 12, 3, 13, 23, N, 1N, 2N, 3N, 13N, 23N, 123N). Trouvées à des fréquences de 34,78% et 28,26, respectivement, les races 0 et 1 dominaient. Cette étude a été la première à identifier la race 123N dans la province du Heilongjiang, ce qui dénote, chez une variété de maïs, une possible perte de résistance à l’HNM. En tout, 64 locus ont été obtenus avec 8 paires d’amorces par polymorphisme d’amplification lié à la séquence (SRAP), parmi lesquels 44 étaient polymorphes, comptant pour 68,75% des locus. Les marqueurs moléculaires ont montré que 92 isolats pouvaient être répartis en 4 groupes avec un coefficient de similarité de 0,82, indiquant une grande diversité génétique. Une analyse plus poussée de la similarité génétique et de la distance génétique de chaque population géographique a révélé que les populations du nord-est, du nord et du nord-ouest de la Chine affichaient entre elles de grandes similarités, tandis qu’elles affichaient une grande distance génétique par rapport à celles du sud-est. L’analyse de la variance moléculaire a montré que 81,54% de la variation génétique chez les isolats était issue d’individus appartenant à la population géographique (P < 0,001). Les analyses typologiques ont suggéré qu’il n’y avait aucune corrélation directe entre les races physiologiques, la variation génétique et les sources géographiques. Cette étude constitue une base quant à la compréhension des tendances relatives à la distribution de S. turcica et à la lutte contre l’HNM en Chine.
Introduction
Setosphaeria turcica (Luttr.) K.J. Leonard & Suggs, the causal agent of Northern corn leaf blight (NCLB), was first reported in Italy in 1876 (Mitra Citation1923). The pathogen can cause severe disease around the world, particularly in areas with temperatures between 15 and 25°C and excessive rainfall (Galiano-Carneiro and Miedaner Citation2017). This disease has been prevalent in corn-producing regions throughout modern history (Carson Citation2016). NCLB has caused serious losses in corn production in France, Austria and the United States (Borchardt et al. Citation1998a; Ferguson and Carson Citation2007). In China, NCLB was first reported from northeastern corn producing regions in 1899 (Chen Citation1993). Major economic losses are often caused by severe incidence of the disease. Typically, NCLB is a serious problem in the Northeast, North, Northwest, and South regions of corn belts on the cold mountains of China, where environmental conditions are suitable for its development (Zhao et al. Citation2008).
The most effective way to control NCLB is to breed resistant varieties. Setosphaeria turcica shows clear physiologic specialization, leading to the need for breeding material that contains multiple resistance genes (Schechert et al. Citation1999; Welz and Geiger Citation2000). From a genetic perspective, the sources of resistance are divided into qualitative and quantitative resistance. The qualitative resistance controlled by single genes (such as Ht genes) is race specific (Chung et al. Citation2010; van Inghelandt et al. Citation2012). At present, several physiological race types have been reported based on their virulence on the resistance genes Ht1, Ht2, Ht3, Htn1 (HtN) (Bentolila et al. Citation1991; Wang et al. Citation2010; Zhang et al. Citation2014; Hurni et al. Citation2015). Race 0 is avirulent on all Ht genotypes; however, the pathogen can overcome plant host resistance due to a high rate of mutation. For instance, cultivars having the Ht gene, which were previously resistant, can become susceptible (Galiano-Carneiro and Miedaner Citation2017).
In the 1960s, race 0 was the dominant race identified worldwide in every corn producing region. However, with large-scale planting of resistant varieties, the pathogen population changed, and the composition of physiological races became increasingly complex. Accordingly, S. turcica with the virulence formula Ht2Ht3HtN/Ht1 (race 1) was more common than Ht1Ht2Ht3HtN/0 (race 0) in China (Wang et al. Citation2007) and the United States (Pataky and Ledencan Citation2006), while race 0 has been the most frequently occurring race in Central Europe since 2014, reaching 50.2% (Hanekamp et al. Citation2014). In addition, since the Htm1 gene was first included in the race screening of the S. turcica population in the United States, 20 physiological races were observed, which greatly exceeded the number of races prior to 1995 (Weems and Bradley Citation2018). To date, all 16 physiological races, based on the four identified Ht genes (Ht1, Ht2, Ht3, HtN), have been found in nature. As of 2008, 13 physiological races have been described in northern China, where the pathogen shows high racial complexity and diversity (Dong et al. Citation2008).
Molecular markers are often used to study the genetic diversity of pathogens. The commonly used molecular markers include restriction fragment length polymorphism (RFLP; Wu et al. Citation2003), random amplified polymorphic DNA (RAPD; Iqbal et al. Citation2006), simple sequence repeat (SSR; Barnes et al. Citation2001), amplified fragment length polymorphism (AFLP; Justesen et al. Citation2002), and inter-simple sequence repeat (ISSR; Dinolfo et al. Citation2010). RAPD and AFLP have been used for analysing genetic diversity among S. turcica isolates (Gui et al. Citation2005; Hou et al. Citation2006; Muiru et al. Citation2010a). High haplotype diversity was reported in S. turcica populations from South Africa using SSR markers (Human et al. Citation2016; Nieuwoudt et al. Citation2018). In a previous report, 44 strains of S. turcica isolated from seven major corn-producing areas in China were analysed using ISSRs and it was found that there may not be an association between genetic diversity and pathogen races (Gu et al. Citation2008). Dong et al. (Citation2008) observed a high genetic diversity within and between pathogenic races in the S. turcica population using RAPD markers. In addition, sequence-related amplified polymorphism (SRAP) primers can be designed to amplify different intro and exon sequences (Li and Quiros Citation2001). Due to their simplicity, high polymorphism, stability, and the rapid results that can be obtained, SRAP have been widely used in recent years to analyse the genetic diversity of plant pathogens (Pasquali et al. Citation2010; Liu et al. Citation2015; Kosaraju et al. Citation2017). However, SRAP marker technology has not yet been used to analyse the genetic diversity of S. turcica.
Knowledge of the genetic variation and physiological race type distribution of S. turcica may provide clues to the prevalence and occurrence of NCLB, which may contribute to more effective control measures. The purpose of this study was to use SRAP marker technology to analyse the genetic diversity of S. turcica in the corn-producing region of China and to define the race structure among all collected pathogen isolates. We discuss the relationship between genetic diversity and geographical origin of S. turcica and the geographic distribution of physiological races, which provides the basis for further research on the pathogenic mechanisms of S. turcica.
Materials and methods
Fungal isolation and cultivation
Samples of infected corn leaves were collected from various sites in China in 2017 (). The monospore separation method (Gao et al. Citation2010) was used to isolate the pathogenic strains from the leaves. Spores were first transferred to water agar by beating the leaves, and a needle was then used to directly pick single spores under low magnification. The isolated single-spores of S. turcica were cultivated on potato dextrose agar (PDA: 200 g potato, 20 g glucose, and 18 g agar in 1 L distilled water). All plates were incubated under 12:12-h light:dark cycles at 25°C.
Fig. 1 Setosphaeria turcica samples collected from various sites in China. All isolates belong to four groups based on geographical division of China. ●: Northeast China; ■: North China; ▲: Northwest China; ★: Southwest China.
DNA extraction and analysis of internal transcribed spacer (ITS) regions
To extract DNA from the collected isolates, colonies grown on PDA were picked and transferred to 75 mL potato dextrose broth (PDB: 200 g potato and 20 g glucose in 1 L distilled water) and then incubated with shaking at 150 rpm in an incubator shaker in the dark at 25°C for at least 7 days. The mycelia in the PDB were filtered through sterile gauze, washed thrice with sterile distilled water, transferred to centrifuge tubes, dried for 24 h using a vacuum freeze dryer (Modulyo-D, USA), placed in cool mortars, and ground in liquid nitrogen using pestles (Gai et al. Citation2017). Next, genomic DNA was extracted from the lyophilized mycelia of monoconidial isolates using a Plant Genomic DNA Kit (Tiangen Biotech, China). The relative purity and concentration of the DNA were determined by calculating the OD260/OD280 ratio (Sambrook Citation1989) and via electrophoresis with a marker of known concentration. The isolated strains were identified based on their ITS regions and compared with the known S. turcica reference strain (NCBI accession No. KJ380909.1). The ITS regions were then amplified using the extracted DNA as a template and ITS1 (5′-TCCGTAGGTGAACCTGCGG-3′) and ITS4 (5′-TCCTCCGCTTATTGATATGC-3′) as primers (Gardes and Bruns Citation1993). Polymerase chain reactions (PCR) were performed in a total volume of 25 μL, with 1 μL (50 ng) template DNA, 12.5 μL 2× Power Taq PCR MasterMix (Takara Biotech, China), 1 μL of each primer (at 10 μM), and 9.5 μL double distilled (dd) H2O. The PCR amplification program was as follows: 5 min at 94°C; 35 cycles of 94°C for 40 s, 54°C for 1 min, and 72°C for 1 min; and a final extension at 72°C for 10 min (Tang et al. Citation2015). The PCR products were separated on 1% agarose gels containing 1× tris-acetic-EDTA (TAE) and 4S Green Plus Nucleic Acid Stain (Sangon Biotech, China). The gels were visualized using a UV transilluminator (UVItec, UK). Finally, the PCR product was sent to Sangon Biotech for sequencing analysis.
Physiological race identification
The corn-inbred lines carrying single Ht genes (B37, B37Ht1, B37Ht2, B37Ht3, B37HtN) were used to distinguish the physiological races. All differential hosts were provided by the Institute of Plant Immunology, Shenyang Agricultural University, China. Seeds of the differential hosts with no insect or mechanical damage were selected, sterilized with 2% sodium hypochlorite and then wrapped in gauze, soaked in sterile water, and incubated for 2 to 3 days in an incubator at 26°C. The germinated seeds were sown in 15 cm diameter pots, containing sterile fertile soil with about 1% urea. Five seeds per pot were planted and three seedlings were retained for inoculation by thinning after emergence.
The purified S. turcica isolates were transferred to oatmeal agar medium (30 g oatmeal and 17 g agar in 1 L distilled water), which was more suitable for sporulation, and cultured for 10–15 days at 25°C. The spores were washed with sterile water and filtered with double-layered gauze to prepare a suspension with a concentration of 105–106 spores mL−1. To increase the adhesion of spores on the leaf surface, Tween-20 (0.1% v/v) and sucrose (2.0% w/v) were added to the spore suspension, which was sprayed with a hand-held pneumatic sprayer (Liu et al. Citation2012) on the corn plants at the 6–8 leaf stage. The inoculated plants were immediately moved into a plastic shed, maintained under high humidity for 48 h, and then transferred to a greenhouse. Each treatment consisted of three replicates, with the sprayer treated with 5% carbonic acid before each inoculation to avoid cross-contamination.
Fourteen days after inoculation, obvious lesions appeared on the leaves of the corn plants, and two types of lesions, susceptible type (S-type) and resistant type (R-type), were observed. Lesions with obvious necrosis that lacked chlorosis were scored as S-type, while those showing clear chlorosis were identified as R-type. Physiological races were classified according to the virulence formula (avirulence/virulence) and named according to the serial number of the virulence genes (Leonard et al. Citation1989).
SRAP analysis
Forward and reverse random primers (10 each) were synthesized by Sangon Biotech, resulting in 100 combinations of primer pairs () (Guo et al. Citation2010; Ma et al. Citation2015). Five isolates were selected randomly from the tested isolates for PCR amplification. SRAP analysis was then performed on all isolates using the primer combinations that showed clear bands and abundant and stable polymorphisms. The SRAP amplification reaction was performed as follows: total volume of 25 μL, with 1 μL template DNA (50 ng), 12.5 μL 2× Power Taq PCR MasterMix (Takara Bio, China), 1 μL each of 10 μM primer, and 9.5 μL ddH2O. The PCR reaction conditions were as follows: 5 min of denaturation at 94°C; 5 cycles of denaturation at 94°C for 1 min, annealing at 30–40°C, depending on the primer set, for 1 min, and elongation at 72°C for 1 min; 35 cycles with annealing at 50–56°C, depending on the primer pair; and a final extension step at 72°C for 10 min (Supplementary Table 1) (Mutlu et al. Citation2008). The amplified products were separated on a 2% agarose gel containing 1× TAE and 4S Green Plus Nucleic Acid Stain (Sangon Bio, China) and detected using a UV transilluminator (UVItec, UK).
Table 1. Sequence-related amplified polymorphism (SRAP) primer sequences.
Data analysis
The PCR products obtained from the tested isolates were examined; the presence of bands at the same mobility received a score of ‘1’, while a score of ‘0’ was given if no bands were observed; a binary data matrix was thus constructed. Genetic diversity was analysed using NTSYS-pc 2.1 software, and the cluster analysis plots were generated using the unweighted pair-group method with arithmetic means (UPGMA; Rohlf Citation1993). In addition, the isolates were divided into different groups based on their geographic origin. The analysis of molecular variance (AMOVA version 1.55) of S. turcica was performed with Arlequin v. 3.0 (Excoffier et al. Citation2005). Popgene v. 1.32 was used to calculate the population genetic diversity and differentiation parameters. Cluster analysis was performed based on Nei’s genetic distance (Yeh et al. Citation1997).
Results
Identification of morphology and ITS regions
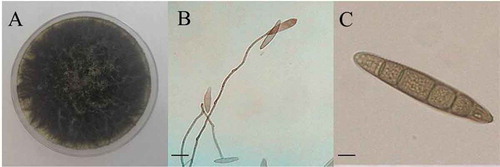
Ninety-two isolates of S. turcica were selected from different sites in four geographical regions (Zhao Citation1995) of China (Supplementary Table 2). The morphologies of the colonies, mycelia, and conidia of all the isolates were very similar to those of S. turcica (). All isolates amplified a ca. 600-bp band with the ITS1/ITS4 primers and exhibited 100% similarity to the reference strain (NCBI accession No. KJ380909.1), based on genomic ITS sequences. Thus, all isolates were identified as S. turcica, and the ITS sequences were uploaded to NCBI with accession numbers ranging from MG727564 to MG727660.
Table 2. Distribution of physiological races of Setosphaeria turcica in different geographical regions and provinces of China.
Fig. 2 (Colour online) Morphological identification of Setosphaeria turcica from isolate GS1701. a, colony morphology; b, mycelia morphology; c, conidia morphology. Bars: B = 20 μm, C = 10 μ.
Pathogenic race identification
The 92 isolates were inoculated onto the differential hosts at the 6–8 leaf stage. Small spots appeared on the leaves of all inoculated plants after 48 h under high humidity at 25°C. The reactions were scored based on lesion characteristics at 14 days after inoculation. The R-type showed long and narrow fusiform lesions with distinct yellow haloes on the edge, while S-type reactions appeared as greyish-brown fusiform large spots, and subsequently developed necrosis. A total of 14 physiological races (0, 1, 2, 12, 3, 13, 23, N, 1N, 2N, 3N, 13N, 23N, 123N) were distinguished based on the infection type.
lists the sample size and frequency of S. turcica races isolated from the different geographical regions and provinces of China. Race distribution indicated physiologic specialization of S. turcica in China, with the physiological races widely distributed and the highest number of races in Northeast China, where 13 physiological races (0, 1, 2, 3, 13, 23, N, 1N, 2N, 3N, 13N, 23N, 123N) were identified. However, some races were more abundant than others. Race 0 and race 1 were still the dominant races in China, accounting for 34.78% and 28.26% of the total isolates, respectively. This was followed by race 3, which occurred at a frequency of 7.61%. Races 23, 1N, 13N, and 23N were found in very few regions, with the frequency of occurrence of each being 1.09%. The virulence frequency of the Ht genes, i.e., the ratio of the number of pathogenic races to the total number of isolates sampled, was evaluated in each region (). Strains that were virulent on the Ht1 gene were identified in all regions. Isolates virulent on the Ht2 gene were found only in Northeast and Northwest China and occurred at a low frequency. Among the 92 isolates identified, 32 (34.78%) were avirulent on all Ht genotypes. The virulence frequency on the Ht1 resistance gene was 41.30%, followed by 25.00% on Ht3, 17.39% on HtN, and 11.96% on Ht2. The occurrence of physiological races of S. turcica varied among different geographical regions and provinces in China.
SRAP analysis
One hundred pairs of SRAP primer combinations were screened. Eight (Me1/Em5, Me3/Em3, Me3/Em7, Me5/Em2, Me5/Em9, Me6/Em3, Me8/Em1, and Me9/Em7) showed clear, abundant, well-distributed, and stable bands upon amplification for all tested isolates. Sixty-four genes were amplified by SRAP primers, of which 44 were polymorphic (Supplementary Table 1).
shows the UPGMA dendrogram constructed from the amplified genomic DNA fragments of the 92 isolates tested. At a similarity coefficient of 0.82, all isolates were grouped into four clades. Clade 1 was the largest, with 77 isolates and accounting for 83.70% of all isolates, while clades 2 and 4 contained only three isolates each. Further analysis showed that isolates from the same region could belong to different clades. For example, SAX1704, SAX1705, and SAX1706 were assigned to clades 3, 2, and 1, respectively, although they were all isolated from Xianyang, Shaanxi Province. Conversely, some isolates from different regions were grouped in the same clade. For example, HLJ1701, JL1702, and SAX1705 were isolated from the provinces of Heilongjiang, Jilin, and Shaanxi, respectively, and all were assigned to clade 2. Therefore, there was no significant correlation between the SRAP polymorphism and the geographical origins of S. turcica isolates. Moreover, the composition of physiological races varied among genetic groups (Supplementary Table 3). Although clade 3 contained only nine isolates, it included six different physiological races, which suggested that there were obvious genetic variations within the physiological races, and that race designations were not necessarily related to genetic diversity.
Table 3. Estimates of genetic diversity within four populations of Setosphaeria turcica in China.
Fig. 3 Genetic similarity among 92 Setosphaeria turcica isolates shown as a dendrogram based on the unweighted pair-group method with arithmetic means (UPGMA). ●: Northeast China; ■: North China; ▲: Northwest China; ★: Southwest China.
The DNA fragments amplified by the same primers were similar. PCR amplification with different primers produced a large number of polymorphic bands, indicating a high level of genetic diversity in S. turcica. These results showed that SRAP markers could reveal the genetic diversity of the tested isolates, as well as the genetic relationships between them.
To study the correlation between genetic diversity and the geographic origin of S. turcica isolates, and the genetic relationships between S. turcica isolates from different regions, the 92 isolates were divided into four groups based on their geographic origin. The genetic diversity of these four groups was calculated using Popgene v. 1.32 (). The percentage of polymorphic loci (P) in these populations was 68.75% and the Shannon index (I) reached 0.3598, indicating that there was high genetic diversity among the geographically separate groups of S. turcica. The highest polymorphic loci ratio and Shannon index occurred in Northeast China, at 0.6250 and 0.3736, respectively, while the polymorphic loci ratio and Shannon index in Southwest China were the lowest, with indices of 0.1875 and 0.2010, respectively.
The AMOVA indicate that genetic variation within and among the four populations of S. turcica was significant (P < 0.001). The coefficient of genetic differentiation (Gst) among populations was 0.1846, the genetic variation within the populations accounted for 81.54% of the total variation, and the gene flow (Nm) among the various groups was 2.21. These results suggested that while genetic migration occurred among the geographical populations of S. turcica, the variation was still distributed mainly among individuals rather than populations. Moreover, the genetic identities between the four geographical populations ranged from 0.8388 to 0.9763 (), indicating widespread genetic recombination among the populations. The highest gene identity was between populations from Northeast China and North China (0.9763), whereas the lowest gene identity was between populations from Northwest China and Southwest China (0.8388). Based on the genetic distance coefficient between groups, a cluster analysis chart () and a two-dimensional (2D) principal component analysis chart (Supplementary Fig. 1) were generated. The cluster analysis showed that the four geographical populations could be divided into two groups with a genetic distance coefficient of 0.18, in which the populations from Southwest China formed a single group. The 2D principal component analysis suggested that the populations from Northeast China and North China were fairly similar to each other, indicating a close genetic relationship between the isolates of S. turcica in these two regions. In conclusion, high genetic diversity existed in the populations of S. turcica in China and no significant correlation was observed with geographic origin.
Table 4. Nei’s genetic identity and genetic distance between pairwise combinations of Setosphaeria turcica populations from China.
Fig. 4 Dendrogram of four Setosphaeria turcica populations based on genetic distance.
Discussion
The differential reactions between pathogens and corn plants carrying different Ht genes are closely related to temperature and humidity, with the growth stage of the plant also affecting the infection response to S. turcica (Leath et al. Citation1990). Therefore, to produce reliable results, this study consistently used seedlings at the 6–8 leaf stage for inoculation, and conducted the identification of physiological races under the same conditions in late spring, which is suitable for corn growth and pathogen invasion (Liu et al. Citation2012). This study showed that there was no obvious correlation between races and the geographical origin of the isolates, and that each physiological race was widely distributed in China, confirming previous results (Bigirwa et al. Citation1993).
Fourteen physiological races of S. turcica were identified from different geographical regions of China. Races 0 and 1 were still dominant in China, with the frequency of race 1 increased and the frequency of race 0 decreased relative to earlier studies, suggesting that while genetic variation in S. turcica is high, the fungus is still in a stable state (Dong et al. Citation2008; Gao et al. Citation2011). Race 23 was first identified in Yunnan Province (Wu and Yi Citation1989). Zhao et al. (Citation2008) first reported the existence of race 2 in Sichuan and Liaoning provinces. In this study, race N and 123N are reported for the first time in Shaanxi and Heilongjiang provinces, respectively. Obviously, new physiological races are emerging and the pathogen race composition becomes more complex. Significantly, race 123N was virulent on all genotypes containing Ht resistance genes and was strongly pathogenic, warranting further investigation and monitoring of this race.
Worldwide, there are large regional differences in the physiological races of S. turcica. Twelve races were identified in samples from Kenya, Germany and Austria, with race 2 occurring the most frequently (27%) and races 0 and 1 representing about 22% and 12% of the isolates, respectively (Muiru et al. Citation2010b). Physiological race analysis of 255 isolates of S. turcica from Central Europe showed that race 0 was dominant, with a frequency of 50.2%, followed by frequencies of 23.1% and 11% for races 1 and 3, respectively (Hanekamp et al. Citation2014). The diversity and complexity S. turcica race composition in different countries or regions may be attributed to the widespread planting of corn varieties with different Ht monoclonal resistance genes in recent years, which may have increased the selection pressure on pathogen populations, resulting in variation and new pathogenic races.
The isolates tested in this study were most virulent on plants carrying the Ht1 resistance gene, with its frequency increasing from 33.33% in 2008 to 41.30% (Zhao et al. Citation2008). The presence of different pathogen races in China suggests the need for multiple resistance sources, to increase the durability of host plant resistance; the performance of additional qualitative resistance genes should be monitored in China to further clarify the population structure and distribution of S. turcica in future studies.
Molecular marker technology has been used widely for the study of genetic diversity in fungi, and in phytopathogens, the genetic diversity and geographical origin of isolates have sometimes been shown to be correlated (Borchardt et al. Citation1998b). By calculating the annealing temperature of the primers in two rounds of the SRAP amplification program, clear, stable, and reproducible DNA bands were amplified, and DNA fragments with higher polymorphism were obtained from among the different isolates. These results show that molecular marker technology is an effective method to study the genetic diversity and evolution of S. turcica.
To the best of our knowledge, this was the first study to use SRAP markers to analyse the genetic diversity of S. turcica from different regions of China at the molecular level. The results indicated genetic differences among the 92 tested isolates, which were grouped into four clades. Sixty-four genes were amplified by eight primer combinations, of which 44 were polymorphic, with an average of 5.5 genes per primer combination and with a polymorphism ratio of 68.75%, which was slightly lower than previously reported (Tang et al. Citation2015). Muiru et al. (Citation2010a) and Ferguson and Carson (Citation2004) have also reported rich genetic polymorphisms in S. turcica by AFLP and RAPD analyses, respectively. The SRAP markers may be combined with more sensitive silver staining of polyacrylamide gels or fluorescent labelling to detect bands representing amplified DNA fragments; in this study, however, a simple agarose assay was used, which may have resulted in a lower ratio of polymorphisms. Previously, race 1 isolates were shown to have greater genetic similarity with race 0 than with 23 or 23N isolates (Ferguson and Carson Citation2007). This study found that there was no significant association between genetic population and physiological race, which was consistent with other studies (Abadi et al. Citation1996; Dong et al. Citation2008).
The genetic diversity of populations is one of the important bases for evaluating the status of biological resources. Nei’s genetic diversity index (H) and Shannon’s information index (I) are important parameters for measuring biological genetic diversity (Lu et al. Citation2009). In this study, we found high levels of genetic diversity with each population of S. turcica from different geographical regions. The isolates from Northeast China exhibited the highest genetic diversity index and Shannon’s information index, indicating that the population from that region possesses the greatest potential for variation, since pathogen populations with high evolutionary potential are more likely to overcome host genetic resistance (McDonald and Linde Citation2002). Therefore, monitoring of S. turcica should be strengthened in Northeast China to provide a basis for releasing cultivars with more durable resistance.
To our knowledge, this was the first study to examine S. turcica in China according based on its geographical distribution and discuss the genetic relationships among geographical populations. At the population level, the genetic differentiation coefficient among the four Chinese S. turcica populations was 0.1846, and the diversity was significantly lower than that of a South African population (Human et al. Citation2016); this may reflect environmental conditions, experimental materials and (or) other factors. Moreover, the detection of natural occurrence of the sexual stage of S. turcica suggests that sexual hybridization plays a key role in pathogen variation (Bunkoed et al. Citation2014). Long-distance migration of populations between regions also is an important mechanism for pathogen variation (Ferguson and Carson Citation2004). In this study, 81.54% of the total genetic variation existed within the populations, indicating that intrapopulation variation is the main source of genetic variation in S. turcica. Thus, genetic migration could be occurring among S. turcica populations, with the gene flow playing a homogenizing role to prevent population differentiation (Milgroom Citation1996).
Estimation of Nei’s genetic identity and genetic distances provided a better understanding of the genetic relationships among populations. In addition, cluster analysis and principal component analysis of the genetic relationships among the populations showed that isolates from Northeast and North China clustered together, while isolates from North and Northwest China were clearly scattered on the principal component analysis chart. This suggested that S. turcica in Northeast and North China may face the same natural selection pressure and have sufficient genetic communication to lead to a closer genetic relationship. Previous reports indicated that the genetic diversity of S. turcica in the tropics was higher than that in the temperate regions (Borchardt et al. Citation1998a; Ramathani et al. Citation2011). Consistent with this, in the current study, the population from Southwest China formed a separate branch, presumably because of the high temperature and humid climatic conditions in that region.
Although AMOVA analysis showed that the variation between geographical populations accounted for only 18.46% of the total variation, it reached a very significant level, and based on the cluster analysis only three isolates (SC1702, SC1703, SC1705) included in clade 4 were from the Southwest region. These results all reflected the large genetic differences between populations from Southwest China and other populations. While isolates from the northeastern United States and central and western Kenya had the same random amplified polymorphic DNA (RAPD) profile (Borchardt et al. Citation1998a, Citation1998b; Ferguson and Carson Citation2004), the results from the current study suggested that there is no significant correlation between the genetic diversity and geographic origin of S. turcica. These conclusions are consistent with those of other previous studies (Gu et al. Citation2008; Cepni et al. Citation2013). Nonetheless, the results might be influenced by multiple factors such as the extent of sexual reproduction in the fungus (Debuchy and Turgeon Citation2006; Brewer et al. Citation2011), the varieties of corn (Hooda et al. Citation2017), climate (Mallikarjuna et al. Citation2007), and cultivation practices (Pratt et al. Citation2003). Moreover, because of the difficulties in the collection and preservation of some samples, only 10 isolates were collected from Northwest and Southwest China, far less than the number of samples in Northeast China; this could have led to a bias in the results and a more even sample distribution should be examined in future studies.
The results of this study will help to provide a basis for the development of control measures suitable for local conditions and lay the foundation for the identification of new resistance genes and the cultivation of disease-resistant varieties, which are important for the sustainable management of NCLB in China.
ITS Sequences
Download Text (54.2 KB)Supplementary Tables 1, 2 and 3, and Supplementary Figure 1
Download MS Word (60.4 KB)Acknowledgements
We thank Dr. Ling Tang for collecting the isolates of S. turcica used in this study and Dr. Xiao-Tong Gai for providing assistance with the molecular and phylogenetic analyses.
Supplemental data
Supplemental data for this article can be accessed here
Additional information
Funding
Related Research Data
References
- Abadi R, Perl-Treves R, Levy Y. 1996. Molecular variability among Exserohilum turcicum isolates using RAPD. Can J Plant Pathol. 18:29–34.
- Barnes I, Gaur A, Burgess T, Roux J, Wingfield BD, Wingfieild MJ. 2001. Microsatellite markers reflect intra-specific relationships between isolates of the vascular wilt pathogen Ceratocystis fimbriata. Mol Plant Pathol. 2:319–325.
- Bentolila S, Guitton C, Bouvet N, Sailland A, Nykaza S, Freyssinet G. 1991. Identification of an RFLP marker tightly linked to the Ht1 gene in maize. Theor Appl Genet. 82:393–398.
- Bigirwa G, Julian AM, Adipala E. 1993. Characterization of Ugandan isolates of Exserohilum turcicum from maize. Afr Crop Sci J. 1:69–72.
- Borchardt DS, Welz HG, Geiger HH. 1998a. Genetic structure of Setosphaeria turcica populations in tropical and temperate climates. Phytopathology. 88:322–329.
- Borchardt DS, Welz HG, Geiger HH. 1998b. Molecular marker analysis of European Setosphaeria turcica populations. Eur J Plant Pathol. 104:611–617.
- Brewer MT, Cadle DL, Cortesi P, Spanu PD, Milgroom MG. 2011. Identification and structure of the mating-type locus and development of PCR-based markers for mating type in powdery mildew fungi. Fungal Genet Biol. 48:704–713.
- Bunkoed W, Kasam S, Chaijuckam P. 2014. Sexual reproduction of Setosphaeria turcica in natural corn fields in Thailand. Kasetsart J (Natl Sci). 48:175–182.
- Carson ML. 2016. Northern corn leaf blight. In: Munkvold GP, White DG, editors. Compendium of corn diseases. 4th ed. St. Paul (MN): APS Press; p. 31–33.
- Cepni E, Tunali B, Gürel F. 2013. Genetic diversity and mating types of Fusarium culmorum and Fusarium graminearum originating from different agro-ecological regions in Turkey. J Basic Microbiol. 53:686–694.
- Chen G. 1993. Distribution and control method of Exserohilum turcicum race 2. J Maize Sci. 1:65–66.
- Chung CL, Longfellow JM, Walsh EK, Kerdieh Z, van Esbroeck G, Balint-Kurti P, Nelson RJ. 2010. Resistance loci affecting distinct stages of fungal pathogenesis: use of introgression lines for QTL mapping and characterization in the maize - Setosphaeria turcica pathosystem. BMC Plant Biol. 10:103.
- Debuchy R, Turgeon BG. 2006. Mating-type structure, evolution, and function in Euascomycetes. In: Kües U, Fisher R, editors. The Mycota I: growth, differentiation and sexuality. Berlin: Springer-Verlag; p. 293–323.
- Dinolfo MI, Stenglein S, Moreno MV, Nicholson P, Jennings P, Salerno GL. 2010. ISSR markers detect high genetic variation among Fusarium poae isolates from Argentina and England. Eur J Plant Pathol. 127:483–491.
- Dong JG, Fan YS, Gui XM, An XL, Ma JF, Dong ZP. 2008. Geographic distribution and genetic analysis of physiological races of Setosphaeria turcica in northern China. Am J Agric Biol Sci. 3:389–398.
- Excoffier L, Laval G, Schneider S. 2005. Arlequin (version 3.0): an integrated software package for population genetics data analysis. Evol Bioinf. 1:47–50. http://cmpg.unibe.ch/software/arlequin3/.
- Ferguson LM, Carson ML. 2004. Spatial diversity of Setosphaeria turcica sampled from the eastern United States. Phytopathology. 94:892–900.
- Ferguson LM, Carson ML. 2007. Temporal variation in Setosphaeria turcica between 1974 and 1994 and origin of races 1, 23, and 23N in the United States. Phytopathology. 97:1501–1511.
- Gai XT, Xuan YH, Gao ZG. 2017. Diversity and pathogenicity of Fusarium graminearum species complex from maize stalk and ear rot strains in northeast China. Plant Pathol. 66:1267–1275.
- Galiano-Carneiro AL, Miedaner T. 2017. Genetics of resistance and pathogenicity in the maize/Setosphaeria turcica pathosystem and implications for breeding. Front Plant Sci. 8:1490.
- Gao JX, Gao ZG, Zhang XF, Zhang S, Chen L. 2010. A simple and feasible method for single-spore isolation of Exserohilum turcicum. Microbiol China. 37:1548–1550.
- Gao JX, Lv SX, Gao ZG, Zhuang JH, Zhang XF, Zhang S. 2011. Identification and dynamic analysis on physiological race of Exserohilum turcicum in northeastern China in 2009. J Maize Sci. 19:138–140, 144.
- Gardes M, Bruns TD. 1993. ITS primers with enhanced specificity of basidiomycetes–application to the identification of mycorrhizae and rusts. Mol Ecol. 2:113–118.
- Gu SQ, Fan YS, Li P, Dong JG. 2008. Optimization of ISSR reaction and genetic diversity analysis of Exserohilum turcicum. Acta Phytophylacica Sin. 35:427–432.
- Gui XM, Zhang JL, Dong JG, An XL. 2005. Establishment of the optimal RAPD reaction system of Setosphaeria turcica. J Hebei Agric Univ. 28:56–61.
- Guo DL, Zhang JY, Li M, Zhang GH, Liu CH. 2010. Optimization of SRAP-PCR system in grape and primers screening. Genomics Appl Biol. 29:379–384.
- Hanekamp H, Kessel B, Koopmann B, von Tiedemann A. 2014. Regionale Wirksamkeit rassenspezifischer Resistenzen gegen Exserohilum turcicum, dem Erreger der turcicum-blattdürre im mais [Regional effectiveness of race-specific resistances to Exserohilum turcicum, the causative agent of Turcicum leaf blight in maize]. Tagung des Arbeitskreises Krankheiten im Getreide und Mais [Meeting of the diseases working group in cereal and corn]; Jan 27–28; Braunschweig. J Fuer Kulturpflanzen. 66:215. German.
- Hooda KS, Khokhar MK, Shekhar M, Karjagi CG, Kumar B, Mallikarjuna N, Devlash RK, Chandrashekara C, Yadav OP. 2017. Turcicum leaf blight—sustainable management of a re-emerging maize disease. J Plant Dis Prot. 124:1–13.
- Hou XQ, Fan YS, Dong JG, Ma JF. 2006. Identification of physiological races and AFLP analysis in F1 generation of sexual hybridization between isolates of Setosphaeria turcica. Acta Phytophylacica Sin. 33:257–262.
- Human MP, Barnes I, Craven M, Crampton BG. 2016. Lack of population structure and mixed reproduction modes in Exserohilum turcicum from South Africa. Phytopathology. 106:1386–1392.
- Hurni S, Scheuermann D, Krattinger SG, Kessel B, Wicker T, Herren G, Fitze MN, Breen J, Presterl T, Ouzunova M, et al. 2015. The maize disease resistance gene Htn1 against northern corn leaf blight encodes a wall-associated receptor-like kinase. Proc Natl Acad Sci USA. 112:8780–8785.
- Iqbal Z, Mehboob-ur-Rahman, Dasti AA, Saleem A, Zafar Y. 2006. RAPD analysis of Fusarium isolates causing “mango malformation” disease in Pakistan. World J Microbiol Biotechnol. 22:1161–1167.
- Justesen AF, Ridout CJ, Hovmoller MS. 2002. The recent history of Puccinia striiformis f. sp. tritici in Denmark as revealed by disease incidence and AFLP markers. Plant Pathol. 51:13–23.
- Kosaraju B, Sannasi S, Mishra MK, Subramani D, Bychappa M. 2017. Assessment of genetic diversity of coffee leaf rust pathogen Hemileia vastatrix using SRAP markers. J Phytopathol. 165:486–493.
- Leath S, Thakur RP, Leonard KJ. 1990. Variation in expression of monogenic resistance in corn to Exserohilum turcicum race 3 under different temperature and light regimes. Phytopathology. 80:309–313.
- Leonard K, Levy Y, Smith D. 1989. Proposed nomenclature for pathogenic races of Exserohilum turcicum on corn. Plant Dis. 73:776–777.
- Li G, Quiros CF. 2001. Sequence-related amplified polymorphism (SRAP), a new marker system based on a simple PCR reaction: its application to mapping and gene tagging in Brassica. Theor Appl Genet. 103:455–461.
- Liu N, Liu ZL, Gong GS, Zhang M, Wang X, Zhou Y, Qi XB, Chen HB, Yang JZ, Luo PG, et al. 2015. Virulence structure of Blumeria graminis f. sp. tritici and its genetic diversity by ISSR and SRAP profiling analyses. PLoS One. 10:e0130881.
- Liu YJ, Zhang M, Wu ZH, Li JY. 2012. Artificial inoculation methods for Exserohilum turcicum on maize. Acta Phytopathologica Sin. 42:101–104.
- Lu NH, Zheng WM, Wang JF, Zhan MG, Huang LL, Kang ZS. 2009. SSR analysis of population genetic diversity of Puccinia striiformis f. sp. tritici in longnan region of Gansu, China. Sci Agric Sin. 42:2763–2770.
- Ma Y, Qu SQ, Xu XR, Liang TT, Zang DK. 2015. Genetic diversity analysis of Cotoneaster schantungensis Klotz. Using SRAP marker. Am J Plant Sci. 6:2860–2866.
- Mallikarjuna N, Gowda KTP, Manjunath B, Kiran Kumar KC, Sunil Kumar N. 2007. Turcicum leaf blight disease severity of maize in relation to meteorological factors. Environ Ecol. 25:778–784.
- McDonald BA, Linde C. 2002. Pathogen population genetics, evolutionary potential, and durable resistance. Annu Rev Phytopathol. 40:349–379.
- Milgroom MG. 1996. Recombination and the multilocus structure of fungal populations. Annu Rev Phytopathol. 34:457–477.
- Mitra M. 1923. Helminthosporium spp. on cereals and sugarcane in India. Part I- diseases of zea mays and sorghum vulgare caused by species of Helminthosporium. Dept Agric India. 11:219–242.
- Muiru WM, Koopmann B, Tiedemann AV, Mutitu EW, Kimenju JW. 2010a. Evaluation of genetic variability of Kenyan, German and Austrian isolates of Exserohilum turcicum using amplified fragment length polymorphism DNA marker. Biotechnology. 9:204–211.
- Muiru WM, Koopmann B, Tiedemann AV, Mutitu EW, Kimenju JW. 2010b. Race typing and evaluation of aggressiveness of Exserohilum turcicum isolates of Kenyan, German and Austrian origin. World J Agric Sci. 6:277–284.
- Mutlu N, Boyaci FH, Göcmen M, Abak K. 2008. Development of SRAP, SRAP-RGA, RAPD and SCAR markers linked with a Fusarium wilt resistance gene in eggplant. Theor Appl Genet. 117:1303–1312.
- Nieuwoudt A, Human MP, Craven M, Crampton BG. 2018. Genetic differentiation in populations of Exserohilum turcicum from maize and sorghum in South Africa. Plant Pathol. 67:1483–1491.
- Pasquali M, Komjati H, Lee D, Bayles R. 2010. SRAP technique efficiently generates polymorphisms in Puccinia striiformis isolates. J Phytopathol. 158:708–711.
- Pataky JK, Ledencan T. 2006. Resistance conferred by the Ht1 gene in sweet corn infected by mixtures of virulent and avirulent Exserohilum turcicum. Plant Dis. 90:771–776.
- Pratt RC, Gordon K, Lipps P, Asea G, Bigrawa G, Pixley K. 2003. Use of IPM in the control of multiple diseases of maize. Afr Crop Sci J. 11:189–198.
- Ramathani I, Biruma M, Martin T, Dixelius C, Okori P. 2011. Disease severity, incidence and races of Setosphaeria turcica on sorghum in Uganda. Eur J Plant Pathol. 131:383–392.
- Rohlf FJ. 1993. NTSYS-pc: numerical taxonomy and multivariate analysis system. New York: Exeter Publishing Limited.
- Sambrook J. 1989. Molecular cloning: a laboratory manual. 2nd ed. New York: Cold Spring Harbor Laboratory Press.
- Schechert AW, Welz HG, Geiger HH. 1999. QTL for resistance to Setosphaeria turcica in tropical African maize. Crop Sci. 39:514–523.
- Tang L, Gao ZG, Yao Y, Liu X. 2015. Identification and genetic diversity of formae speciales of Setosphaeria turcica in China. Plant Dis. 99:482–487.
- van Inghelandt D, Melchinger AE, Martinant JP, Stich B. 2012. Genome-wide association mapping of flowering time and northern corn leaf blight (Setosphaeria turcica) resistance in a vast commercial maize germplasm set. BMC Plant Biol. 12:56.
- Wang H, Li H, Zhu Z, Wang X. 2010. Expression of Ht2-related genes in response to the Ht-toxin of Exserohilum turcicum in maize. Ann Appl Biol. 156:111–120.
- Wang YP, Wang XM, Ma Q. 2007. Races of Exserohilum turcicum, causal agent of northern leaf blight in China. J Maize Sci. 15:123–126.
- Weems JD, Bradley CA. 2018. Exserohilum turcicum race population distribution in the north central United States. Plant Dis. 102:292–299.
- Welz HG, Geiger HH. 2000. Genes for resistance to northern corn leaf blight in diverse maize populations. Plant Breed. 119:1–14.
- Wu AG, Yi LY. 1989. Study on physiological races of Helminthosporium turcicum in Yunnan province. Yunnan Agric Sci Technol. 3:18–21.
- Wu HL, Steffenson BJ, Li Y, Oleson AE, Zhong S. 2003. Genetic variation for virulence and RFLP markers in Pyrenophora teres. Can J Plant Pathol. 25:82–90.
- Yeh FC, Yang RC, Boyle TBJ, Ye ZH, Mao JX. 1997. Popgene, the user-friendly shareware for population genetic analysis. Edmonton (AB): Molecular Biology and Biotechnology Centre, University of Alberta.
- Zhang XL, Si BW, Fan CM, Li HJ, Wang XM. 2014. Proteomics identification of differentially expressed leaf proteins in response to Setosphaeria turcica infection in resistant maize. J Integr Agric. 13:789–803.
- Zhao H, Gao ZG, Zhang XF, Zhuang JH, Sui H. 2008. Population of physiological races of Setosphaeria turcica and its dynamic analysis in China. J Shenyang Agric Univ. 39:551–555.
- Zhao J. 1995. Physical geography of China. 3rd ed. Beijing (China): Higher Education Press.