
 ?Mathematical formulae have been encoded as MathML and are displayed in this HTML version using MathJax in order to improve their display. Uncheck the box to turn MathJax off. This feature requires Javascript. Click on a formula to zoom.
Abstract
The goal of this article is to evaluate the informational content of sentiment extracted from news articles about the state of the economy. We propose a fine-grained aspect-based sentiment analysis that has two main characteristics: (a) we consider only the text in the article that is semantically dependent on a term of interest (aspect-based) and, (b) assign a sentiment score to each word based on a dictionary that we develop for applications in economics and finance (fine-grained). Our dataset includes six large U.S. newspapers, for a total of over 6.6 million articles and 4.2 billion words. Our findings suggest that several measures of economic sentiment track closely business cycle fluctuations and that they are relevant predictors for four major macroeconomic variables. We find that there are significant improvements in forecasting when sentiment is considered along with macroeconomic factors. In addition, we also find that sentiment matters to explains the tails of the probability distribution across several macroeconomic variables.
1 Introduction
Economic forecasts are an essential input to design fiscal and monetary policies, and improving their accuracy is a continued challenge for economists. A reason for the often disappointing performance of economic forecasts is that any individual indicator provides a very noisy measure of the state of the economy. In the last 20 years, several methods have been proposed to extract a robust signal from large panels of macroeconomic variables (see Stock and Watson Citation2016, for a comprehensive review). In addition, many economic variables are available only monthly or quarterly and are released with considerable delay, which complicates the monitoring and forecasting of the economy in real-time. This has led to the development of nowcasting methods that capitalize on the continuous flow of economic information released by statistical agencies (see Bańbura et al. Citation2013). Bok et al. (Citation2018) provide a recent and updated discussion of the state of economic forecasting.
A promising path to increase both the accuracy and the timeliness of economic forecasts is to use alternative datasets to complement the information provided by the statistical agencies. By “alternative” we refer to datasets collected as the outcome of a business transaction (e.g., credit card or online purchases), tracking the media (e.g., news or twitter), or internet searches (e.g., google trends) among others. What these datasets have in common is that, in most cases, they are collected in real-time by companies rather than being produced by government agencies through surveys. The researcher is then able to aggregate the granular information in these datasets to build indicators that can be used in forecasting models. Realistically, these alternative indicators should be expected to complement, rather than replace, the macroeconomic variables provided by the government agencies.
On the one hand, the official statistics are very accurate measures of an economic concept of interest (e.g., industrial production or inflation) and the outcome of a well-designed and time-tested sampling strategy. Nevertheless, the fact that these variables are obtained from business and consumer surveys entails an infrequent sampling period (typically, monthly or quarterly), and publication delays deriving from the collection and processing of the answers. On the other hand, indicators based on alternative datasets, in most cases, provide a biased sample of the population and might not measure accurately a specific economic variable. However, they might be available in real-time which makes them very appealing to monitor the state of the economy. Hence, the tradeoff between accuracy of the predictors and their real-time availability summarizes the potential added-value of alternative indicators relative to the official statistics provided by government agencies. A recent example is Lewis, Mertens, and Stock (Citation2020), who construct a weekly indicator of economic activity pooling information from raw steel production, fuel sales, road traffic, and electricity output among others. Other alternative datasets used for nowcasting and forecasting macroeconomic variables are credit card transactions (see Galbraith and Tkacz Citation2018; Aprigliano, Ardizzi, and Monteforte Citation2019), google trends (Choi and Varian Citation2012), road tolls (Askitas and Zimmermann Citation2013) or firm-level data (Fornaro Citation2016).
In this article we use news from six major U.S. outlets as our alternative dataset and construct predictors that measure sentiment about different aspects of economic activity. More specifically, we identify the text in the articles published in a certain day that contains a token (i.e., term) of interest (e.g., economy or inflation). We then consider the words that are semantically dependent on the token of interest and use only those words to calculate the sentiment measure. Our sentiment analysis is thus local in nature, in the sense that it considers only the text related to a term of interest, as opposed to a global approach that evaluates the whole article. The benefit of our methodology is that it provides a more accurate measure of the sentiment associated to an economic concept, instead of measuring sentiment on a large body of text that might involve and mix different economic concepts. In addition, even when topic analysis is used to cluster articles, sentiment is typically calculated by pooling the text of all the articles in the cluster, which might involve the discussion of different economic variables. Another contribution of this article is that we develop a dictionary that we specifically construct having in mind applications in the economic and financial domains. Similarly to Loughran and McDonald (Citation2011), the dictionary contains words that are frequently used in economics and finance and we assign a sentiment value between ±1 rather than categorizing the terms in positive and negative. Then, we use this dictionary to assign a sentiment value to the words related to the term of interest. We refer to our approach as Fine-Grained Aspect-based Sentiment (FiGAS) which highlights the two main ingredients of the approach: a value between ±1 for the sentiment carried by a word based on our dictionary (fine-grained) and the sentiment calculated in a neighborhood of a token of interest and only on semantically related words (aspect-based).
As an illustration, consider the situation in which we are interested to measure the sentiment in the news about the overall state of the economy. In this case we could specify economy as our token of interest and identify the following sentenceFootnote1: Her comments played into the concern that after years of uneven growth, the U.S. economy is becoming more vulnerable to the global slowdown. The term of interest economy is related to the verb become whose meaning is modified by the adjective vulnerable which is further modified by the adverb more.Footnote2 In terms of sentiment, our dictionary assigns a negative value to vulnerable and a positive one to more. Hence, the sentiment associated with the term economy in this sentence will be negative and larger (in absolute value) relative to the sentiment of vulnerable due to the contribution of the adverb more. This example also shows that the approach is interpretable in the sense that it provides the researcher with the information determining the sentiment value relative to alternative approaches, for instance based on machine learning models, that do not provide a narrative (Thorsrud Citation2020).
The interest of economists in using text, such as news, is growing. An early application is Baker, Bloom, and Davis (Citation2016), who construct a measure of economic and political uncertainty based on counting the number of articles that contain tokens of interest. Other articles aim at measuring economic sentiment conveyed by news to explain output and inflation measures for the Unites States (Shapiro, Sudhof, and Wilson in press; Kelly, Manela, and Moreira Citation2018; Bybee et al. Citation2019), the United Kingdom (Kalamara et al. Citation2018), and Norway (Thorsrud Citation2016, Citation2020). More generally, economists are interested in analyzing text as an alternative source of data to answer long standing questions (Gentzkow, Kelly, and Taddy Citation2019), such as the role of central bank communication (Hansen and McMahon Citation2016; Hansen, McMahon, and Prat Citation2017), asset pricing (Calomiris and Mamaysky Citation2019), economic expectations (Lamla and Maag Citation2012; Sharpe, Sinha, and Hollrah Citation2017; Ke, Kelly, and Xiu Citation2019), stock market volatility (Baker et al. Citation2019), and media bias (Gentzkow and Shapiro Citation2010) among others. Overall, these articles show that news provide information relevant to a wide range of applications, although a relevant question is why that is the case. Blinder and Krueger (Citation2004) argue that the media is an important source of information for consumers about the state of the economy. News reported by television and newspapers are an essential input in the formation of expectations and in consumption and investment decisions. In addition, news provide information about a dispersed set of events, such as recently released data, monetary and fiscal decisions, domestic and international economic events, but also provide views about the past, current, and future economic conditions formulated by economists, policy-makers, and financial analysts.
In our empirical application we construct sentiment measures based on over 6.6 million news articles that we use as predictors to forecast the quarterly real GDP growth rate and three monthly variables, namely the growth rate of the Industrial Production Index and the Consumer Price Index, and the change in nonfarm payroll employment. All variables enter the model in real-time, that is, we use all available information up to the date at which we produce the pseudo forecasts. The indicators are designed to capture the sentiment related to a single token of interest (economy, unemployment, inflation) or to a group of tokens of interest, such as monetary policy (e.g., central bank, federal funds, etc), financial sector (e.g., banks, lending, etc), and manufacturing (e.g., manufacturing, industrial production, etc). In addition, we refine the FiGAS approach discussed earlier along two dimensions. First, we identify the prevalent geographic location, if any, of the article. Given our goal of forecasting U.S. macroeconomic variables we exclude from the calculation of sentiment the articles that refer to the rest of the world. Second, we detect the verbal tense of the text related to the token of interest.
Our results are as follows. First, we find that our economic sentiment measures have a strong correlation with the business cycle, in particular for the economy, unemployment and manufacturing measures. In addition, the sentiment about the financial sector and monetary policy shows pessimism during recessions and optimism during expansions, although they tend to fluctuate also in response to other events. In particular, we find that the tendency of the financial sector indicator to be negative during recessions reached dramatic lows during the Great Recession and was followed by a very slow recovery. So, it is encouraging to see that, qualitatively, the proposed measures seem to capture the different phases of the cycle and provide an explanation for the relevance of each variable to the business fluctuations. Second, augmenting a factor-based model with economic sentiment measures delivers higher forecast accuracy. The predictive advantage of sentiment is present also at the longer horizons considered when the macro-factors are less relevant. Instead, at the nowcasting and backcasting horizons the flow of macroeconomic information carries most of the predictive power for nearly all variables. An encouraging result of the analysis is that some of the sentiment measures provide systematically higher accuracy, even in the case of a difficult variable to forecast, such as CPI inflation. In particular, we find that the sentiment about the economy is very very often the most relevant predictor for GDP and nonfarm payroll, the indicators about unemployment and monetary policy helps predicting industrial production, while the financial sector sentiment is important in forecasting the growth rate of CPI.
We also consider the effect of economic sentiment at the tails of the distribution by extending the regression models to the quantile settings. Our results show that sentiment indicators become more powerful predictors when considering the tails of the distribution. In particular, for the monthly variables, we find that indicators related to economy, financial sector and monetary policy contribute significantly to increase forecast accuracy relative to the available macroeconomic information. This is a favorable result that could provide more accurate measures of Growth-at-Risk (see Adrian et al. Citation2018 and Brownlees and Souza Citation2021 for further discussion about Growth-at-Risk applications).
Concluding, there is encouraging evidence to suggest that economic sentiment obtained from news using the FiGAS approach captures useful information in forecasting macroeconomic variables such as quarterly GDP and monthly indicators. These results show that analyzing text from news can be a successful strategy to complement the macroeconomic information deriving from official releases. In addition, the availability of news in real-time allows the high-frequency monitoring of the macroeconomic variables of interest. The article is organized as follows: in Section 2 we introduce the FiGAS approach, the measures of economic sentiment, and the forecasting models. Section 3 describes the dataset. We then continue in Sections 4 and 5 with the discussion of the in-sample and out-of-sample results, respectively. Finally, Section 6 concludes.
2 Methodology
The application of text analysis in economics and finance has, in most cases, the goal of creating an indicator that measures the sentiment or the intensity of a certain topic in the news. Despite this common goal, the literature presents a wide and diverse range of techniques used in the analysis. The first difference among the approaches relates to the way news are selected to compute the indicator. An early approach followed by Tetlock (Citation2007) is to use a column of the Wall Street Journal as the relevant text source, while discarding the rest of the news. An alternative approach is followed by Baker, Bloom, and Davis (Citation2016), who select a subset of articles that contain tokens of interest related to economic and political uncertainty. Several recent articles (see Kelly, Manela, and Moreira Citation2018; Thorsrud Citation2016, Citation2020, among others) rely on topic analysis, such as the Latent Dirichlet Allocation (LDA), which represents an unsupervised modeling approach to clustering articles based on their linguistic similarity. The analysis of the most frequent words within each cluster provides then insights on the topic.
The second difference regards the measure used to compute sentiment or intensity in the selected text. One simple measure that has been used is to count the number of articles that contain the tokens of interest (see Baker, Bloom, and Davis Citation2016) or the number of articles belonging to a certain topic (see Kelly, Manela, and Moreira Citation2018). The goal of such measure is to capture the time-varying attention in the media for a certain topic, although it does not take into account the tone with which the news talk about the topic. An alternative approach is to compute a measure of sentiment which accounts for the positive/negative tone of a word. This is typically done by counting the words that are positive and negative in the text based on a dictionary (see Tetlock Citation2007, for an early application in finance). A sentiment measure is then given by the difference between the number of positive and negative words, standardized by the total number of words in the article. The advantage of this approach is that it measures the strength and the direction of the message reported by the news on a certain topic which is likely to have an impact on the economic decisions of agents. Algaba et al. (Citation2020) is an extensive survey that reviews the recent developments in the application of sentiment analysis to economics and finance. In the following section we describe in general terms our approach to sentiment analysis and how we use these measures to forecast four main macroeconomic indicators. More details on the methodology are provided in Appendix A in the supplementary materials.
2.1 Fine-Grained Aspect-Based Sentiment Analysis
Our FiGAS approach leverages on recent advances in sentiment analysis (Baccianella, Esuli, and Sebastiani Citation2010; Cambria and Hussain Citation2015; Xing, Cambria, and Welsch Citation2018; Cambria et al. Citation2020). It is based on two key elements. The first is that it is fine-grained in the sense that words are assigned a polarity score that ranges between ±1 based on a dictionary. The second feature is that it is aspect-based, that is, it identifies chunks of text in the articles that relate to a certain concept and calculates sentiment only on that text, rather than the full article. To relate this approach to the existing literature, similarly to Baker, Bloom, and Davis (Citation2016) we identify a subset of the text that relates to the aspect or token of interest. In addition, similarly to Tetlock (Citation2007) the sentiment is based on assigning a value or a category (positive/negative) based on a dictionary instead of simply counting the number of articles. A novel aspect of our analysis is that we use a fine-grained dictionary that has not been used previously for applications in economics and finance.
The first step of the analysis consists of creating a list of tokens of interest (ToI)Footnote3 that collects the terms that express a certain economic concept and for which we want to measure sentiment. In our application, we construct six economic indicators based on the following ToI:
economy: economy;
financial sector: bank, derivative, lending, borrowing, real estate, equity market, stock market, bond, insurance rate, exchange rate and combinations of [banking, financial] with [sector, commercial, and investment];
inflation: inflation;
manufacturing: manufacturing and combinations of [industrial, manufacturing, construction, factory, auto] with [sector, production, output, and activity];
monetary policy: central bank, federal reserve, money supply, monetary policy, federal funds, base rate, and interest rate;
unemployment: unemployment.
The selection of topics and ToI is made by the researcher based on the application at hand. In making the choice of ToIs, we were driven by the goal of measuring news sentiment that would be predictive of economic activity. Hence, we designed the ToIs in order to capture text that discusses various aspects of the overall state of the economy, the inflation rate, the unemployment rate, the banking and financial sector, manufacturing, and monetary policy. Given that our application is focused on forecasting U.S. macroeconomic variables, we only selects articles that do not explicitly mention a nation other than the United States.
After selecting a chunk of text that contains one of our ToIs, we continue with the typical Natural Language Processing (NLP) workflow to process and analyze the textFootnote4:
Tokenization and lemmatization: the text is split into meaningful segments (tokens) and words are transformed to their noninflected form (lemmas);
Location detection: we detect the most frequent location that has been identified in the text, if any;
Part-of-Speech (POS) tagging: the text is parsed and tagged (see the supplementary materials for details on the POS);
Dependency Parsing: after a ToI is found in the text, we examine the syntactic dependence of the neighboring tokens with a rule-based approach (see the supplementary materials for more details);
Tense detection: we detect the tense of the verb, if any, related to the ToI;
Negation handling: the sentiment score is multiplied by –1 when a negation term is detected in the text.
The core of the FiGAS approach are the semantic rules that are used to parse the dependence between the ToI and the dependent terms in the neighboring text. Once these words are identified, we assign them a sentiment score which we then aggregate to obtain a sentiment value for the sentence. These sentiment scores are obtained from a fine-grained dictionary that we developed based on the dictionary of Loughran and McDonald (Citation2011) and additional details are provided in the supplementary materials. Each score is defined over [–1, 1] and sentiment is propagated to the other tokens such that the overall tone of the sentence remains defined on the same interval. We then obtain a daily sentiment indicator for the topic by summing the scores assigned to the selected sentences for that day. Hence, our sentiment indicator accounts both for the volume of articles in each day as well as for the sentiment. The resulting sentiment indicator is thus aspect-based, since it refers to a certain topic of interest, and fine-grained, since it is computed using sentiment scores defined on [–1, 1].
An additional feature of the proposed algorithm is the possibility of detecting the verbal tense of a sentence. To shorten the presentation we build our sentiment indicators aggregating over all tenses and report the results for the sentiment of the individual verbal tenses in Appendix B in the supplementary materials. We refer to Consoli, Barbaglia, and Manzan (in press) for a detailed technical presentation of the proposed algorithm and for a comparison with other sentiment analysis methods that have been presented in the literature. Finally, Python and R packages that perform the FiGAS analysis are available on the authors’ personal websites.
2.2 Forecasting Models
The goal of our analysis is to produce forecasts for the value of a macroeconomic variable in period t released in day d, which we denote by . We introduce the index d to track the real-time information flow available to forecasters, and to separate it from the index t that represents the reference period of the variable (e.g., at the monthly or quarterly frequency). As we discuss in Section 3, in the empirical application we keep track of the release dates of all the macroeconomic variables included in the analysis. This allows us to mimic the information set that is available to forecasters on the day the forecast was produced. We indicate by
the vector of predictors and lags of the dependent variable that are available to the forecaster on day d – h, that is, h days before the official release day d of the variable. Since in our application the vector
includes variables at different frequencies, we use the Unrestricted MIDAS (U-MIDAS) approach proposed by Marcellino and Schumacher (Citation2010) and Foroni, Marcellino, and Schumacher (Citation2015), that consists of including the weekly and monthly predictors and their lags as regressors. Hence,
includes an intercept, lagged values of the variable being forecast, and current and past values of weekly and monthly macroeconomic and financial indicators. The forecasting model that we consider is given by:
(1)
(1) where
is defined above,
is a scalar representing a sentiment measure available in day d – h, ηh and βh are parameters to be estimated, and
is an error term. The parameter ηh represents the effect of a current change in the sentiment measure on the future realization of the macroeconomic variable, conditional on a set of control variables. Notice that the model in EquationEquation (1)
(1)
(1) can also be interpreted in terms of the local projection method of Jordà (Citation2005).
In our application, we include a large number of predictors that might negatively affect the accuracy of the estimate due to the limited sample size available for quarterly and monthly variables. In order to reduce the number of regressors to a smaller set of relevant predictors, we use the lasso penalization approach proposed by Tibshirani (Citation1996). The selected predictors are then used to estimate EquationEquation (1)(1)
(1) in a post-lasso step that corrects the bias introduced by the shrinkage procedure and allows to assess the statistical significance of the sentiment measures. Unfortunately, this post-single lasso procedure produces inconsistent estimates due to the likelihood of omitting some relevant predictors from the final model. To account for this issue, we select the most important regressors relying on the data-driven double lasso approach proposed in Belloni, Chernozhukov, and Hansen (Citation2014). This approach delivers consistent estimates of the parameters and is likely to have better finite sample properties which is especially important given the moderate sample size in the current application. The post double lasso procedure is implemented in the following two steps. First, variables are selected using lasso selection in EquationEquation (1)
(1)
(1) , but also from a regression of the target variable, in our case the sentiment measure
on
, that is
(2)
(2)
In the second step, the union of the variables selected in the two lasso first stage regressions are used to estimates EquationEquation (1)(1)
(1) by OLS. Belloni, Chernozhukov, and Hansen (Citation2014) shows the consistency and the asymptotic normality of the estimator of ηh.
The focus on the conditional mean disregards the fact that predictability could be heterogeneous at different parts of the conditional distribution. This situation could arise when a sentiment indicator might be relevant to forecast, for instance, low quantiles rather than the central or high quantiles. There is evidence in the literature to support the asymmetric effects of macroeconomic and financial variables in forecasting economic activity, and in particular at low quantiles (see Manzan and Zerom Citation2013; Manzan Citation2015; Adrian, Boyarchenko, and Giannone Citation2019, among others). To investigate this issue we extend the model in EquationEquation (1)(1)
(1) to a quantile framework:
(3)
(3) where
is the τ-level quantile forecast of
at horizon h. The lasso penalized quantile regression proposed by Koenker (Citation2011) can be used for variable selection in EquationEquation (3)
(3)
(3) , followed by a post-lasso step to eliminate the shrinkage bias. Similarly to the conditional mean case, the post-lasso estimator of
could be inconsistent due to the possible elimination of relevant variables during the selection step. Following Belloni, Chernozhukov, and Kato (Citation2019), we implement the weighted double selection procedure to perform robust inference in the quantile setting. In the first step the method estimates EquationEquation (3)
(3)
(3) using the lasso penalized quantile regression estimator. The fitted quantiles are then used to estimate the conditional density of the error at zero which provides the weights for a penalized lasso weighted mean regression of
on
. In the second step, the union of the variables selected in the first stage regressions are used to estimate the model in EquationEquation (3)
(3)
(3) weighted by the density mentioned earlier. The resulting
represents the post double lasso estimate at quantile τ and it is asymptotically normally distributed. More details are available in Belloni, Chernozhukov, and Kato (Citation2019).
In the empirical application, the baseline specification includes lags of the dependent variable and three macroeconomic factors that summarize the variation across large panels of macroeconomic and financial variables. We denote this specification as ARX, and by ARXS the ARX specification augmented by the sentiment measures.
3 Data
Our news dataset is extracted from the Dow Jones Data, News and Analytics (DNA) platform.Footnote5 We obtain articles for six newspapersFootnote6 from the beginning of January 1980 until the end of December 2019 and select articles in all categories excluding sport news.Footnote7 The dataset thus includes 6.6 million articles and 4.2 billion words. The information provided for each article consists of the date of publication, the title, the body of the article, the author(s), and the category. As concerns the macroeconomic dataset, we obtain real-time data from the Philadelphia Fed and from the Saint Louis Fed ALFRED repository,Footnote8 that provides the historical vintages of the variables, including the date of each macroeconomic release. The variables that we include in our analysis are: real GDP (GDPC1), Industrial Production Index (INDPRO), total Nonfarm Payroll Employment (PAYEMS), Consumer Price Index (CPIAUCSL), the Chicago Fed National Activity Index (CFNAI), and the National Financial Conditions Index (NFCI). The first four variables represent the object of our forecasting exercise and are available at the monthly frequency, except for GDPC1 that is available quarterly. The CFNAI is available monthly and represents a diffusion index produced by the Chicago Fed that summarizes the information on 85 monthly variables (see Brave and Butters Citation2014). Instead, the NFCI is a weekly indicator of the state of financial markets in the United States and is constructed using 105 financial variables with a methodology similar to CFNAI (see Brave Citation2009). In addition, we also include in the analysis the ADS Index proposed by Aruoba, Diebold, and Scotti (Citation2009) that is maintained by the Philadelphia Fed. ADS is updated at the daily frequency and it is constructed based on a small set of macroeconomic variables available at the weekly, monthly and quarterly frequency. In the empirical application we aggregate to the weekly frequency by averaging the values within the week. We will use these three macroeconomic and financial indicators as our predictors of the four target variables. The ADS, CFNAI, and NFCI indicators provide a parsimonious way to include information about a wide array of economic and financial variables that proxy well for the state of the economy.Footnote9 To induce stationarity in the target variables, we take the first difference of PAYEMS, and the percentage growth rate for INDPRO, GDPC1, and CPIAUCSL.
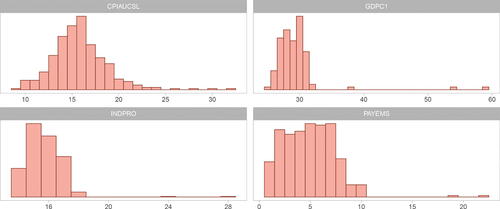
The release dates provided by ALFRED are available since the beginning of our sample in 1980 with two exceptions. For GDPC1, vintages are available since December 1991 and for CFNAI only starting with the May 2011 release. shows the publication lag for the first release of the four variables that we forecast. The monthly flow of macroeconomic information begins with the Bureau of Labor Statistics employment report that includes PAYEMS, typically in the first week of the month. During the second and third week of the month, CPIAUCSL and INDPRO are announced. Finally, the advance estimate of real GDP is released toward the end of the month following the reference quarter. We verified the dates of the outliers that appear in the figure and they correspond to governmental shutdowns that delayed the release beyond the typical period. Based on the vintages available since May 2011, the release of CFNAI typically happens between 19 and 28 days after the end of the reference period, with a median delay of 23 days. For the sample period before May 2011, we assign the 23rd day of the month as the release date of the CFNAI. This assumption is obviously inaccurate as it does not take into account that the release date could happen during the weekend and other possible patterns (e.g., the Friday of the third week of the month). In our empirical exercise the release date is an important element since it keeps track of the information flow and it is used to synchronize the macroeconomic releases and the news arrival. However, we do not expect that the assumption on the CFNAI release date could create significant problems in the empirical exercise. This is because the release of CFNAI is adjusted to the release calendar of the 85 monthly constituent variables so that no major releases in monthly macroeconomic variables should occur after the 23rd of the month.
Fig. 1 Histogram of the number of days between the end of the reference period and the date of the first release of the dependent variables, namely CPIAUCSL, GDPC1, INDPRO and PAYEMS.
3.1 Economic Sentiment Measures
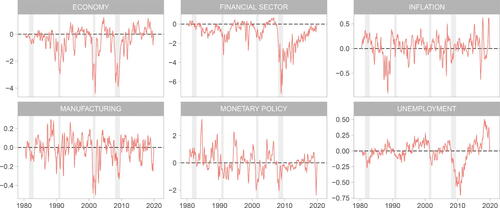
shows the six time series of the economic sentiment sampled at the monthly frequency when we consider all verbal tenses, together with the NBER recessions. The sentiment measures for economy and manufacturing seem to broadly vary with the business cycle fluctuations and becoming more pessimistic during recessions. The unemployment indicator follows a similar pattern, although the 2008–2009 recession represented a more extreme event with a slow recovery in sentiment. The measure for the financial sector indicates that during the Great Recession of 2008–2009 there was large and negative sentiment about the banking sector. As mentioned earlier, our sentiment measure depends both on the volume of news as well as on its tone. The financial crisis was characterized by a high volume of text related to the financial sector which was mostly negative in sentiment. The uniqueness of the Great Recession as a crisis arising from the financial sector is evident when comparing the level of sentiment relative to the values in earlier recessionary periods. The sentiment for monetary policy and inflation seems to co-vary to a lesser extent with the business cycle. In particular, negative values of the indicator of monetary policy seem to be associated with the decline in rates as it happens during recessionary periods, while positive values seems to be associated with expansionary phases.
Fig. 2 Time series of the sentiment measures for all verbal tenses. The daily series is smoothed by taking a moving-average of 30 days and then subsampled at monthly frequencies. The gray areas denote the NBER recessionary periods.
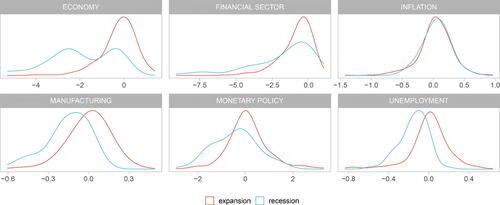
In we calculate the smoothed distribution of the sentiment measures separately for expansions and recessions. For all measures, except unemployment, the density during recessions looks shifted to the left and shows a long left tail relative to the distribution during expansionary periods. Hence, the news sentiment about economic activity seems to capture the overall state of the economy and its transition between expansions and recessions. These graphs show also some interesting facts. One is the bimodality of the economy sentiment during recessions. Based on the time series graph in , the bimodality does not seem to arise because of recessions of different severity, as in the last three recessions the indicator reached a minimum smaller than –2. Rather, the bimodality seems to reflect different phases of a contraction, one state with sentiment slowly deteriorating followed by a jump to a state around the trough of the recession with rapidly deteriorating sentiment. Another interesting finding is that sentiment about inflation does not seem to vary significantly over the stages of the cycle. For manufacturing and unemployment the distribution of sentiment during recessions seems consistent with a shift of the mean of the distribution, while the variance appears to be similar in the two phases.
Fig. 3 Kernel density of the economic sentiment measures for all verbal tenses separately for periods of expansion (red) and recession (green) as defined by the NBER business cycle committee. The density is calculated on the monthly series.
4 In-Sample Analysis
In this section we evaluate the statistical significance of the sentiment measures as predictors of economic activity on the full sample period that ranges from the beginning of 1980 to the end of 2019.
4.1 Significance of the Economic Sentiment Measures
shows the statistical significance of the coefficient estimate associated to a sentiment measure, that is in EquationEquation (1)
(1)
(1) , based on the double lasso procedure discussed in Section 2. A tile at a given horizon h indicates that the sentiment measure has a p-value smaller than 10% and darker shades indicate smaller p-values. The fact that we are testing simultaneously many hypotheses might lead to spurious evidence of significance (see James et al. Citation2021 for a recent discussion). To account for the multiple testing nature of our exercise, we adjust the p-values associated to each sentiment reported in for multiple testing based on the approach proposed by Benjamini and Hochberg (Citation1995) and Benjamini, Krieger, and Yekutieli (Citation2006). The goal of the method is to control the False Discovery Rate that represents the expected rejection rate of a null hypothesis that is true. If we denote by
(for
) the p-value of hypothesis j sorted from smallest to largest, the adjusted p-value is given by
. The power of the test can be improved if we assume that the number of null hypothesis that are true (S0) is smaller relative to the number of hypotheses being tested (S). In this case the adjusted p-value is given by
, where S0 can be estimated following the two-step approach proposed by Benjamini, Krieger, and Yekutieli (Citation2006). The first step of the procedure is to determine the number of rejected hypothesis (R) based on the Benjamini and Hochberg (Citation1995) adjusted p-values. S0 is then set equal to S – R and used to adjust the p-values as explained above.Footnote10
Fig. 4 Statistical significance of the sentiment measures based on the double lasso penalized regression in EquationEquation (1)(1)
(1) at each horizon h. The statistic reported is the p-value of the sentiment coefficient ηh corrected for multiple testing. The colors depend on the p-value for those variables that are significant at least at 10%: the darker the tile’s color, the smaller the p-value. The gray-shaded area corresponds to the reference period.
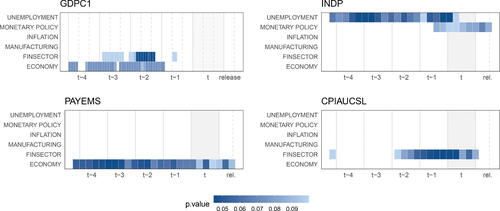
The top-left plot in reports the significance results for GDPC1. We find that the most significant indicators are the financial sector and economy sentiments that are consistently selected at several horizons between quarter t – 4 and t – 2. This suggests that news sentiment at longer horizons is relevant to predict GDP growth, while at shorter horizons hard macroeconomic indicators become more relevant. The results for the monthly indicators also show that the predictability is concentrated on a few sentiment measures. In particular, sentiment about unemployment is significant at most horizons when forecasting INDP, while the monetary policy measure is significant at the nowcasting horizons. However, when predicting nonfarm payroll employment (PAYEMS) we find that only the economy indicator is a strongly significant predictor at all horizons. The financial sector sentiment measure is also significant for CPI inflation starting from month t – 2. Overall, our in-sample analysis suggests that predictability embedded in these news sentiment indicators is concentrated in one or two of the sentiment measures, depending on the variable being forecast. In addition, the horizons at which news sentiment matters seems also different across variables. While for the GPDC1 and INDP we find that the indicators are mostly relevant at long horizons, for CPIAUCSL the significance is mostly at the shortest horizons. Only in the case of PAYEMS we find that a sentiment indicators is significant at all horizons considered.
4.2 Quantile Analysis
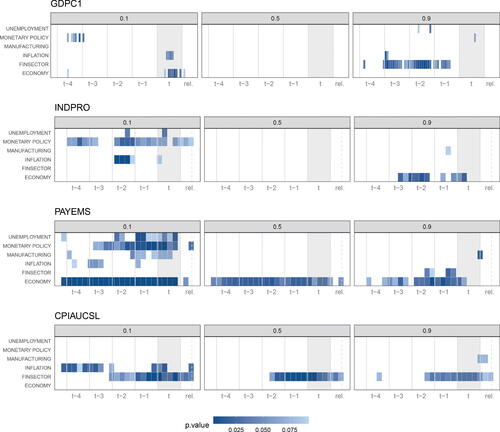
In we report the adjusted p-values smaller than 0.10 at each quantile level using the double lasso estimation procedure (Belloni, Chernozhukov, and Kato Citation2019). The evidence suggests that some sentiment measures are significant in forecasting GDPC1 at 0.1 and 0.9 quantiles. In particular, the economy and inflation sentiment indicators are significant on the left tail of the distribution at some nowcasting horizons that correspond to the release of the previous quarter figures. Instead, sentiment about the financial sector is the most significant indicator at the highest quantile between quarter t – 3 and t – 1. Interestingly, no indicator is significant at the median, although we find that the financial sector and the economy measures are significant in predicting the mean. A possible explanation for this result is that the conditional mean is more influenced, relative to the median, by the extreme events that occurred during the financial crises of 2008–2009. This is particularly true in the case of GDP given the relative short time series available. Similarly to the case of GDPC1, the results for INDPRO show that the significance of the sentiment measures is concentrated at low and high quantiles. The sentiment about monetary policy is selected at several horizons while the inflation indicator is selected mostly during month t – 2 on the left tail of the distribution. Instead, at the top quantile of the INDPRO distribution we find that the economy sentiment measure is strongly significant at horizons between t – 3 and t. The economy indicator confirms to be a useful predictor for PAYEMS with strong significance across all quantiles and horizons considered. In addition, the unemployment, manufacturing and monetary policy measures provide forecasting power at short horizons on the left tail of the distribution. With respect to CPIAUCSL, the financial sector indicator is statistically significant for horizons starting from t – 2 to month r at all quantiles confirming the results of . In addition, the sentiment about inflation is a relevant predictor at the lowest quantile for horizons from t – 3, t, and t – 4, and sporadically at shorter horizons.
Fig. 5 Significance of the sentiment measures based on the double lasso penalized quantile regression at each horizon h for quantiles 0.1 (left column), 0.5 (center) and 0.9 (right). The colors depend on the p-value corrected for multiple testing for those variables that are significant at least at 10%: the darker the tile’s color, the smaller the p-value. The gray-shaded area corresponds to the reference period.
5 Out-of-Sample Analysis
In this section we evaluate the robustness of the previous results to an out-of-sample test. We forecast the economic indicators from the beginning of 2002 until the end of 2019, a period that includes the Great Recession of 2008–2009. In our application, the benchmark for the relative accuracy test is the ARX specification while the alternative model augments the macroeconomic and financial information set with the sentiment indicators. In addition, we also consider an Average forecast obtained by averaging the ARXS forecasts and a LASSO forecast that is obtained by lasso selection among a set of regressors that includes lagged values of the dependent variable, the three macroeconomic indicators, and the six sentiment indicators. We compare the forecast accuracy of the sentiment-augmented specifications at each individual horizon as well as jointly at all horizons using the average Superior Predictive Ability (aSPA) test proposed by Quaedvlieg (Citation2021).Footnote11 The evaluation of the point forecasts is performed using the square loss function that is defined as , where
represents the loss function and
is the error in forecasting the period t release based on the information available on day d – h. Instead, the evaluation of the quantile forecasts is based on the check loss function defined as
, where τ represents the quantile level and
. The choice of this loss function to evaluate quantiles is similar to Giacomini and Komunjer (Citation2005) and is guided by the objective of aligning the loss used in estimation and in evaluation, as discussed in Gneiting (Citation2011). In addition, we also consider the loss function
that evaluates the conditional coverage of the one-sided interval at level τ. This loss function is relevant when the goal is to evaluate the coverage of an interval as in the applications to Growth-at-Risk at quantile levels 0.05 and 0.10 (see Adrian, Boyarchenko, and Giannone Citation2019 and Corradi, Fosten, and Gutknecht Citation2020). Finally, the out-of-sample exercise is performed in real-time by providing the forecasting models with the vintage of macroeconomic information that was available at the time the forecast was made. We report results for the evaluation of the forecasts with respect to the second release, and results for the preliminary estimate are qualitatively similar.
5.1 Performance of Point Forecasts
reports the p-values of the aSPA test for the null hypothesis that the forecasts from the alternative models do not outperform the benchmark forecasts at any horizons. The results for GDP indicate that the average forecasts have the lowest p-value at 0.143, although it is not statistically significant at 10%. For INDP we find that sentiment about manufacturing, monetary policy, and unemployment significantly improves the forecast accuracy relative to the ARX forecasts across all horizons. Instead, the sentiment about the economy delivers significantly more accurate forecasts for PAYEMS, while sentiment about the financial sector is useful when forecasting CPI inflation. The six sentiment indicators were designed to capture different aspects of economic activity, such as the real economy (manufacturing and economy), the price level (inflation), the labor market (unemployment), and the financial sector (financial sector and monetary policy). It is thus not surprising that only few of them are relevant to predict these different macroeconomic variables. Furthermore, the out-of-sample significance of the sentiment indicators confirms, to a large extent, the in-sample results provided in .Footnote12. As concerns the average forecasts, we find that they are significantly better for all the monthly variables while the LASSO is significant only in the case of PAYEMS.Footnote13.
Table 1 One-sided p-values of the aSPA multi-horizon test proposed by Quaedvlieg (Citation2021).
5.2 Performance of Quantile Forecasts
shows the results of the multi-horizon accuracy test applied to the quantile forecasts. The results for the individual quantile evaluation in the first three columns of the table indicate that the sentiment measures do not improve significantly when forecasting quarterly GDP, with only the average achieving p-values of 0.115 and 0.237 at the 0.5 and 0.9 quantiles, respectively. However, when predicting the monthly indicators we find that the average forecasts are significantly more accurate for all variables and for most quantile levels. The LASSO forecasting model outperforms the benchmark at the lowest quantile for PAYEMS, and at the median and lowest quantiles when forecasting CPI inflation. In terms of the ARXS specification, we find that the sentiment about the economy is useful to predict the tail quantiles of PAYEMS, while financial sector and manufacturing contribute to more accurate forecasts at the lowest quantile. Interestingly, we find that sentiment about inflation is a powerful predictor of future CPI inflation both at the lowest and median quantiles, while financial sector is only relevant at the median and monetary policy on the right-tail of the distribution.
Table 2 One-sided p-values of the aSPA multi-horizon test proposed by Quaedvlieg (Citation2021).
The last column of shows the p-value of the multi-horizon test for the pairwise comparison of the conditional coverage of the left open interval at 10%. We find that the financial sector sentiment delivers significantly more accurate interval forecasts for INDP and PAYEMS, while sentiment about the economy and monetary policy have more accurate coverage, relative to the benchmark, for CPI. Testing conditional coverage on the left tail of the distribution entails periods with large negative errors which, in our out-of-sample period, occurred to a large extent during the Great Recession of 2008–2009. It is not thus surprising that sentiment deriving from news about the financial sector, the state of the economy and the conduct of monetary policy contributed to produce more accurate coverage on the left tail. Also, the table shows that in some cases the sentiment measures might be a significant predictor for a certain quantile but not for the interval. This result is consistent with the fact that different loss functions evaluate different aspects of the density forecast and thus might lead to contrasting conclusions regarding the significance of the sentiment measures.
6 Conclusion
Macroeconomic forecasting has long relied on building increasingly complex econometric models to optimally use the information provided by statistical agencies. The recent availability of alternative datasets is leading the way for macroeconomists to create their own macroeconomic indicators to use along with the official statistics, thus, enriching their information set. In this article we provide an example of this new approach that uses over four billion words from newspaper articles over 40 years to create proxies for different aspects of economic sentiment. Our findings show the potential for using the sentiment measures in economic forecasting applications, providing reliable measures to use together with official macroeconomic statistics. An important advantage of using alternative datasets is that measures of economic activity can be constructed by the researcher at the daily frequency and in real-time, such as in the case of our sentiment indicators. In addition, the availability of the granular data opens the possibility for the researcher to investigate ways to produce more powerful indicators. Our encouraging results indicate that sentiment extracted from text, and in particular news, is a promising route to follow, which could lead to significant improvements in macro-economic forecasting accuracy. However, the application of text analysis in economics and finance is still in its infancy and more work is needed to understand its potential and relevance in different fields of economics and finance.
Supplemental Material
Download PDF (655.2 KB)Acknowledgments
The views expressed are purely those of the authors and should not, in any circumstance, be regarded as stating an official position of the European Commission. We are grateful to participants of the “Alternative datasets for Macro Analysis and Monetary Policy” conference held at Bocconi University, the “Nontraditional Data and Statistical Learning with Applications to Macroeconomics” Banca d’Italia and Federal Reserve Board joint conference, and seminar participants at the Bank of Spain, University of Amsterdam, Universidad Autonoma de Madrid and Maastricht University for numerous comments that significantly improved the article. We are also greatly indebted to the Associate Editor and Referees for insightful comments and to the Centre for Advanced Studies at the Joint Research Centre for the support, encouragement, and stimulating environment while working on the bigNOMICS project.
Supplementary Materials
The supplementary appendix to this article provides additional results about the proposed sentiment measures and the forecast comparison in the present article. In particular, Section A provides a detailed presentation of the sentiment analysis algorithm. Section B explores the added-value of sentiment indicators decomposed by verbal tense, while Section C compares the proposed measures with the News Sentiment Index. Fluctuations in the forecasting performance are analyzed in Section D. Finally, Section E evaluates the robustness of the results in terms of goodness-of-fit and forecast error.
Notes
1 The sentence was published in the Wall Street Journal on 11/02/2016.
2 Notice that become, more and vulnerable are directly associated to the term of interest, while global slowdown is indirectly related through the dependence with vulnerable.
3 To find an exhaustive list of terms on a certain economic concept we rely on the World Bank Ontology available at http://vocabulary.worldbank.org/thesaurus.html.
4 For all our NLP tasks we use the spaCy Python library and rely on the en_core_web_lg linguistic model.
5 Dow Jones DNA platform accessible at https://professional.dowjones.com/developer-platform/.
6 The New York Times, Wall Street Journal, Washington Post, Dallas Morning News, San Francisco Chronicle, and the Chicago Sun-Times. The selection of these newspapers should mitigate the effect of media coverage over time on our analysis since they represent the most popular outlets that cover the full sample period from 1980 to 2019.
7 More specifically we consider articles that are classified by Dow Jones DNA in at least one of the categories: economic news (ECAT), monetary/financial news (MCAT), corporate news (CCAT), and general news (GCAT).
8 Saint Louis Fed ALFRED data repository accessible at https://alfred.stlouisfed.org/.
9 An issue with using the three indexes is their real-time availability in the sample period considered in this study. In particular, the methodology developed by Stock and Watson (Citation1999) was adopted by the Chicago Fed to construct the CFNAI index and, much later, the NFCI (Brave and Butters Citation2011). The ADS Index was proposed by Aruoba, Diebold, and Scotti (Citation2009) and since then it is publicly available at the Philadelphia Fed. Since we start our out-of-sample exercise in 2002, forecasters had only available the CFNAI in real-time while the ADS and NFCI indexes were available only later. Although this might be a concern for the real-time interpretability of our findings, we believe there are also advantages in using them in our analysis. The most important benefit is that the indexes provide a parsimonious way to control for a large set of macroeconomic and financial variables that forecasters observed when producing their forecast that are correlated with the state of the economy and our news sentiment.
10 We correct for multiple testing across forecasting horizons by setting S equal to the number of horizons (i.e., 69 for quarterly GDP and 25 for all monthly variables). This approach is consistent with the methodology followed in Section 5 where we test the out-of-sample predictive ability jointly across horizons.
11 In the application we use a block length of 3 and 999 bootstrap replications as in Quaedvlieg (Citation2021).
12 In Section D in the supplementary materials we perform a fluctuation analysis of the relative forecast performance based on the test proposed by Giacomini and Rossi (Citation2010). The findings suggest that the higher accuracy of news-based forecasts is episodic, in the sense that it emerges during specific periods while in other periods news do not seem to add predictive power relative to purely macro-based forecasts.
13 In the supplementary materials we include some additional results for the point forecasts. In particular, in Section E in the supplementary materials we discuss the economic importance of the forecast gains by looking at the relative improvements in terms of goodness-of-fit and forecast error, while in Section C in the supplementary materials we compare the performance of the FiGAS-based sentiment indicators to the News Sentiment Index proposed by Shapiro, Sudhof, and Wilson (in press).
References
- Adrian, T., Boyarchenko, N., and Giannone, D. (2019), “Vulnerable Growth,” American Economic Review, 109, 1263–1289. DOI: 10.1257/aer.20161923.
- Adrian, T., Grinberg, F., Liang, N., and Malik, S. (2018), “The Term Structure of Growth-at-Risk,” IMF working paper WP/18/180. DOI: 10.5089/9781484372364.001.
- Algaba, A., Ardia, D., Bluteau, K., Borms, S., and Boudt, K. (2020), “Econometrics Meets Sentiment: An Overview of Methodology and Applications,” Journal of Economic Surveys, 34, 512–547. DOI: 10.1111/joes.12370.
- Aprigliano, V., Ardizzi, G., Monteforte, L. (2019), “Using the Payment System Data to Forecast the Economic Activity,” International Journal of Central Banking, 15, 55–80.
- Aruoba, S. B., Diebold, F. X., and Scotti, C. (2009), “Real-Time Measurement of Business Conditions,” Journal of Business & Economic Statistics, 27, 417–427.
- Askitas, N., and Zimmermann, K. F. (2013), “Nowcasting Business Cycles Using Toll Data,” Journal of Forecasting, 32, 299–306. DOI: 10.1002/for.1262.
- Baccianella, S., Esuli, A., and Sebastiani, F. (2010), “Sentiwordnet 3.0: An Enhanced Lexical Resource for Sentiment Analysis and Opinion Mining,” in LREC (Vol. 10), pp. 2200–2204.
- Baker, S. R., Bloom, N., and Davis, S. J. (2016), “Measuring Economic Policy Uncertainty,” Quarterly Journal of Economics, 131, 1593–1636. DOI: 10.1093/qje/qjw024.
- Baker, S. R., Bloom, N., Davis, S. J., and Kost, K. J. (2019), “Policy News and Stock Market Volatility,” Technical report, National Bureau of Economic Research, working paper 25720.
- Bańbura, M., Giannone, D., Modugno, M., and Reichlin, L. (2013), “Now-Casting and the Real-Time Data Flow,” in Handbook of Economic Forecasting (Vol. 2), pp. 195–237, Amsterdam: Elsevier.
- Belloni, A., Chernozhukov, V., and Hansen, C. (2014), “Inference on Treatment Effects After Selection Among High-Dimensional Controls,” The Review of Economic Studies, 81, 608–650. DOI: 10.1093/restud/rdt044.
- Belloni, A., Chernozhukov, V., and Kato, K. (2019), “Valid Post-Selection Inference in High-Dimensional Approximately Sparse Quantile Regression Models,” Journal of the American Statistical Association, 114, 749–758. DOI: 10.1080/01621459.2018.1442339.
- Benjamini, Y., and Hochberg, Y. (1995), “Controlling the False Discovery Rate: A Practical and Powerful Approach to Multiple Testing,” Journal of the Royal Statistical Society, Series B, 57, 289–300. DOI: 10.1111/j.2517-6161.1995.tb02031.x.
- Benjamini, Y., Krieger, A. M., and Yekutieli, D. (2006), “Adaptive Linear Step-up Procedures that Control the False Discovery Rate,” Biometrika, 93, 491–507. DOI: 10.1093/biomet/93.3.491.
- Blinder, A. S., and Krueger, A. B. (2004), “What Does the Public Know about Economic Policy, and How Does it Know it?” Technical report, National Bureau of Economic Research, working paper 10787.
- Bok, B., Caratelli, D., Giannone, D., Sbordone, A. M., and Tambalotti, A. (2018), “Macroeconomic Nowcasting and Forecasting with Big Data,” Annual Review of Economics, 10, 615–643. DOI: 10.1146/annurev-economics-080217-053214.
- Brave, S. (2009), “The Chicago Fed National Activity Index and Business Cycles,” Chicago Fed Letter, 268, 1–4.
- Brave, S. A., and Butters, R. (2014), “Nowcasting Using the Chicago Fed National Activity Index,” Economic Perspectives, 38, 569–594.
- Brave, S. A., and Butters, R. A. (2011), “Monitoring Financial Stability: A Financial Conditions Index Approach,” Economic Perspectives, 35, 22–43.
- Brownlees, C., and Souza, A. B. (2021), “Backtesting Global Growth-at-Risk,” Journal of Monetary Economics, 118, 312–330. DOI: 10.1016/j.jmoneco.2020.11.003.
- Bybee, L., Kelly, B. T., Manela, A., and Xiu, D. (2019), “The Structure of Economic News,” technical report, National Bureau of Economic Research. Working paper 26648.
- Calomiris, C. W., and Mamaysky, H. (2019), “How News and its Context Drive Risk and Returns Around the World,” Journal of Financial Economics, 133, 299–336. DOI: 10.1016/j.jfineco.2018.11.009.
- Cambria, E., and Hussain, A. (2015), Sentic Computing: A Common-Sense-Based Framework for Concept-Level Sentiment Analysis, Cham: Springer.
- Cambria, E., Li, Y., Xing, F., Poria, S., and Kwok, K. (2020), “SenticNet 6: Ensemble Application of Symbolic and Subsymbolic AI for Sentiment Analysis,” in International Conference on Information and Knowledge Management (CIKM), Proceedings, pp. 105–114. DOI: 10.1145/3340531.3412003.
- Choi, H., and Varian, H. (2012), “Predicting the Present with Google Trends,” Economic Record, 88, 2–9. DOI: 10.1111/j.1475-4932.2012.00809.x.
- Consoli, S., Barbaglia, L., and Manzan, S. (in press), “Fine-Grained, Aspect-Based Sentiment Analysis on Economic and Financial Lexicon,” Knowledge-Based Systems.
- Corradi, V., Fosten, J., and Gutknecht, D. (2020), “Conditional Quantile Coverage: An Application to Growth-at-Risk,” available at SSRN 3670575.
- Fornaro, P. (2016), “Predicting Finnish Economic Activity Using Firm-Level Data,” International Journal of Forecasting, 32, 10–19. DOI: 10.1016/j.ijforecast.2015.04.002.
- Foroni, C., Marcellino, M., and Schumacher, C. (2015), “Unrestricted Mixed Data Sampling (MIDAS): MIDAS Regressions with Unrestricted Lag Polynomials,” Journal of the Royal Statistical Society, Series A, 178, 57–82. DOI: 10.1111/rssa.12043.
- Galbraith, J. W., and Tkacz, G. (2018), “Nowcasting with Payments System Data,” International Journal of Forecasting, 34, 366–376. DOI: 10.1016/j.ijforecast.2016.10.002.
- Gentzkow, M., Kelly, B., and Taddy, M. (2019), “Text as Data,” Journal of Economic Literature, 57, 535–574. DOI: 10.1257/jel.20181020.
- Gentzkow, M., and Shapiro, J. M. (2010), “What Drives Media Slant? Evidence from US Daily Newspapers,” Econometrica, 78, 35–71.
- Giacomini, R., and Komunjer, I. (2005), “Evaluation and combination of conditional Quantile Forecasts,” Journal of Business & Economic Statistics, 23, 416–431.
- Giacomini, R., and Rossi, B. (2010), “Forecast Comparisons in Unstable Environments,” Journal of Applied Econometrics, 25, 595–620. DOI: 10.1002/jae.1177.
- Gneiting, T. (2011), “Making and Evaluating Point Forecasts,” Journal of the American Statistical Association, 106, 746–762. DOI: 10.1198/jasa.2011.r10138.
- Hansen, S., and McMahon, M. (2016), “Shocking Language: Understanding the Macroeconomic Effects of Central Bank Communication,” Journal of International Economics, 99, S114–S133. DOI: 10.1016/j.jinteco.2015.12.008.
- Hansen, S., McMahon, M., and Prat, A. (2017), “Transparency and Deliberation within the FOMC: A Computational Linguistics Approach,” Quarterly Journal of Economics, 133, 801–870. DOI: 10.1093/qje/qjx045.
- James, G., Witten, D., Hastie, T., and Tibshirani, R. (2021), “Multiple Testing,” in An Introduction to Statistical Learning, pp. 553–595, New York: Springer.
- Jordà, Ò. (2005), “Estimation and Inference of Impulse Responses by Local Projections,” American Economic Review, 95, 161–182. DOI: 10.1257/0002828053828518.
- Kalamara, E., Turrell, A., Kapetanios, G., Kapadia, S., and Redl, C. (2018), “Making Text Count for Macroeconomics: What Newspaper Text Can Tell Us about Sentiment and Uncertainty,” technical report, Bank of England. Working paper 865.
- Ke, Z. T., Kelly, B. T., and Xiu, D. (2019), “Predicting Returns with Text Data,” available in SSRN 3389884.
- Kelly, B., Manela, A., and Moreira, A. (2018), “Text Selection,” available in SSRN 3491942
- Koenker, R. (2011), “Additive Models for Quantile Regression: Model Selection and Confidence Bandaids,” Brazilian Journal of Probability and Statistics, 25, 239–262. DOI: 10.1214/10-BJPS131.
- Lamla, M. J., and Maag, T. (2012), “The Role of Media for Inflation Forecast Disagreement of Households and Professional Forecasters,” Journal of Money, Credit and Banking, 44, 1325–1350. DOI: 10.1111/j.1538-4616.2012.00534.x.
- Lewis, D., Mertens, K., and Stock, J. H. (2020), “Economic Activity During the Early Weeks of the SARS-Cov-2 Outbreak,” technical report, National Bureau of Economic Research.
- Loughran, T., and McDonald, B. (2011), “When is a Liability not a Liability? Textual analysis, dictionaries, and 10-Ks,” Journal of Finance, 66, 35–65. DOI: 10.1111/j.1540-6261.2010.01625.x.
- Manzan, S. (2015), “Forecasting the Distribution of Economic Variables in a Data-Rich Environment,” Journal of Business & Economic Statistics, 33, 144–164.
- Manzan, S., and Zerom, D. (2013), “Are Macroeconomic Variables Useful for Forecasting the Distribution of U.S. Inflation?” International Journal of Forecasting, 29, 469–478. DOI: 10.1016/j.ijforecast.2013.01.005.
- Marcellino, M., and Schumacher, C. (2010), “Factor Midas for Nowcasting and Forecasting with Ragged-Edge Data: A Model Comparison for German GDP,” Oxford Bulletin of Economics and Statistics, 72, 518–550. DOI: 10.1111/j.1468-0084.2010.00591.x.
- Quaedvlieg, R. (2021), “Multi-Horizon Forecast Comparison,” Journal of Business & Economic Statistics, 39, 40–53.
- Shapiro, A. H., Sudhof, M., and Wilson, D. J. (in press), “Measuring News Sentiment,” Journal of Econometrics.
- Sharpe, S. A., Sinha, N. R., and Hollrah, C. (2017), “What’s the Story? A New Perspective on the Value of Economic Forecasts,” FEDS working paper, finance and economics discussion series 2017-107. DOI: 10.17016/FEDS.2017.107.
- Stock, J. H., and Watson, M. W. (1999), “Forecasting Inflation,” Journal of Monetary Economics, 44, 293–335. DOI: 10.1016/S0304-3932(99)00027-6.
- Stock, J. H., and Watson, M. W. (2016), “Dynamic Factor Models, Factor-Augmented Vector Autoregressions, and Structural Vector Autoregressions in Macroeconomics,” in Handbook of Macroeconomics (Vol. 2), eds. J. B. Taylor, and H. Uhlig, pp. 415–525, Amsterdam: Elsevier.
- Tetlock, P. C. (2007), “Giving Content to Investor Sentiment: The Role of Media in the Stock Market,” Journal of Finance, 62, 1139–1168. DOI: 10.1111/j.1540-6261.2007.01232.x.
- Thorsrud, L. A. (2016), “Nowcasting Using News Topics. Big Data Versus Big Bank,” Norges Bank working paper 20/2016.
- Thorsrud, L. A. (2020), “Words are the New Numbers: A Newsy Coincident Index of the Business Cycle,” Journal of Business & Economic Statistics, 38, 393–409.
- Tibshirani, R. (1996), “Regression Shrinkage and Selection via the Lasso,” Journal of the Royal Statistical Society, Series B, 58, 267–288. DOI: 10.1111/j.2517-6161.1996.tb02080.x.
- Xing, F., Cambria, E., and Welsch, R. (2018), “Natural Language Based Financial Forecasting: A Survey,” Artificial Intelligence Review, 50, 49–73. DOI: 10.1007/s10462-017-9588-9.