
 ?Mathematical formulae have been encoded as MathML and are displayed in this HTML version using MathJax in order to improve their display. Uncheck the box to turn MathJax off. This feature requires Javascript. Click on a formula to zoom.
Abstract
Dewatering and air flow in high vacuum suction boxes was examined. The work was mainly numerical and was based on, and compared with, previously published experimental results of vacuum dewatering from laboratory equipment and from a pilot paper machine. A previously published numerical model for wet pressing is used as the basis for this work. The aims of this study were to find new fitting parameters that allows the previous model to be used for vacuum dewatering instead of pressing, and to examine two extensions to the original model. The results indicate that the new vacuum dewatering model for moisture can predict the dewatering behavior for several different experimental data series both from laboratory equipment and a pilot paper machine using the same set of fitting parameters. Two different numerical models for air flow through the paper sheet, during vacuum dewatering, were developed based on postulating that the decrease in moisture permeability is accompanied by a simultaneous increase in air permeability. The models for air flow can also be fitted to experimental data and predict the magnitudes of air flow during vacuum dewatering. The data sets for air flow exhibit a certain degree of operator dependence though, so that one set of fitting parameters is not enough for obtaining good agreement with all data sets.
Introduction
Forest-based sustainable development can be achieved with aid from the papermaking industry. Many fossil-based materials can be replaced by forest-based materials, as demonstrated in laboratory scale. One of the remaining challenges is to accelerate the transition from laboratory scale to full scale production. To achieve full scale production, on a paper machine, with these new materials, a lot of experimentation regarding dewatering is necessary, since the papermaking process is heavily dependent on dewatering with vacuum, pressing and drying. Experimentation in pilot scale and full scale, however, is both expensive and time consuming. This makes the transition much slower. Validated mathematical models of the papermaking process will provide a tool to facilitate upscaling. Without disrupting the production and with the possibility to change and examine several different parameters at the same time, mathematical models can totally change the pace for introducing new materials to existing papermaking processes. Numerical models cannot replace the need for pilot or full-scale trials, but they can provide crucial information before trials, that will make the trials fewer and more efficient.
This article describes numerical models for vacuum dewatering, the software used in this article was MATLAB®. This work on modeling dewatering at the vacuum suction boxes of the paper machine, is based on previous work on modeling wet pressing.[Citation1–5] The decreasing permeability model (DPM) for pressing from McDonald and Kerekes[Citation2] works well for predicting dewatering of regular pulps during pressing and was also recently used to compare the press solids from a pilot study with additions of cellulose nano fibrils (CNF).[Citation6] Bousfield et al.[Citation6] showed that the DPM worked well with some adjustments of the fitting parameters and the rewet value.
There are some research articles about modeling of vacuum dewatering previously published. Rezk et al.[Citation7] predict vacuum dewatering with two-dimensional numerical models and show two-phase flow simulations that could be used to describe the dewatering of a sheet with high speed dewatering in the early stage of the process, some water being left in the sheet after dewatering and a steady state airflow. The predictions and experimental values agreed regarding air flow, but the predicted dewatering rate was twice as high as the experimental. Rezk et al.[Citation8] concluded that the fabric structure was best described by using a combination of solid fabric yarns and flow resistance compared with only using flow resistance as in the earlier work. With this new description of the forming fabric, the dewatering rates were in better agreement with experimental data.
Korhonen et al.[Citation9] made computational fluid mechanics (CFD) simulations based on Navier-Stokes equations and an analytical model based on Darcy’s law, of commercially available nanofiber suspensions. The model and simulation were made with the intent to optimize and understand the dewatering behavior. Korhonen et al.[Citation9] compared the simulation and model results with experimental data from a laboratory scale dewatering equipment (Dynamic Drainage Analyzer, DDA) with good agreement. They also propose pressure pulsing to be beneficial for dewatering, significantly decreasing the dewatering times needed, both based on simulations and analytical model.
Stenström and Nilsson[Citation10] used fiber characterization data such as fiber width and fiber length density to predict the amount of water that cannot be removed by applying vacuum. When assuming an elliptical fiber cross-section and postulating that water in the fiber wall and inside the lumen is not removed, reasonable agreement was obtained with experiments for a range of different pulps.
Sjöstrand et al.[Citation11] used COMSOL Multiphysics to investigate forming fabric influence on vacuum dewatering, much like Rezk et al..[Citation7] Single-phase models of airflow through fabrics were successfully made with Ergun’s[Citation12] flow through porous media. A two-phase model of dewatering and airflow was also attempted with both forming fabric and paper sheet. The magnitudes of the air velocity and dewatering rate agreed with experimental data, although the shape of dewatering against dwell time was inverted with slow initial dewatering rates which increased. This was due to the fact that opposing forces that retain water, i.e. capillary forces, were missing from the model. This prompted the use of the DPM for pressing as a basis for the new model presented in this article.
The hypothesis of this article is that since vacuum dewatering compresses the sheet[Citation13] like pressing does[Citation14,Citation15] and shows similar diminishing returns[Citation16–21] as pressing,[Citation14,Citation22] the assumptions of the dewatering for pressing should be applicable in models for vacuum dewatering as well.
The aims of this study are to find new fitting parameters that allows the DPM to be used for vacuum dewatering instead of pressing, and to examine two extensions to the original model. First, adding water retention value (WRV) to the model and thereby finding fitting parameters that work for different pulps, making the model more versatile and useful. Second, creating a similar model that predicts the air volume that flows through the sheet during vacuum dewatering.
Models for the change in moisture content and the air flow through the sheet during vacuum dewatering that include WRV are developed. These are validated with a range of experimental data from laboratory equipment and a few from a pilot paper machine.
Materials and methods
Model theory
To allow for accurate design of the suction box and choice of vacuum pumps to optimize electricity consumption during paper production, moisture content and air penetration are both important process parameters. These two will therefore be included in the models.
Moisture ratio model
Kerekes and McDonald[Citation1] argue that the press impulse affects the sheet porosity, hydrodynamic specific surface of fibers and depth of fiber bed, and at the same time the moisture ratio is changed. The moisture ratio is postulated to be nonlinearly proportional to porosity, hydrodynamic specific surface of fibers and depth of fiber bed. As an example, EquationEquation (1)(1)
(1) illustrates one of these relationships,
(1)
(1)
where m = moisture ratio (-), L=depth of fiber bed (m), the ingoing state is marked with 0 and a is a constant.
The model was improved during several years and rewetting was added to the original model early on.[Citation2] The model was later also extended to account for equilibrium conditions where the lowest possible moisture ratio, equilibrium moisture, is included.[Citation4] In Kerekes et al.[Citation4] Darcy’s law (EquationEquation (2)(2)
(2) ) is the basis for arriving at the decreasing permeability model (DPM) for press dewatering,
(2)
(2)
where
=flow velocity (m/s),
=permeability (m2),
=pressure (Pa),
=dynamic viscosity of water (Pa
s) and
=thickness direction (m).
The latest modification of the model[Citation5] was used in this work. The model is evaluated compared to vacuum dewatering data to investigate if it can be used for vacuum box dewatering where the press impulse is replaced by a vacuum impulse () based on the same initial assumptions made in[Citation1] (EquationEquation (1)
(1)
(1) ). This results in the equation used for vacuum dewatering in this work (EquationEquation (3)
(3)
(3) ),
(3)
(3)
where
= outgoing moisture ratio (–),
= ingoing moisture ratio (-),
= equilibrium moisture (-),
= grammage (kg/m2),
= rewetting (kg/m2),
=kinematic viscosity (m2/s),
=Vacuum level (kPa),
= dwell time (ms),
=specific permeability (kg/m),
= compressibility factor (-).
Since for the pressing model is the moisture ratio for the sheet prior to rewet when dwell time is large, an alteration for vacuum dewatering is needed. At about 20 ms the dewatering has almost stopped, and after that point, the air flow through the sheet starts to dry the sheet which is a different dewatering mechanism than vacuum. The
in this article is based on values of experimental moisture after 20 ms dewatering in the laboratory suction box, which is shown to be a long time for vacuum dewatering, where the dewatering usually has leveled out.[Citation17,Citation23–25]
depends on different vacuum levels and water retention values, and is calculated from the experimental data by curve fitting EquationEquation (4)
(4)
(4) ,
(4)
(4)
where k1 and k2 are constants and
=water retention value (-).
The constants k1 and k2 are fitted to the moisture ratio and vacuum level for 20 ms dwell time for two different pulps, with WRV values 1.60 and 1.68. Different pulps will give different dewatering behaviors and WRV are added to EquationEquation (4)(4)
(4) to make the models able to predict for different pulp types without changing the fitting parameters. WRV alone cannot account for large network morphology deviations, and the model will probably be somewhat limited by this.
The DPM for moisture ratio is fitted to the experimental data shown in [17,23–25] by nonlinear multivariate regression.
Table 1. List of published experimental data used for fitting the model for moisture ratio.
The pulps from Sjöstrand et al.[Citation25] with the most deviating dewatering behaviors are excluded from the model fitting, because they have different network morphology structures than the other pulps and therefore clearly follow different dewatering mechanisms.[Citation25] They are therefore not relevant to fit together with the others. The excluded pulps consist of the first microfibrillated cellulose (MFC1) and dialcohol cellulose (DAC) of high percentages, while the lowest percentages of the additives are still in the fitting, as well as all percentages of the second set of microfibrillated cellulose, MFC2. MFC2 was much coarser than MFC1 and even the higher percentages did not deviate that much in dewatering behavior.
There are of course other experimental data that describe dewatering with vacuum. They were considered to be part of the model fitting but excluded for the following reasons: For Pujara et al.[Citation26] and Attwood,[Citation16] water retention values were not found. Åslund et al.[Citation27] and Räisänen[Citation18] used a factor 10 longer dwell times than the other data, while Kullander et al.[Citation28] had a factor 10 shorter dwell times. Granevald et al.[Citation29] performed pre-dewatering before vacuum dewatering which made it hard to include their data in the study.
The rewetting was initially set to three different values: 100, 70 och 55 g/m2. However, the different rewetting values only changes the fitting parameters since the model gives the net appearance of the dewatering behavior. In a previous study[Citation30] the rewetting magnitude was measured in a series of pilot trials and the measured values ranged between 10 and 180 g/m2. For the rest of this article, the rewetting in the models is set to half the grammage.
Air volume model
A corresponding model of air volume that passes through the sheet during vacuum dewatering was developed. Experimental data[Citation24] show that the air flow during vacuum dewatering reaches steady state almost immediately and this motivates why the modeling approach taken here can be tested for this purpose as well. There are two fundamental differences between modeling water removal and air flow.
First, water is an incompressible fluid whereas air is compressible. EquationEquation (2)(2)
(2) must be integrated over the thickness of the sheet, describing air as an ideal gas, EquationEquations (5)–(7),
(5)
(5)
(6)
(6)
(7)
(7)
where
=length of flow path (m).
Second, water will be removed from any position within the sheet leading to the flow path in the thickness direction frequently being much shorter than the total sheet thickness. An air flow, on the other hand, will only be detected once air-filled pores penetrate the whole thickness.
Kerekes et al.[Citation4] postulate an equation where permeability over length of flow path is described by EquationEquation (8)(8)
(8) ,
(8)
(8)
EquationEquation (8)(8)
(8) is further developed in this work, to fit air flow during vacuum dewatering. When m is equal to m0 the permeability for air is zero and when the dwell time increase, m will converge toward me which brings constant air permeability. By changing m − me to m0 − mbr, it is reasonable to assume that the equation describes how the airflow is developed with dwell time instead of the flow of water. With lesser water content in the sheet, the air permeability is increased. EquationEquation (9)
(9)
(9) is based on EquationEquation (8)
(8)
(8) switched to airflow and it describes penetrated air volume depending on dwell time at vacuum dewatering,
(9)
(9)
where
is volumetric flow (m3/s), Aair (kg/m) and nair (-) are constants, area = sheet area subjected to vacuum (m2),
=moisture ratio after dwell time t, before rewetting (-).
When regarding air flow through a fiber mat, Reynolds numbers larger than approximately 1–2 cause Darcy’s law no longer to be valid,[Citation20,Citation31] when using particle diameter for characteristic length. Some of the calculated Reynolds numbers are much higher than 2, and a few are below 1, for the experimental data behind the air volume models.[Citation23] Flow models used in[Citation11] are based on an extension of Darcy’s law[Citation12] where the range of Reynolds numbers is much broader due to the introduction of a non-linear term. EquationEquation (2)(2)
(2) is therefore modified into EquationEquation (10)
(10)
(10) based,
(10)
(10)
where α is a fitting parameter.
With the same derivation as for EquationEquation (9)(9)
(9) , using EquationEquations (5)
(5)
(5) through 8, but starting with EquationEquation (10)
(10)
(10) instead of EquationEquation (2)
(2)
(2) , an updated model for air penetration is deduced and shown in EquationEquation (11)
(11)
(11) . EquationEquation (11)
(11)
(11) has the advantage of describing flow for high Reynolds numbers as well as for low.
(11)
(11)
where
is a fitting parameter (-).
EquationEquation (9)(9)
(9) and Equation(11)
(11)
(11) are integrated numerically in MATLAB, and the parameters Aair (kg/m) and nair (-), and for EquationEquation (11)
(11)
(11) α (-), are fitted to a single set of experimental data[Citation23] with complete air volume measurements. The data sets for air flow exhibit a certain degree of operator dependence, this leads to only one set of data being fitted.
for each of the air volume models are calculated with the same equation (EquationEquation (4)
(4)
(4) ) as the moisture ratio model, where rewetting is required. Since the rewetting was not measured for the experimental data, the rewetting is set to half the grammage for each of the four data sets. This provided
that match the observations.
Rewetting is not included in the air volume models, but it is used with EquationEquation (4)(4)
(4) to get
represent the same dewatering appearance as
with rewetting excluded.
Results and discussion
Moisture ratio model
The values of fitting parameters from the curve fittings are shown in . The constants k1 and k2 are used for calculating me with EquationEquation (5)(5)
(5) . Different WRV values give different outgoing moisture after vacuum dewatering and this also depends on the vacuum level. These are used in the models for moisture ratio and penetrated air volume.
Table 2. Values for all the fitting parameters.
The moisture ratio model predictions and the corresponding experimental data points are all plotted in . The majority of the predictions match the experimental data well.
Figure 1. The fit of the model for moisture ratio and the corresponding experimental data is shown. A linear fit with R2 value and 95% prediction interval is also shown, the slope of the linear fit is 1.01.
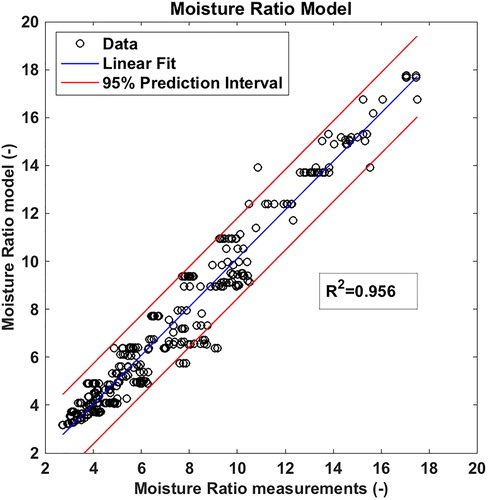
The model is successful in predicting values of different vacuum levels, equipment and operators. All this indicates that the model, with the presented fitting parameters, can be used for predicting dewatering behaviors for the vacuum dewatering of many different papermaking processes. For experimental data for various pulp types, equipment and temperatures, for example from Neun,[Citation17] the model works well with only small deviations from experimental values. Even without changing the fitting parameters, the models could be used as a tool for predicting the vacuum dewatering behavior of other equipment with machine-like time scales, for example pilot machines. The fact that temperature is included in the models makes them a great way of illustrating what happens with vacuum dewatering for different temperatures. Stock solution temperature turn out to have a major influence on the dewatering. The R2-value of 0.956 () indicates the high precision of the model, also for external data.[Citation17]
Looking at the results from the moisture ratio models compared to the corresponding dewatering data (), some of the predictions are less accurate. The cases with high percentages (6 and 10%) of MFC1, seems to be hardest to model, they were also excluded from the original model fitting. High concentration additions of MFC1 have a different network morphology that are not accounted for solely by the water retention value that is included in the model. A relatively low value for water retention value makes the corresponding model believe that the vacuum dewatering should be much more efficient. MFC consists of large portions of small particles which probably to a large extent appear in the pores between fibers during vacuum dewatering, thus lowering water flow rates. This can explain why the model predicts that high percentages of MFC1 should dewater quite efficiently compared to the experimental values. This indicates that for these kinds of additions, in this magnitude of concentration, other pulp characteristics would be beneficial to include in the model.
Figure 2. Model predictions for moisture ratio are shown together with corresponding experimental values (*) from.[Citation17,Citation23–25]
![Figure 2. Model predictions for moisture ratio are shown together with corresponding experimental values (*) from.[Citation17,Citation23–25]](/cms/asset/72ca8aba-b363-4604-8d81-6410bc67bea4/ldrt_a_1745825_f0002_c.jpg)
With DAC it is the other way around. The DAC fibers give very high values for WRV since the DAC fibers are extremely efficient in holding water by swelling. The fibers themselves, on the other hand, are similar in length as the reference pulps and do not, in the wet state during vacuum dewatering, block the pores and thereby the flow resistance for the exiting water are not impeded in the same way at all. Since the model only account for the WRV, the predictions for DAC are heavily depending on the high WRV values which results models predicting in too high outgoing moisture compared to the experimental values.
Since both DAC and MFC1 are quite extreme in their respective highest concentrations, and the model cannot take care of differences in fiber flexibility or water absorbing additives, the model is being unable to make accurate predictions for these pulps. This is not surprising and does not entail that the models are faulty in any way. There is, however, need for other fitting parameters when investigating high concentrations of extreme pulps.
Air volume model
shows the fit of the first air volume model (EquationEquation (9)(9)
(9) ) compared with the measurements. This fit shows that the air volume model needs to be developed further (R2=0.912). show the results from the first air volume models compared to the corresponding experimental data. The updated air model (EquationEquation (11)
(11)
(11) ) is shown in and .
Figure 3. The fit of the model for air volume and the corresponding experimental data is shown. A linear fit with R2 value and 95% prediction interval is also shown, the slope of the linear fit is 0.97.
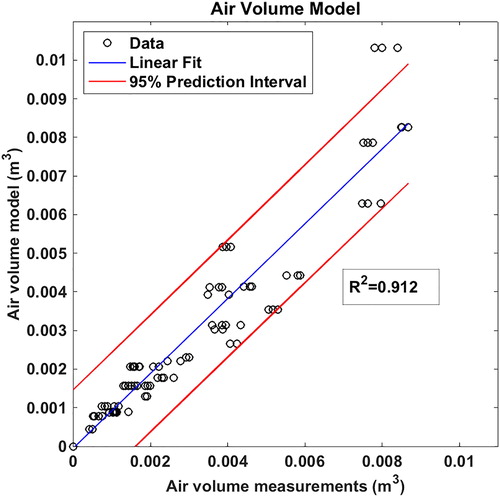
Figure 4. Model predictions for moisture ratio are shown together with corresponding experimental values (*) from Nilsson.[Citation23]
![Figure 4. Model predictions for moisture ratio are shown together with corresponding experimental values (*) from Nilsson.[Citation23]](/cms/asset/06b445ec-e369-4c0f-8e5e-985d9f017c66/ldrt_a_1745825_f0004_c.jpg)
Figure 5. The fit of the updated model for air volume and the corresponding experimental data is shown. A linear fit with R2 value and 95% prediction interval is also shown, the slope of the linear fit is 0.96.
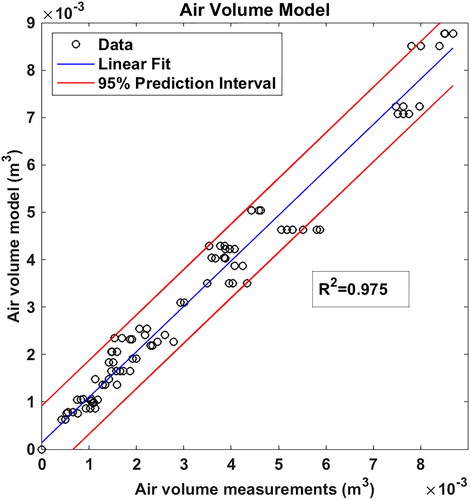
Figure 6. Updated model predictions for moisture ratio are shown together with corresponding experimental values (*) from Nilsson.[Citation23]
![Figure 6. Updated model predictions for moisture ratio are shown together with corresponding experimental values (*) from Nilsson.[Citation23]](/cms/asset/6ef2548c-a955-49a2-b539-877c0904e944/ldrt_a_1745825_f0006_c.jpg)
The first air volume model has some limitations as it is formulated in this work. Since it is based on Darcy’s law (EquationEquation (2)(2)
(2) ) it deviates most for high flow rates of 20 g/m2 and 60 kPa (), where Reynolds numbers are ranging between 10 and 100. The model predicts most accurate with higher sheet grammage where the flow rate is lower. A combination of this air volume model and the work on modeling in Sjöstrand et al.[Citation11] where a quadratic term is included in the relationship between vacuum level and flow rate. This is the foundation of the updated air volume model (EquationEquation (11)
(11)
(11) ). The results in and show that the updated model works better (R2=0.975) and that the quadratic term is needed.
The Reynolds numbers for the air volume experiments[Citation23] are estimated as ranging between approximately 0.6 and 8 using the equivalent pore radius, for beaten softwood pulp from,[Citation25] as characteristic length. Previously, the fiber thickness was used as characteristic length in calculations of Reynolds numbers regarding this data.[Citation23] The range of Reynolds numbers was then reported as 5–100. Nilsson[Citation23] writes that Reynolds numbers should be less than 5 for Darcy’s law to be valid and Pettersson et al.[Citation31] reports that Darcy’s law is valid for Reynolds numbers less than 2 for fiber mats, and less than 1 by Ramaswamy.[Citation20] Depending on how the Reynolds numbers are calculated it seems that the air volume model based on Darcy’s law in this work (EquationEquation (9)(9)
(9) ) can be valid for the lower Reynolds numbers, i.e. the low flow rates of high grammage sheets and low vacuum levels when Reynolds number is below 1. While the same reasoning brings that the updated air volume model (EquationEquation (11)
(11)
(11) ) should be valid for the high flow rates as well as the low, this is true and shown in the comparison between and .
Conclusions and future work
The moisture ratio model for vacuum dewatering can accurately predict dewatering behavior of kraft pulp and additions of micro-fibrillated cellulose and dialcohol cellulose, based on water retention value. The model can also predict for vacuum levels between 10 and 60 kPa, both laboratory equipment and a pilot machine and for different operators. This means that the model, with the two presented fitting parameters, can be used for predicting dewatering behaviors for the vacuum dewatering of many different papermaking processes.
An accurate air volume model is provided, although the three fitting parameters need to be altered when comparing sets of data obtained by different operators. This means that the air volume model cannot stand alone to predict air volume during vacuum dewatering without comparing with experimental data.
Suggestions for future work include further development of the experimental basis for how water retention value is affecting the equilibrium moisture. With a study focusing on this behavior, more accuracy in the models could be possible. Adding other parameters regarding pulp and network morphology, such as for example fines content, fiber coarseness, fiber cross-sectional shape, wet fiber stiffness, would also be interesting, but there is a risk that some of them already are included implicitly in the water retention value (WRV). The equilibrium moisture equation for vacuum dewatering is crucial to building a model that is accurate for many different cases with the same fitting parameters.
| NOMENCLATURE | ||
| = | average flow velocity (m/s) | |
| = | compressibility factor (air volume model) (-) | |
| = | compressibility factor (moisture ratio model) (-) | |
| = | depth of fiber bed (m) | |
| = | dwell time (ms or s) | |
| = | dynamic viscosity (Pa | |
| = | third fitting parameter for the air volume model (-) | |
| = | grammage (kg/m2) | |
| = | ingoing moisture ratio (-) | |
| = | kinematic viscosity (m2/s) | |
| = | length of flow path (m) | |
| = | equilibrium moisture (-) | |
| = | moisture ratio (-) | |
| = | moisture ratio before rewetting (-) | |
| = | permeability (m2) | |
| = | permeability factor (air volume model) (kg/m) | |
| = | permeability factor (moisture ratio model) (kg/m) | |
| = | pressure (Pa or kPa) | |
| = | rewetting (kg/m2) | |
| θ | = | hydrodynamic specific surface of fibers (m2/kg) |
| = | volumetric flow (m3/s) | |
| = | web speed (m/s) | |
Acknowledgements
The authors would like to thank David McDonald for feedback and ideas regarding this work. The work in this article is based of David’s work together with Richard Kerekes on models for dewatering during pressing. The Swedish Agency for Economic and Regional Growth and The Knowledge Foundation are acknowledged for financial support.
Additional information
Funding
References
- Kerekes, R. J.; Mcdonald, J. D. A Decreasing Permeability Model of Wet Pressing: theory. Tappi J. 1991, 74, 150–156.
- Mcdonald, J. D.; Kerekes, R. J. A Decreasing-Permeability Model of Wet Pressing with Rewetting. Tappi J. 1995, 78, 107–111.
- Mcdonald, J. D.; Hamel, J.; Kerekes, R. J. Design Equation for Paper Machine Press Sections. J. Pulp Pap. Sci. 2000, 26, 401–406.
- Kerekes, R. J.; McDonald, E. M.; McDonald, J. D. Decreasing Permeability Model of Wet Pressing: Extension to Equilibrium Conditions. J For. 2013, 3, 46–51.
- Mcdonald, J. D.; Kerekes, R. J. Estimating Limits of Wet Pressing on Paper Machines. TJ. 2017, 16, 81–87. DOI: 10.32964/TJ16.2.81.
- Bousfield, D.; Paradis, M.; Johnson, D.; Bilodeau, M. Table Drainage and Press Dewatering When Cellulose Nanofibers Are Applied on the Wet End. PaperCon. 2017, 2, 681–688.
- Rezk, K.; Nilsson, L.; Forsberg, J.; Berghel, J. Modelling of Water Removal during a Paper Vacuum Dewatering Process Using a Level-Set Method. Chem. Eng. Sci. 2013, 101, 543–553. DOI: 10.1016/j.ces.2013.07.005.
- Rezk, K.; Nilsson, L.; Forsberg, J.; Berghel, J. Simulation of Water Removal in Paper Based on a 2D Level-Set Model Coupled with Volume Forces Representing Fluid Resistance in 3D Fiber Distribution. Dry. Technol. 2015, 33, 605–615. DOI: 10.1080/07373937.2014.967401.
- Korhonen, M.; Puisto, A.; Alava, M.; Maloney, T. The Effect of Pressure Pulsing on the Mechanical Dewatering of Nanofiber Suspensions. Chem. Eng. Sci. 2020, 212, 115267. DOI: 10.1016/j.ces.2019.115267.
- Stenström, S.; Nilsson, L. Predicting Water Removal during Vacuum Dewatering from Fundamental Fibre Property Data. Nord. Pulp Pap. Res. J. 2015, 30, 265–271. DOI: 10.3183/npprj-2015-30-02-p265-271.
- Sjöstrand, B.; Barbier, C.; Nilsson, L. Modeling the Influence of Forming Fabric Structure on Vacuum Box Dewatering. TJ. 2017, 16, 477–483. DOI: 10.32964/TJ16.8.477.
- Ergun, S. Fluid Flow through Packed Column. Chem. Eng. Prog. 1952, 48, 89–94.
- Åslund, P.; Vomhoff, H.; Waljanson, A. The Deformation of Chemical and Mechanical Pulp Webs during Suction Box Dewatering. Nord. Pulp Pap. Res. J. 2008, 23, 403–408. DOI: 10.3183/npprj-2008-23-04-p403-408.
- Paulapuro, H. Wet Pressing. In Papermaking Part 1: Stock Preparation and Wet End. Paulapuro, H.; Gullichsen, J., Eds. Fapet Oy: Jyväskylä, 2000, pp. 284–340.
- Vomhoff, H. Dynamic Compressibility of Water- Saturated Fibre Networks and Influence of Local Stress Variations in Wet Pressing. Ph.D. Dissertation, Royal Institute of Technology (KTH), Stockholm, Sweden, 1998.
- Attwood, B. W. A Study of Vacuum Box Operation. Pap. Technol 1962, 3, 144–153.
- Neun, J. A. Performance of High Vacuum Dewatering Elements in the Forming Section. Tappi J. 1994, 77, 133–138.
- Räisänen, K. O.; Karrila, S.; Maijala, A. Vacuum Dewatering Optimization with Different Furnishes. Pap. Ja Puu. 1996, 78, 461–467.
- Baldwin, L. High Vacuum Dewatering. Pap. Technol. 1997, 38, 23–28.
- Ramaswamy, S. Vacuum Dewatering during Paper Manufacturing. Dry. Technol. 2003, 21, 685–717. DOI: 10.1081/DRT-120019058.
- Åslund, P.; Vomhoff, H. Dewatering Mechanisms and Their Influence on Suction Box Dewatering Processes – A Literature Review. Nord. Pulp Pap. Res. J. 2008, 23, 389–397. DOI: 10.3183/npprj-2008-23-04-p389-397.
- Wahlström, B. Wet Pressing in the 20th Century: Evolution, Understanding and Future. Pulp Pap. Canada. 2001, 102, 81–88.
- Nilsson, L. Air Flow and Compression Work in Vacuum Dewatering of Paper. Dry. Technol. 2014, 32, 39–46. DOI: 10.1080/07373937.2013.809732.
- Sjöstrand, B.; Barbier, C.; Nilsson, L. Influence on Sheet Dewatering by Structural Differences in Forming Fabrics. PaperCon. 2016, 2, 767–776.
- Sjöstrand, B.; Barbier, C.; Ullsten, H.; Nilsson, L. Dewatering of Softwood Kraft Pulp with Additives of Microfibrillated Cellulose and Dialcohol Cellulose. BioRes 2019, 14, 6370–6383.
- Pujara, J.; Siddiqui, M. A.; Liu, Z.; Bjegovic, P.; Takagaki, S. S.; Li, P. Y.; Ramaswamy, S. Method to Characterize the Air Flow and Water Removal Characteristics during Vacuum Dewatering. Part II—Analysis and Characterization. Dry. Technol. 2008, 26, 341–348. DOI: 10.1080/07373930801898125.
- Åslund, P.; Vomhoff, H.; Waljanson, A. External Rewetting after Suction Box Dewatering. Nord. Pulp Pap. Res. J. 2008, 23, 409–414. DOI: 10.3183/npprj-2008-23-04-p409-414.
- Kullander, J.; Nilsson, L.; Barbier, C. Evaluation of Furnishes for Tissue Manufacturing ; Suction Box Dewatering and Paper Testing. Nord. Pulp Pap. Res. J. 2012, 27, 143–150. DOI: 10.3183/npprj-2012-27-01-p143-150.
- Granevald, R.; Nilsson, L. S.; Stenström, S. Impact of Different Forming Fabric Parameters on Sheet Solids Content during Vacuum Dewatering. Nord. Pulp Pap. Res. J. 2004, 19, 428–433. DOI: 10.3183/npprj-2004-19-04-p428-433.
- Sjöstrand, B.; Barbier, C.; Nilsson, L. Rewetting after High Vacuum Suction Boxes in a Pilot Paper Machine. Nord. Pulp Pap. Res. J. 2015, 30, 667–672. DOI: 10.3183/npprj-2015-30-04-p667-672.
- Pettersson, P.; Lundström, T. S.; Wikström, T. A Method to Measure the Permeability of Dry Fiber Mats. Wood Fiber Sci. 2006, 38, 417–426.