
 ?Mathematical formulae have been encoded as MathML and are displayed in this HTML version using MathJax in order to improve their display. Uncheck the box to turn MathJax off. This feature requires Javascript. Click on a formula to zoom.
Abstract
Light-assisted drying (LAD) uses near-infrared (1064 nm) laser light to selectively heat water, quickly dehydrating samples and forming an amorphous trehalose preservation matrix for biologics that can be stored at ambient temperatures. In this study, LAD is used to create preservation matrices inside glass vials used in industry. Sample volumes of 0.25 and 0.50 mL containing the model protein lysozyme were LAD processed. After LAD processing, samples were stored for one month at 4 °C or 20 °C. Thermal histories and transmitted laser power were monitored throughout processing to determine optimal drying times. The trehalose matrix was characterized using polarized light imaging to detect crystallization during storage. Karl Fischer titration was used to measure the water content of samples and differential scanning calorimetry was used to assess protein structure. LAD-processed samples had low water content (2%), were stable against crystallization and the protein structure was unaltered.
1. Introduction
Many biologics routinely used in healthcare including vaccines, protein-based therapeutics, assays, and nanomedicine products must be stored at 4 °C or below from the point of manufacture to the point of use to maintain potency and/or functionality. However, this required temperature-controlled storage and distribution is expensive and logistically challenging, especially in low-resource settings. For example, the lack of adequate cold-chain facilities remains one of the most significant challenges facing vaccination programs worldwide.[Citation1–3] Storing biologics such as vaccines at ambient temperatures would reduce the cost and complexity of transportation and storage.
Currently, lyophilization is widely used to preserve biological products for transportation and storage. However, freeze-drying is an energy- and time-intensive process and biologics are subjected to a variety of stresses during processing including, pH changes and crystallization of the buffer solution that can degrade or damage them.[Citation4–12] As a result, many biologics cannot be successfully freeze-dried. For example, given their sensitivity to freezing temperatures, aluminum-adjuvanted vaccines, are difficult to lyophilize.[Citation13,Citation14] Thorat et al. recently reviewed the drying of vaccines and biomolecules and highlighted challenges with current techniques and the need for new drying strategies.[Citation15] Further, many biologics that have been lyophilized must be kept below ambient temperatures to maintain their functionality during long-term storage, which still requires cold storage for the duration of the shelf life of the product.[Citation16–18] Spray drying has also been applied to the stabilization of biological products.[Citation19] The bulk of the research and development effort around spray drying is focused on creating dry powder formulations for intranasal or pulmonary delivery of vaccines.[Citation20] Although these results are promising, their applicability is limited.
Previous research has demonstrated that anhydrous preservation of biologics in a trehalose amorphous solid matrix may offer an alternative to cold storage and freeze-drying.[Citation21,Citation22] Trehalose is an attractive option as a preservation matrix for embedded biologics due to its high viscosity that decreases the protein denaturation rate and the high glass transition temperature which allows matrix stability at room temperatures.[Citation4,Citation23–25] Disaccharides such as trehalose provide protection by forming hydrogen bonds with proteins when water is removed thus inhibiting irreversible aggregation and/or increasing the thermal transition temperature of macromolecules.[Citation26,Citation27] To remain stable during storage, a trehalose solid must be stored below the glass transition temperature of the amorphous matrix. This glass transition temperature is determined by the moisture content of the matrix, with low moisture contents resulting in higher glass transition temperatures.
LAD is a new processing technique to create trehalose amorphous solids for the preservation of biologics. Water is selectively heated via near-infrared (1064 nm) laser irradiation, rapidly removing water from the sample, and forming an amorphous matrix.[Citation28,Citation29] In previous work, small-volume samples (40 μL) were LAD processed and stored for 1 month. Samples had low water content and were stable against crystallization when stored at room temperature. In addition, an embedded test protein did not show significant degradation in activity or thermodynamic properties compared to an unprocessed control. Further, the amorphous matrix produced during LAD processing had uniform water content throughout the sample.[Citation28,Citation29] LAD has also been successfully applied to the thermal stabilization of nucleic acid nanoparticles (NANPs).[Citation30,Citation31] Several different NANPs with different melting temperatures were LAD processed and stored at room temperature. No significant degradation in the NANP structure was seen. Most recently, larger volume samples (0.25 mL) were successfully LAD processed on glass coverslips, marking a significant increase in the volumes successfully processed using LAD.[Citation32]
In previous studies with LAD, samples consisted of a droplet of solution that was dried on a glass coverslip. This setup was convenient for preliminary testing, but this geometry is not practical for large-scale processing. Currently, many biologics are processed and delivered to the end user in glass vials. Once sealed, the vials provide an aseptic, low-humidity storage environment. In this study, we extend the work reported by Furr et al.[Citation32] by processing larger volume (0.25 and 0.5 mL) samples in glass vials that are commonly used to lyophilize vaccines. A test protein, lysozyme, was included in the samples. The focus of this work was the creation of a stable preservation matrix for larger-volume samples inside glass vials. This work represents an important step in adapting the LAD process for industrial use. The samples were stored in either a refrigerator (4 °C) or at room temperature (20 °C) for one month. End moisture contents were measured immediately after processing and after storage, providing insights into the repeatability of the LAD process and drying kinetics during storage. Karl Fischer titration was performed on a subset of samples after processing to determine the absolute water content of samples. Thermal imaging and a measure of transmitted laser power were used to determine appropriate drying times for samples. Polarized light imaging (PLI) was used to determine the stability of the trehalose matrix against crystallization before and after storage. The characteristics of samples processed in vials are directly compared to samples processed on coverslips. Differential scanning calorimetry was used to assess protein structure after LAD processing.
2. Materials and methods
2.1. LAD processing
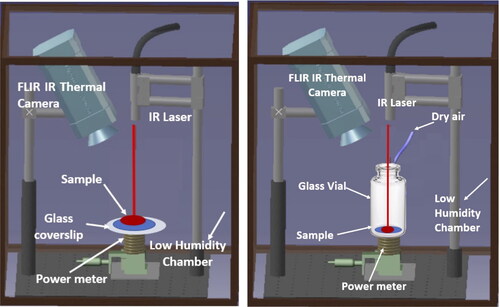
The LAD system for processing on both glass coverslips and in glass vials is shown in . LAD processing was conducted using a continuous wave ytterbium fiber laser (IPG Photonics, YLR-5-1064) at a maximum power output of 5 W and using the factory-collimated Gaussian beam. A thermal sensor (Beam Track 10 A-PPS, Ophir Photonics) was used to measure the power output and beam FWHM spot size of 4.5 mm. A mid-IR camera (FLIR A6 series) was used to record the temperature of all samples during processing. All studies were performed in a humidity-controlled environment that was kept at approximately 2% relative humidity (RH). This was achieved by pumping dry air into a chamber containing the experimental setup and monitoring the RH with a temperature and RH logger (ONSET UX100-011). Maintaining a low relative humidity expedited the drying process. In preliminary experiments of LAD processing within glass vials, water vapor condensed inside the vials as they were irradiated. Subsequently, the condensed water returned to the sample, and low moisture contents were never achieved regardless of laser irradiation time. To remove the water vapor inside the vial, a stream of dry air was introduced directly above the vial during processing. This created enough air circulation inside the vial to remove the water vapor and prevent condensation inside the vial.
Figure 1. Experimental set-ups for LAD processing. At left the coverslip experiment and at right the glass vial experiment. Samples are illuminated with a near-IR laser from above. The thermal camera was used to monitor the sample temperature during processing. The power meter was used to monitor transmitted laser power during processing. All samples were processed inside a low humidity chamber.
The model protein lysozyme was suspended in a drying solution (DS) at a concentration of 0.50 mg/ml. The DS consisted of 0.2 M disaccharide trehalose in 0.33 x phosphate buffer solution (PBS). To assess the vial’s suitability for LAD processing, 0.25 mL samples were processed both in vials and on coverslips for the purpose of comparison. For each experiment, a 0.25 mL droplet of the lysozyme/drying solution was deposited onto a 25 mm diameter borosilicate glass coverslip (N = 18, Fisher brand 12-5462) or inside a glass vial (N = 18, SCHOTT brand, TopLyo 10 R Fiolax clear, Type 1 Glass vial, non-blowback). In both cases, the sample geometry was a droplet. The droplet had a diameter of approximately 1.3 cm and thickness of 0.35 cm on the coverslip before LAD processing. The diameter of the droplet was approximately 1 cm with a thickness of 0.45 cm in the glass vial. This difference in diameter is due to the different surface properties of the coverslip versus vial (the vial surface is more hydrophobic). The initial mass of the sample was determined gravimetrically using a 0.01 mg readability balance (RADWAG AS 82/220.R2). The sample was then moved into the chamber for laser irradiation. Samples were irradiated with the laser for 2 h and 20 min (140 min). The temperature of the sample was monitored during processing using the thermal camera. The maximum sample temperature was 40 ± 2 °C for droplets processed on coverslips and 37.6 ± 0.9 °C for samples processed in glass vials. A power meter was used to monitor the laser power transmitted through the sample as a function of processing time. After irradiation, the sample was removed from the humidity chamber and immediately massed again. End moisture content (EMC), which is a measure of the amount of water relative to the dry mass of a sample was calculated.[Citation29,Citation30] EMC is used to understand the drying kinetics/repeatability of the LAD process and is a measure of relative water content. After LAD processing, samples were stored individually inside moisture barrier bags (Uline brand, S-2261BX) for 1 month. The RH inside the bag was 2.0% ± 0.5% RH (measured with a RH probe, HH314A, Omega). Nine coverslip and nine vial samples were stored at 4 °C, and nine coverslip and nine vial samples were stored at room temperature (approximately 20 °C). provides a summary of the types and number of samples processed.
Table 1. Sample volumes, geometries, substrates used, number, storage temperatures, EMCs before and after storage, LAD processing times, and sample radius before processing. EMC values are given in gH2O/gDryWeight.
Larger sample volumes (0.5 mL) were also LAD processed. These samples were only processed inside the glass vials because these volumes were too large for processing on glass coverslips (the diameter of the droplet was comparable to the diameter of the coverslip). To examine the effect of geometry, samples were processed as both droplets (N = 10) and flat samples (N = 10) inside the vials. For the flat samples, the solution covered the bottom of the vial with uniform thickness before LAD processing. In contrast, the droplet exhibited a hemispherical shape, and its thickness exceeded that of the flat samples. The diameter of the droplet was approximately 1.1 cm with a thickness of 0.46 cm, while the flat geometry sample had a diameter of approximately 2.5 cm and a thickness of 0.15 cm. Droplet samples were irradiated with the laser for 3 h and 5 min (185 min), while flat samples were irradiated for 2 h and 50 min (170 min). Following LAD processing, samples were stored at room temperature (approximately 20 °C). No 0.5 mL samples were stored at 4 °C. For 0.5 mL flat samples processed in glass vials the maximum sample temperature was 36 ± 1 °C and the 0.5 mL droplet samples processed in glass vials reached a maximum temperature of 37.3 ± 0.9 °C. provides a summary of the types and number of samples processed.
2.2. Polarized light imaging
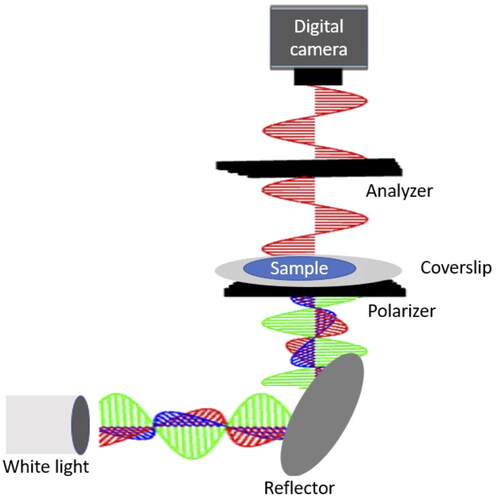
Polarized light imaging (PLI) was used to investigate crystallization kinetics in stored samples. The PLI experimental set-up consisted of a white light fiber optic illuminator (41720, Cole Palmer), two linear polarizers (LPVISE050-A, Thorlabs), with the second polarizer acting as an analyzer, and a digital camera (Nikon D100) aligned in the vertical direction (see ). The camera was equipped with a Nikon 28–105 mm f/3.5–4.5 lens and manually focused on the image plane. The spatial resolution of the set-up was 10 μm/pixel. Samples were placed on a glass microscope slide between the polarizers and imaged from above. Two images were taken: the first with the analyzer oriented at 0° to the polarizer and the second with the analyzer oriented at 90° with respect to the polarizer. For each sample, images were taken immediately after processing and again after storage.
Figure 2. Experimental setup for polarized light imaging. Images were taken from above by placing samples on a borosilicate glass cover slip between the polarizer and the analyzer.
2.3. Karl Fischer titration
Karl Fischer titration (KF) was used to determine the absolute water content. KF was performed on 0.5 mL samples (flat and droplet geometries, N = 2 for each) immediately after processing to determine water content. Prior to sample analysis, the titration system and oven were nitrogen purged and allowed to equlibrate for several hours. Any residual water in the system was titrated to zero and the titer was then calibrated with a certified standard. The vial containing the sample was weighed and transferred to the oven set to 160 °C and the water distilled into the titration vessel. Following titration, the mass percentage of the extracted water was determined. All KF testing was conducted by Centricor Analytical Labs located in Charlotte, NC. Samples were not shipped prior to analysis so that consistent storage conditions could be maintained until testing.
2.4. Differential scanning calorimetry (DSC)
A microcalorimeter (MicroCal VP-DSC, Northampton, MA) was used to assess the effect of LAD processing on the structure of the protein lysozyme. LAD samples were prepared as described in Sec. 2.1. Several 0.5 mL samples were analyzed immediately after LAD processing: unprocessed lysozyme in the trehalose buffer solution (N = 3) and LAD processed lysozyme (droplet N = 2; flat geometry N = 2). In addition, a sample that was allowed to sit at room tempearture for 24 h was analyzed for comparion. Some damage to the protein was expected in this sample. Seven 0.5 mL samples were tested after processing and storage for three months at room temperature using DSC: unprocessed lysozyme in the trehalose buffer solution (N = 3) and LAD processed lysozyme (droplet N = 2; flat geometry N = 2). The stored samples did not show signs of crystallization via PLI. One additional sample that did exhibit some crystallization during storage was also analyzed with DSC for comparison. Samples were rehydrated with buffer solution for DSC measurement. The concentration of lysozyme after rehydration was 0.02 ± 0.001 mM and DSC scans were normalized to this concentration. DSC baseline repeatability was established with a minimum of 10 reference solution scans of the buffer solution. Once a stable baseline was established, the samples containing lysozyme were loaded by syringe into the calorimeter. All scans were carried out at a scan rate of 90 °C/hr from 10 °C to 90 °C with a 15 min pre-scan equilibration time. The data was analyzed using Origin software provided by MicroCal to determine the midpoint temperature of transition, Tm, and the calorimetric enthalpy of unfolding,
3. Results
3.1. End moisture contents
EMC is a measure of the amount of water compared to the dry mass of a sample after processing or after storage. The average EMC values for all samples before and after storage are summarized in . A statistical analysis of variance (ANOVA) test was used to assess whether there were differences in EMC for the two different volumes that were processed or due to different processing conditions (substrate or sample geometry). There were no statistically significant variations in EMC between any of the groups listed in . EMC did not depend on volume, substrate type, or sample geometry. No statistically significant difference in EMC was noted before and after storage. LAD processing resulted in samples with consistent water content that was stable during storage.
3.2. Thermal histories
The thermal history is a plot of the change in the sample temperature as a function of processing time. shows representative thermal histories of 0.25 mL samples processed on coverslips and shows the curves for 0.25 mL samples processed inside glass vials (in both cases the sample geometry was a droplet). The thermal curve for a blank coverslip and an empty vial are also shown for comparison to examine the heating of the substrate alone. These thermal histories were repeatable for all samples processed for this study. The change in temperature of samples during processing was calculated by subtracting the minimum temperature of each sample from the maximum sample temperature. Using this temperature difference accounts for small differences in the ambient temperature in the laboratory and allows easy comparison of the shapes of the thermal histories for all samples. The thermal histories for droplets processed on glass coverslips are clearly different from those of samples processed in vials. The sample geometry is the same in both cases (a hemispherical drop) suggesting the difference is the result of the different substrates/processing environments.
Figure 3. Representative thermal history (orange) and transmitted laser power (red) curves as a function of processing time for 0.25 mL hemispherical droplet samples processed on glass coverslips (panel a) and in glass vials (panel b). The thermal curves for a blank coverslip and empty vial are also included for comparison (blue).
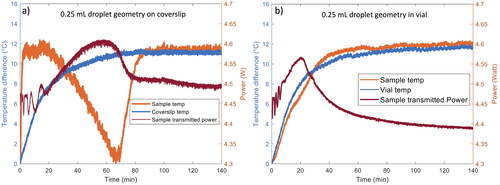
For 0.25 mL samples processed on coverslips, the shape of the thermal curve is similar to those measured during LAD processing of both comparable and smaller volume samples.[Citation28–30,Citation32] The initial rise in temperature is due to laser heating of the water in the sample. A maximum temperature is reached within the first 20 min of processing. After this peak, the temperature decreases gradually due to evaporative cooling, indicating that the LAD process is removing water from the sample. Samples reach a minimum temperature at around 70 min. After this point, the sample temperature increases until approximately the 100-minute mark, after which the amount of heating and cooling are in equilibrium and the temperature plateaus. The plateau is likely the result of heating of the glass coverslip and the sample by the laser balanced by convective cooling as significant evaporation has ceased at this point in processing. Processing further into this plateau region yields little additional drying. The temperature plateau marks the end of significant drying of the sample and is used to help determine the appropriate processing time. In this case, a processing time of 140 min (2h 20 min) ensures that samples have reached this plateau (all processing times are summarized in ).
For 0.25 mL samples processed in glass vials, the thermal curve shows a gradual increase in sample temperature during the first 50 min of processing, and then the sample temperature plateaus at approximately 50 min (see ). The initial rise in temperature is a combination of heating of the water in the sample and direct heating of the glass vial by the laser. In this case, cooling from evaporation is not as evident in the thermal curve as it was for the samples processed on coverslips. However, a comparison of the thermal history for a sample to that of the empty vial demonstrates that the temperature is slightly lower between 10 and 30 min for vials containing samples - likely the result of evaporative cooling. After most of the water is removed, the thermal curve plateaus. The plateau in the thermal curve is an indication that significant evaporation has ceased in the sample and provides an estimate of the appropriate LAD processing time. The processing time for 0.25 mL droplets in vials was 140 min (2h 20 min), the same as 0.25 mL droplets processed on the coverslips. In this case the change of processing substrate did not alter the LAD processing time.
shows the representative thermal histories of 0.5 mL samples processed in glass vials as droplets and in a flat geometry. For comparison, the thermal curve for an empty vial is also shown in each panel. For 0.5 mL droplet samples processed in glass vials the thermal curve shows an almost linear increase in sample temperature during the first 20 min of processing time. The initial increase suggests that water is being heated efficiently by the laser. The thermal history for the sample shows a slightly lower temperature at a given processing time (between 10 and 50 min) than for the empty vial, indicating that water is being removed from the sample. After about 50 min, the rate of water evaporation slows. The temperature reaches a plateau at 80 to 100 min of processing. A processing time of 185 min (3h 5 min) was sufficient to dry the 0.5 mL droplet samples to low EMC. This processing time is longer than the time required to dry 0.25 mL droplet samples in glass vials. However, the doubling of volume did not result in a doubling of processing time. The evaporation rate scales approximately as the radius of a droplet.[Citation33–35] The size of the 0.25 mL droplet in the vial has approximately the same radius as the 0.5 mL sample (see ) so the evaporation rate of water from these droplets will be comparable. However, the volume of water that must be removed from the 0.5 mL drop is larger, resulting in a longer processing time.
Figure 4. Representative thermal history (orange) and transmitted laser power (red) curves as a function of processing time for 0.5 mL hemispherical droplet samples processed in glass vials (panel a) and 0.5 mL flat geometry samples processed in glass vials (panel b). The thermal curve for an empty vial is also included for comparison (blue line).
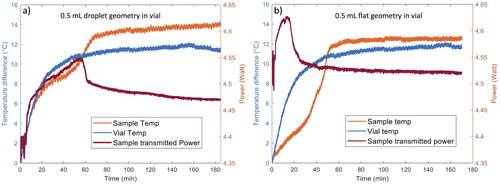
Figure 5. Representative thermal history (orange) and transmitted laser power (red) curves as a function of processing time for 0.5 mL hemispherical droplet samples processed in glass vials (panel a) and 0.5 mL flat geometry samples processed in glass vials (panel b). The thermal curve for an empty vial is also included for comparison (blue line).

shows the representative thermal histories of 0.5 mL flat samples processed inside glass vials. The thermal curve demonstrates analogous behavior to the 0.5 ml droplet sample. Over the initial 20-minute processing period, there is a linear rise in sample temperature attributable to the direct absorption of laser energy. Between 20 and 50 min, the thermal history for the vial containing a sample shows a slightly lower temperature at a given processing time due to evaporative cooling. A plateau in temperature occurs around the 80-minute mark of processing time. A processing duration of 170 min (2h 50 min) ensured the samples reached the plateau and further processing time did not yield additional sample drying. This processing time is slightly shorter than that required to dry 0.5 mL samples in a droplet geometry. The evaporation rate is proportional to the radius of the sample.[Citation33–35] The 0.5 mL flat samples have a larger radius than the droplets, thus they dry more quickly.
3.3. Transmitted laser power curves
A power meter was placed below the sample (see ) to measure the amount of laser power transmitted through the sample and substrate as a function of processing time. A decrease in transmitted power indicates that the laser power is being absorbed by the sample/substrate. Water absorbs strongly at 1064 nm. As water is removed from the sample, a decrease in absorption by water is expected and this should result in an increase in the transmitted laser power. Significant changes in the absorption of the laser light by the substrate as a function of time are not expected, so changes in the transmitted power are most likely due to changes in the water content of the samples.
shows transmitted power as a function of processing time for 0.25 mL samples processed as droplets on glass coverslips and inside glass vials. In all graphs, the initial fluctuations in power during the first 10 min of processing are the result of small fluctuations in the laser power. The laser could not be turned on prior to the start of processing to remove this effect. These small variations in laser power do not impact the end moisture content of samples. The transmitted power curves are sensitive to the alignment of the power meter below the sample and changes in the placement of the meter can cause small variations in the power curves from sample to sample. However, the overall trends are constant from sample to sample. shows the transmitted power curves for the 0.25 mL samples processed on glass coverslips. These curves reveal an increase in the transmitted power during the first 60 min of processing. This corresponds to the initial rise in temperature followed by the evaporative cooling phase seen in the thermal histories for these samples. Water is gradually removed from the sample during the first 60 min of laser irradiation, thus reducing the absorption of laser light by the sample. After approximately 60–80 min, the transmitted power decreases slightly and then by 90 min plateaus. This corresponds to the rise in temperature and plateau seen in the thermal curves. Because most of the water has been removed from the sample at this point in processing, absorption by the glass coverslip/dried sample becomes the dominant mechanism responsible for the decrease in transmitted laser power. The absorption by the coverslip/dried sample is constant after 90 min. This agrees with the thermal curves in that after about 90 min, the heating is balanced by convective cooling.
shows the transmitted power curves for the 0.25 mL droplet samples processed in glass vials. These curves show a similar behavior as was evident for the samples processed on coverslips. During the first 20 min of processing the laser transmitted power increases. This indicates that water is being removed from the sample, thus decreasing the absorption of laser radiation by the sample. This corresponds to the gradual increase in the sample temperature seen in the thermal curves. After 20 min the transmitted laser power decreases slightly and then the curve flattens. This corresponds to the time of the temperature plateau in the thermal curves. The dominant absorption mechanism during this phase is the absorption of laser light by the glass vial/sample resulting in heating that is balanced by convective cooling.
shows the transmitted power curves of 0.5 mL samples processed in glass vials in the form of hemispherical droplets and a flat geometry. The transmitted power curves are similar to those for the 0.25 mL samples processed on coverslips and in glass vials. For flat samples, there is an increase in transmitted power over the initial 25-minute period. For droplets, this power increase occurs between the first 30 to 50 min of processing. Subsequently, the transmitted power decreased for flat samples between 25 and 50 min, while for droplet samples this decrease occurred between 50 and 90 min. The transmitted power curves of flat samples level off between 50 and 60 min, while those of droplet samples reach their plateau within the 60 to 90-minute range. This suggests that water removal is more rapid for the flat geometry (as also seen in the thermal histories).
3.4. Polarized light imaging
Polarized light imaging (PLI) was used to determine if crystallization of the trehalose matrix occurred during processing and/or after storage. Crystallization indicates matrix instability that could result in damage to embedded biologics. The presence of crystalline inclusions in a sample can be detected with polarized light imaging due to the birefringence of the crystals in the sample.[Citation29] shows representative PLI for a 0.25 mL droplet sample processed on a glass coverslip and then stored at 4 °C for 1 month. show the images taken with the polarizer and analyzer at the same angle before and after storage. These images show a detailed view of the sample before and after storage. show the crossed-polarizer images of the sample before and after storage. Crystalline inclusions in the sample will rotate the plane of polarization of the incident polarized light making crystallized areas appear as white in the crossed-polarizer image. This sample does not show any evidence of crystallization before or after storage. For comparison, shows PLI for a different sample 0.25 mL droplet processed on a coverslip before and after storage. No crystallization is evident before storage. However, after storage significant crystallization was evident in this sample. The crystalline inclusions appear white in the crossed-polarizer image.
Figure 6. Representative PLI for a 0.25 mL droplet LAD processed on a coverslip. Panels a and b were taken immediately after LAD processing and panels c and d were taken after one-month storage at 4 °C. Images a and c were taken with both the polarizer and analyzer orientation at 0°. Images b and d show the crossed-polarizer images and crystallized areas should appear white.
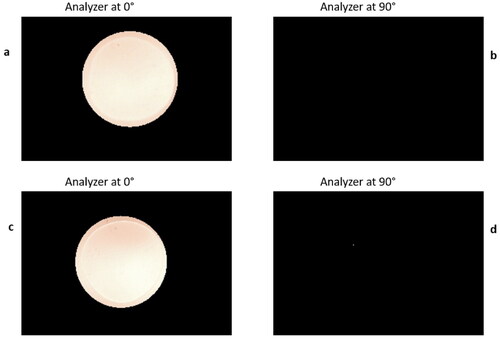
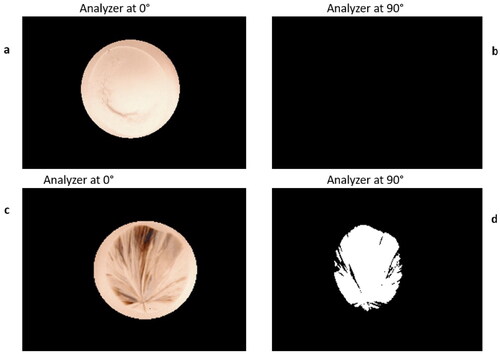
Figure 7. PLI for a 0.25 mL droplet processed on a coverslip. Panels a and b were taken immediately after LAD processing and panels c and d were taken after storage for one month at room temperature. Images a and c were taken with both the polarizer and analyzer orientation at 0°. Images b and d show the crossed-polarizer images. This sample exhibited crystallization after storage and these region appear white in this image. The crystals are also visible in image c.
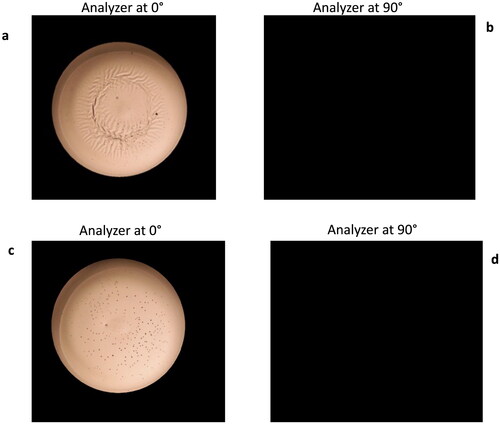
shows PLI for a 0.5 mL droplet processed in a glass vial and then stored at 20 °C for 1 month. The wrinkled appearance of the sample in is the result of a small amount of water re-absorption when the sample was placed in the higher RH of the laboratory environment for acquiring PLI. This effect has been seen in previous LAD experiments.[Citation29] The wrinkling quickly dissipates when the sample is returned to a low-humidity environment and does not adversely affect the long-term stability of the sample. This sample does not exhibit any significant crystallization before or after storage as seen in the crossed-polarizer images.
Figure 8. Representative PLI for a 0.5 mL droplet processed inside a glass vial. Panels a and b were taken immediately after LAD processing and panels c and d were taken after storage for one month at room temperature. Images a and c were taken with both the polarizer and analyzer orientation at 0°. Images b and d show the crossed-polarizer images. No crystallization is evident in this sample.
To quantify the crystallization of samples, a crystal area was calculated based on the PLI using a thresholding technique in MATLAB. For each image taken with crossed polarizers, a threshold intensity was established by finding the average maximum value of the intensity of an area of pixels outside the sample. All pixels with intensities below the threshold value were zeroed. Crystal area was then measured as the number of pixels with an intensity higher than zero in the crossed polarizer image. summarize the measured crystal area of samples processed on coverslips and in glass vials before and after 1 month of storage at 4 °C and 20 °C. Impurities in a sample (dust, etc.) can be measured as a small crystal area in a sample immediately after processing. However, this measured pixel area does not change during storage and does not indicate that a sample is unstable to crystallization. For this reason, the magnitude of the change in the crystal area before and after storage is a better indicator of the stabilty of the trehalose matrix. This difference is an indication of crystal growth in the samples and large crystal growth is an indication that the matrix has crystallized. The crystal growth was small for 0.25 mL samples processed on coverslips and then stored at 4 °C for 1 month. Crystal growth was also minimal for 0.25 mL samples processed in vials and then stored at both 4 °C or at 20 °C for 1 month. Five of the eight 0.25 mL samples processed on coverslips and then stored at 20 °C did not crystallize. However, three of these samples exhibited significant crystallization. The 0.5 mL samples (both droplets and the flat geometry) processed in vials were free of crystallization after 1 month storage at room temperature. Results of an ANOVA analysis confirmed that the 0.25 mL samples processed on coverslips and stored at 20 °C exhibited a statistically significant higher level of crystallization than all other samples. Crystallization occurs when an amorphous solid relaxes. For an amorphous solid formed via drying, the EMC of the sample determines the temperature at which crystallization is likely to occur. Samples must be stored below this glass transition temperature, Tg, for the sample to remain in the amorphous state. In the case of LAD-processed samples, instability to crystal formation is likely to result if the EMC is not low enough for storage at a particular temperature. However, the 0.25 mL samples processed on coverslips had EMC values comparable to all other samples suggesting that the tendency to crystalize was not the result of a difference in water content for the samples. Deegen et al. describe the formation of solute rings for drops on solid substrates.[Citation33] It is possible that during LAD processing, more solute was deposited near the edge of the droplets on coverslips and this served as a nucleation site for crystallization during room temperature storage.
Table 2. Thermodynamic properties for lysozyme as determined with DSC. All LAD processed samples had a volume of 0.5 mL and were processed inside vials. Changes in thermodynamic properties are relative to unprocessed lysozyme.
3.5. Karl Fischer titration
The water content of 0.5 mL samples was measured using KF titration immediately after LAD processing. Two samples were droplets and two were flat geometry samples, all processed in vials. The average water content by mass of droplet samples was 1.8% ± 0.1% and the average water content by mass of flat samples was 1.60% ± 0.07%. These results show that the LAD process is able to effectively remove the majority of the water from samples. The glass transition temperature, Tg can be estimated based on this water content and the Gordon-Taylor equation. For both types of samples, Tg for the trehalose amorphous matrix is estimated be be greater than 80 °C. This is well above room temperature, indicting that LAD processed samples should be stable at ambient temperatures, consistent with the results presented here. Note, the Gordon-Taylor equation was derived for a binary mixture of trehalose and water and underestimates Tg for samples that contain salts and biologics.[Citation31,Citation32]
3.6. Differential scanning calorimetry
DSC is a thermoanalytical technique that measures the difference in the amount of heat required to increase the temperature of a sample compared to a reference as a function of temperature (at constant pressure). This technique can detect the breaking of hydrogen bonds associated with protein unfolding and can measure small variations in heating associated with bond disruptions. DSC provides a way to determine if the structure of a protein is altered during LAD processing and/or subsequent storage. Drop and flat geometry samples were analyzed using DSC immediately after LAD processing and after storage at 20 °C for 3 months. All LAD processed samples were 0.5 mL samples processed in glass vials and were all free of any crystallization. In addition a sample of lysozyme stored at room temperature for 24 h (no LAD processing) was studied. Some degradation of the lysozyme was expected in this sample. Further, a LAD processed sample that did exhibit some crystallization during storage was analyzed to determine the effects of crystallization on lysozyme structure. Unprocessed lysozyme solution was tested for comparison for all samples. The melting temperature, TM, indicates the temperature at which half the protein in the sample unfolds and ΔH is the calorimetric enthalpy change and is an indication of the amount of energy needed to unfold the protein. Representative calorimetric curves are shown in and the derived thermodynamic properties for the samples are given in . The percent difference for Tm and ΔH as compared to unprocessed lysozyme is also included for each sample in .
Figure 9. Calorimetric curves of LAD processed samples immediately after processing (panel a) and after 3 months of storage at 20 °C (panel b).
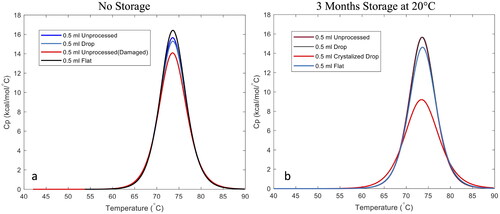
No significant changes in Tm or ΔH were noted for the LAD processed samples compared to unprocessed lysozyme before or after storage. LAD processing did not significantly alter the structue of the protein. However, there is a reduction in ΔH for the lysozyme sample stored at room temperature for 24 h and for the sample that crystallized during storage suggesting that less energy was required to unfold the protein in these samples. This indicates some disruption of the structure of the protein. In addition, notice in that the curve for the crystallized sample is slightly above the curve for the unprocessed lysozyme at lower temperatures. This implies that the protein in the crystallized sample began to unfold at a lower temperature than the unprocessed sample. Crystallization of the trehalose matrix negatively impacted the structure of lysozyme. This underscores the importance of considering and monitoring crystallization of the matrix during or after LAD processing, as it can negatively impact protein structure and likely function.
4. Discussion and conclusions
Sample volumes of 0.25 mL were processed as droplets on glass coverslips and in glass vials and 0.5 mL samples as droplets and flat samples inside vials. In all cases, LAD produced an amorphous matrix with low, repeatable water content, and a 1-month storage trail indicated that the matrix was stable at both refrigerated and ambient temperatures. The thermal histories and transmitted laser power curves were used to explore the drying kinetics of samples and determine optimal LAD processing times. Both offer clear indications of the point at which the sample achieves its minimum water content. As water is removed, the sample’s temperature decreases and the ability to absorb laser energy diminishes. The optimum processing time for 0.25 mL droplets on glass coverslips and in glass vials was 140 min. Flat geometry 0.5 mL samples were dried for 170 min and droplets were processed for 185 min, both in glass vials. The surface area of the flat samples was larger and resulted in larger evaporation rates and shorter processing times.
The presence of crystallization in a sample after processing or storage is an indicator of matrix instability that could be damaging to embedded biologics. PLI was used to access crystal content and growth in LAD-processed samples. Results indicated little/no crystallization in the majority of samples immediately after processing or after storage. LAD is capable of producing a matrix that is stable during storage at both refrigerated and room temperatures. DSC was used to assess the structure of the embedded protein lysozyme after LAD processing and storage. No significant changes in the thermodynamic properties of the protein were seen after LAD processing or storage suggesting that the embedded protein was not damaged. KF measured absolute water content of < 2% for all the samples tested. The Gordon- Taylor equation for the glass transition temperature of a trehalose solid indicates that a matrix with this water content should be stable at room temperature as was demonstrated in the storage trials.[Citation36]
Currently, most biologics must be stored at refrigerated or freezing temperatures. Lyophilization is the most widely used method to thermally stabilize biologics such as therapeutics and vaccines. However, the process remains expensive and complex and due to their freeze sensitivity cannot be applied to all biologics. LAD offers a possible alternative for improving the thermal stability of therapeutics and vaccines and reducing/eliminating the need for controlled-temperature distribution and storage. LAD produces a trehalose preservation matrix capable of room temperature storage for samples processed as droplets or flat samples both on glass coverslips and in glass vials. Processing samples with volumes comparable to therapeutic doses inside vials used in industry is an important step forward in our effort to scale up this technology for industrial applications. Future/current work is focused on developing methods for processing multiple samples simultaneously. This type of batch processing will be necessary for the use of LAD in a production line setting.
Acknowledgements
All authors contributed to the study conception and experimental design. The first draft of the article was written by A.A.T. and S.R.T. All authors commented on the previous versions of the article. A.A.T., D.P.F. and G.O. performed the laboratory work. A.A.T. produced the figures. All authors read and approved the article.
Disclosure statement
The authors have no relevant financial interests in the manuscript and no other potential conflicts of interest to disclose.
Data availability statement
The data that support the findings of this study are available from the corresponding author upon reasonable request.
Additional information
Funding
References
- Pambudi, N. A.; Sarifudin, A.; Gandidi, I. M.; Romadhon, R. Vaccine Cold Chain Management and Cold Storage Technology to Address the Challenges of Vaccination Programs. Energy Rep. 2022, 8, 955–972. DOI: 10.1016/j.egyr.2021.12.039.
- Rexroad, J.; Wiethoff, C. M.; Jones, L. S.; Middaugh, C. R. Lyophilization and the Thermostability of Vaccines. Cell Preservat. Technol. 2002, 1, 91–104. DOI: 10.1089/153834402320882593.
- Kis, Z. Stability Modelling of mRNA Vaccine Quality Based on Temperature Monitoring throughout the Distribution Chain. Pharmaceut. 2022, 14, 430. DOI: 10.3390/pharmaceutics14020430.
- Tang, X.; Pikal, M. J. Design of Freeze-Drying Processes for Pharmaceuticals: Practical Advice. Pharm. Res. 2004, 21, 191–200. DOI: 10.1023/b:Pham.0000016234.73023.75.
- Liapis, A.; Bruttini, R. Exergy Analysis of Freeze Drying of Pharmaceuticals in Vials on Trays. Int. J. Heat Mass Transf. 2008, 51, 3854–3868. DOI: 10.1016/j.ijheatmasstransfer.2007.11.048.
- Kawasaki, H.; Shimanouchi, T.; Kimura, Y. Recent Development of Optimization of Lyophilization Process. J. Chem. 2019, 2019, 1–14. DOI: 10.1155/2019/9502856.
- Roughton, B. C.; Iyer, L. K.; Bertelsen, E.; Topp, E. M.; Camarda, K. V. Protein Aggregation and Lyophilization: Protein Structural Descriptors as Predictors of Aggregation Propensity. Comput. Chem. Eng. 2013, 58, 369–377. DOI: 10.1016/j.compchemeng.2013.07.008.
- Wang, W. Lyophilization and Development of Solid Protein Pharmaceuticals. Int. J. Pharm. 2000, 203, 1–60. DOI: 10.1016/s0378-5173(00)00423-3.
- Arakawa, T.; Prestrelski, S. J.; Kenney, W. C.; Carpenter, J. F. Factors Affecting Short-Term and Long-Term Stabilities of Proteins. Adv. Drug Delivery Rev. 2001, 46, 307–326. DOI: 10.1016/s0169-409x(00)00144-7.
- Wang, Z.; Li, L.; Ren, G.; Duan, X.; Guo, J.; Liu, W.; Ang, Y.; Zhu, L.; Ren, X. A Comprehensive Review on Stability of Therapeutic Proteins Treated by Freeze-Drying: Induced Stresses and Stabilization Mechanisms Involved in Processing. Drying Technol. 2022, 40, 3373–3388. DOI: 10.1080/07373937.2022.2048847.
- Zhang, Q.; Gong, L.; Zhang, Y.; Shen, Y.; Shen, L.; Cao, L.; Han, G.; Hu, F.; Zhao, F.; Chen, Z. Room-Temperature-Storable Chemiluminescence Freeze-Drying Mixes for Detection of SARS-CoV-2 Neutralizing Antibody. Drying Technol. 2022, 40, 3064–3071. DOI: 10.1080/07373937.2021.2015604.
- Pardeshi, S.; More, M.; Patil, P.; Pardeshi, C.; Deshmukh, P.; Mujumdar, A.; Naik, J. A Meticulous Overview on Drying-Based (Spray-, Freeze-, and Spray-Freeze) Particle Engineering Approaches for Pharmaceutical Technologies. Drying Technol. 2021, 39, 1447–1491. DOI: 10.1080/07373937.2021.1893330.
- Clausi, A. L.; Merkley, S. A.; Carpenter, J. F.; Randolph, T. W. Inhibition of Aggregation of Aluminum Hydroxide Adjuvant during Freezing and Drying. J. Pharm. Sci. 2008, 97, 2049–2061. DOI: 10.1002/jps.21143.
- Alzhrani, R. F.; Xu, H.; Moon, C.; Suggs, L. J.; Williams, R. O.; Cui, Z. Thin-Film Freeze-Drying is a Viable Method to Convert Vaccines Containing Aluminum Salts from Liquid to Dry Powder. Vaccine Delivery Technol. 2021, 489–498.
- Thorat, B. N.; Sett, A.; Mujumdar, A. Drying of Vaccines and Biomolecules. Drying Technol. 2022, 40, 461–483. DOI: 10.1080/07373937.2020.1825293.
- Carpenter, J. F.; Chang, B. S. Lyophilization of Protein Pharmaceuticals. In Biotechnology and Biopharmaceutical Manufacturing, Processing, and Preservation; CRC Press, 2020; pp 199–264.
- Cicerone, M. T.; Pikal, M. J.; Qian, K. K. Stabilization of Proteins in Solid Form. Adv Drug Deliv Rev 2015, 93, 14–24. https://www.ncbi.nlm.nih.gov/pubmed/25982818. DOI: 10.1016/j.addr.2015.05.006.
- Kumru, O. S.; Joshi, S. B.; Smith, D. E.; Middaugh, C. R.; Prusik, T.; Volkin, D. B. Vaccine Instability in the Cold Chain: Mechanisms, Analysis and Formulation Strategies. Biologicals 2014, 42, 237–259. DOI: 10.1016/j.biologicals.2014.05.007.
- Pinto, J. T.; Faulhammer, E.; Dieplinger, J.; Dekner, M.; Makert, C.; Nieder, M.; Paudel, A. Progress in Spray-Drying of Protein Pharmaceuticals: Literature Analysis of Trends in Formulation and Process Attributes. Drying Technol. 2021, 39, 1415–1446. DOI: 10.1080/07373937.2021.1903032.
- McAdams, D.; Chen, D.; Kristensen, D. Spray Drying and Vaccine Stabilization. Expert Review of Vaccines 2012, 11, 1211–1219. DOI: 10.1586/erv.12.101.
- Crowe, J. H.; Crowe, L. M. Preservation of Mammalian Cells – Learning Nature’s Tricks. Nat. Biotechnol. 2000, 18, 145–146. DOI: 10.1038/72580.
- Wolkers, W. F.; Tablin, F.; Crowe, J. H. From Anhydrobiosis to Freeze-Drying of Eukaryotic Cells. Comparat. Biochem. Physiol. 2002, 131, 535–543. DOI: 10.1016/s1095-6433(01)00505-0.
- Caliskan, G.; Mechtani, D.; Roh, J.; Kisliuk, A.; Sokolov, A.; Azzam, S.; Cicerone, M. T.; Lin-Gibson, S.; Peral, I. Protein and Solvent Dynamics: How Strongly Are They Coupled? J. Chem. Phys. 2004, 121, 1978–1983. DOI: 10.1063/1.1764491.
- Olsson, C.; Jansson, H.; Swenson, J. The Role of Trehalose for the Stabilization of Proteins. J. Phys. Chem. B. 2016, 120, 4723–4731. DOI: 10.1021/acs.jpcb.6b02517.
- Magazu, S.; Romeo, G.; Telling, M. Temperature Dependence of Protein Dynamics as Affected by Sugars: A Neutron Scattering Study. Eur. Biophys. J. 2007, 36, 685–691. DOI: 10.1007/s00249-007-0190-y.
- Patist, A.; Zoerb, H. Preservation Mechanisms of Trehalose in Food and Biosystems. Colloids Surf, B. 2005, 40, 107–113. DOI: 10.1016/j.colsurfb.2004.05.003.
- Frigon, R. P.; Lee, J. C. The Stabilization of Calf-Brain Microtubule Protein by Sucrose. Arch. Biochem. Biophys. 1972, 153, 587–589. DOI: 10.1016/0003-9861(72)90376-1.
- Young, M. A.; Antczak, A. T.; Wawak, A.; Elliott, G. D.; Trammell, S. R. Light-Assisted Drying for Protein Stabilization. J. Biomed. Opt. 2018, 23, 5007. DOI: 10.1117/1.JBO.23.7.075007.
- Young, M. A.; Furr, D. P.; McKeough, R. Q.; Elliott, G. D.; Trammell, S. R. Light-Assisted Drying for Anhydrous Preservation of Biological Samples: Optical Characterization of the Trehalose Preservation Matrix. Biomed. Opt. Express. 2020, 11, 801–816. DOI: 10.1364/BOE.376630.
- Anh Lam, P.; Furr, D. P.; Tran, A.; McKeough, R. Q.; Beasock, D.; Chandler, M.; Afonin, K. A.; Trammell, S. R. The Application of Light-Assisted Drying to the Thermal Stabilization of Nucleic Acid Nanoparticles. Biopreserv. Biobanking. 2022, 20, 451–460. DOI: 10.1089/bio.2022.0035.
- Tran, A. N.; Chandler, M.; Halman, J.; Beasock, D.; Fessler, A.; McKeough, R. Q.; Lam, P. A.; Furr, D. P.; Wang, J.; Cedrone, E.; et al. Anhydrous Nucleic Acid Nanoparticles for Storage and Handling at Broad Range of Temperatures. Small. 2022, 18, 2104814. DOI: 10.1002/smll.202104814.
- Furr, D.; Tsegaye, A.; Kern, M.; Olson, G.; Trammell, S. 2022 Light-Assisted Drying (LAD) for Anhydrous Preservation of Biologics: Processing Sample Volumes Comparable to a Therapeutic Dose. In Optics and Biophotonics in Low-Resource Settings VIII, SPIE, Vol. 11950, pp. 27–34. DOI: 10.1117/12.2609907.
- Deegan, R. D.; Bakajin, O.; Dupont, T. F.; Huber, G.; Nagel, S. R.; Witten, T. A. Contact Line Deposits in an Evaporating Drop. Phys. Rev. E. 2000, 62, 756–765. https://link.aps.org/doi/10.1103/PhysRevE.62.756. DOI: 10.1103/physreve.62.756.
- Erbil, H. Y. Evaporation of Pure Liquid Sessile and Spherical Suspended Drops: A Review. Adv. Colloid Interface Sci. 2012, 170, 67–86. DOI: 10.1016/j.cis.2011.12.006.
- Vlasov, V. On a Theory of Mass Transfer during the Evaporation of a Spherical Droplet. Int. J. Heat Mass Transf. 2021, 178, 121597. DOI: 10.1016/j.ijheatmasstransfer.2021.121597.
- Gordon, M.; Taylor, J. S. Ideal Copolymers and the Second-Order Transitions of Synthetic Rubbers. I. Non-Crystalline Copolymers. J. Appl. Chem. 1952, 2, 493–500. DOI: 10.1002/jctb.5010020901.
Appendix A.
Crystal areas determined using polarized light imaging
Table A1. Crystal area for 0.25 mL droplets processed on glass coverslips. Crystal area is measured in pixels.
Table A2. Crystal area for 0.25 mL droplets processed on in glass vials. Crystal area is measured in pixels.
Table A3. Crystal area for 0.5 mL droplets and flat samples processed in glass vials. All storage was at 20∘C for these samples. Crystal area is measured in pixels.