
 ?Mathematical formulae have been encoded as MathML and are displayed in this HTML version using MathJax in order to improve their display. Uncheck the box to turn MathJax off. This feature requires Javascript. Click on a formula to zoom.
Abstract
Improving exergy efficiency is crucial to the drying process, especially in reducing costs and carbon dioxide emissions. A closed-loop drying system with a condenser-reheater system was built and analyzed using a numerical simulation to explore the optimal drying conditions, such as inlet air temperature and the air flow rate. Heat-loss coefficients in the simulation were fitted to experimental measurements. The study found that increasing the inlet temperature led to an increase in energy inflow and exergy loss in the system. With an increase in air flow rate from 0.005 to 0.01 kg/s, the exergy loss of the chamber decreased (0.07–0.04 kW), and the exergy efficiency increased (69–92%). The exergy loss was mainly concentrated in the drying chamber, that is, the drying process, and the newly connected condenser and reheater had good exergy efficiencies, exceeding 60%.
1. Introduction
The drying process is energy-intensive, due to the high latent heat of vaporization for water. Many researchers[Citation1–3] have studied the energy consumption in the drying process, and the improvement of energy quality-exergy analysis, also called effective energy analysis, has become a topic of significant focus in recent years. In particular, its application in superheated steam drying has attracted widespread attention. Guo et al. achieved self-sufficiency in thermal energy by combining hydrothermal drying (HTD) and superheated air (SHS) drying technologies and recycling heat from the SHS section to supply the HTD process.[Citation4] In this process, exergy analysis reveals the impact of different material moisture contents and different drying temperatures on the overall energy self-sufficiency rate, thus indicating the direction for actual operation optimization.[Citation4] Decarbonization is achieved through such a cogeneration device and a circulating heat recovery system. Another important equipment in superheated steam drying is the heat pump. The heat pump plays the role of converting waste heat or low-grade energy into high-grade energy (superheated air).[Citation5] By further optimizing the configuration of the heat pump, such as selecting a suitable heat exchanger, as in the air reheater used in this study, energy consumption can be reduced by recovering the energy from waste heat to preheat the steam at the end of the cycle path, thereby reducing carbon emissions. Other energy-saving approaches in the drying field have also received attention, with Yi et al.[Citation6] discussing “multistage drying, self-heat recuperation and process integration” in the context of biomass drying.
Exergy is defined as the maximum work produced by a system, matter, or energy. Through exergy analysis, the energy conversion, energy loss, and energy type of each position in a system may be quantified. The exergy analysis of each system is affected by the system’s reference environment, such as the temperature, humidity, and any chemical substances in the environment.[Citation7] Amjad, Sturm et al.[Citation8] have suggested that the thermal component of exergy is the most important one in a drying system[Citation8]:
(1)
(1)
The exergy efficiency of the system can be written as
(2)
(2)
Therefore, for actual production, reducing exergy loss relates to improving energy utilization. To evaluate the potential improvement of exergy efficiency of different systems and processes, the concept of improvement potential (IP)[Citation9] may be introduced to describe this process.
(3)
(3)
The exergy efficiency cannot reach 100% unless the entire process is reversible. For actual production, it is necessary to make a tradeoff between the energy saving (operating cost) and increasing the exergy efficiency (capital cost). The irreversibility can be reduced by decreasing the difference between the exergy output and the exergy input.[Citation10]
Relative irreversibility (RI)[Citation11] has been introduced to represent the relative significance of the exergy loss for a particular unit operation compared with the total exergy loss of the system. The exergy factor (f) has been used to represent the relative significance of the inflow exergy of a certain component and the total inflow exergy of the system, and the Sustainability Index (SI) has been used to indicate how the sustainability of the system is affected by the exergy efficiency of the system.[Citation12]
(4)
(4)
(5)
(5)
(6)
(6)
Many energy studies have been performed on open-loop drying systems (Sarker[Citation13]; Surendhhar[Citation14]), which have low energy and exergy utilizations. The energy efficiency of most drying systems is about 10–50%. Aziz et al.[Citation15] created an energy-saving drying system using self-heat recuperation together with a fluidized-bed dryer. The range of operating conditions was constrained by the limited range of gas velocities and hence flow rates necessary for smooth fluidization.
Several studies[Citation8,Citation16–27] have investigated drying systems with incomplete or partial air recirculation in batch drying systems with no condenser (for example, Amjad, Strum et al.[Citation8] for potato slices; Zohrabi et al.[Citation16] for wood chips). Open-loop roasting and drying of pistachio nuts with no air recirculation has been studied by Sheikshoaei et al.[Citation17] A batch drying system was studied by Erbay and Hepbasli[Citation18] for a heat-pump driven condensation system with laurel leaves as the product.
However, continuous closed-loop spray drying systems have received less attention. Closed-loop drying systems have a long history, with research work being reported for the drying of lumber and wood chips in superheated steam drying for over 20 years (Langrish et al.[Citation27]; Fyhr and Rasmussen[Citation19]; Pang and Pearson[Citation20]). However, these early works did not consider exergy. The interest in these closed-loop drying systems continues, with Hosseinabadi et al.[Citation21] studying the first-law energy efficiency of a triple-pass rotary dryer in a closed-loop system without considering the exergy efficiency of the system.
The study of Vazquez-Leon et al.[Citation22] mainly concerned the effects of closed-loop spray drying on product quality, which was very good. The authors pointed out the benefits of closed-loop spray drying for reducing explosion risks and environmental pollution. Moejes et al.[Citation23] studied the first law energy efficiency of a closed-loop spray drying system, and they used pinch analysis to assess the best combinations of unit operations. However, the optimization of the exergy (energy quality) was not carried out. Although their system was realistic in terms of size and configuration, it is unclear if their simulated system was a real or actual system. The “closed loops” studied by Poozesh and Cousins[Citation24] and Poozesh et al.[Citation25] are actually unsteady-state (dynamic) models of spray dryers that are being studied from the perspective of closed-loop process control (recycle of information only), not a closed loop, as meant by us, Vazquez-Leon et al.[Citation22] and Moejes et al.,[Citation23] with a dryer, condenser or heat pump, with the recycle of drying gas.
An apparently disconnected problem in spray drying is that of the deposition of particles on the walls of spray dryers, and here it has been reported (Woo et al.[Citation26]) that cooling the walls of a spray dryer below the sticky-point temperature may decrease the deposition rate, improving the performance of the equipment. This energy from cooling the walls of a spray dryer is also potentially available for energy recovery.
Therefore, this study focuses on a closed-loop spray drying system to directly utilize the latent heat in the outlet air. A simple global exergy analysis method has been used by comparing the difference between the outlet air and the inlet air temperature to define the exergy efficiency for the entire system. At the same time, the drying system has advantages in processing organic solvents and toxic solvent-based products by the use of recycled inert gases, such as nitrogen and carbon dioxide.
2. Materials and equipment
2.1. Description of closed-loop spray drying system
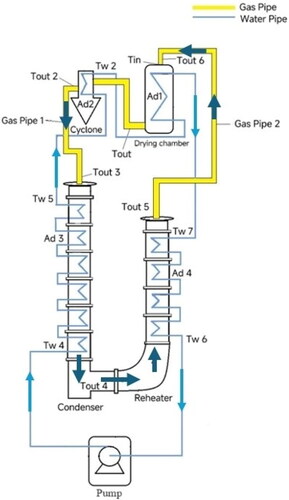
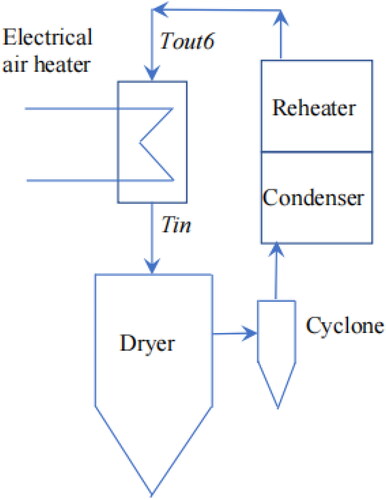
shows the structure of the heat recovery system. The closed-loop spray drying system consisted of two parts, which are a Buchi-290 spray dryer (Büchi, Switzerland) and a stainless-steel coil condenser-reheater system (CR system). The dryer and the CR system were connected by a rubber tube (total length 2.5 m, outer diameter 0.038 m, inner diameter 0.027 m). A two-fluid nozzle (with a 0.5 mm diameter orifice) was used for spraying water. A total of 14 thermocouples (Type J Thermocouple 35 mm length, 2.5 mm diameter, RS Components Australia) were used to detect the temperatures in the system. In the CR system, the condenser consists of six steel pipe sections (total length 1.6 m), and the air reheater consists of four steel pipe sections (total length 0.9 m). The height of each steel pipe is 20 cm, the inner diameter is 10 cm, and there are cooling water channels with a thickness of 2 cm on the inner and outer walls. There are seven airflow channels with a diameter of 2 cm evenly distributed inside. The total length of the external cooling water pipe is 23.5 m with an inner diameter of 2.5 cm.
Figure 1. Schematic diagram of multi-section condenser closed-loop drying system, showing the labeling of the measured temperatures.
2.2. Experimental procedure
The experimental system was run at the following selected parameters for 0.5 h to reach a steady-state condition: 120, 150, 200 °C inlet temperatures, 0.05, 0.08, 0.01 kg/s system main air flow rates, 1, 2, 3, 4 L·min−1 cooling water flow rates, and 5, 7, 9 mL·min−1 water feed rates to the atomizer. The temperature changes were recorded by a data logger (Datataker 505 Series2), a standalone hardware device designed for accurate and reliable data acquisition. This data logger is equipped with multiple channels for connecting temperature sensors, and it features internal memory for storing recorded data. During our experiment, the Datataker 505 Series2 was configured to record temperature every 15 s, providing a detailed log of the temperature variations.
The experiment duration was 2 h, with an extra hour of cooling to collect the condensate as completely as possible. Initially, the trials were started with air as the drying gas. As the added water evaporated and was subsequently collected as condensate, the air concentration in the loop remained unchanged. It is important to note that this differs from “superheated steam drying,” which is defined by the absence of air. All simulations in this study were performed using Matlab or Octave, using standard solvers for the ordinary differential equations, such as ode15s.
3. Analysis
3.1. Complexity and the nature of the simulation
While it might be questionable whether this system should be classified as a complex one, it is clear that significant computational power is required to solve the set of equations involved in the simulation. The system consists of three main groups of unit operations:
A cocurrent spray dryer, with cocurrent flow of gas and concentrate (water and solid) necessary in food production for maintaining food quality. This spray dryer includes an electrical gas heater and a cyclone for gas-solid particle separation, in addition to the drying chamber itself.
A condenser, which involves both heat and mass transfer processes.
A reheater, in which heat, and mass transfer may also occur.
Although the system is simple in structure, the interactions between these components and the need for precise control of the drying process require detailed modeling and significant computational effort. Each unit operation involves complex physical phenomena that must be accurately represented in the simulation to ensure reliable results. On the other hand, the countercurrent flow of water, as an overall heat transfer medium, and the drying gas through each group of unit operations creates a very high degree of interconnectedness, which creates significant complexity.
3.2. Simulation procedure
3.2.1. The purpose of the simulation
Given this type of complexity, the purpose of the simulation is to gain some insight, as quantitatively as possible, into how and why various changes to controllable operating parameters (degrees of freedom) in the closed-loop drying system may be used to improve the energy and exergy efficiency and/or effectiveness of the system (energy quantity and quality). This somewhat limited objective is the motivation for using UA products (overall heat-transfer coefficient × external surface area) to describe most of the heat losses in this system, for example, the heat losses from pipes. The controllable operating parameters include the cooling water flow rate (the heat recovery medium), the gas flow rate, and the inlet air temperature of the drying chamber.
While it is certainly possible to reduce the heat losses from pipes through design changes, for example by adding insulation and reducing pipe lengths as far as possible, these design changes are not the primary focus of this simulation (design analysis). Rather the focus of the simulation is to improve the performance (performance analysis) of the equipment by altering the controllable operating parameters, or at least to understand any tradeoffs in setting the values for these parameters. The reasons for such potential tradeoffs, for example regarding the cooling water flow rate, are complex and result from the simultaneous effects of the cooling water flow rate on the heat losses, the operating temperatures in all items of equipment, the energy transfer rates, and the humidities in all parts of the system. Whether a high or a low cooling water flow rate should be used is not intuitively obvious. The same considerations apply to the air flow rate.
3.2.2. Approach
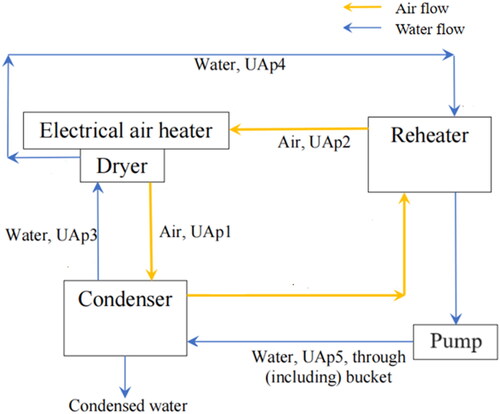
It is not necessary to “converge” each unit (dryer, condenser, or reheater) at each iteration. Instead, a global iteration is started with the setpoint value of the gas inlet temperature at the entrance to the drying chamber, after the electrical gas heater, TGin. This temperature is used as a fixed, set, and known value (e.g., 150 °C). The variable names used in the computer program for the main air and water flows are shown schematically in .
Figure 2. Schematic diagram of closed-loop spray drying system, showing the main air and water flows and associated symbols (variables that start with “UA” are products of the overall heat-transfer coefficients for heat loss to the ambient environment and the external surface area of the equipment or pipe for which the heat loss is being modeled).
3.2.3. Start of the global iteration
The global iteration is started by guessing the water temperature, Tw3, at the outlet of the cooling coils on the outside of the dryer and the cyclone, which leads to the reheater water inlet.
3.2.3.1. Dryer
Only one pass is necessary through the dryer and the cyclone from the water outlet (Tw3) and the gas inlet (TGin) to the gas outlet and the water inlet, at temperatures Tout2 and Tw1, respectively, without any need for internal iteration to solve for the dryer on its own.
3.2.3.2. From dryer to condenser
Following the air flow around, it is necessary to account for heat losses in the pipes:
the heat loss (temperature drop) in the gas, from Tout2 down to Tout3, so Tout3 is less than Tout2; and
the heat loss (temperature drop) in the water, from Tw5 down to Tw1, so Tw1 is less than Tw5. In countercurrent flow, this means that there is a temperature increase from Tw1 to Tw5.
3.2.3.3. Condenser
As with the dryer, only one pass is necessary through the condenser from the water outlet (Tw5) and the gas inlet (Tout3) to the gas outlet and the water inlet, at temperatures Tout4 and Tw4, respectively, without any need for internal iteration to solve for the condenser on its own.
3.2.3.4. From condenser to reheater
The gas outlet of the condenser is directly connected to the gas inlet of the reheater, so there is no temperature drop, and the two temperatures are equal (Tout4).
Following the air flow around, for the water flow it is necessary to account for heat losses in the pipes, which means a heat loss (temperature drop) in the water, from Tw6 down to Tw4, so Tw4 is less than Tw6. In countercurrent flow, this means that there is a temperature increase from Tw4 to Tw6.
3.2.3.5. Reheater
As with the dryer and condenser, only one pass is necessary through the reheater from the water outlet (Tw6) and the gas inlet (Tout4) to the gas outlet and the water inlet, at temperatures Tout5 and Tw7, respectively, without any need for internal iteration to solve for the reheater on its own.
3.2.3.6. From reheater to dryer
Following the air flow around, it is necessary to account for heat losses in the pipes:
the heat loss (temperature drop) in the gas, from Tout5 down to Tout6, so Tout6 is less than Tout5; and
the heat loss (temperature drop) in the water, from Tw3 down to Tw7, so Tw7 is less than Tw3. In countercurrent flow, this means that there is a temperature increase from Tw7 to Tw3.
This new value of Tw3 is compared with the original guessed value of Tw3, and the guessed value of Tw3 is then adjusted before the global iteration is started again. The convergence criteria are that the difference between the original guess and the final value of the temperatures Tw3 should be less than 0.1K, and the humidity at the dryer inlet should also be unchanged from iteration to iteration by less than 0.000001 kg·kg−1. The temperature increase from Tout6 to TGin occurs in the electrical gas heater associated with and inside the dryer before the gas enters the drying chamber. Details of the mathematical models for the unit operations are given in Appendix A.
3.2.4. The procedure for the data analysis of energy and exergy recovery (experimental and simulated)
The return temperature from the reheater to the air heater at the inlet of the spray dryer (Tout6 in ) is the most important temperature that denotes the energy recovery given by the condenser and reheater combination.
The energy input (Qheater) from the electrical air heater to raise the air temperature to the required inlet air temperature for the spray dryer (Tin) is then given by the following equation:
(7)
(7)
In addition, the exergy input from the electrical air heater for the same duty is given by the following equations:
(8)
(8)
(9)
(9)
(10)
(10)
Here Exin is the exergy input to the electrical air heater, Exout is the exergy output from the electrical air heater, and Exheater is the net exergy input over the electrical air heater.
4. Results and discussion
4.1. Effect of cooling water flow rate
shows that the experimental values of the energy and exergy inputs at the return point to the dryer (Tout6) in the closed loop agree well with the simulated ones. The cooling water flow rate (ranging from 1 L/min to 4 L/min) appears to have a minimal impact on the energy and exergy of this closed-loop spray drying system. An ANOVA analysis () shows that the cooling water flow rate (p ≈ .00001) is not significant at the 95% confidence level and has the smallest F statistic (9.80). This result suggests that, under the conditions of this study, the cooling water flow rate does not play a decisive role in the variation of the system’s exergy. While the cooling water flow rate may have an impact on other aspects of the system performance, such as the detailed values of the temperatures, it did not cause a significant effect on the exergy in this study. The main reason is that this system may have a well-balanced distribution of exergy among its components and processes. In such cases, the specific variation in cooling water flow rate may not significantly affect the overall exergy performance, as the system is already operating near its optimal exergy distribution. The inlet drying temperature has the largest F statistic (294), which means that the change in the inlet drying temperature leads to a large change in the temperature of all temperature points, which leads us to consider its effects in more detail.
Table 1. Trends in the experimental (expt) and simulated (sim) data for the energy and exergy inputs to the closed loop with changing cooling water flow rate and inlet drying temperature, first set of experiments (spraying rate of water to the dryer, 2.5 mL/min; main air flow rate, 0.01 kg/s; ambient air temperature, 23 °C).
Table 2. ANOVA analysis for different factors on all 14 temperatures in the closed-loop spray drying system, based on the experimental data in .
4.2. Effect of inlet gas temperature
In , a staged exergy analysis has been carried out for the main parts of the system. The whole system has been divided into five parts (chamber, condenser, reheater, and gas pipe 1&2) and compared with our simulations in . Exergy inflows and outflows have been calculated separately. The flow of energy and exergy out of one item of equipment (e.g. the drying chamber) is not the same as the energy or exergy flow into the next piece of equipment (e.g. the gas pipe 1) because many items of equipment, such as the drying chamber, have energy and exergy flows into an out of them due to both air and water streams, which run counter currently around this closed loop.
Figure 3. Experimental results for each part of the system with different inlet air temperatures (for detailed data, please refer to ).
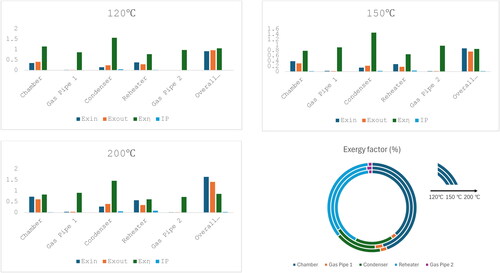
Given experimental uncertainties in the temperature measurements of ±1 K and relative uncertainties in the flow rate measurements of ±5%, propagation of error calculations show that the uncertainties in for the exergy efficiency (fractional, on a scale of 0–1) were around ±0.03 (3%). These calculations also suggest that the uncertainties in the improvement potentials were ±0.008 kW (±8 W) and those in the exergy factor were ±0.5%.
The overall exergy efficiency is a maximum at an inlet drying temperature of 120 °C, and the system has good energy utilization and is very suitable for dry powder production at low temperatures. The specific parts of the system all show good exergy indicators, namely low exergy losses for the pipes (such as 0.01 kW for pipe 2), low improvement potentials (almost 0.03–0.06 kW) for the condenser, which means almost no improvement is needed for the condenser), and high exergy efficiencies (around 80% for the condenser, 61–78% for the reheater, and around 85% overall) compared with the study by Razaghiyan et al. “the direct-fired heater, the spray dryer, and the air condenser account for 50% of the total exergy loss in the system.”[Citation28] Due to condensation, which releases the latent heat of condensation or vaporization, a negative exergy loss occurs in the condenser, with the exergy efficiency of the condenser being greater than 100%.
For each part of the process, as the temperature of the drying gas increases, its exergy inflow and improvement potential increase (especially for the chamber from 0.35 to 0.73 kW), which means that higher drying temperatures lead to more exergy loss, especially in the chamber section. The drying chamber is already insulated, so it is unclear if further reductions in exergy loss are economically reasonable.
The exergy factor (the ratio of the exergy inflow for a certain part of a system to the total system exergy inflow) has been used to determine the proportion of energy received by each part in , and provides a more intuitive understanding of exergy factor. The exergy factor for the chamber mostly increases and the factors for the other parts decrease as the inlet drying temperature increases, which means that as the temperature increases, more energy is used by the dryer compared with other parts of the system, which is desirable in some ways since drying is the overall aim of the system. However, increasing this inlet temperature also increases energy and exergy losses, so the exergy efficiency decreases.
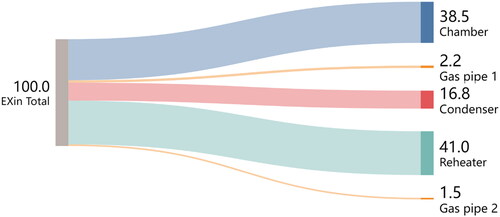
Figure 4. A Sankey-diagram of exergy factor for the inlet air temperature of 120 °C (pure water test, cooling water flow rate 3 L/min, air flow rate 0.01 kg/s).
4.3. Effect of drying air flow rate
The effect of cooling water flow rate analysis in the previous section has little effect on the exergy of the system. Therefore, the effects of the drying air flow rate have been studied in .
Figure 5. Trends in the experimental (expt) and simulated (sim) data for the energy and exergy inputs to the closed loop with changing air flow rate and inlet drying temperature, first set of experiments (for detailed data, please refer to Table A2).
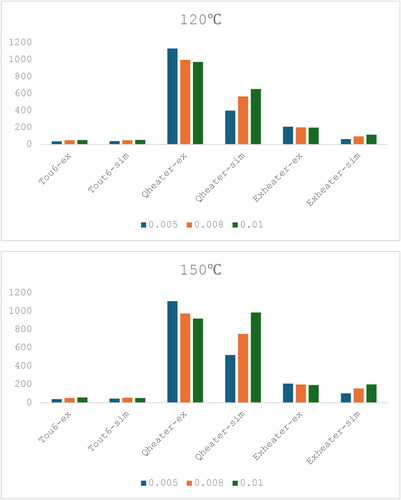
As shown in , the simulation has been used to simulate the conditions with an increase in the inlet drying temperature from 120 to 150 °C, and a change in the drying air flow rate from 0.005 kg/s to 0.01 kg/s in terms of the system exergy parameters. A common observation in is the increase in the outlet air temperature as the air flow rate increases. This result may not be immediately obvious, indeed may be counterintuitive, but it is logical, for the following reasons. The heat loss from the drying chamber occurs by natural convection and is limited by the external heat transfer from the outside of the dryer to the environment, not by heat transfer from the internal air to the dryer walls. The temperature drop in the air from the inlet (Tin, Qin) to the outlet (Tout, Qout) may be approximated by the following relationships:
Table 3. The effect of changes in the gas flow rate on exergy indicators at an inlet gas temperature of 150 °C: experimental and simulation results.
In this relationship, the energy flow entering and leaving in the air, with a flow rate of mair and a specific heat capacity of Cpair, together with the heat loss between the average temperature of the chamber wall Tav and the ambient environment Tamb by natural convection (with a product of the overall heat-transfer coefficient U and the external surface area A) may be represented in the following way:
so
Focusing on the temperature drop term, UA (Tav – Tamb)/(mair Cpair), it is important to clarify the conditions that are kept constant in this analysis. If the liquid flow rate is kept constant, variations in the air flow rate may affect the terms in the numerator. However, if the exhaust air temperature is maintained constant, the overall heat-transfer coefficient, being dominated by external natural convection and not internal heat transfer, only increases slightly at greater air flow rates. One would assume that the heat losses from the drying chamber are proportional to the chamber temperature, which is close to the exhaust air temperature. Therefore, while some components of the numerator may be influenced by changes in air flow rate, the dominant factor remains the chamber temperature and its associated heat losses.
summarizes the exergy indicators in each part of the system with a constant inlet drying temperature of 150 °C when the air flow rate in the system is changed. For exergy loss, when the air flow rate increases from 0.005 to 0.01 kg/s, the overall exergy efficiency increases (69–92% for experiment, 66–79% for simulation). The exergy loss from the chamber decreases (0.07–0.04 kW). These results show no optimum (maximum) in the exergy efficiency at an intermediate value of the air flow rate between the experimental limits of the current equipment. The maximum exergy efficiency occurs at the highest air flow rates. The reasons for these results are as follows.
When the air flow rate is increased from 0.005 kg/s to 0.01 kg/s, more thermal energy is transferred to the next section after the chamber, increasing the outlet temperature of the chamber and causing a decrease in the exergy loss from the chamber. The lower exergy loss then increases the exergy efficiency of the chamber. This increase in exergy efficiency at greater air flow rates also means that the improvement potential decreases since higher efficiency means less potential for further improvement. The exergy efficiency of the drying chamber decreases with greater air flow rates, which is due to the higher air outlet temperature of the dryer at a greater air flow rate causing more exergy to be passed to the other sections following the drying chamber.
It is noticeable that the largest changes in both the overall and the chamber exergy efficiencies occur between air flow rates of 0.005 kg s−1 and 0.008 kg s−1, and these changes in exergy efficiencies are much larger than the uncertainties in the exergy efficiencies (discussed earlier) of 0.03. It may at first appear that the trends, in simulations and experiments, are different between air flow rates of 0.008 kg s−1 and 0.01 kg s−1 (overall; experimental, 0.90 to 0.92; simulation, 0.84 to 0.79: chamber; experimental, 0.90 to 0.92; simulation, 0.84 to 0.79). However, as discussed earlier the experimental uncertainties in the exergy efficiencies were around ±0.03 (3%), so these differences in the exergy efficiency trends between these flow rates are within the experimental uncertainties.
Another unusual feature of results is the reheater and condenser exergy efficiencies, which are greater than unity (or 100% as a percentage) in several cases. The definition of exergy used here has been based only on the temperature in the literature (Amjad et al.[Citation8]), but energy is available from the humidity of the air, particularly when phase change (condensation or evaporation) is occurring. This consideration means that there is extra energy (the condensate heat release) in the input air to the condenser if only the air temperature is included, as it is in the current definition, and this can lead to these superficially unphysical numbers.
4.4. Comparison with other work
Regarding the dryer, shows that the exergy efficiency of the dryer varied from 69 to 92%, which is higher than the range reported by Zohrabi et al.[Citation16] of 1.4–3.0%, Coskun et al.[Citation29] of 4.4%, Ghasemkhani et al.[Citation30] of 0.4–2.2%, and Aghbashlo et al.[Citation1] of 5.25–7.42%. The last reference, Aghbashlo et al.[Citation1] is most relevant to this study, because it was a Buchi B-191 laboratory-scale spray dryer of a similar design to the B-290 model used in this work, but it was operated in open-loop mode. Our results suggest a slightly higher exergy efficiency for this design of spray dryer in closed-loop mode. Also similar to our findings, the study of Aghbashlo et al.[Citation1] indicated that the increase of inlet dry gas temperature will lead to a decrease in exergy efficiency.
Also, Aghbashlo et al.[Citation1] suggested, for their open-loop drying system, that there is often an optimal drying inlet temperature to maximize the exergy efficiency, but this exergy efficiency maximization may conflict with product quality requirements. However, the quality of the dried product must be considered, that is, for any product, there must be a minimum value of energy input to make the product meet the minimum required moisture content.
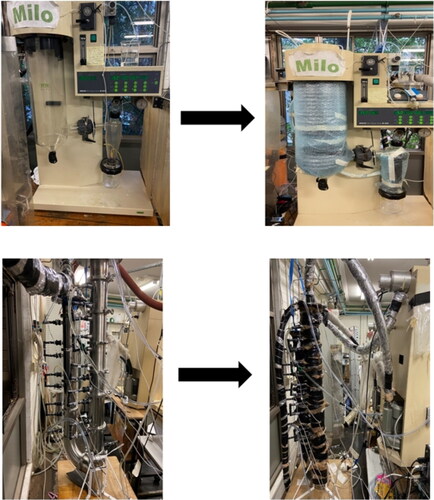
Therefore, this study uses a closed-loop system to overcome this limitation. Because the drying gas is recycled, a significant amount of the energy in the gas is recycled, although there is heat loss from the equipment wall, which is partly recovered through the air reheater and through the coils located around the dryer (). At the same time, all process changes or structural changes are for the sole purpose of making the outlet gas temperature of the spray drying as close as possible to the inlet drying gas temperature. Condensate is also can be recovered in a future study. The discharge of condensate will increase the loss of overall energy in the system. However, a heat pump system will help improve the overall exergy of the system by recovering waste heat from the condensate and transferring it to superheated steam.
Figure 6. Energy recovery device with insulation.
Yoru et al.[Citation31] performed an exergy analysis for a cogeneration system at a ceramic factory, which included six spray dryers, three gas turbines, and two heat exchangers. The use of the cogeneration system improved the exergy efficiency of the drying process. The system could be further changed to a closed-loop drying system. Erby and Hepbasli[Citation32] used a dryer with a heat pump (the main equipment included a condenser, a dryer, an evaporator, and a heat recovery unit). Although this study only explored the exergy analysis of the system over a low-temperature range from 45 to 55 °C, its advanced exergy analysis, which is the discussion of endogenous and exogenous exergy in each drying section, is of great significance.
4.5. System exergy destruction and irreversibility analysis
Exergy destruction in the drying process is mainly a series of thermodynamic challenges involved in the phase change process of removing moisture from the material. The temperature and vapor pressure difference between the drying gas flow and the material involves some thermal and mass-transfer resistance, and a significant amount of thermal energy in the drying gas is lost from the drying chamber. There is some temperature decrease in the drying air due to the drying process.
Irreversibility is the exergy destroyed in a closed system. For our closed-loop spray drying system, there are several main ways that have already been used to reduce the irreversibility of our system. One is the recycling of hot gas flow, which reduces the energy supply required by the system to heat the inlet gas to the set temperature. The other is to reduce the exergy destruction of the system through the installed air reheater and the heat recovery from the drying chamber.
Based on the results above, when the heat losses from the pipes and from the heat exchangers to the environment were set to zero in the simulation (Table A1), the overall exergy efficiency has no significant change, which means most of the exergy destruction happened during the drying step, and the chamber is where the greatest heat loss occurs. Improving the exergy efficiency of the dryer is a high priority for future work. For the exergy analysis of industrial equipment, the small equipment in this study has reference significance. Although the reasonable parameters obtained in the small equipment may need to be changed due to the complexity of industrial equipment, the flexibility of small equipment is an advantage, so this study can serve as the basis for future large-scale research. Regarding the study on closed-loop drying systems and their application of superheated steam here, the following suggestions are given in terms of equipment improving and experimental operation. With larger-scale equipment, the heat losses relative to the energy content tend to be lower than those in laboratory-scale systems due to the larger surface area per unit volume for small systems. Surface area is proportional to length scale squared, while volume is proportional to length scale cubed, so the surface area per unit volume is inversely proportional to length scale.
For the scale-up situation to larger equipment, the following aspects should be considered:
By adjusting the structure and materials of the drying chamber, which is difficult to realize for now with Buchi-290, since the heat transfer resistance of the chamber wall itself is small, and the dryer is already insulated.
Improving the heat exchanger efficiency with the chamber-reheater system by replacing the plastic pipes with pipes having a higher thermal conductivity (copper).
Insulate the cooling water system to maximize the use of the heat created by the water circulating pump (e.g. using a submersible pump).
Add a solar heater to the closed-loop system to use renewable energy input. At the same time, add energy storage systems, such as heat storage tanks to meet drying needs at night or on cloudy days.
Using some waste energy in the system to preheat the liquid feed can be beneficial for energy efficiency. For example, one approach is to utilize the heat from the cooling water stream for this purpose.
Reuse the heat loss from the dryer heater, or by recovering energy through external pipe coils.
Use a CHP (combined heat and power) system, a heat pump, or a vapor recompression system.
For economic analysis: With the use of nitrogen, the open-loop drying system and the closed-loop drying system were studied with an inlet drying gas temperature of 150 °C, setting the same main air flow rate, and the electricity consumed for 1 h of operation was recorded. The power consumption of the open-loop drying system was 1.67 kWh, and the power consumption of the closed-loop drying system was 1.43 kWh (including 0.09 kWh for the condensate pump). It is estimated that using the equipment for 20 h per week on a laboratory scale would save a total of 194 kWh of electricity for the whole year (40 weeks). From the gas reuse aspect, the volume flow rate of air through the spray dryer is 35 m³/h. The rate of nitrogen refilling with our closed-loop system is 1 m³/h. Assuming 20 h of use per week, 40 weeks per year, we save 850 kg of nitrogen per week in this closed-loop system, compared with an open-loop system. 34,000 kg of nitrogen per year means over A$20,000 saved per year.
5. Conclusions
In this closed-loop spray drying system, the drying chamber has the greatest influence on the exergy of the whole system and plays a critical role. In the cooling water flow rate range of 1–4 L/min, the cooling water flow rate has no significant effect on the exergy changes in the system. However, this conclusion is limited by the equipment used in this study. It is important to note that this conclusion may not hold if the water flow rate is significantly outside the studied range, such as two to three times the flow rate tested. Further studies with varying flow rates are necessary to confirm the generalizability of these findings. For larger equipment with higher cooling water flow rates, the situation may be different. With an increase in the drying inlet temperature, the exergy loss for the system increases, and the exergy efficiency of the whole system decreases. With an increase in air flow rate, the exergy loss of the whole system decreases, and the exergy efficiency of the whole system improves. Significant savings in inert gas and energy consumption are possible with closed-loop spray-drying systems.
Author contributions
Zexin Lei: Conceptualization; Methodology; Formal analysis; Writing- original draft; Data curation; Timothy Langrish: Conceptualization; Funding acquisition; Project administration; Writing—review and editing, Supervision; Resources.
Disclosure statement
The authors report no conflicts of interest. The authors alone are responsible for the content and writing of the paper.
Additional information
Funding
Notes on contributors
Zexin Lei
Zexin Lei specializes in algae vitamin production via spray drying and its exergy analysis. He develops β-carotene tablets using coconut husk powder and chitosan, focuses on energy recovery by exploring closed-loop spray drying systems and MATLAB simulation, and is also interested in producing MOFs by using closed-loop spray drying systems.
Timothy Langrish
Professor Timothy Langrish is a leading expert in spray drying and timber drying. His work with Professor Fletcher has uncovered new flow instabilities in spray dryers. Using advanced computational modeling, their work significantly improves practical outcomes by reducing particle deposition on dryer walls and addressing key industrial process engineering issues.
References
- Aghbashlo, M.; Mobli, H.; Rafiee, S.; Madadlou, A. Energy and Exergy Analyses of the Spray Drying Process of Fish Oil Microencapsulation. Biosyst. Eng. 2012, 111, 229–241. DOI: 10.1016/j.biosystemseng.2011.12.001.
- Johnson, P. W.; Langrish, T. A. G. Exergy Analysis of a Spray Dryer: Methods and Interpretations. Drying Technol. 2018, 36, 578–596. DOI: 10.1080/07373937.2017.1349790.
- Johnson, P. W. Energy and Exergy Analysis in Spray Drying Systems. 2019. https://hdl.handle.net/2123/22124 (accessed Mar 23, 2024).
- Guo, S.; Xiao, Y.; Tian, W.; Zhang, Z. Energy and Exergy Analysis of a Novel Efficient Combined Process by Hydrothermal Degradation and Superheated Steam Drying of Degradable Organic Wastes. J. Therm. Sci. 2006, 15, 274–280. DOI: 10.1007/s11630-006-0274-5.
- Hoffmann. Energy Transition Barometer. https://scholar.google.com/scholar_lookup?title=Energy%20transition%20barometer%3A%202018&publication_year=2018&author=C.%20Hoffmann (accessed Apr 30, 2024).
- Yi, J.; Li, X.; He, J.; Duan, X. D. Drying Efficiency and Product Quality of Biomass Drying: A Review. Drying Technol. 2020, 38, 2039–2054. DOI: 10.1080/07373937.2019.1628772.
- Dincer, I.; Rosen, M. A. Exergy as a Driver for Achieving Sustainability. J. Green Energy 2004, 1, 1–19. DOI: 10.1081/GE-120027881.
- Amjad, W.; Hensel, O.; Munir, A.; Esper, A.; Sturm, B. Thermodynamic Analysis of Drying Process in a Diagonal-Batch Dryer Developed for Batch Uniformity Using Potato Slices. J. Food Eng. 2016, 169, 238–249. DOI: 10.1016/j.jfoodeng.2015.09.004.
- Hammond, G. P.; Stapleton, A. J. Exergy Analysis of the United Kingdom Energy System. Proc. Inst. Mech. Eng. Part A J. Power Energy 2001, 215, 141–162. DOI: 10.1243/0957650011538424.
- Van Gool, W. Energy Policy: Fairy Tales and Factualities. Innovation and Technology—Strategies and Policies. Springer: Dordrecht, Netherlands; 1997, 93–105. DOI: 10.1007/978-0-585-29606-7_6.
- Chowdhury, T.; Chowdhury, H.; Chowdhury, P.; Sait, S. M.; Paul, A.; Uddin Ahamed, J.; Saidur, R. A Case Study to Application of Exergy-Based Indicators to Address the Sustainability of Bangladesh Residential Sector. Sustain. Energy Technol. Assess. 2020, 37, 100615. DOI: 10.1016/j.seta.2019.100615.
- Erbay, Z.; Hepbasli, A. Application of Conventional and Advanced Exergy Analyses to Evaluate the Performance of a Ground-Source Heat Pump (GSHP) Dryer Used in Food Drying. Energy Convers. Manage. 2014, 78, 499–507. DOI: 10.1016/j.enconman.2013.11.009.
- Sarker, M. S. H.; Ibrahim, M. N.; Abdul Aziz, N.; Punan, M. S. Energy and Exergy Analysis of Industrial Fluidized Bed Drying of Paddy. Energy 2015, 84, 131–138. DOI: 10.1016/j.energy.2015.02.064.
- Surendhar, A.; Sivasubramanian, V.; Vidhyeswari, D.; Deepanraj, B. Energy and Exergy Analysis, Drying Kinetics, Modeling and Quality Parameters of Microwave-Dried Turmeric Slices. J. Therm. Anal. Calorim. 2019, 136, 185–197. DOI: 10.1007/S10973-018-7791-9/METRICS.
- Aziz, M.; Oda, T.; Kashiwagi, T. Energy-Efficient Low Rank Coal Drying Based on Enhanced Vapor Recompression Technology. Drying Technol. 2014, 32, 1621–1631. DOI: 10.1080/07373937.2014.915219.
- Zohrabi, S.; Aghbashlo, M.; Seiiedlou, S. S.; Scaar, H.; Mellmann, J. Energy Saving in a Convective Dryer by Using Novel Real-Time Exergy-Based Control Schemes Adjusting Exhaust Air Recirculation. J. Clean. Prod. 2020, 257, 120394. DOI: 10.1016/j.jclepro.2020.120394.
- Sheikhshoaei, H.; Dowlati, M.; Aghbashlo, M.; Rosen, M. A. Exergy Analysis of a Pistachio Roasting System. Drying Technol. 2020, 38, 1565–1583. DOI: 10.1080/07373937.2019.1649276.
- Erbay, Z.; Hepbasli, A. Assessment of Cost Sources and Improvement Potentials of a Ground-Source Heat Pump Food Drying System through Advanced Exergoeconomic Analysis Method. Energy 2017, 127, 502–515. DOI: 10.1016/j.energy.2017.03.148.
- Fyhr, C.; Rasmuson, A. Some Aspects of the Modelling of Wood Chips Drying in Superheated Steam. Int. J. Heat Mass Transf. 1997, 40, 2825–2842. DOI: 10.1016/S0017-9310(96)00340-7.
- Pang, S.; Pearson, H. Experimental Investigation and Practical Application of Superheated Steam Drying Technology of Softwood Timber. Drying Technol. 2004, 22, 2079–2094. DOI: 10.1081/DRT-200034252.
- Hosseinabadi, H. Z.; Layeghi, M.; Berthold, D.; Doosthosseini, K.; Shahhosseini, S. Mathematical Modeling the Drying of Poplar Wood Particles in a Closed-Loop Triple Pass Rotary Dryer. Drying Technol. 2014, 32, 55–67. DOI: 10.1080/07373937.2013.811250.
- Vázquez-León, L. A.; Olguín-Rojas, J. A.; Páramo-Calderón, D. E.; Barbero, G. F.; Salgado-Cervantes, M. A.; Palma, M.; García-Alvarado, M. A.; Rodríguez-Jimenes, G. C. Closed-Loop Spray Drying with N2 of Moringa Oleifera Leaf Ethanolic Extracts: Effects on Bioactive Compounds and Antiradical Activity. Drying Technol. 2021, 39, 2092–2104. DOI: 10.1080/07373937.2020.1753764.
- Moejes, S.; Visser, Q.; Bitter, J. H.; Van Boxtel, A. J. B. Closed-Loop Spray Drying Solutions for Energy Efficient Powder Production. Innov. Food Sci. Emerg. Technol. 2018, 47, 24–37. DOI: 10.1016/j.ifset.2018.01.005.
- Poozesh, S.; Cousin, C. A. Integrating a Dynamic Multiscale Drying Model into a Closed Loop Control Strategy for Laboratory Spray Dryer. Drying Technol. 2022, 40, 2308–2320. DOI: 10.1080/07373937.2021.1934692.
- Poozesh, S.; Karam, M.; Akafuah, N.; Wang, Y. Integrating a Model Predictive Control into a Spray Dryer Simulator for a Closed-Loop Control Strategy. Int. J. Heat Mass Transf. 2021, 170, 121010. DOI: 10.1016/j.ijheatmasstransfer.2021.121010.
- Woo, M. W.; Daud, W. R. W.; Tasirin, S. M.; Talib, M. Z. M. Effect of Wall Surface Properties at Different Drying Kinetics on the Deposition Problem in Spray Drying. Drying Technol. 2008, 26, 15–26. DOI: 10.1080/07373930701781033.
- Arnoux, L.; Orange, P.; Scott, K.; Langrish, T.; Keey, R. Multiple-Effect Superheated-Steam Drying of Woody Biomass Fuels for Pulverised-Fuel Combustion. Presented at the Proceedings of the 9th International Drying Symposium, Gold Coast, Australia, 1–4 August 1994, A, 157–164. https://www.cabidigitallibrary.org/doi/full/10.5555/19942402071.
- Razaghiyan, M.; Rahimi, M. R.; Karimi, H. Energy and Exergy Analysis of Oil-Field Produced Water Treatment Process by Using a Closed-Loop Spray Dryer. Desalination Water Treat. 2020, 195, 96–107. DOI: 10.5004/dwt.2020.25708.
- Coskun, C.; Bayraktar, M.; Oktay, Z.; Dincer, I. Energy and Exergy Analyses of an Industrial Wood Chips Drying Process. Int. J. Low-Carbon Technol. 2009, 4, 224–229. DOI: 10.1093/ijlct/ctp024.
- Ghasemkhani, H.; Keyhani, A.; Aghbashlo, M.; Rafiee, S.; Mujumdar, A. S. Improving Exergetic Performance Parameters of a Rotating-Tray Air Dryer via a Simple Heat Exchanger. Appl. Therm. Eng. 2016, 94, 13–23. DOI: 10.1016/j.applthermaleng.2015.10.114.
- Yoru, Y.; Karakoc, T. H.; Hepbasli, A. Dynamic Energy and Exergy Analyses of an Industrial Cogeneration System. Int. J. Energy Res. 2010, 34, 345–356. DOI: 10.1002/er.1561.
- Erbay, Z.; Hepbasli, A. Advanced Exergy Analysis of a Heat Pump Drying System Used in Food Drying. Drying Technol. 2013, 31, 802–810. DOI: 10.1080/07373937.2012.763044.
- Hewitt, G. F.; Shires, G. L.; Bott, T. R. Process Heat Transfer. Begell House (US), 1994. DOI: 10.1615/978-1-56700-149-5.0.
- Wang, S.; Langrish, T. A. G. A Distributed Parameter Model for Particles in the Spray Drying Process. Adv. Powder Technol. 2009, 20, 220–226. DOI: 10.1016/j.apt.2009.03.004.
- Manjhi, S. K.; Kumar, R. Comparative Performance of K, E, and J-Type Fast Response Coaxial Probes for Short-Period Transient Measurements. J. Therm. Sci. Eng. Appl. 2021, 13, 031029. DOI: 10.1115/1.4048664.
- Thermocouple Accuracy and Adherence to Critical Standards. | 2021-08-18 | Industrial Heating. https://www.industrialheating.com/articles/96536-thermocouple-accuracy-and-adherence-to-critical-standards (accessed Sept 10, 2023).
- Whalley, P. B. B. Condensation, and Gas-Liquid Flow; Oxford University Press: Oxford, England, 1987.
Appendix A
also compares the simulated temperature changes with and without heat loss. There is no obvious change in the exergy data of different parts in the system. As the heat loss other than the chamber is not considered, the overall exergy efficiency of the system is predicted to increase by about 2%. The exergy loss rate from the chamber is approximately 13–20%. This means that the overall exergy of the system is mainly affected by the chamber.
Table A1. Experimental results for each part of the closed-loop drying system with different inlet air temperatures.
Table A2. Trends in the experimental (expt) and simulated (sim) data for the energy and exergy inputs to the closed loop with changing air flow rate and inlet drying temperature, first set of experiments (spraying rate of water to the dryer, 2.5 mL/min; cooling water flow rate, 2 L/min; ambient air temperature, 23 °C).
Table A3. Simulation results for each part of the closed-loop spray drying system with different inlet air temperatures (numbers in brackets denote simulations assuming that there is no heat loss).
Details of the mathematical modeling for the unit operations and pipes in the closed-loop spray drying system
Heat losses from pipes between unit operations
Focusing on the experimental data, the temperature decreases along the pipes may be assessed relative to the ambient temperature. These heat losses include the following fluids, through the following pipes (with the symbols explained below):
Air, from the dryer outlet to the condenser inlet (UAp1).
Air, from the reheater outlet to the dryer inlet (before the electrical air heater) (UAp2).
Water, from the condenser outlet to the outside of the dryer (UAp3).
Water, from the outside of the dryer to the reheater inlet (UAp4).
Water, from the reheater outlet, through the bucket, to the condenser inlet (UAp5).
Each of these five situations may be characterized by a product of the heat-loss coefficient and the outside surface area of each pipe, UA (W K−1), and all these fluids and pipes have been analyzed in the same way, as follows.
Analysis of heat losses from pipes
Heat losses to the ambient environment inevitability occur, with the gas temperature in a pipe decreasing from Tgi to Tgo (°C) when exposed to the ambient temperature (Tamb, °C). For each paper, the pipe may be related as a heat exchanger, with an effectiveness (ε) given by the equation:
(A1)
(A1)
The effectiveness depends on the number of transfer units, given by the equation:
(A2)
(A2)
Here and Cp are the mass flow rate and the specific heat capacity of the fluid (air or water) flowing through the pipe, U (W m−2 K−1) and A (m2) are the heat-loss coefficient and the outside surface area of each pipe, respectively. For this situation, where the ambient air temperature is relatively uniform outside the equipment, the relationship between the effectiveness and the number of transfer units is given by the equation [Citation33]:
(A3)
(A3)
Hence, a very large surface area for the pipe or heat-loss coefficient gives a large number of transfer units and an effectiveness close to unity, so that the outlet air temperature (Tgo) approaches the ambient air temperature (Tamb).
The procedure for the data analysis is as follows:
Use EquationEquation (A1)
(A1)
Invert EquationEquation (A3)
Rearrange EquationEquation (A2)
As a sample calculation, consider the following case in the experiment “Run 200 - Run 1”:
The air flow pipe from the dryer outlet to the condenser inlet, Tout1 (75.2 °C) to Tout3 (71.6 °C), ambient air temperature 23 °C,
(A4)
(A4)
Step1: Effectiveness,
(A5)
(A5)
Step 2:
(A6)
(A6)
Step 3:
(A7)
(A7)
The product of the heat-transfer coefficient and the surface area for this pipe in this experiment is 0.72 W K−1.
Air, from the dryer outlet to the condenser inlet: reviewing the data from all the experiments, the average UA product for this pipe is (UAp1) 0.40 W K−1, with a standard deviation of 0.22 W K−1.
Considering all the experiments, the average UA products for the other pipes are as follows:
Air, from the reheater outlet to the dryer inlet (before the electrical air heater): (UAp2) 0.58 W K−1.
Water, from the condenser outlet to the outside of the dryer: (UAp3)13 W K−1.
Water, from the outside of the dryer to the reheater inlet: (UAp4) 11 W K−1.
Water, the reheater outlet, through the bucket, to the condenser inlet: (UAp5) 67 W K−1.
Heat losses in pipes: water flows
Dryer to condenser, Tw5 and Tw1. The effectiveness (ε) is given by the equation:
(A8)
(A8)
The number of transfer units is given by the equation:
(A9)
(A9)
Rearranging these equations gives:
(A10)
(A10)
Condenser to reheater, Tw6 and Tw4. The effectiveness (ε) is given by the equation:
(A11)
(A11)
The number of transfer units is given by the equation:
(A12)
(A12)
Rearranging these equations gives:
(A13)
(A13)
(A14)
(A14)
(A15)
(A15)
Reheater to dryer, Tw3 and Tw7. The effectiveness (ε) is given by the equation:
(A16)
(A16)
The number of transfer units is given by the equation:
(A17)
(A17)
Rearranging these equations gives:
(A18)
(A18)
(A19)
(A19)
(A20)
(A20)
Heat losses in pipes: air flows
Dryer to the condenser, Tout2 and Tout3. The effectiveness (ε) is given by the equation:
(A21)
(A21)
The number of transfer units is given by the equation:
(A22)
(A22)
Rearranging these equations gives:
(A23)
(A23)
(A24)
(A24)
Reheater to dryer, Tout5 and Tout6. The effectiveness (ε) is given by the equation:
(A25)
(A25)
The number of transfer units is given by the equation:
(A26)
(A26)
Rearranging these equations gives:
(A27)
(A27)
(A28)
(A28)
Spray dryer modeling
The spray dryer model has followed the finer-scale parallel flow/plug flow approach described in Langrish.[Citation34] This steady-state model divides the spray dryer into a series of control volumes, as with the condenser model, performs mass and energy balances over each control volume, and does heat and mass-transfer calculations between the gas and the particles (and heat loss calculations from the dryer). The drying kinetics for the particles follow a Characteristic Drying Curve approach.
Heat loss from dryer and energy recovery to water cooling coils
One critical equation in the model needs to be modified for the heat loss since this term is different with the cooling coils wrapped around the cyclone and dryer. The original equation shows the variation (with respect to distance) of the humid enthalpy, giving the driving force as the difference between the gas temperature inside the dryer and the ambient air temperature:
(A29)
(A29)
Where,
Hh = enthalpy of humid air (J.kg−1)
UA = heat transfer coefficient, spray dryer surface area lumped parameter, W.m−2K−1
L = length of Buchi B-290 spray drying chamber = 0.48 m
h = distance along the dryer (m)
Cp = specific heat (J.kg−1.K−1), s = solids, w = water
Ta = local value of the air temperature (°C)
Tair = local value of the ambient temperature (°C)
Tp = local value of the particle temperature (°C)
The heat-loss term in this equation (U A (Ta – Tamb)/L) needs to be modified to distinguish between the heat loss to the ambient air and the heat recovered by the cooling water. The modified term must be consistent in terms of the energy recovered by the water on the water side. This situation means that another variable needs to be added to the dryer simulation, the water temperature in the cooling coils.
There is a cooling coil around most of the dryer. Water in the cooling coils picks up heat from the drying chamber, and at the same time water in the cooling coils interacts (heat transfer) with the ambient air.
(A30)
(A30)
Where UAdw is the product of the outside surface area of the dryer and the overall heat-transfer coefficient between the drying chamber and the water in the cooling coils, and the local value of the cooling water temperature in the coils is given by the following equation:
(A31)
(A31)
Here UAwa is the product of the outside surface area of the dryer and the overall heat-transfer coefficient between the water in the cooling coils and the ambient air, is the mass flow rate of cooling water, and Cpw is the specific heat capacity of the cooling water.
Experimental data fitting: heat loss parameters from the dryer
The dryer may be viewed as a countercurrent heat and mass exchanger, where the temperatures of the gas flow through the dryer, from the hot gas inlet to the cooler gas outlet, and the cooling water flowing through coils around the outside, countercurrently to the gas, are known at each end of the dryer. The simulation just described has been started at the gas inlet end of the dryer, where the air temperature, humidity, and flow rate, and the atomized solution, with its temperature, concentration, and flow rate, are all known experimentally. This gas inlet end is also the cooling water outlet end, where the outlet temperature and flow rate are also known experimentally.
The ordinary differential equations describing the heat, mass, and momentum transfers between the gas and the liquid droplets (then solid particles) have been integrated along the length of the dryer. This integration has occurred from the gas inlet (water outlet) (where the gas inlet and water outlet temperatures are both known experimentally) to the gas outlet (water inlet) end of the dryer. The predicted gas outlet (Tgoutpredicted) and water inlet temperatures (Twinpredicted) have then been compared with the experimentally measured values of these parameters (Tgoutexperimental and Twinexperimental) for all 58 data sets corresponding to the (n =) 58 experiments using a sum of squares for the differences between predicted and experimental values, as follows:
(A32)
(A32)
This Mean Square Error (MSE) has been minimized by adjusting the heat loss parameters UAdw and UAwa, to obtain best fits for these parameter values.
The results were that UAdw and UAwa were fitted to be 21 W K−1 and 1.7 W K−1, respectively, giving a Mean Square Error (MSE) of 11K, or about 7.5K for each of the two temperatures (gas and liquid), where (7.5K)2 + (7.5K)2 = 112.5K2 ∼ (11K)2. This MSE seems to be acceptable, given the use of type J thermocouples, which are suggested by Manjhi and Kumar[Citation35] to have an accuracy of ±2.2K. The two heat-transfer coefficients in units of W K−1 can also be assessed as having units of W m−2 K−1, since the outside surface area of the dryer is around 1 m2. An overall (external) heat-transfer coefficient from the water cooling coils, outside the dryer, to the ambient air (UAwa) of 1.7 W m−2 K−1 is consistent with common values for natural convection of 1–20 W m−2 K−1, since the mode of heat transfer outside the tubes is natural convection in air, although the flow inside the water coiling coils is forced convection. The overall heat-transfer coefficient from the inside of the dryer to the water cooling coils (UAdw) of 21 W m−2 K−1 is also suggested to be reasonable, since it is forced convection heat transfer from the air flowing through the dryer (at about 0.6 m s−1) to water flowing inside a plastic tube, through the glass walls of the dryer and the plastic walls of the tubes. The forced convection in both the air and the water means that this coefficient (UAdw) should be larger than that for the heat transfer outside the dryer (UAwa).
Condenser and reheater analysis
Both the condenser and reheater here are shell-and-tube heat exchangers, with the gas traveling through the tubes and water traveling around the tubes, through the shell, and heat and mass transfer can occur in both devices. For example, humid gas may enter a condenser, at a flow rate of kg s−1, a temperature of Tgi °C, and absolute gas humidity of Ygi kg kg−1, through nt tubes of diameter D m and length L m. Water flows countercurrently to the gas at a flow rate
kg s−1 through a shell around the tubes. The inlet water temperature is Twi °C.
The purpose of the performance analysis[Citation33] is to determine the outlet temperature of the gas, the outlet humidity of the gas, the amount of water condensed, and the outlet temperature of the water. The assumptions and adjustable parameters in this performance analysis calculation are the heat-transfer coefficient from the gas to the condenser tube surface. This parameter may be considered to be an uncertain and adjustable parameter because the precise nature of the air-tube contact and the air flow patterns are not exactly known.
The basic approach is to set up control volumes in the axial direction from the gas inlet to the gas outlet, representing a one-dimensional model, as shown in . There are “nd” control volumes.
Figure A1. Schematic diagram of the condenser model set-up.
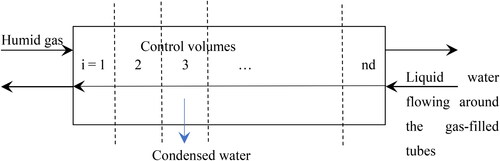
For each control volume, the following approach has been used.
Step 1: length increment
Assume an incremental length of coil in the control volume (dL), a subdivision of the total length. At the start of the heat exchanger, we know the local values for the temperatures of the warm gas (Tgi) the water in the cooling coil (Twi), and the humidity of the gas (Ygi).
Step 2: driving forces for heat and mass transfer
The driving force for heat transfer (ΔT) is the difference in temperature between the warm gas (Tgi) and the water in the cooling coil (Tw), or ΔT = Tgi - Tw.
The driving force for mass transfer is the difference in humidity between the bulk gas (Ygi) and the saturation humidity above the cooling coil (Ysati) at the water temperature (Twi), which is given by the following calculation:
The Antoine equation for the saturated vapor pressure of water is given by:
(A33)
(A33)
where A = 133.3 Pa, B = 18.3036, C = 3816.44K and D = 229.02K. The temperature of the water at this location (z) in the cooling coil is Twi (°C) and the saturation vapor pressure of water just outside the coil is pvsati (Pa). The corresponding saturation humidity is given by the equation:
(A34)
(A34)
Here patm is atmospheric pressure. Hence the driving force for mass transfer (ΔC) is ΔC = (Ygi − Ysati) × ρg, where ρg is the density of the gas (kg m−3).
Step 3: heat and mass transfer coefficients
It is necessary to have an estimate of the heat-transfer coefficient (h) from the gas to the condenser tube surface.
We can estimate a corresponding mass-transfer coefficient from the Chilton-Colburn analogy between heat and mass transfer (mentioned in most textbooks on heat and mass transfer):
(A35)
(A35)
Here Pr and Sc are the Prandtl and Schmidt numbers, respectively, for the gas and for water vapor in the gas, which are about 0.69 and 0.66 for the air-water system, which are almost the same value, so:
(A36)
(A36)
This EquationEquation (4)(4)
(4) enables the mass-transfer coefficient (k) to be obtained from the heat-transfer coefficient (h).
Step 4: surface area
The surface area (A) for both heat and mass transfer, per meter of tube length, is πD, where D is the tube’s outer diameter.
Step 5: heat and mass transfer rates
The heat and mass transfer rates (Q, W, and NA, kg s−1, respectively) are given by the following equations:
(A37)
(A37)
(A38)
(A38)
Step 6: cooling of the gas (heat balance)
If the (overall) heat transfer rate is Q, the heat-transfer rate due to condensation is equal to the latent heat of condensation/vaporization (ΔHvw) multiplied by the condensation rate of NA, or Qcond = ΔHvw × NA. The remaining heat transfer (Q – Qcond = Qcool) is used to cool the gas, so the outlet gas temperature from this section (Tgo) is given by the following equation:
(A39)
(A39)
where the mass flow rate of the gas (air) (
) is 0.01 kg s−1, and the specific heat capacity of air is Cpg.
Step 7: outlet gas humidity (mass balance)
Likewise, the humidity of the gas at the outlet of this section (Ygo) is given by the following equation.
(A40)
(A40)
These values of the outlet gas temperature (Tgo) and the outlet humidity (Ygo) are inputs for the next section (Tgi = Tgo and Ygi = Ygo).
Step 8: outlet water temperature (heat balance)
If there was no heat loss from the condenser, a heat balance would mean that the heat lost from the air would simply be gained by the water. With the water flow rate being ( kg s−1), the outlet water temperature (Two) would be given by the equation:
(A41)
(A41)
where the specific heat capacity of water is Cpw. This value of the outlet water temperature is an input for the next section (Twi = Two).
Heat loss from the outside of the condenser or reheater also needs to be included. The water-cooled side is outside the air, which travels through the inner (inside) tubes, so heat flows from the air to the water, and the water interacts with the ambient air for heat transfer.
(A42)
(A42)
Here, Uoutside is the heat-transfer coefficient for natural convection heat loss from the outside of the condenser or reheater to the ambient air. The outside of the condenser or reheater is assumed to be at the local water temperature:
(A43)
(A43)
Experimental data fitting: heat transfer parameters for the condenser and reheater
The condenser and reheater may also (like the dryer) be viewed as countercurrent heat and mass exchangers, where the temperatures of the gas flow through both the condenser and the reheater, from the hot gas inlet to the cooler gas outlet, and the cooling water flowing countercurrently to the gas, are known at each end of both the condenser and the reheater. The simulation just described has been started at the gas inlet end of both the condenser and the reheater, where the air temperature, humidity, and flow rate are all known experimentally. This gas inlet end is also the cooling water outlet end, where the outlet temperature and flow rate are also known experimentally. These heat exchangers do not have the added complication of potentially complex droplet drying kinetics inside the dryer, but two-phase heat transfer occurs on the walls of the condenser, and the two-phase heat-transfer coefficients may vary with condensation flux, gas humidity, and gas flow rate,[Citation36] so they may not be completely constant. It might be expected that the Mean Square Error might be higher for the condenser heat-transfer coefficients than for those connected with the dryer since the dryer heat-transfer coefficients are those for natural convection heat loss, where the operating conditions of the equipment might be expected to have less effect on changing the heat-loss heat-transfer coefficients for the dryer.
There are two key parameter values for both the condenser and the reheater:
h, the heat-transfer coefficient from the gas to the condenser or reheater tube surface (W m−2 K−1), EquationEquations (A35)(A35)
(A35) to Equation(A37)
(A37)
(A37) .
Uoutside is the heat-transfer coefficient for heat loss from the outside of the condenser or reheater to the ambient air (W m−2 K−1), EquationEquation (A42)(A42)
(A42) .
These are the remaining fitted parameters for the closed-loop spray drying system, after the heat-transfer coefficients for the dryer to the cooling water, the cooling water to the ambient environment, and the heat-loss coefficients for the pipes. Given that the overall aim of the simulation is to predict the heat recovery from the combination of the reheater and the condenser, these parameters (h, the heat-transfer coefficient from the gas to the condenser or reheater tube surface, and Uoutside is the heat-transfer coefficient for heat loss from the outside of the condenser or reheater to the ambient air) have been adjusted by a least-squares fitting procedure to minimize the sum of squares of error between the predicted and observed return temperatures from the reheater to the air heater at the inlet of the spray dryer (Tout6 in Figure A2), as shown in EquationEquation (A44)(A44)
(A44) for all 58 data sets corresponding to the (n =) 58 experiments:
(A44)
(A44)
The mean square difference (MS) has been calculated from the following equation, with n = 58:
(A45)
(A45)
Figure A2. Schematic diagram showing key variables for energy and exergy analysis of closed-loop spray drying system.
The heat-transfer coefficient for two-phase heat transfer, h, between the condensing gas and the wall, is likely to vary from the inlet to the outlet of the condenser or reheater, as is usual for two-phase condensation heat-transfer processes,[Citation37] particularly when condensing a vapor (here, water vapor) from an incondensable gas (here, air). As noted in Whalley,[Citation37] the “heat transfer coefficient, h, falls rapidly as the quality (mass fraction of vapor in the gas) falls…. the first part of the condensation can be performed without difficulty (with a high heat-transfer coefficient), but it is very difficult to condense a large fraction of the steam (vapor).” The variation in the heat-transfer coefficient can vary by over an order of magnitude, meaning that the use of a single constant coefficient, as done here, is a first approximation. The approximation could be relaxed, giving a better fit, by allowing the coefficient to vary through the condenser or reheater. However, this relaxation would introduce additional complexity into the overall model, which may not be fully justified by the aim of the overall model, which is to predict the temperatures in the whole system, not just the condenser.
Air heater modeling
This is an electrical heater, and the energy input (Q, W) is simply related to the operating variables for the heat exchanger by the equation:
(A46)
(A46)
Here the variables are the mass flow rate of air (G, kg s−1), the specific heat capacity for the air (Cpg, J kg−1 K−1) and the inlet and outlet gas temperatures (Tgi and Tgo, respectively, °C).