
Abstract
Ebola viral disease (EVD) is a highly infectious and potentially fatal illness with a case fatality rate ranging from 25% to 90%. To effectively control its spread, there is a need for rapid, reliable and lowcost point-of-care (P OC) diagnostic tests. While various EVD diagnostic tests exist, few are P OC tests, and many are not cost-effective. The use of antibodies in these tests has limitations, prompting the exploration of aptamers as potential alternatives. Various proteins from the Ebola virus (EBOV) proteome, including EBOV nucleoprotein (NP), are considered viable targets for diagnostic assays. A previous study identified three aptamers (Apt1. Apt2 and Apt3) with high affinity for EBOV NP using systemic evolution of ligands by exponential enrichment (SELEX). This study aimed to employ in silico methods, such as Phyre2, RNAfold, RNAComposer, HADDOCK and GROMACS, to model the structures of EBOV NP and the aptamers, and to investigate their binding. The in silico analysis revealed successful binding of all the three aptamers to EBOV NP, with a suggested ranking of Apt1 > Apt2 > Apt3 based on binding affinity. Microscale thermophoresis (MST) analysis confirmed the binding, providing dissociation constants of 25 ± 2.84, 56 ± 2.76 and 140 ±3.69 nM for Apt1, Apt2 and Apt3, respectively. The study shows that the findings of the in silico analysis was in agreement with the MST analysis. Inclusion of these in silico approaches in diagnostic assay development can expedite the selection of candidate aptamers, potentially overcoming challenges associated with aptamer application in diagnostics.
Communicated by Ramaswamy H. Sarma
1. Introduction
Ebola virus (EBOV), which causes EBOV disease (EVD) and is characterized by hemorrhagic fever, is one of the deadliest viruses in the world. It is a fatal and highly infectious, with a case mortality rate that can be up to 90% (WHO Ebola Outbreak, Citation2021). Between 1976 and 2013, the World Health Organization (WHO) reported a total of 24 outbreaks involving 1,716 cases (WHO Ebola Outbreak, Citation2021). However, the 2014–2016 outbreak in West Africa (WA) was the largest and most complex Ebola outbreak. It is speculated that the virus originated from wild animals and was transmitted to humans through a zoonotic transmission event. It can spread through direct contact with body fluids (blood, urine, saliva, sweat, feces, vomit, breast milk and semen) and objects (such as needles and syringes) that are contaminated with EBOV. It enters the body through broken skin or mucous membranes in the eyes, nose, or mouth (Bloom & Cadarette, Citation2019; Judson et al., Citation2015). The virus can remain in some bodily fluids (such as semen) of a patient after recovery from EVD. Once an individual is infected, the symptoms take 2–21 days to manifest leading to the death of the infected person. The first symptoms appear between the seventh and ninth day after infection. This is characterized by severe headache, constant fatigue, fever and muscle soreness. On the 10th day, the patient experiences a sudden high fever, vomiting blood, diarrhea and on the 11th day, they may experience brain damage, bleeding from the nose, mouth and eyes. The final stages of EVD includes loss of consciousness, seizures, massive internal bleeding and finally death (CDC Transmission | Ebola Hemorrhagic Fever | CDC, Citation2022). The interruption of the chain of viral transmission through the early identification of infected persons and rapid initiation of treatment can assist in containing outbreaks of EVD (Goudarzi et al., Citation2015). Real-time polymerase chain reaction (RT-PCR) tests such as the Real Star® Filovirus Screen RT-PCR Kit, LiferiverTM EBOV RT-PCT Kit and the Cepheid GeneXpert have been the standard molecular diagnostic tool used to diagnose EVD (Semper et al., Citation2016; Van Vuren et al., Citation2015; WHO Ebola Virus Disease, Citation2022). However, RT-PCR must be conducted in a laboratory, which means this test cannot be used at the point of care (POC) as the test samples must first be transported to a laboratory. In our previous review, we stated how the RT-PCR test takes about 2–6 h, requires trained personnel, is expensive (about US$ 100) and requires a sizeable blood sample volume (Martin et al., Citation2021; WHO Laboratory Diagnosis of Ebola Virus Disease, Citation2022). Immunoassays such as enzyme-linked immunosorbent assays (ELISAs) and lateral flow assays (LFAs) are alternative diagnostic tools that can be used for the detection of EBOV and can potentially also be applied at the POC. ELISAs have been developed to detect EBOV viral proteins, such as glycoprotein (GP), nucleoprotein (NP), RNA-dependent RNA polymerase (RdRp) and viral matrix proteins (VP40, VP35, VP30 and VP24) (Cision Ebola Detection Using Rapid Tests & ELISA Kits for Humans & Animals, 2022; Ksiazek et al., Citation1999; SinoBiological ELISA for Ebola Virus Disease (EVD), Citation2022). LFAs which are also suitable for use at the POC, have been used in the 2014–2016 outbreak as a crucial tool for rapid antigen detection (Broadhurst et al., Citation2016; Reusken et al., Citation2015). Currently only 3 EBOV rapid LFA tests, including the OraQuick® EBOV Rapid Antigen Test from OraSure Technologies, the SD Q Line EBOV Zaire Antigen test from SD Biosensor and the DPP® Ebola Antigen System from Chembio Diagnostics are commercially available (Moran et al., Citation2020). A 4th test, the Corgenix ReEBOV Antigen Rapid Test Kit has been taken off the market when sufficient performance data could not be replicated by a new manufacturer (Moran et al., Citation2020). All these tests are immunochromatographic assays designed to detect EBOV proteins in whole blood, plasma or serum samples. The EBOV proteins that have been targeted the most for diagnosis include the VP40 (OraQuick® EBOV Rapid Antigen Test and DPP® Ebola Antigen System) while GP (SD Q Line EBOV Zaire Antigen test) (Moran et al., Citation2020). Another diagnostic kit reported by Makiala et al. (Citation2019) to detect EBOV (QuickNaviTM-Ebola test kit). The QuickNaviTM-Ebola test kit also uses monoclonal antibodies to detect EBOV NP (Makiala et al., Citation2019).
EBOV NP is an ideal biomarker protein for EBOV diagnosis as it is abundant in EBOV particles and conserved in EBOV species (Changula et al., Citation2013; Niikura et al., Citation2001). The average EBOV particle is approximately 12,000 nm long containing more than 3,200 EBOV NP molecules. In addition, the EBOV NP is highly antigenic, which can be attributed to highly conserved specific antigenic amino acid residues (Changula et al., Citation2013). These regions span from amino acid residue 421–440 and 601–620 (Changula et al., Citation2013; Noda et al., Citation2010). These regions are shared among multiple EBOV species, such as the Zaire, Sudan, Tai Forest, Bundibugyo and Reston Ebola viruses (Changula et al., Citation2013). EBOV NP wraps around the RNA of the virus creating a helical complex. This complex is important for viral RNA transcription and replication (Kiley et al., Citation1980). EBOV NP is an 83.3 kDa sialylated O-glycosylated structural protein (Y. Huang et al., Citation2002). It is made up of unique regions, including ten linear B-cell epitopes, ten antigenic sites and five surface accessible epitopes, speculated to be conserved in all the EBOV species (Ahmad et al., Citation2019; Changula et al., Citation2013). The GEQYQQLR amino acid sequences have been reported to have antigenic and immunogenic properties (Ali & Islam, Citation2015). Due to all these characteristics, EBOV NP is a sensible target for the diagnosis of EBOV. However, this protein may also be a target for the development of treatments. All of the current diagnostic systems for the detection of EBOV NP are based on the use of EBOV NP-specific antibodies. It has been proposed that aptamers, which are short, single-stranded DNA or RNA molecules that can selectively bind to a specific target, can replace antibodies in diagnostic systems such as ELISA’s and LFAs. Several companies have commercialized aptamer-based diagnostic systems for a number of diseases. Some of these aptamer-based technologies have been reviewed by Kaur et al. (Citation2018) and includes the Ota-Sense, AflaSense, AptoCyto, AptoPrep, SOMAscan, CibusDx, OLIGO-BIND and Hot Start Taq DNA polymerase (Kaur et al., Citation2018).
Compared to antibodies, aptamers have equal or better affinity and specificity to targets, they are smaller in size, have low production costs, can tolerate variations in temperatures much better, have less bath- to-batch variation, they can be easily modified and their production can also be scaled up readily (Ni et al., Citation2017). Aptamers therefore show significant potential for application in the development of low-cost rapid POC diagnostic devices, such as LFAs. Such devices will make a meaningful impact in slowing down the spread of EBOV during outbreaks in low resource settings in Africa. Several studies reported on the identification of aptamers against EBOV NP with KD in nanomolar range (Hong et al., Citation2019; Shubham et al., Citation2018). Shubham et al. (Citation2018) reported the selection of a 2’FY-RNA that binds the EBOV with KD that ranged between 20–54 nM, while Hong et al. (Citation2019) identified aptamers for the NP with KD that ranged from 8.1 ± 2.4 to 76.1 ± 10.9 nM, respectively.
Even though a lot of research has been done on aptamers, no aptamer-based diagnostic for EBOV exists. LFAs that use antibodies are probably the gold standard in POC testing. However, to date no aptamer based LFA has been commercialized for the diagnosis of any disease (T. Wang et al., Citation2021). The reasons for this include the low stability of aptamers in buffer systems used when they are applied in LFAs. While aptamers may have been selected and identified in a specific buffer system during SELEX, the buffer conditions may be vastly different when applied in LFAs, and as a result, the specificity of the aptamer is compromised. Another problem described by T. Wang et al. (Citation2021) is the practice to include additional nucleotides on the aptamer sequence which serve as a linker region. The additional nucleotides may affect the selectivity of the aptamer and researchers often do not assess the impact of the linker on the binding specificity of the aptamer (T. Wang et al., Citation2021). This suggests that more thought should be given to the design of aptamer based LFAs and how the aptamers will eventually be applied in LFAs. Also, another challenge using aptamers in the diagnostic space as described in the review by T. Wang et al. (Citation2021) is the non-specific binding (also known as off-target binding or cross-reactivity), as it can impact the specificity of the assays (T. Wang et al., Citation2021). However, several strategies have been employed to address this issue. Through the removal of certain nucleotides, truncation optimization is used to improve aptamer performance. The essential nucleotides found in ligand-binding sites stay intact, while nucleotides found in primer sequences are typically shortened. Truncation studies not only overcome the constraints caused by aptamer length, but also increase the sensitivity and specificity of aptamers and reduce the cost of aptamer synthesis. Since aptamer structures play a major role in truncating efficacy, secondary structure prediction can offer valuable insights to guide truncation optimization (Shangguan et al., Citation2007). Numerous virtual tools, such as multiple fold (M-fold) web server and NUPACK, have been created to predict the secondary structures, prior to truncation studies (Kilgour et al., Citation2021; Zuker, Citation2003). Other methods of improving the specificity and sensitivity include site-directed mutation of the key bases or extension of the specific bases like polyT to enhance the affinity (Bai et al., Citation2017; S. Gao et al., Citation2019), via computational methods (Emami et al., Citation2020) and the use of nanomaterials (Cao et al., Citation2020; J. Gao et al., Citation2019; Goda & Miyahara, Citation2020; Li et al., Citation2020; Liao et al., Citation2019; Tao et al., Citation2020; Zhao et al., Citation2020; X. Zhu et al., Citation2021).
In a recent study SELEX was used to identify aptamers (denoted as Apt1, Apt2 and Apt3) that bind to the EBOV NP (unpublished data). In the current study computational methods which include molecular modeling, docking interaction and molecular dynamics (MD) simulation analysis was used to study the binding of Apt1, Apt2 and Apt3 to a modeled structure of the EBOV NP. Molecular modeling of the EBOV NP generated a 3D structure that had a confidence coverage of >90%. In addition, molecular docking studies predicted that Apt1 had the strongest affinity for the EBOV NP, followed by Apt3 and Apt2. The mode of interaction between EBOV NP and Apt1 and Apt3 likely involves the formation of hydrogen (H) bonds, salt-bridges and hydrophobic interactions, while the interaction with Apt2 was probably only through hydrophobic interactions. On the other hand, from the MD simulations (RMSD, RMSF and interaction energies), Apt1 was regarded the most stable and highest binder, followed by Apt2 and finally Apt3, respectively. The binding affinities of the three aptamers to a recombinant EBOV NP were then validated using microscale thermophoresis (MST). MST analysis show that Apt1, Apt2 and Apt3 bound to EBOV NP with affinities of 25, 56 and 140 nM, respectively. There is therefore a good correlation between the computational predictions and the experimental validation of binding between EBOV NP and the three SELEX-derived aptamers. This will greatly assist in the application of these aptamers in the development of diagnostic systems.
2. Materials and methods
2.1. Template selection, homology modeling and quality assessment
Following the method of Changula et al. (Citation2013), the nucleoprotein of the Zaire Ebola (EBOV NP) strain was retrieved from GenBank at https://www.ncbi.nlm.nih.gov/nuccore/AF272001. The EBOV NP with the locus ID AF272001 was selected since it contains 100% conserved antigenic regions that are shared by other Ebola viruses, including Sudan, Tai Forest, Bundibugyo and Reston EBOVs (Changula et al., Citation2013). The amino acid sequence was uploaded to the Phyre2 web server version 2.0 to search for potential templates. The sequences were uploaded to the Phyre2 web server version 2.0 (Kelly et al., 2015) in the FASTA format to refine them via Phyre2 engines, including Poing 1.0 (a multi-template modeling and ab initio software) and MODELLER, which then generated three models that were used as final templates for multi-template alignment to generate one complete model with a confidence coverage of >90%.
The quality of the modeled EBOV NP was assessed and validated using the SAVES web server tools, such as the Procheck, RAMACHANDRAN PLOT (Ramachandran et al., Citation1963) and WHAT_CHECK (Hooft et al., Citation1996) tools. The distribution of torsion angles (φ and ψ) of C-alpha residues in a protein structure was done using Procheck analysis (Ramachandran et al., Citation1963), while WHAT_CHECK (a web-based program) was used to validate the geometry of the generated protein structure (Hooft, Sander, et al., Citation1996; Hooft, Vriend, et al., Citation1996; Vriend, Citation1990). WHAT_CHECK evaluates the following parameters; nomenclature of the structure, elementary geometry (bonds, angles, planarities, chiralities, proline puckerinng, etc.), torsion angle (side chain rotamers, omega, etc.), through space (bumps, hydrogen bonds, etc.), crystallographic problems (space group, cell dimensions, Mathew coefficient, symmetry bumps, B- factors, peptide flips, His/Asn/Gln side chain flips) and global quality (mis-threading, surface polarity, etc.) (Hooft, Sander, et al., Citation1996; Hooft, Vriend, et al., Citation1996).
2.2. Selection of EBOV NP active site residues for aptamer docking
Identification of a protein’s active site is an invaluable step toward the prediction of the function of a particular protein. Several studies have reported on the active site residues of EBOV NP that play important roles as catalytic sites (Ali & Islam, Citation2015; Changula et al., Citation2013; Noda et al., Citation2010; Sugita et al., Citation2018), as shown in Table S1. The EBOV NP active site residues reported in the literature were chosen as potential ligand binding pockets and selected as targets for docking studies.
2.3. Preparation of the aptamers for docking, 3D structures prediction and alignment
The DNA and corresponding RNA sequences of three aptamers (Apt1, Apt2 and Apt3) identified in a previous study are listed in . Using microscale thermophoresis (MST), it was established that the dissociation constants for Apt1, Apt2 and Apt3 were 25, 56 and 140 nM, respectively (unpublished data). The DNA aptamer sequences were uploaded to the RNAfold web server Package 2.0 (Gruber et al., Citation2008; Hofacker et al., Citation1994; Lorenz et al., Citation2011) to convert them to RNA structures and for optimal secondary structure prediction in dot- bracket notation with the lowest possible energy conformations using minimum free energy (MFE) algorithm. An aptamer (39SGP1A) that was previously identified and confirmed to bind EBOV NP (Shubham et al., Citation2018) was included as positive control, to validate docking success.
Table 1. RNA aptamers and controls selected for molecular docking using HADDOCK.
The same parameters used to fold the RNA in the study by Mathews and colleagues (Mathews et al., Citation2004) were used in this study. The fold algorithms were all left on default options. The dot-bracket notations obtained from RNAfold web server were used for modeling the 3D structure of RNA aptamers using RNAComposer version 1.0 (https://rnacomposer.cs.put.poznan.pl/about), as previously described by Antczak and colleagues (Antczak et al., Citation2016). Parameters were set to default options.
2.4. Molecular docking of aptamers to the modeled EBOV NP binding site residues using HADDOCK web server
Docking calculations using high ambiguity driven protein-DNA docking (HADDOCK) web server version 2.4 (https://wenmr.science.uu.nl/haddock2.4/submit/1) was performed on the three aptamers (Apt1, Apt2 and Apt3) as well as the positive control aptamer.
HADDOCK is a docking program that uses a data-driven approach to dock a DNA/RNA molecule to a protein surface. It has an easy-to-use main interface and additional interfaces that allow for the exploitation of the full range of experimental data supported by HADDOCK and the customization of the docking process (De Vries et al., Citation2010; Van Zundert et al., Citation2016). The default clustering algorithm employed in HADDOCK was first described by Daura and colleagues (Daura et al., Citation1998). HADDOCK generates several different clusters that consist of different structural protein conformations, of the water-refined models. The maximum number of models considered for clustering is 200. The statistics of the top 10 clusters were generated and the top cluster was considered to be the most reliable based on the HADDOCK scoring system. Its energy (Z)- score indicates the difference in standard deviations from the average cluster (that is, the more negative the stronger the affinity between the protein and RNA aptamer).
Briefly, the pdb structures of the refined modeled EBOV NP and the aptamers were uploaded to the HADDOCK 2.4 web server interface. The EBOV NP was uploaded as the receptor, while the aptamers were considered as the ligands. The EBOV NP binding surface sites which were identified as described in section 2.2 as residues 421 to 440 (YDDDDDIPFPGPINDDDNPG), residues 601 to 620 (TPTVAPPAPVYRDHSEKKEL) and residues 160 (K), 171 (K), 174 (R), 205 (R), 211 (K), 248 (K), 298 (R), 24 (I), 160 (K), 174 (R), 178 (V), 245 (L), 298 (R), 310 (H), 331 (L), 334 (V) and 401 (R), were specified as the binding pockets. On the other hand, all the sequences of the aptamers were regarded as interacting residues. The selection of the active residues was done to specify the docking grid space on the EBOV NP. The receptor and the ligands were submitted to the EASY access level of HADDOCK web server for docking, with all settings left on default. The scoring functions of the HADDOCK web server are performed according to the HADDOCK score (weighted sum) on the following terms; van der Waals intermolecular energy (Evdw), electrostatic intermolecular energy (Eelec), distance restraints energy (Eair), radius of gyration restraint energy (Erg), direct RDC restraint energy (Esani), inter-vector projection angle restrain energy (Evean), pseudo contact shift restraint energy (Epcs), diffusion anisotropy energy (Edani), dihedral angle restraint energy (Ecdih), symmetry restraint energy (Esym), buried surface area (Bsa), binding energy (Etotal complex) and desolvation energy (Edesol). In addition, Edesol weight was set to 0 for all stages to allow the structure with the lowest weighted sum to be ranked first (De Vries et al., Citation2010). The structure with the energetically favorable pose and lowest binding score was selected from the HADDOCK output for interaction analysis.
2.5. Interaction analysis
Complexes between EBOV NP and the individual aptamers (Apt1, Apt2, Apt3 and the Positive control) were submitted to protein-ligand interaction profiler (PLIP) version 2.0.0 (https://plip-tool.biotec.tu- dresden.de/plip-web/plip/index) for interaction and structural analysis. PLIP is a web tool used for easy and fast identification of non-covalent interactions between biological macromolecules and their ligands (Adasme et al., Citation2021; Salentin et al., Citation2015). It provides an easy-to-use interface that allows input formats in pdb format for receptors and ligands. It also allows users to change the default settings to their special requirements. It detects hydrogen bonds (≤4.1 Å), hydrophobic contacts (≤4.0 Å), π-cation interactions (≤6.0 Å), π-stacking (≤7.5 Å), water bridges (≤4.1 Å), salt-bridges (≤5.5 Å) and halogen bonds (≤4.0 Å) between receptors and ligands (Adasme et al., Citation2021).
The amino acid residues of the EBOV NP bound to the aptamers were visualized in PYMOL and their interactions were recorded as previously described (Musyoka & Bishop, Citation2019). The number of interactions were tabulated for each aptamer bound to EBOV NP.
2.6. Molecular dynamics (MD) simulations
Each of the five EBOV NP-aptamer complex systems were simulated for 200 ns. The atomic coordinates of the complexes were uploaded to the CHARMM-GUI web server (Brooks et al., Citation2009; Jo et al., Citation2008; Lee et al., Citation2016) for structure preparation prior to MD simulations. For this study, the CHARMM36M force field (FF) (Lee et al., Citation2016) were used to define the protein and RNA molecule topologies implemented in the GROMACS 2019 package (Hess et al., Citation2008). The CHARMM36M FF parameters are optimized for proteins and nucleic acids, producing accurate topologies for these molecules (J. Huang et al., Citation2017). The complexes were immersed in a 10 Å rectangular cubic box with a system size of 89 for each axis A (X), B (Y) and C (Z), while crystal angles: alpha angle (between the axis B and C), Beta angle (between the axis A and C) and Gamma angle (between the axis B and C) were 90.0°, respectively. For the periodic boundary conditions, the grid information for PME FFT (Brooks et al., Citation2009; Jo et al., Citation2008; Lee et al., Citation2016) was generated automatically. The systems were equilibrated for 125ps (125,000 steps) and 250ps (250,000 steps) using the constant number of volume and temperature (NVT) and the number of particles, pressure and temperature (NPT) ensembles, at a temperature of 310K. NVT was performed to equilibrate the temperature of the system, while the NPT ensemble was performed to stabilize the pressure of the systems. All the complex systems were neutralized with 27 K+ and 35 Cl- counterions and the box was of simple point charge (SPC) water molecules and was neutralized with potassium (K+) and chloride (Cl-) counterions, at a default concentration of 0.15 M using Monte-Carlo ion placing method (Brooks et al., Citation2009; Jo et al., Citation2008; Lee et al., Citation2016). The number of ions were automatically determined by the ion-accessible volume (V), the total charge of the systems (Qsys) and the valence of the positive ion (Z+). Subsequently, the systems were energy minimized for 50ps (50,000 steps) using the steepest descent algorithm, to remove steric clashing between atoms from the starting structures until a tolerance of 2500 kJ/mol was reached. Energy minimizations were followed by 1 ns equilibration under NVT and NPT ensembles with position restraints applied to protein. Finally, each system was simulated for 200 ns at 310K temperature and 1 bar pressure removing all restraints. The LINCS algorithm was applied for the bond constraints (Hess et al., Citation2008). The Particle Mesh Ewald (PME) algorithm (Darden et al., Citation1993) with cut-off distance 1.2 nm was used to calculate the long-range electrostatic interactions. The MD simulations were performed under periodic boundary conditions (PBC) in all directions. GROMACS tools, such as gmx_rmsd, gmx_gyr, gmx_rmsf and gmx_hbonds were used to analyze the trajectories; gmx_rmsd was used to calculate the root mean square deviation (RMSD) of the protein backbone in complex with the aptamers, gmx_gyr was employed to calculate the radius of gyration (GyR, measure of compactness of the protein structure), while the gmx_rmsf was used to measure average flexibility of the protein residues (RMSF) and the gmx_hbonds were used to measure the average number of hydrogen (H) bonds formed between the protein and aptamer over 100–180 ns.
2.7. Non-bonded interaction energy
The strength of the association between the aptamers and the EBOV NP was quantified by calculating the total average non-bonded interaction energy for the total 200 ns simulation time. The total non-bonded interaction energy is defined by the following equation, Eint = L-J + Coul, where Eint represents the average energy in Kcal/mol obtained from the energy file, LJ is the short-range Lennard-Jones interaction energy, while Coul is the Coulomb interaction energy. The, gmx_energy tool of gromacs was used to calculate the average short-range L-J and Coul interaction energies between the EBOV NP biomarker and the aptamers, respectively.
2.8. Binding free energy calculations
The binding free energy of the EBOV NP-aptamers complexes were calculated using the gmx_MMPBSA tool v1.4.3 of gromacs based on MMPBSA.py v.16.0 (Paissoni et al., Citation2015; Valdés-Tresanco et al., Citation2021). The MMPBSA tool is an effective strategy employed for the calculation of binding free energy of several protein-ligand complexes (Bradshaw et al., Citation2011; Gilson & Zhou, Citation2007; Huo et al., Citation2002; Moreira et al., Citation2010; Reddy et al., Citation2014). The formula for calculating binding free energy is defined as ΔG = ΔH -TΔS, with ΔG being the change in binding energy and ΔH is the change in enthalpy while T is the temperature and ΔS is the change in entropy (Bradshaw et al., Citation2011; S. P. Brown & Muchmore, Citation2009; Gilson & Zhou, Citation2007; Huo et al., Citation2002; Massova & Kollman, Citation1999; Moreira et al., Citation2010; Reddy et al., Citation2014).
2.9. Validation of binding by microscale thermophoresis (MST)
MST analysis to study the interaction between the EBOV NP and different aptamers was performed at 2bind GmbH (Regensburg, Germany). The aptamers were fluorescently labeled with Cy5 while the EBOV NP was left unlabeled. A serial dilution of the EBOV NP (target molecule) was prepared in buffer to match the final buffer conditions in the reaction mix. The highest concentration of target was 20 μM and the lowest 610.4 pM. The labeled aptamers were diluted to 1 nM in the MST buffer (Nano Temper Technologies) containing 0.05% Tween 20, while a solution of the EBOV NP was prepared in a series of 16 dilutions (1:1) using the same buffer. The protein concentration was mixed with labeled aptamer in a 1:1 ratio according to technician instructions. After 10 min incubation, the samples were loaded into Monolith NT.115 Standard Treated Capillaries (Nano Temper Technologies). The MST trace were determined using a Monolith NT.115 instrument (Nano Temper Technologies) at an ambient temperature of 25.1 °C. The instrument parameters were adjusted to 40% LED power and 40% MST power. Triplicates of independently pipetted measurements were analyzed (MO-Affinity Analysis software version 2.1.3, Nano Temper Technologies) to calculate the binding affinity expressed in terms of KD value.
3. Results
3.1. Template selection, homology modeling and quality assessment
Twenty (20) homologous EBOV NP template structures were identified as shown in . Three templates (c6ehmB, c4qb0A and c4ypi) which covered almost 90.0% of the 742 residue EBOV amino acid sequences were selected to construct a multi-template sequence-structure. The three template structures shown in Figure S1 were used to build a complete structure for EBOV NP based on heuristics to maximize confidence, percentage identity and alignment coverage. The final 3D protein structure for EBOV NP was modeled with >90% confidence, as shown in Figure S2. The secondary structure arrangement as predicted by PSIPRED indicated that the EBOV NP has 11 beta strands, 34 coils and 24 α-helices (Figure S3).
Table 2. Twenty (20) homologous templates identified for the EBOV NP protein sequence using Phyre2 web server.
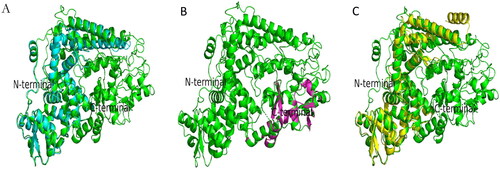
The three templates, with different structures were superimposed to the modeled EBOV NP using PYMOL to confirm structural alignments at lower RMSDs than the cut-off values, as shown in the .
Figure 1. Superimposition between modeled EBOV NP and template proteins (c6ehmB, c4qb0A and c4ypiA) using PYMOL. The EBOV NP is depicted as cartoon with different chains in green color, while the templates (c6ehmB is depicted as a single chain in light blue, c4qb0A in purple and c4ypiA in yellow colors). Panel A) Structural alignment of c6ehmB to EBOV NP, Panel B) Structural alignment of c4qb0A to EBOV NP and Panel C) Structural alignment of c4ypiA to the EBOV NP. Superimposition of the templates produced RMSDs of 0.637 (318 to 318 atoms), 0.068 (75 to 75 atoms) and 0.678 (266 to 266 atoms), respectively. Also, 390, 91 and 346 residues of c6ehmB, c4qb0A and c4ypiA were match-aligned to 744 residues of the refined EBOV NP, which produced a match-alignment scores of 1963.000, 502.000 and 1749.000, respectively.
A significant part (up to 90%) of the modeled EBOV NP structure showed a high degree of overlap with known template structures, showing that it perfectly match, as shown in Figure S4. The RAMACHANDRAN plot was used to analyze the EBOV NP structure with at least 2.0 Angstroms (Å) and R-factor no greater than 20%. The RAMACHANDRAN Plot for the modelled EBOV NP indicated that 90% of the amino acid residues fell in the most favored and additionally allowed regions of the quadrants. WHATCHECK analysis reported a chi1/chi-2 rotamer normality, RMS Z-scores of omega angle restraints and side chain planarity scores of 0.958, 1.177 and 0.791 for the EBOV NP predicted 3D structure. The quality assessment values indicate that the predicted EBOV NP structure satisfied all the quality tests performed and is considered reliable for further analysis.
3.2. Selection of EBOV NP active site residues for aptamer docking
Sixty five known active site residues were selected based on previous studies. It was shown that EBOV NP has linear epitopes that span from residues 421–440 (YDDDDDIPFPGPINDDDNPG) and residues 601–620 (TPTVAPPAPVYRDHSEKKEL) (Changula et al., Citation2013; Noda et al., Citation2010). The GEQYQQLR sequence motif which is present within EBOV NP have been reported to have antigenic and immunogenic properties (Ali & Islam, Citation2015). The EBOV NP was reported to form a complex with RNA polymerase and the viral RNA (Kiley et al., Citation1980). Dong et al. (Citation2015) reported that the positively charged polar residues 160 (Lys), 171 (Lys), 174 (Arg), 205 (Arg), 211 (Lys), 248 (Lys) and 298 (Arg) form part of the RNA binding groove (Dong et al., Citation2015). Recent studies have also reported specific residues within the EBOV NP, which includes 24 (Ile), 160 (Lys), 174 (Arg), 178 (Val), 245 (Leu), 298 (Arg), 310 (His), 331 (Leu), 334 (Val) and 401 (Arg), play important roles as the RNA binding sites (Kirchdoerfer et al., Citation2019; Sugita et al., Citation2018). The aforementioned residues were thus selected as potential EBOV NP binding site residues in docking studies.
3.3. Preparation of the aptamers for docking, 3D structures prediction and alignment
Aptamers were selected from a previous study that used site-directed SELEX to generate aptamers against EBOV NP (unpublished data) shown in Table S2. Table S2 depicts the optimal secondary structure in dot-bracket notation with minimum free energies (MFEs) of the predicted aptamers. The aptamers were subjected to RNAFold to predict their dot-bracket notations before uploading them to the RNAComposer to model their 3D structures (as shown in Table S2).
3.4. Molecular docking of aptamers to the modeled EBOV NP binding site residues using HADDOCK web server
Based on the Z-scores, Apt1 had the highest Z-score (−2.4), followed by Apt3 (−1.6) and Apt2 (−1.3) as shown in . Similarly, the HADDOCK scores reported for Apt2 was the highest (210.3 ± 13.9), followed by Apt3 (158.8 ± 10.0) and finally Apt1 (152.9 ± 11.7). The RMSD values recorded for Apt2 (40.0 Å) was the highest, followed by Apt3 (27.8 Å) and Apt1 (25.4 Å). Finally, the electrostatic energies recorded for Apt1 was the highest (−568.9 ± 4.8), followed by Apt3 (−345.2 ± 14.1) and Apt2 (−145.2 ± 8.9) as depicted in . Apt1 recorded the lowest Van der Waals (−40.2 ± 1.0) and restraints violation (2740.4 ± 129.8) energies, followed by Apt2 and Apt3. This did not negatively affect the final HADDOCK binding score and Z-score.
Table 3. HADDOCK binding scores and energetic contributors for the three aptamers and an experimental control.
The positive control aptamer had the lowest HADDOCK score (58.8 ± 17.5), RMSD value (17.8), desolvation energy (24.9 ± 2.9), restraints violation energy (1537.2 ± 165.8) and buried surface area (1771.4 ± 44.8) when compared to Apt1, Apt2 and Apt3 (). Interestingly, the positive control had a similar Z-score of (−1.3) to Apt2. The other components that contributed significantly to the total binding energy of the positive control to EBOV NP protein included the electrostatic energy (−381.8 ± 21.1) and the Van der Waals energy (−43.5 ± 1.9).
3.5. Interaction analysis
The interaction analysis shows that the aptamers bound to the amino acid residues within the active sites of EBOV NP and that the majority of the nucleotides bound to polar, basic and acidic amino acid residues (Arg, Asn, Asp, Cys, Gln, Glu, His, Lys, Ser, Thr and Tyr) as shown in . Apt1 bound to Arg at positions 612, whereas Apt2 bound to Gln at positions 339 and 342, while Apt3 bound to Arg and Thr at positions 174 and 601. On the other hand, the positive control aptamer bound to Arg at position 174. All the aptamers bound to the EBOV NP by either forming hydrogen (H) bonds, salt-bridges or hydrophobic interactions. Apt1 formed H bonds and salt-bridges with the EBOV NP, by binding to 11 and 8 amino acid residues, respectively. Apt2 bound 13 residues of the EBOV NP via H bonding and through one salt-bridge interaction. Apt3 on the other hand formed 1 hydrophobic interaction, 14 H bonds and 6 salt-bridge interactions with the EBOV NP. The positive control aptamer, bound to 5 and 6 amino acid residues in EBOV NP via H bonding and salt- bridge interactions, respectively.
Table 4. Hydrogen bonds, salt-bridges and hydrophobic interactions of the EBOV NP amino acids from PLIP. .
3.6. Molecular dynamics (MD) simulations
shows that the EBOV NP-Apt1 complex produced a lower RMSD value (0.4 ± 0.1 nm) when compared to the EBOV NP-Apt2 complex (0.5 ± 0.1 nm) and EBOV NP-Apt3 complex (0.6 ± 0.1 nm). The RMSD value for the EBOV NP-positive control aptamer complex (0.7 ± 0.1 nm) was comparable to that of the EBOV NP-Apt1, 2 and 3 complexes. The stable regions were observed to be between 50 and 180 ns in all the complexes.
Figure 2. Trajectory analysis of the five EBOV NP-aptamer complexes over the 200 ns simulation period. A: root mean square deviation (RMSD) and B: radius of gyration (GyR) over 200 ns simulation time.
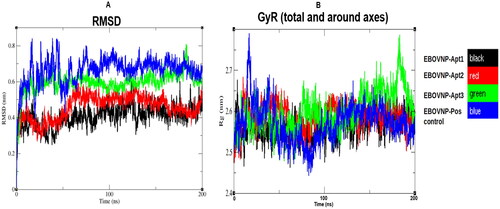
The GyR for the five EBOV NP-aptamer complexes were similar over the course of a 200 ns simulation time (). The values for the complexes with Apt1, Apt2, Apt3 and positive control aptamer were all were ∼ 2.6 ± 0.05 nm, respectively.
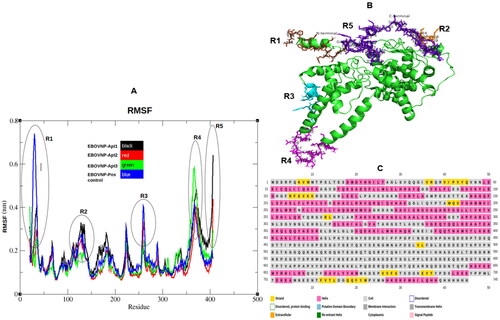
(A) shows that when the EBOV NP is in complex with the aptamers the amino acid residues demonstrate less fluctuation throughout the selected stable region (100–180 ns). The EBOV NP-Apt2 complex fluctuated the least at 0.1 ± 0.1 nm, while Apt2 and Apt3 complexes at 0.2 ± 0.1 nm. Therefore, the amino acid fluctuations in all the complexes tested were not comparable, since the differences were minimal. The fluctuating amino acids fell within the coiled regions within the EBOV NP structure, as shown in .
Figure 3. Trajectory analysis of the five EBOV NP-aptamer complexes over 100–180 ns simulation period. (A) Root mean square fluctuations (RMSF) with black rings indicating amino acids with higher fluctuations between regions 1 to 5 (R1–R5). (B) EBOV NP structure (green) with fluctuating amino acids presented as sticks colored in brown (N terminal residues 1–15), orange (121–129), cyan (258–269), magenta (362–379) and purple (C terminal residues 475–500). (C) EBOV NP structure/model analyzed by psipred web server. The fluctuating residues fell within the coiled regions (R1–R5).
Following the MD simulations, gmx_hbonds tool of gromacs was used to determine the number of H bonds that contributed to the binding between the EBOV NP and the aptamers at the selected stable time frames (100–180 ns), as shown in .
Figure 4. Hydrogen bond analysis of the five EBOV NP-aptamer complexes over the observed stable simulation time (100–180 ns). Black: EBOV NP-Apt1, red: EBOV NP-Apt2, green: EBOV NP-Apt3 and blue: positive control, respectively.
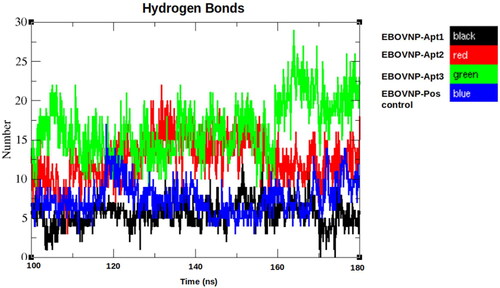
The EBOV NP-Apt1 complex showed the highest number of H bonds (16), followed by EBOV NP- Apt2 (12), EBOV NP-positive control (7) and the EBOV NP-Apt3 (5).
3.7. Non-bonded interaction energy
The potential energies of the EBOV NP-aptamer complexes were determined by considering both the Coulomb and the Lennard-Jones interaction energies to calculate the average total interaction energy, as shown in . The EBOV NP-Apt1 complex had the highest potential energy, followed by Apt2 and Apt3 (). The potential energy of the EBOV NP-Apt1 (−1672.6 kcal/mol) and EBOV NP-Apt2 (−1387.6 kcal/mol) complexes were lower than that of the EBOV NP-positive control (−785.3 kcal/mol) and EBOV NP-Apt3 (−559.9 kcal/mol) complexes.
Table 5. Non-bonded interactions energies (Coulomb and Lennard-Jones) between the aptamers and the EBOV NP.
3.8. Binding free energy calculations
The binding free energy of the complexes were determined using the gmx_MMPBSA (molecular mechanics energies combined with the Poisson-Boltzman and surface area continuum solvation) package of GROMACS. The results are summarized in . The total free energy (ΔG Total) was calculated by considering the van der Waals (VDW) forces, electrostatic energy (ELE), polar contribution to solvation energy by GB/PB method (EGB) and non-polar contribution to solvation energy using SASA (ESURF), respectively. The most favorable free energy (ΔG Total) was found for EBOV NP-Apt2 complex (ΔG Total = −277.91 kcal/mol), while the most unfavorable binding energies were observed for EBOV NP-positive control aptamer complex (ΔG Total = −127.70 kcal/mol). In addition, the EBOV NP-Apt2 complex had the least binding free energy in ELE, EGB and the gaseous (non-polar) state. This was followed by EBOV NP-Apt3 (lower values of ELE and non-polar state), which also had higher values of EGB and polar state. However, Apt3 (ΔG Total = −127.74 kcal/mol) bound with the same energy as compared to the positive control aptamer (ΔG Total = −127.70 kcal/mol). Nevertheless, based on lower energies in ELE, non-polar solvation state and higher energies in EGB and polar solvation state, Apt3 had a higher affinity for the EBOV NP than the positive control aptamer.
Table 6. MMPBSA analysis of EBOV NP-aptamer complex MD simulation, at 150–180 ns (1500–1800 frames).
3.9. Validation of binding by microscale thermophoresis (MST)
Microscale thermophoresis (MST) analysis is a robust technology used to characterize the interaction between molecules. MST involves the fluorescent labeling one of the interacting molecules. Variations in the fluorescence signal from the labeled molecules as a result of an IR laser-induced temperature changes is used to determine the binding characteristics (Schubert & Längst, Citation2015; Waddad et al., Citation2019). The interactions of Cy5 labeled Apt1, Apt2 and Apt3 with recombinant EBOV NP were investigated using a Monolith NT.115 instrument. The binding affinities (KD) and constant (KA = 1/KD) of Apt1, Apt2 and Apt3 to EBOV NP are shown in and . Apt1 showed the strongest binding properties to EBOV NP, as indicated by its low KD (25 ± 2.84 nM) and high KA (0.04 M − 1), followed by Apt2 and Apt3.
Figure 5. MST fractions bound of A: aptamer 1, B: aptamer 2 and C: aptamer 3. Tech: technical repeats with baseline corrections.
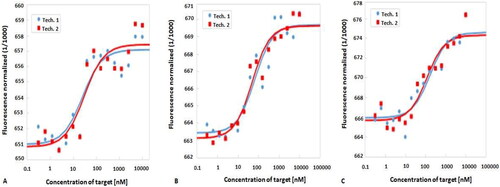
Table 7. Binding affinities and binding constants of the three aptamers with EBOV NP using MST.
4. Discussions
Phyre2 was used to successfully construct a full length EBOV NP 3D structure using multiple templates to cover different parts of the query sequence. Furthermore, gapped regions in the alignment were resolved by performing loop modeling to fill in missing residues using PDB structures that perfectly match the target sequence (Lam et al., Citation2017; Sykes et al., 2022). The quality of the modeled EBOV NP structure was validated by subjecting the structure to SAVES web server tools, such as PDB, RAMACHANDRAN PLOT and WHAT_CHECK. In PDB database, more than 90% of the amino acid of the modeled structure fell within the expected regions of the existing pdb structures (190, 226 as of 4 May 2022). These regions therefore could form specific 3-D structures under simulated physiological conditions (Gall et al., Citation2012). In contrast, modeled protein structures with intrinsically disordered regions (IDRs), cannot be visualized in electron density maps of X-ray crystallography experiments and thus do not exhibit 3D structures (Gall et al., Citation2012). Consequently, structures with IDRs have non-stable backbone RAMACHANDRAN angles due to lack of equilibrium states and non-cooperative conformational changes in the regions (Dunker et al., Citation2013; Gall et al., Citation2012; Uversky, Citation2017). However, the RAMACHANDRAN PLOT of the modeled EBOV NP structure showed that more than 90% of the amino acid residues satisfied the phi and psi dihedral angle distribution criteria. Furthermore, validation using WHAT_CHECK indicated that the scores for the modeled EBOV NP structure fell within the expected ranges and compared well to known high quality structures suggesting the modeled EBOV NP structure is of reliable quality and was therefore suitable for subsequent docking studies.
DNA aptamers have high flexibility (deoxy) ribose-phosphodiester backbones, each nucleotide has a total of six torsion angles/flexible bonds, which contribute to their diverse secondary and tertiary structures and thus have a wide variety of applications (Gelinas et al., Citation2016). The diverse secondary and tertiary structures of the aptamers contribute to their binding affinities and specificities to different target molecules (Cataldo et al., Citation2018). When derived by SELEX, the aptamer typically contains what can be regarded as extra or additional sequence which may originate from the conserved primer sequences or is part of the unique aptamer sequence. These additional sequences may also play a role in binding to the target (X. Wang et al., Citation2019). All the aptamers were folded and minimized via RNAfold (Hofacker et al., Citation1994) through the MFE algorithm, which is used for longer DNA/RNA sequences. Since it is generally assumed that RNA structures are more conserved than RNA sequences. The MFE algorithm also assumes that RNA structures are related to their free energy (Zhang et al., Citation2019). Therefore, the size of free energy changes with the type of base pairing and sequence. These are considered for the formation of H bonds between nucleo-bases of the corresponding nucleotides, as observed in Table S2. Other algorithms have also been reported, such as the Zuker algorithm (Zuker, Citation2003). This type is however better suited for the prediction of secondary structures of shorter RNA sequences. On the other hand, the Hofacker algorithm is suited for longer RNAs sequences (Hofacker et al., Citation1994), as shown in Table S2.
The dot-bracket notations of the predicted RNA structures were uploaded to RNAComposer to further energy minimize the structures and to convert them to .pdb 3D formats. The method is based on the machine translation principle and operates on the RNA FRABASE database acting as the dictionary relating RNA secondary structure and tertiary structure elements. The dictionary constitutes 3D components derived from almost all RNA structures deposited into the RCSB PDB database (Biesiada Pachulska-Wieczorek, et al., Citation2016; Biesiada, Purzycka, et al., Citation2016).
The 3D generated aptamers were docked to the modeled EBOV NP via HADDOCK web server. The positive control aptamer recorded the lowest scores, including HADDOCK score, RMSD, desolvation energy, restraints violation energy and buried surface area compared to the Apt1, Apt2 and Apt3. This might be attributed to its smaller size (39 nucleotides) compared to Apt1, 2 and 3 (97 nucleotides). Also, the lower scores might be attributed by the low restraint energy (1537.20 ± 165.80), that is, most models satisfied the restraints that were defined in HADDOCK. Shubham et al. (Citation2018) postulated that the low scores associated with the positive control aptamer can also be related to its experimental dissociation constant (KD) of around 20–54 nM (Shubham et al., Citation2018). However, based on the HADDOCK Z-score only, Apt1 (−2.4) and Apt3 (−1.6) bound EBOV NP stronger than the positive control aptamer and Apt2 which both had a Z-score of −1.3.
The contrasting observations could be due to the fact that the easy interface employed (in HADDOCK web server) sets majority of the parameters at their default settings and docking was driven by chemical shifts perturbations or interface predictions (De Vries et al., Citation2010; Van Zundert et al., Citation2016). At the easy interface, there is no full control over all aspects of HADDOCK, such as force constraints for the various restraint energy terms, time steps and temperatures. More so, not all aptamer conformations can bind the target, but their binding capabilities can be influenced by several factors such as pH, temperature, salt concentration and chemical modifications (Elskens et al., Citation2020). Nevertheless, based on the Z-score, HADDOCK score, electrostatic interactions and the RMSD values, Apt1 had the strongest binding affinity followed by Apt3 and Apt2. Despite the lower RMSD recorded for the positive control (17.8 Å) compared to Apt1 (25.4 Å). However, Apt1 bound with higher affinities compared to the positive control, based on Z-score (−2.4 and −1.3), HADDOCK scores (152.9 ± 11.7 and 58.8 ± 17.5), electrostatic energies (−568.9 ± 4.8 and −381.8 ± 21.1), Van der Waals (−40.2 ± 1.0 and −43.5 ± 1.9) and restraints violation (2740.4 ± 129.8 and 1537.2 ± 165.8) energies. Interactions between an aptamer and its target depend on the flexible nature of the aptamer and the characteristics of the target (Deng et al., Citation2014). Aptamers can take on a variety of structural shapes, which includes bulges, hairpins, G-quadruplexes and pseudoknots (Riccitelli & Lupták, Citation2010). They can bind to their respective targets via H bonding, electrostatic interactions, hydrophobic interactions, π–π stacking, van der Waals forces, or combinations of these different forces (Tan et al., Citation2016). It was reported that H bonding is the most common type of interaction between aptamers and their target moieties (Mairal et al., Citation2008). Nagatoishi et al. (Citation2011) also reported the direct interaction of a DNA aptamer with thrombin target via H bonding (Nagatoishi et al., Citation2011). In fact, the H bonds were responsible for the stability of the aptamer- protein complex (Chou et al., Citation2005; Nagatoishi et al., Citation2011). Similarly, Gao and colleagues reported the binding between aptamer GO18-T-d and gonyautoxin ¼ via H bonds at distances ranging 2.0–2.8 Å (S. Gao et al., Citation2016). shows that Apt3 formed the highest number of H bonds (14) with the EBOV NP, followed by Apt2 (13) and Apt1 (11). Interestingly, the positive control aptamer formed much less H bonds (5).
Interactions of the aptamers with EBOV NP through salt-bridges were also recorded in . Apt1 and the positive control aptamer recorded the highest number of salt-bridge interactions at 8 and 7, respectively, followed by Apt3 (6) and Apt2 (1). Other studies have also reported the formation of salt-bridges between the DNA aptamers and their target molecules (Choi & Ban, Citation2016; Kuo et al., Citation2013). Surprisingly, Apt3 interacted with the EBOV NP via hydrophobic interaction, attributed by the hydrophobic Phe residue. A study by Rohloff et al. (Citation2014) also reported binding of modified aptamers (SOMAmers) to targets by hydrophobic aromatic rings (modified at the binding interface) and by shape complementarity (Rohloff et al., Citation2014). In addition, S. Gao et al. (Citation2016) reported that a steric hindrance effect might be responsible for blocking the aptamers from binding to the residues in the active site of Gonyautoxin (S. Gao et al., Citation2016). Binding of aptamers to the EBOV NP may have been affected in the same way. The binding of the aptamers to the EBOV NP can induce structural changes in the aptamer by altering the number of H bonds within the aptamer resulting in the formation of a stable aptamer-EBOV NP complex. In the process of binding, the structural shapes of the aptamers might have been altered through conformational alterations in the side chains of the EBOV NP residues which form part of the active site(s). The reason why Apt1 had a more negative Z-score, compared to Apt2 and Apt3 is because of the higher electrostatic interaction contribution. The more negative the score the lower the amount of steric hindrance. A similar observation was reported in a previous study (Rhinehardt et al., Citation2015).
Based on the RMSD analysis, the EBOV NP-Apt1 complex produced a lower RMSD value (0.4 ± 0.1 nm) compared to the positive control (0.7 ± 0.1 nm) and both EBOV NP-Apt2 (0.5 ± 0.16 nm) and EBOV NP-Apt3 (0.6 ± 0.1 nm) complexes (). This showed that EBOV NP-Apt1 complex was more stable than the other EBOV NP- aptamer complexes. This is most probably because of the stronger binding affinity based on the HADDOCK Z-score (). Apt1 had a higher number of Guanine (G) residues compared to the other aptamers. Adenine (A) and Thymine (T) rich sequences contribute to low stability regions, while G and Cytosine (C) rich regions provide higher stability (Cuesta-López et al., Citation2011). G-rich structures are greatly enhanced by the binding of monovalent cations such as Na+ or K+ into their grooves, enhancing their stability even further (Sharawy & Consta, Citation2018).
The EBOV NP-Apt3 complex was least stable (). It is possible that Apt3 might have carried canonical structures, whereas the interaction of the other aptamers with EBOV NP did not adhere to Watson-Crick rules of hybridization. This is supported by the study of Xie et al. (Citation2020) which also suggested that noncanonical tertiary structures exhibit better stability, selectivity and unicity (Xie et al., Citation2020). In addition, the bridging water molecules connecting the target to the aptamer, play an important role in regulating the dynamic stability of the complex over the course of the simulation time (Xie et al., Citation2020).
On the other hand, all the aptamer-EBOV NP complexes displayed the same GyR deviation values of ∼ 2.6 ± 0.05 nm (). Globular proteins with α-helices and β-sheets have lower GyR values suggesting a more compact protein structure (Lobanov et al., Citation2008).
Slight differences in RMSF fluctuation values were observed for the different aptamer-complexes (). This suggest that not all the aptamers could form a stable complex with EBOV NP. These slight differences in fluctuations suggest that the aptamers interacted differently with the active residues within the active binding pockets (Cleri et al., Citation2021; Devi & Chaitanya, Citation2021; G. Zhu et al., Citation2017). Therefore, the fact that the active site residues showed lower fluctuations when the protein was bound to the aptamers is a demonstration of this. In addition, the higher number of coils, as seen in might have contributed to its higher fluctuations (R1–R5). The more the coiled coils in a protein structure, the higher conformational flexibility (Behrens et al., Citation2013). Vajda and Perczel (Citation2016) demonstrated that the length of coiled coils is a decisive factor on their stability, where long coiled coils produce unstable protein structures (Vajda & Perczel, Citation2016). On the other hand, stable coiled coils are attributed by a high content of carefully positioned hydrophobic residues, which use their intra- and interhelical electrostatic interactions to tune their stability, within the neighboring chains (J. H. Brown et al., Citation2008).
The number of H bonds that contributed to the interactions of the complexes over the simulation period were reported in . In contrast to docking, Apt1, Apt2, Apt3 and positive control aptamer had bonded to EBOV NP with 11, 13, 14 and 5 H bonds. The MD simulations recorded 16, 12, 5 and 7 H bonds, respectively. The differences in the finding of these two methods might be due to the different H bond cut-offs between PyMOL and GROMACS (GROMACS Gmx Hbond—GROMACS, Citation2019; PyMOL Setting:H_bond, Citation2022). In addition, calculations in PyMOL are based on static structure interactions, while GROMACS uses an ensemble of conformations to calculate an average number of H bonds (GROMACS Gmx Hbond—GROMACS, Citation2019; PyMOL Setting:H_bond, Citation2022) within the simulated period (100–180 ns).
In addition, the non-bonded interaction energies between the aptamers and EBOV NP were also reported (). The differences with the interaction energies means that the water molecules and ions in the simulation box can influence the aptamer structure and thus its binding capacity (Brooks et al., Citation2009; Yan & Levy, Citation2018).
In contrast, the binding free energy (MMPBSA) calculations (ΔG Total) ranked Apt2, as the aptamer with the highest affinity to EBOV NP, followed by Apt1. The differences between non-bonded interaction energy and MMPBSA in ranking the aptamers might be attributed to the difference between gmx_energy and gmx_MMPBSA tool of gromacs employed. The gmx_energy does not account for changes in internal energy and configurational entropy of the aptamer and protein upon binding (Rifai et al., Citation2019). On the other hand, the gmx_MMPBSA tool was used to perform calculations using three separate simulations (i.e. of the complex, the protein and the unbound aptamer) in a multi-trajectory or three-average setup (C. Wang et al., Citation2017).
From it can be concluded that Apt1 bound stronger than the other aptamers because of its flexible loop formation (Figures S5–S8). Vainer et al. (Citation2016), also reported the flexibility of the loop in the DNA-binding domain increases the binding specificity (Vainer et al., Citation2016). This was in line with the RMSDs observed in , which suggests that the EBOV NP-Apt1 complex was more stable, compared to the EBOV NP-Apt2 and EBOV NP-Apt3 complexes. Maszota-Zieleniak et al. (Citation2021) also reported that low free binding energies are as a result of stable interactions between proteins and ligand molecules (Maszota-Zieleniak et al., Citation2021). Apt3 showed the least favorable free energy because it has fewer G (1) and C (3) nucleotides in the binding region that act as H bond donors and acceptors, respectively (Figures S6 and S7).
Therefore, based on the Z-scores, HADDOCK scores, RMSD values and electrostatic energies, Apt1 bound EBOV NP the strongest, followed by Apt2 and then Apt3. Apt1 recorded the lowest Van der Waals (−40.2 ± 1.0) and restraints violation (2740.4 ± 129.8) energies, followed by Apt2 and Apt3. This did not negatively affect the final HADDOCK binding score and Z-score. Nevertheless, Apt1 demonstrated the strongest binding affinity (based on the Z-score, HADDOCK score, electrostatic, Van der Waals energy and RMSD analysis) compared to Apt2 and 3, as shown in . In addition, the salt-bridge interaction was a major contributing factor to stronger aptamer-EBOV NP interaction. From the MD simulation studies, it can be concluded that the positive control was least stable than Apt1, 2 and 3, over 200 ns simulation time. Also, the higher number of H bonds for Apt1 may be attributed to differences in the nucleotide sequences, structures and docking configurations, observed over the stable part of the simulation trajectory (100–180 ns).
Based on these in silico analyses, the three aptamers (Apt1, Apt2 and Apt3) that were identified using SELEX demonstrated similar characteristics as the positive control aptamer and in terms of their binding affinity, they can be ranked in order of increasing affinity as follow; Apt1, Apt2 and Apt3. The study therefore proceeded to investigate binding affinity of these three aptamers to EBOV NP using experimental analysis. Using MST analysis, the binding affinity of Apt1, Apt2 and Apt3 to EBOV NP was determined as 25, 56 and 140 nM, respectively ( and ). The study thus demonstrates a good correlation between the in silico prediction and experimental analysis.
Conclusion
A full length energy minimized 3D structure for EBOV NP that had a confidence coverage of >90% was successfully generated. Additionally, the selected aptamers used in this study were successfully modeled by RNAfold and RNAComposer to produce stable 3D RNA aptamer structures. Docking studies showed that Apt1 had the strongest affinity for the EBOV NP, followed by Apt3 and Apt2. The interaction between EBOV NP and Apt1 and Apt3 are likely to involve H bonds, salt-bridges and hydrophobic interactions, while the interaction with Apt2 is probably only through hydrophobic interactions. MD simulations (RMSD, RMSF and interaction energies) also ranked Apt1 as the strongest binder, followed by Apt2 and Apt3. This was due to increased stability, reduced fluctuation of the residues when bound to the EBOV NP and the amount of energy used to form a complex with the EBOV NP. Molecular docking also demonstrated that Apt1 binds EBOV NP with a stronger affinity than Apt2 and Apt3. However, based on the molecular docking studies, Apt3 was a stronger binder than Apt2. Overall, the in silico analysis thus suggest that the aptamers can be ranked as Apt1, Apt2 and Apt3 based on increasing binding strengths. These results agree with the MST analysis which also ranked the aptamers as Apt1, Apt2 and Apt3 in order of increasing binding strengths, with dissociation constants of 25 ± 2.84, 56 ± 2.76 and 140 ± 3.69 nM, respectively. This study demonstrates that these in silico approaches can be used to further investigate the binding of aptamers to their targets following identification by SELEX. This approach does not only contribute toward confirming the binding of the aptamer to the target, but it also provides information on where the aptamer possibly binds to the target. This information can be used to select the most appropriate aptamers for downstream applications in diagnostics.
Future perspectives
The application of the aptamers in the development of a diagnostic assay such as a lateral flow assay, followed by the validation of the assay.
| Abbreviations | ||
| EBOV | = | Ebola virus |
| EBOV NP | = | EBOV nucleoprotein |
| SELEX | = | Systemic Evolution of Ligands by Exponential enrichment |
| MST | = | microscale thermophoresis |
| MD | = | molecular dynamics simulations |
Supplemental Material
Download MS Word (40.1 MB)Acknowledgments
We also thank the South African Bioinformatics Institute (SANBI), UWC for the training in molecular modeling, docking, interaction analysis and molecular dynamic simulation for DRM. The FP7 WeNMR (project# 261572), H2020 West-Life (project# 675858) and the EOSC-hub (project# 777536) European e-Infrastructure projects are acknowledged for the use of their web portals, which make use of the EGI infrastructure with the dedicated support of CESNET-MetaCloud, INFN-PADOVA, NCG-INGRID-PT, TW-NCHC, SURFsara and NIKHEF and the additional support of the national GRID Initiatives of Belgium, France, Italy, Germany, the Netherlands, Poland, Portugal, Spain, UK, Taiwan and the US Open Science Grid. RC contributed to the first draft of the manuscript and the development of the study protocol. The authors would like to acknowledge the CHPC for the use of their resources to perform the molecular dynamic studies and the National Integrated Cyber infrastructure system.
Disclosure statement
No potential conflict of interest was reported by the author(s).
Additional information
Funding
References
- Adasme, M. F., Linnemann, K. L., Bolz, S. N., Kaiser, F., Salentin, S., Haupt, V. J., & Schroeder, M. (2021). PLIP 2021: Expanding the scope of the protein-ligand interaction profiler to DNA and RNA. Nucleic Acids Research, 49(W1), W530–W534. https://doi.org/10.1093/NAR/GKAB294
- Ahmad, B., Ashfaq, U. A., Rahman, M. U., Masoud, M. S., & Yousaf, M. Z. (2019). Conserved B and T cell epitopes prediction of Ebola virus glycoprotein for vaccine development: An immuno-informatics approach. Microbial Pathogenesis, 132, 243–253. https://doi.org/10.1016/J.MICPATH.2019.05.010
- Ali, M. T., & Islam, M. O. (2015). A highly conserved GEQYQQLR epitope has been identified in the nucleoprotein of Ebola virus by using an in silico approach. Advances in Bioinformatics, 2015, 278197–278198. https://doi.org/10.1155/2015/278197
- Antczak, M., Popenda, M., Zok, T., Sarzynska, J., Ratajczak, T., Tomczyk, K., Adamiak, R. W., & Szachniuk, M. (2016). New functionality of RNAComposer: Application to shape the axis of MiR160 precursor structure. Acta Biochimica Polonica, 63(4), 737–744. https://doi.org/10.18388/ABP.2016_1329
- Bai, Y., Li, Y., Zhang, D., Wang, H., & Zhao, Q. (2017). Enhancing the affinity of anti-human α-thrombin 15-Mer DNA aptamer and anti-immunoglobulin e aptamer by PolyT extension. Analytical Chemistry, 89(17), 9467–9473. https://doi.org/10.1021/ACS.ANALCHEM.7B02313/SUPPL_FILE/AC7B02313_SI_001PDF.
- Behrens, C., Binotti, B., Schmidt, C., Robinson, C. V., Chua, J. J. E., & Kühnel, K. (2013). Crystal structure of the human short coiled coil protein and insights into SCOC-FEZ1 complex formation. PLoS One, 8(10), e76355. https://doi.org/10.1371/JOURNAL.PONE.0076355
- Biesiada, M., Pachulska-Wieczorek, K., Adamiak, R. W., & Purzycka, K. J. (2016). RNAComposer and RNA 3D structure prediction for nanotechnology. Methods, 103, 120–127. https://doi.org/10.1016/j.ymeth.2016.03.010
- Biesiada, M., Purzycka, K. J., Szachniuk, M., Blazewicz, J., & Adamiak, R. W. (2016). Automated RNA 3D structure prediction with RNA composer. In Methods in molecular biology (Vol. 1490, pp. 199–215). Humana Press.
- Bloom, D. E., & Cadarette, D. (2019). Infectious disease threats in the twenty-first century: Strengthening the global response. Frontiers in Immunology, 10, 549. https://doi.org/10.3389/FIMMU.2019.00549
- Bradshaw, R. T., Patel, B. H., Tate, E. W., Leatherbarrow, R. J., & Gould, I. R. (2011). Comparing experimental and computational alanine scanning techniques for probing a prototypical protein-protein interaction. Protein Engineering, Design & Selection: PEDS, 24(1-2), 197–207. https://doi.org/10.1093/PROTEIN/GZQ047
- Broadhurst, M. J., Brooks, T. J. G., & Pollock, N. R. (2016). Diagnosis of Ebola virus disease: Past, present, and future. Clinical Microbiology Reviews, 29(4), 773–793. https://doi.org/10.1128/CMR.00003-16
- Brooks, B. R., Brooks, C. L., Mackerell, A. D., Nilsson, L., Petrella, R. J., Roux, B., Won, Y., Archontis, G., Bartels, C., Boresch, S., Caflisch, A., Caves, L., Cui, Q., Dinner, A. R., Feig, M., Fischer, S., Gao, J., Hodoscek, M., Im, W., … Karplus, M. (2009). CHARMM: The biomolecular simulation program. Journal of Computational Chemistry, 30(10), 1545–1614. https://doi.org/10.1002/JCC.21287
- Brown, J. H., Yang, Y., Reshetnikova, L., Gourinath, S., Süveges, D., Kardos, J., Hóbor, F., Reutzel, R., Nyitray, L., & Cohen, C. (2008). An unstable head-rod junction may promote folding into the compact off-state conformation of regulated myosins. Journal of Molecular Biology, 375(5), 1434–1443. https://doi.org/10.1016/j.jmb.2007.11.071
- Brown, S. P., & Muchmore, S. W. (2009). Large-scale application of high-throughput molecular mechanics with Poisson-Boltzmann surface area for routine physics-based scoring of protein-ligand complexes. Journal of Medicinal Chemistry, 52(10), 3159–3165. https://doi.org/10.1021/JM801444X
- Cao, C., Li, P., Liao, H., Wang, J., Tang, X., & Yang, L. (2020). Cys-functionalized AuNP substrates for improved sensing of the marine toxin STX by dynamic surface-enhanced Raman spectroscopy. Analytical and Bioanalytical Chemistry, 412(19), 4609–4617. https://doi.org/10.1007/S00216-020-02710-9
- Cataldo, R., Ciriaco, F., & Alfinito, E. (2018). A validation strategy for in silico generated aptamers. Computational Biology and Chemistry, 77, 123–130. https://doi.org/10.1016/J.COMPBIOLCHEM.2018.09.014
- CDC. (2022). CDC Transmission | Ebola Hemorrhagic Fever | CDC. https://www.cdc.gov/vhf/ebola/transmission/index.html
- Changula, K., Yoshida, R., Noyori, O., Marzi, A., Miyamoto, H., Ishijima, M., Yokoyama, A., Kajihara, M., Feldmann, H., Mweene, A. S., & Takada, A. (2013). Mapping of conserved and species-specific antibody epitopes on the Ebola virus nucleoprotein. Virus Research, 176(1-2), 83–90. https://doi.org/10.1016/J.VIRUSRES.2013.05.004
- Choi, S. J., & Ban, C. (2016). Crystal structure of a DNA aptamer bound to PvLDH elucidates novel single-stranded DNA structural elements for folding and recognition. Scientific Reports, 6(1), 34998. https://doi.org/10.1038/srep34998
- Chou, S. H., Chin, K. H., & Wang, A. H. J. (2005). DNA aptamers as potential anti-HIV agents. Trends in Biochemical Sciences, 30(5), 231–234. https://doi.org/10.1016/J.TIBS.2005.03.004
- Cleri, F., Lensink, M. F., & Blossey, R. (2021). DNA aptamers block the receptor binding domain at the spike protein of SARS-CoV-2. Frontiers in Molecular Biosciences, 8, 713003. https://doi.org/10.3389/FMOLB.2021.713003/FULL
- Cuesta-López, S., Menoni, H., Angelov, D., & Peyrard, M. (2011). Guanine radical chemistry reveals the effect of thermal fluctuations in gene promoter regions. Nucleic Acids Research, 39(12), 5276–5283. https://doi.org/10.1093/NAR/GKR096
- Darden, T., York, D., & Pedersen, L. (1993). Particle mesh Ewald: An N⋅log(N) method for Ewald sums in large systems. Journal of Chemical Physics, 98, 5648. https://doi.org/10.1063/1.464397
- Daura, X., Gademann, K., Jaun, B., Seebach, D., van Gunsteren, W. F., Mark, A. E., Rigault, A., Siegel, J., Harrowfield, J., & Chevrier, B. (1998). Peptide folding: When simulation meets experiment. Angewandte Chemie International Edition in English, 31, 1387–1404. https://doi.org/10.1002/(SICI)1521-3773(19990115)38:1/2
- Deng, B., Lin, Y., Wang, C., Li, F., Wang, Z., Zhang, H., Li, X. F., & Le, X. C. (2014). Aptamer binding assays for proteins: The thrombin example—A review. Analytica Chimica Acta, 837, 1–15. https://doi.org/10.1016/J.ACA.2014.04.055
- De Vries, S. J., Van Dijk, M., & Bonvin, A. M. J. J. (2010). The HADDOCK web server for data-driven biomolecular docking. Nature Protocols, 5(5), 883–897. https://doi.org/10.1038/nprot.2010.32
- Devi, A., & Chaitanya, N. S. N. (2021). Designing of peptide aptamer targeting the receptor-binding domain of spike protein of SARS-CoV-2: An in silico study. Molecular Diversity, 26(1), 157–169. https://doi.org/10.1007/s11030-020-10171-6
- Dong, S., Yang, P., Li, G., Liu, B., Wang, W., Liu, X., Xia, B., Yang, C., Lou, Z., Guo, Y., & Rao, Z. (2015). Insight into the Ebola virus nucleocapsid assembly mechanism: Crystal structure of Ebola virus nucleoprotein core domain at 1.8 Å resolution. Protein & Cell, 6(5), 351–362. https://doi.org/10.1007/S13238-015-0163-3/FIGURES/5
- Dunker, A. K., Babu, M. M., Barbar, E., Blackledge, M., Bondos, S. E., Dosztányi, Z., Dyson, H. J., Forman-Kay, J., Fuxreiter, M., Gsponer, J., Han, K.-H., Jones, D. T., Longhi, S., Metallo, S. J., Nishikawa, K., Nussinov, R., Obradovic, Z., Pappu, R. V., Rost, B., … Uversky, V. N. (2013). What’s in a name? Why these proteins are intrinsically disordered. Intrinsically Disordered Proteins, 1(1), e24157. https://doi.org/10.4161/idp.24157
- Ebola Detection Using Rapid Tests and ELISA Kits for Humans and Animals. (2022). https://www.prnewswire.com/news-releases/eboladetection-using-rapid-tests-and-elisa-kits-forhumans-and-animals-369183957.html
- Elskens, J. P., Elskens, J. M., & Madder, A. (2020). Chemical modification of aptamers for increased binding affinity in diagnostic applications: Current status and future prospects. International Journal of Molecular Sciences, 21(12), 4522. https://doi.org/10.3390/IJMS21124522
- Emami, N., Pakchin, P. S., & Ferdousi, R. (2020). Computational predictive approaches for interaction and structure of aptamers. Journal of Theoretical Biology, 497, 110268. https://doi.org/10.1016/J.JTBI.2020.110268
- Gall, T., Le; Romero, P. R., Cortese, M. S., Uversky, V. N., & Dunker, A. K. (2012). Intrinsic disorder in the protein data bank. Journal of Biomolecular Structure & Dynamics, 24(4), 325–342. https://doi.org/10.1080/07391102.2007.10507123
- Gao, J., Chen, Z., Mao, L., Zhang, W., Wen, W., Zhang, X., & Wang, S. (2019). Electrochemiluminescent aptasensor based on resonance energy transfer system between CdTe quantum dots and cyanine dyes for the sensitive detection of ochratoxin A. Talanta, 199, 178–183. https://doi.org/10.1016/J.TALANTA.2019.02.044
- Gao, S., Hu, B., Zheng, X., Cao, Y., Liu, D., Sun, M., Jiao, B., & Wang, L. (2016). Gonyautoxin 1/4 aptamers with high-affinity and high-specificity: From efficient selection to aptasensor application. Biosensors & Bioelectronics, 79, 938–944. https://doi.org/10.1016/J.BIOS.2016.01.032
- Gao, S., Hu, W., Zheng, X., Cai, S., & Wu, J. (2019). Functionalized aptamer with an antiparallel G-quadruplex: Structural remodeling, recognition mechanism, and diagnostic applications targeting CTGF. Biosensors & Bioelectronics, 142, 111475. https://doi.org/10.1016/j.bios.2019.111475
- Gelinas, A. D., Davies, D. R., & Janjic, N. (2016). Embracing proteins: Structural themes in aptamer–protein complexes. Current Opinion in Structural Biology, 36, 122–132. https://doi.org/10.1016/J.SBI.2016.01.009
- Gilson, M. K., & Zhou, H. X. (2007). Calculation of protein-ligand binding affinities. Annual Review of Biophysics and Biomolecular Structure, 36(1), 21–42. https://doi.org/10.1146/ANNUREV.BIOPHYS.36.040306.132550
- Goda, T., & Miyahara, Y. (2020). Label-free monitoring of histone acetylation using aptamer-functionalized field-effect transistor and quartz crystal microbalance sensors. Micromachines, 11(9), 820. https://doi.org/10.3390/MI11090820
- Goudarzi, M., Fazeli, M., Azad, M., & Seyedjavadi, S. S. (2015). Survey of clinical features, pathogenesis and therapeutic options for Ebola haemorrhagic fever. Archives of Advances in Biosciences, 6, 145–152. https://doi.org/10.22037/JPS.V6I3.9788
- GROMACS Gmx Hbond—GROMACS. (2019). 1 Documentation. https://manual.gromacs.org/2019.1/onlinehelp/gmx-hbond.html
- Gruber, A. R., Lorenz, R., Bernhart, S. H., Neuböck, R., & Hofacker, I. L. (2008). The Vienna RNA Websuite. Nucleic Acids Research, 36(Web Server issue), W70–W74. https://doi.org/10.1093/NAR/GKN188
- Hess, B., Kutzner, C., Van Der Spoel, D., & Lindahl, E. (2008). GROMACS 4: Algorithms for highly efficient, load-balanced, and scalable molecular simulation. Journal of Chemical Theory and Computation, 4(3), 435–447. https://doi.org/10.1021/CT700301Q.
- Hofacker, I. L., Fontana, W., Stadler, P. F., Bonhoeffer, L. S., Tacker, M., & Schuster, P. (1994). Fast folding and comparison of RNA secondary structures. Monatshefte für Chemie Chemical Monthly, 125(2), 167–188. https://doi.org/10.1007/BF00818163
- Hong, S. L., Xiang, M. Q., Tang, M., Pang, D. W., & Zhang, Z. L. (2019). Ebola virus aptamers: From highly efficient selection to application on magnetism-controlled chips. Analytical Chemistry, 91(5), 3367–3373. https://doi.org/10.1021/ACS.ANALCHEM.8B04623/ASSET/IMAGES/LARGE/AC-2018-04623F_0006.JPEG
- Hooft, R. W. W., Sander, C., & Vriend, G. (1996). Positioning hydrogen atoms by optimizing hydrogen-bond networks in protein structures. Proteins: Structure, Function, and Genetics, 26(4), 363–376. https://doi.org/10.1002/(SICI)1097-0134(199612)26:4
- Hooft, R. W. W., Vriend, G., Sander, C., & Abola, E. E. (1996). Errors in protein structures. Nature, 381(6580), 272–272. https://doi.org/10.1038/381272a0.
- Huang, J., Rauscher, S., Nawrocki, G., Ran, T., Feig, M., De Groot, B. L., Grubmüller, H., & MacKerell, A. D. (2017). CHARMM36m: An improved force field for folded and intrinsically disordered proteins. Nature Methods, 14(1), 71–73. https://doi.org/10.1038/NMETH.4067
- Huang, Y., Xu, L., Sun, Y., & Nabel, G. J. (2002). The assembly of Ebola virus nucleocapsid requires virion-associated proteins 35 and 24 and posttranslational modification of nucleoprotein. Molecular Cell, 10(2), 307–316. https://doi.org/10.1016/S1097-2765(02)00588-9
- Huo, S., Massova, I., & Kollman, P. A. (2002). Computational alanine scanning of the 1:1 human growth hormone-receptor complex. Journal of Computational Chemistry, 23(1), 15–27. https://doi.org/10.1002/JCC.1153
- Jo, S., Kim, T., Iyer, V. G., & Im, W. (2008). CHARMM-GUI: A web-based graphical user interface for CHARMM. Journal of Computational Chemistry, 29(11), 1859–1865. https://doi.org/10.1002/JCC.20945
- Judson, S., Prescott, J., & Munster, V. (2015). Understanding Ebola virus transmission. Viruses, 7(2), 511–521. https://doi.org/10.3390/V7020511
- Kaur, H., Bruno, J. G., Kumar, A., & Sharma, T. K. (2018). Aptamers in the therapeutics and diagnostics pipelines. Theranostics, 8(15), 4016–4032. https://doi.org/10.7150/THNO.25958
- Kelley, L. A., Mezulis, S., Yates, C. M., Wass, M. N., & Sternberg, M. J. E. (2015). The Phyre2 web portal for protein modeling, prediction and analysis. Nature Protocols, 10(6), 845–858. https://doi.org/10.1038/nprot.2015.053
- Kiley, M. P., Regnery, R. L., & Johnson, K. M. (1980). Ebola virus: Identification of virion structural proteins. The Journal of General Virology, 49(2), 333–341. https://doi.org/10.1099/0022-1317-49-2-333/CITE/REFWORKS
- Kilgour, M., Liu, T., Walker, B. D., Ren, P., & Simine, L. (2021). E2EDNA: Simulation protocol for DNA aptamers with ligands. Journal of Chemical Information and Modeling, 61(9), 4139–4144. https://doi.org/10.1021/ACS.JCIM.1C00696
- Kirchdoerfer, R. N., Saphire, E. O., & Ward, A. B. (2019). Cryo-EM structure of the Ebola virus nucleoprotein–RNA comple. Acta Crystallographica. Section F, Structural Biology Communications, 75(Pt 5), 340–347. https://doi.org/10.1107/S2053230X19004424
- Ksiazek, T. G., West, C. P., Rollin, P. E., Jahrling, P. B., & Peters, C. J. (1999). ELISA for the detection of antibodies to Ebola viruses. The Journal of Infectious Diseases, 179 Suppl 1(s1), S192–S198. https://doi.org/10.1086/514313
- Kuo, T. C., Lee, P. C., Tsai, C. W., & Chen, W. Y. (2013). Salt bridge exchange binding mechanism between streptavidin and its DNA aptamer – Thermodynamics and spectroscopic evidences. Journal of Molecular Recognition: JMR, 26(3), 149–159. https://doi.org/10.1002/JMR.2260
- Lam, S. D., Das, S., Sillitoe, I., & Orengo, C. (2017). An overview of comparative modelling and resources dedicated to large-scale modelling of genome sequences. Acta Crystallographica. Section D, Structural Biology, 73(Pt 8), 628–640. https://doi.org/10.1107/S2059798317008920
- Lee, J., Cheng, X., Swails, J. M., Yeom, M. S., Eastman, P. K., Lemkul, J. A., Wei, S., Buckner, J., Jeong, J. C., Qi, Y., Jo, S., Pande, V. S., Case, D. A., Brooks, C. L., MacKerell, A. D., Klauda, J. B., & Im, W. (2016). CHARMM-GUI input generator for NAMD, GROMACS, AMBER, OpenMM, and CHARMM/OpenMM simulations using the CHARMM36 additive force field. Journal of Chemical Theory and Computation, 12(1), 405–413. https://doi.org/10.1021/ACS.JCTC.5B00935
- Li, J., Zhu, J., Li, Y., Huang, T., & Li, Y. (2020). L-cysteine-modified magnetic microspheres for extraction and quantification of saxitoxin in rat plasma with liquid chromatography and tandem mass spectrometry. Journal of Separation Science, 43(12), 2429–2435. https://doi.org/10.1002/JSSC.202000070
- Liao, X., Fu, H., Yan, T., & Lei, J. (2019). Electroactive metal–organic framework composites: Design and biosensing application. Biosensors & Bioelectronics, 146, 111743. https://doi.org/10.1016/J.BIOS.2019.111743
- Lobanov, M. I., Bogatyreva, N. S., & Galzitskaia, O. V. (2008). Radius of gyration is indicator of compactness of protein structure. Molecular Biology, 42, 701–706.
- Lorenz, R., Bernhart, S. H., Höner zu Siederdissen, C., Tafer, H., Flamm, C., Stadler, P. F., & Hofacker, I. L. (2011). ViennaRNA package 2.0. Algorithms for Molecular Biology: AMB, 6(1), 26. https://doi.org/10.1186/1748-7188-6-26/TABLES/2
- Mairal, T., Ozalp, V. C., Lozano Sánchez, P., Mir, M., Katakis, I., & O'Sullivan, C. K. (2008). Aptamers: Molecular tools for analytical applications. Analytical and Bioanalytical Chemistry, 390(4), 989–1007. https://doi.org/10.1007/S00216-007-1346-4/FIGURES/5
- Makiala, S., Mukadi, D., De Weggheleire, A., Muramatsu, S., Kato, D., Inano, K., Gondaira, F., Kajihara, M., Yoshida, R., Changula, K., Mweene, A., Mbala-Kingebeni, P., Muyembe-Tamfum, J.-J., Masumu, J., Ahuka, S., & Takada, A. (2019). Clinical Evaluation of Quicknavitm-Ebola in the 2018 outbreak of Ebola virus disease in the Democratic Republic of the Congo. Viruses, 11(7), 589. https://doi.org/10.3390/v11070589.
- Martin, D. R., Sibuyi, N. R., Dube, P., Fadaka, A. O., Cloete, R., Onani, M., Madiehe, A. M., & Meyer, M. (2021). Aptamer-based diagnostic systems for the rapid screening of TB at the point-of-care. Diagnostics, 11(8), 1352. https://doi.org/10.3390/DIAGNOSTICS11081352
- Massova, I., & Kollman, P. A. (1999). Computational alanine scanning to probe protein-protein interactions: A novel approach to evaluate binding free energies. Journal of the American Chemical Society, 121(36), 8133–8143. https://doi.org/10.1021/JA990935J/SUPPL_FILE/JA990935J_S.PDF
- Maszota-Zieleniak, M., Zsila, F., & Samsonov, S. A. (2021). Computational insights into heparin-small molecule interactions: Evaluation of the balance between stacking and non-stacking binding modes. Carbohydrate Research, 507, 108390. https://doi.org/10.1016/J.CARRES.2021.108390
- Mathews, D. H., Disney, M. D., Childs, J. L., Schroeder, S. J., Zuker, M., & Turner, D. H. (2004). Incorporating chemical modification constraints into a dynamic programming algorithm for prediction of RNA secondary structure. Proceedings of the National Academy of Sciences of the United States of America, 101(19), 7287–7292. https://doi.org/10.1073/PNAS.0401799101
- Moran, Z., Rodriguez, W., Ahmadou, D., Soropogui, B., Magassouba, N. F., Kelly-Cirino, C., & Ben Amor, Y. (2020). Comparative performance study of three Ebola rapid diagnostic tests in Guinea. BMC Infectious Diseases, 20(1), 670. https://doi.org/10.1186/S12879-020-05339-2
- Moreira, I. S., Fernandes, P. A., & Ramos, M. J. (2010). Protein-protein docking dealing with the unknown. Journal of Computational Chemistry, 31(2), 317–342. https://doi.org/10.1002/JCC.21276
- Musyoka, T., & Bishop, Ö. T. (2019). South African Abietane diterpenoids and their analogs as potential antimalarials: Novel insights from hybrid computational approaches. Molecules, 24(22), 4036. https://doi.org/10.3390/MOLECULES24224036
- Nagatoishi, S., Isono, N., Tsumoto, K., & Sugimoto, N. (2011). Loop residues of thrombin-binding DNA aptamer impact G-quadruplex stability and thrombin binding. Biochimie, 93(8), 1231–1238. https://doi.org/10.1016/J.BIOCHI.2011.03.013
- Ni, S., Yao, H., Wang, L., Lu, J., Jiang, F., Lu, A., & Zhang, G. (2017). Chemical modifications of nucleic acid aptamers for therapeutic purposes. International Journal of Molecular Sciences, 18(8), 1683. https://doi.org/10.3390/IJMS18081683
- Niikura, M., Ikegami, T., Saijo, M., Kurane, I., Miranda, M. E., & Morikawa, S. (2001). Detection of Ebola viral antigen by enzyme-linked immunosorbent assay using a novel monoclonal antibody to nucleoprotein. Journal of Clinical Microbiology, 39(9), 3267–3271. https://doi.org/10.1128/JCM.39.9.3267-3271.2001/ASSET/2863C2CC-44F0-422C-9DD2-7155EB44E166/ASSETS/GRAPHIC/JM0911453004.JPEG
- Noda, T., Hagiwara, K., Sagara, H., & Kawaoka, Y. (2010). Characterization of the Ebola virus nucleoprotein-RNA complex. The Journal of General Virology, 91(Pt 6), 1478–1483. https://doi.org/10.1099/VIR.0.019794-0/CITE/REFWORKS
- Paissoni, C., Spiliotopoulos, D., Musco, G., & Spitaleri, A. (2015). GMXPBSA 2.1: A GROMACS tool to perform MM/PBSA and computational alanine scanning. Computer Physics Communications, 186, 105–107. https://doi.org/10.1016/j.cpc.2014.09.010
- PyMOL Setting:H_bond. (2022). [PyMOL documentation]. https://pymol.org/dokuwiki/doku.php?id=setting:h_bond
- Ramachandran, G. N., Ramakrishnan, C., & Sasisekharan, V. (1963). Stereochemistry of polypeptide chain configurations. Journal of Molecular Biology, 7(1), 95–99. https://doi.org/10.1016/S0022-2836(63)80023-6
- Reddy, M., Reddy, C., Rathore, R., Erion, M., Aparoy, P., Reddy, R., & Reddanna, P. (2014). Free energy calculations to estimate ligand-binding affinities in structure-based drug design. Current Pharmaceutical Design, 20(20), 3323–3337. https://doi.org/10.2174/13816128113199990604.
- Reusken, C., Niedrig, M., Pas, S., Anda, P., Baize, S., Charrel, R., Di Caro, A., Drosten, C., Fernandez-Garcia, M. D., Franco, L., Gunther, S., Leparc-Goffart, I., Martina, B., Pannetier, D., Papa, A., Sanchez-Seco, M. P., Vapalahti, O., & Koopmans, M. (2015). Identification of essential outstanding questions for an adequate European laboratory response to Ebolavirus Zaire West Africa 2014. Journal of Clinical Virology, 62, 124–134. https://doi.org/10.1016/J.JCV.2014.11.007
- Rhinehardt, K. L., Mohan, R. V., & Srinivas, G. (2015). Computational modeling of peptide–aptamer binding. Methods in Molecular Biology, 1268, 313–333. https://doi.org/10.1007/978-1-4939-2285-7_14
- Riccitelli, N. J., & Lupták, A. (2010). Computational discovery of folded RNA domains in genomes and in vitro selected libraries. Methods, 52(2), 133–140. https://doi.org/10.1016/J.YMETH.2010.06.005
- Rifai, E. A., Van Dijk, M., Vermeulen, N. P. E., Yanuar, A., & Geerke, D. P. (2019). A Comparative linear interaction energy and MM/PBSA study on SIRT1-ligand binding free energy calculation. Journal of Chemical Information and Modeling, 59(9), 4018–4033. https://doi.org/10.1021/ACS.JCIM.9B00609/SUPPL_FILE/CI9B00609_SI_002.ZIP
- Rohloff, J. C., Gelinas, A. D., Jarvis, T. C., Ochsner, U. A., Schneider, D. J., Gold, L., & Janjic, N. (2014). Nucleic acid ligands with protein-like side chains: Modified aptamers and their use as diagnostic and therapeutic agents. Molecular Therapy. Nucleic Acids, 3(10), e201. https://doi.org/10.1038/MTNA.2014.49
- Salentin, S., Schreiber, S., Haupt, V. J., Adasme, M. F., & Schroeder, M. (2015). PLIP: Fully automated protein–ligand interaction profiler. Nucleic Acids Research, 43(W1), W443–W447. https://doi.org/10.1093/NAR/GKV315
- Schubert, T., & Längst, G. (2015). Studying epigenetic interactions using microscale thermophoresis (MST). AIMS Biophysics, 2(3), 370–380. https://doi.org/10.3934/biophy.2015.3.370
- Semper, A. E., Broadhurst, M. J., Richards, J., Foster, G. M., Simpson, A. J. H., Logue, C. H., Kelly, J. D., Miller, A., Brooks, T. J. G., Murray, M., & Pollock, N. R. (2016). Performance of the GeneXpert Ebola assay for diagnosis of Ebola virus disease in Sierra Leone: A field evaluation study. PLoS Medicine, 13(3), e1001980. https://doi.org/10.1371/JOURNAL.PMED.1001980
- Shangguan, D., Tang, Z., Mallikaratchy, P., Xiao, Z., & Tan, W. (2007). Optimization and modifications of aptamers selected from live cancer cell lines. Chembiochem: A European Journal of Chemical Biology, 8(6), 603–606. https://doi.org/10.1002/cbic.200600532
- Sharawy, M., & Consta, S. (2018). Effect of the chemical environment of the DNA guanine quadruplex on the free energy of binding of Na and K Ions. The Journal of Chemical Physics, 149(22), 225102. https://doi.org/10.1063/1.5050534
- Shubham, S., Hoinka, J., Banerjee, S., Swanson, E., Dillard, J. A., Lennemann, N. J., Przytycka, T. M., Maury, W., & Nilsen-Hamilton, M. (2018). A 2’FY-RNA motif defines an aptamer for Ebolavirus secreted protein. Scientific Reports, 8(1), 12373. https://doi.org/10.1038/S41598-018-30590-8
- Sino Biological Inc. (2022). ELISA test (Elisa for Ebola). SinoBiological ELISA for Ebola Virus Disease (EVD) Available online: http://www.elisa-antibody.com/ELISA-test/elisa-for-ebola-hf.html
- Sugita, Y., Matsunami, H., Kawaoka, Y., Noda, T., & Wolf, M. (2018). Cryo-EM structure of the Ebola virus nucleoprotein–RNA complex at 3.6 Å resolution. Nature, 563(7729), 137–140. https://doi.org/10.1038/s41586-018-0630-0
- Sykes, J., Holland, B., & Charleston, M. (2022). Unattained geometric configurations of secondary structure elements in protein structural space. Journal of Structural Biology, 214, 107870. https://doi.org/10.1016/j.jsb.2022.107870
- Tan, S. Y., Acquah, C., Sidhu, A., Ongkudon, C. M., Yon, L. S., & Danquah, M. K. (2016). SELEX modifications and bioanalytical techniques for aptamer–target binding characterization. Critical Reviews in Analytical Chemistry, 46(6), 521–537. https://doi.org/10.1080/10408347.2016.1157014
- Tao, X., Wang, X., Liu, B., & Liu, J. (2020). Conjugation of antibodies and aptamers on nanozymes for developing biosensors. Biosensors & Bioelectronics, 168, 112537. https://doi.org/10.1016/J.BIOS.2020.112537
- Uversky, V. N. (2017). How to predict disorder in a protein of interest. Methods in Molecular Biology, 1484, 137–158. https://doi.org/10.1007/978-1-4939-6406-2_11
- Vainer, R., Cohen, S., Shahar, A., Zarivach, R., & Arbely, E. (2016). Structural basis for P53 Lys120-acetylation-dependent DNA-binding mode. Journal of Molecular Biology, 428(15), 3013–3025. https://doi.org/10.1016/J.JMB.2016.06.009
- Vajda, T., & Perczel, A. (2016). The clear and dark sides of water: Influence on the coiled coil folding domain. Biomolecular Concepts, 7(3), 189–195. https://doi.org/10.1515/BMC-2016-0005/MACHINEREADABLECITATION/RIS
- Valdés-Tresanco, M. S., Valdés-Tresanco, M. E., Valiente, P. A., & Moreno, E. (2021). Gmx_MMPBSA: A new tool to perform end-state free energy calculations with GROMACS. Journal of Chemical Theory and Computation, 17(10), 6281–6291. https://doi.org/10.1021/ACS.JCTC.1C00645/SUPPL_FILE/CT1C00645_SI_001.PDF
- Van Vuren, P. J., Grobbelaar, A., Storm, N., Conteh, O., Konneh, K., Kamara, A., Sanne, I., & Paweska, J. T. (2015). Comparative evaluation of the diagnostic performance of the prototype cepheid GeneXpert Ebola assay. Journal of Clinical Microbiology, 54(2), 359–367. https://doi.org/10.1128/JCM.02724-15
- Van Zundert, G. C. P., Rodrigues, J. P. G. L. M., Trellet, M., Schmitz, C., Kastritis, P. L., Karaca, E., Melquiond, A. S. J., Van Dijk, M., De Vries, S. J., & Bonvin, A. M. J. J. (2016). The HADDOCK2.2 web server: User-friendly integrative modeling of biomolecular complexes. Journal of Molecular Biology, 428(4), 720–725. https://doi.org/10.1016/J.JMB.2015.09.014
- Vriend, G. (1990). WHAT IF: A molecular modeling and drug design program. Journal of Molecular Graphics, 8(1), 52–56, 29. https://doi.org/10.1016/0263-7855(90)80070-V
- Waddad, A. Y., Ramharack, P., Soliman, M. E. S., & Govender, T. (2019). Grafted hyaluronic acid N-acetyl-l-methionine for targeting of LAT1 receptor: In-silico, synthesis and microscale thermophoresis studies. International Journal of Biological Macromolecules, 125, 767–777. https://doi.org/10.1016/J.IJBIOMAC.2018.12.104
- Wang, C., Greene, D., Xiao, L., Qi, R., & Luo, R. (2017). Recent developments and applications of the MMPBSA method. Frontiers in Molecular Biosciences, 4, 87. https://doi.org/10.3389/FMOLB.2017.00087/BIBTEX
- Wang, T., Chen, L., Chikkanna, A., Chen, S., Brusius, I., Sbuh, N., & Veedu, R. N. (2021). Development of nucleic acid aptamer-based lateral flow assays: A robust platform for cost-effective point-of-care diagnosis. Theranostics, 11(11), 5174–5196. https://doi.org/10.7150/thno.56471
- Wang, X., Gao, X., He, J., Hu, X., Li, Y., Li, X., Fan, L., & Yu, H. Z. (2019). Systematic truncating of aptamers to create high-performance graphene oxide (GO)-based aptasensors for the multiplex detection of mycotoxins. The Analyst, 144(12), 3826–3835. https://doi.org/10.1039/C9AN00624A
- WHO Ebola Outbreak. (2021). North Kivu. https://www.who.int/emergencies/situations/ebola-2021-north-kivu
- WHO. (2022). Ebola Virus Disease. https://www.who.int/news-room/fact-sheets/detail/ebola-virus-disease
- WHO Laboratory Diagnosis of Ebola Virus Disease. (2022). https://apps.who.int/iris/bitstream/handle/10665/134009/WHO_EVD_GUIDANCE_L%20AB_14.1;jsessionid=A139094B4D95C076BB7FBC7032AD1F1D?sequence=1> 2014 (accessed on 19 January 2022)
- Xie, Y. C., Eriksson, L. A., & Zhang, R. B. (2020). Molecular dynamics study of the recognition of ATP by nucleic acid aptamers. Nucleic Acids Research, 48(12), 6471–6480. https://doi.org/10.1093/NAR/GKAA428
- Yan, A. C., & Levy, M. (2018). Aptamer-mediated delivery and cell-targeting aptamers: Room for improvement. Nucleic Acid Therapeutics, 28(3), 194–199. https://doi.org/10.1089/NAT.2018.0732
- Zhang, H., Zhang, C., Li, Z., Li, C., Wei, X., Zhang, B., & Liu, Y. (2019). A new method of RNA secondary structure prediction based on convolutional neural network and dynamic programming. Frontiers in Genetics, 10, 467. https://doi.org/10.3389/FGENE.2019.00467/BIBTEX
- Zhao, L., Wang, J., Su, D., Zhang, Y., Lu, H., Yan, X., Bai, J., Gao, Y., & Lu, G. (2020). The DNA controllable peroxidase mimetic activity of MoS2 nanosheets for constructing a robust colorimetric biosensor. Nanoscale, 12(37), 19420–19428. https://doi.org/10.1039/D0NR05649A
- Zhu, G., Zhang, H., Jacobson, O., Wang, Z., Chen, H., Yang, X., Niu, G., & Chen, X. (2017). Combinatorial screening of DNA aptamers for molecular imaging of HER2 in cancer. Bioconjugate Chemistry, 28(4), 1068–1075. https://doi.org/10.1021/ACS.BIOCONJCHEM.6B00746
- Zhu, X., Zhang, Y., Liu, M., & Liu, Y. (2021). 2D titanium carbide MXenes as emerging optical biosensing platforms. Biosensors & Bioelectronics, 171, 112730. https://doi.org/10.1016/J.BIOS.2020.112730
- Zuker, M. (2003). Mfold web server for nucleic acid folding and hybridization prediction. Nucleic Acids Research, 31(13), 3406–3415. https://doi.org/10.1093/nar/gkg595