
Abstract
Background
Diabetic nephropathy (DN) has become the major cause of end-stage kidney disease and is associated to an extremely high cardiovascular (CV) risk.
Methods
We screened 318 DN patients for 23 SNPs in four glucose transporters (SLC2A1, SLC2A2, SLC5A1 and SLC5A2) and in KCNJ11 and ABCC8, which participate in insulin secretion. Regression models were utilised to identify associations with renal parameters, atherosclerosis measurements and CV events. In addition, 506 individuals with normal renal function were also genotyped as a control group.
Results
In the patient’s cohort, common carotid intima media thickness values were higher in carriers of ABCC8 rs3758953 and rs2188966 vs. non-carriers [0.78(0.25) vs. 0.72(0.22) mm, p < 0.05 and 0.79(0.26) vs. 0.72(0.22) mm, p < 0.05], respectively. Furthermore, ABCC8 rs1799859 was linked to presence of plaque in these patients [1.89(1.03-3.46), p < 0.05]. Two variants, SLC2A2 rs8192675 and SLC5A2 rs9924771, were associated with better [OR = 0.49 (0.30-0.81), p < 0.01] and worse [OR = 1.92 (1.15-3.21), p < 0.05] CV event-free survival, respectively. With regard to renal variables, rs841848 and rs710218 in SLC2A1, as well as rs3813008 in SLC5A2, significantly altered estimated glomerular filtration rate values [carriers vs. non-carriers: 30.41(22.57) vs. 28.25(20.10), p < 0.05; 28.95(21.11) vs. 29.52(21.66), p < 0.05 and 32.03(18.06) vs. 28.14(23.06) ml/min/1.73 m2, p < 0.05]. In addition, ABCC8 rs3758947 was associated with higher albumin-to-creatinine ratios [193.5(1139.91) vs. 160(652.90) mg/g, p < 0.05]. The epistasis analysis of SNP-pairs interactions showed that ABCC8 rs3758947 interacted with several SNPs in SLC2A2 to significantly affect CV events (p < 0.01). No SNPs were associated with DN risk.
Conclusions
Polymorphisms in genes determining glucose homeostasis may play a relevant role in renal parameters and CV-related outcomes of DN patients.
Introduction
Cardiovascular disease (CVD) is responsible for over sixty percent of the life-years lost from diabetes. Indeed, the risk of dying from CVD is two times higher for diabetics than for non-diabetic subjects [Citation1]. Up to 40% of patients with diabetes develop diabetic nephropathy (DN), which has become the major cause of end-stage kidney disease (ESKD) worldwide, primarily because of the global obesity pandemic [Citation2]. These DN patients are at such an elevated cardiovascular (CV) risk that is far more likely for them to die from CVD than from the deterioration of their renal function. The mechanisms underlying the solid link between DN and CVD are, however, poorly understood, and traditional CV risk factors, although commonplace in these patients, do not fully account for the observed elevated risk [Citation3].
Diabetes has been consistently linked to macro and microvascular complications, mainly caused by hyperglycaemia, whose persistence results in increasing reactive oxygen species (ROS) generation, disruption of cell functioning and formation of abnormal proteins [Citation4]. This hyperglycaemia is a key CV risk factor for patients with type 2 diabetes mellitus (T2DM). It has been reported that lowering of glucose levels reduce CV events (CVE) provided that (i) treatment is initiated early, (ii) hypoglycaemia is avoided and (iii) therapeutic regimes are individualised [Citation5–7], although there are also some contradictory reports [Citation8,Citation9]. The advent of the SGLT2 (sodium/glucose cotransporter 2) inhibitors (SGLT2i), which increase urinary excretion of glucose as well as decreasing blood pressure (BP), has provided a major advance for the prevention and treatment of diabetes, CKD, and CV events, since the obtained decrease of albuminuria, prevents estimated glomerular filtration rate (eGFR) decline and reduces CV mortality [Citation10,Citation11].
A critical step in glucose homeostasis is its transport across the cells of the proximal tubule through two different classes of transporters, namely glucose transporters GLUT1 and 2, encoded by the SLC2A1-2 genes, and sodium-dependent glucose transporters SGLT1 and 2, encoded by SLC5A1-2 [Citation12] (Supplementary Figure S1). Several SNPs in these loci, such as rs9934336, rs3813008, rs371505974 or rs200406921, have been related to impaired glucose homeostasis [Citation13], the risk of DN [Citation14,Citation15] and CVD [Citation16]. In addition, two proteins, namely Kir6.2 (potassium channel subunit) (KCNJ11 gene) and SUR1 (sulfonylurea receptor-1) (ABCC8 gene), form together an ATP-sensitive potassium channel that is key in glucose-induced insulin secretion by pancreatic beta cells (Supplementary Figure S1). Genetic variability in these two genes, most notably rs5219, has also been associated with glucose imbalance, T2DM and CVD [Citation17–20].
Our aim was to target a set of genes that interact with each other to enable glucose reabsorption and insulin secretion by determining whether 23 common SNPs in their loci were associated with CV traits and events in DN patients. An additional objective was to identify variants related to DN risk.
Patients and methods
Participants
The present study was performed on patients and controls previously included in the NEFRONA repository. This was a collection of biological samples from Spanish CKD patients and healthy individuals who were recruited between 2010 and 2011 and were followed for 4 years to register atherosclerosis measurements and CV traits and events [Citation21]. For this work, we focussed on a subgroup of CKD patients with DN. Our study was approved by the Scientific Committee of the NEFRONA group, which allowed us to screen samples from 318 patients with DN (stage 3 CKD or higher) and 506 controls with normal renal function for variants in genes related to glucose homeostasis.
Samples of the NEFRONA repository were analysed in this work if they corresponded to (i) patients over 18 years of age with T2DM (fasting glucose >126 mg/dL or non-fasting glucose >200 mg/dL) and deterioration of kidney function [eGFR <60 ml/min/1.73 m2 and >300 mg albumin (or >500 mg protein) in 24-hour urine]; or (ii) healthy subjects over 18 years of age with eGFR > 60 ml/min/1.73 m.2 The diagnosis of classical diabetic nephropathy was made using clinical criteria (proteinuria higher than 500 mg/day or microalbuminuria higher than 300 mg/day associated with documented diabetic retinopathy (confirmed by examining the back of the eye). A kidney biopsy was carried out to confirm the diagnosis in those cases where the patient did not present diabetic retinopathy and proteinuria was higher than 1 g/day, after patient consent was obtained. Other possible diagnoses were adequately ruled out using clinical protocols for glomerulopathy and immunological screening. NEFRONA exclusion criteria included previous history of any CV event, transplantation of any organ, carotid artery surgery, active infection, pregnancy, or life expectancy below one year.
A schematic representation of the study design is depicted in Supplementary Figure S2.
Clinical variables
Diagnosis and staging of the CKD patients was carried out with the Kidney Disease Improving Global Outcomes (KDIGO) classification and the CONSORTIUM-CKD equation (www.kidneyriskfailure.org). Renal function was estimated with The Modification of Diet in Renal Disease (MDRD) equation.
High blood pressure was diagnosed according to 2013 ESH/ESC Guidelines for the management of arterial hypertension. Dyslipidemia diagnosis was made using the criteria of 2016 European Guidelines on Cardiovascular Disease prevention in clinical practice.
The presence of atheromatous plaques was assessed by arterial ultrasound as previously described [Citation22] in ten different territories according to the Mannheim IMT Consensus guidelines [Citation23] and the American Society of Echocardiography [Citation24]. Three longitudinal measurements of intima media thickness (IMT) were carried out in the right and left common carotid arteries (CC). Atheromatous plaques were considered when IMT was >1.5 mm. CV risk was evaluated in a 4-year follow-up (54 months) during which the likelihood of experiencing CV events was recorded. Events considered were acute myocardial infarction, acute coronary syndrome, coronary catheterisation requiring angioplasty, coronary bypass, typical angina with positive stress tests, sudden death, cerebrovascular accident, and peripheral arterial disease. Aneurysm was also observed in the larger NEFRONA cohort of CKD patients, but no individuals with DN analysed in this work experienced this event.
All subjects gave written informed consent for their participation in the study, which was approved by the Ethics Committee of the Badajoz University Hospital (No 18002909), and it was carried out in accordance with the Declaration of Helsinki and its subsequent revisions.
Genotyping
DNA for the genotyping analyses was obtained from whole-blood samples by QIAamp DNA Blood kits (Qiagen, Valencia, CA, USA) and stored at 4 °C in sterile plastic vials until analysis. Twenty-three SNPs in four genes coding for glucose transporters (SLC2A1, SLC2A2, SLC5A1 and SLC5A2) and in two genes (KCNJ11 and ABCC8) key for insulin secretion were studied. These SNPs were selected based on previous reports stating their influence on glucose homeostasis, T2DM, DN and/or associated CV traits [Citation13,Citation14,Citation25–36]. Genetic analyses were carried out by allelic discrimination using a customised panel (TaqMan® OpenArray Genotyping) on a QuantStudio™ 12 K Flex Real-Time PCR System (Life Technologies, Carlsbad, CA, USA) at the Centro Nacional de Genotipado-Instituto de Salud Carlos III (CeGen-ISCIII; Madrid, Spain). Each run included a trio of Coriell Institute samples with known genotypes. Individuals with missing genotypes (ranging from 0.2% to 1.2% depending on the SNP) were ruled out in each analysis
Statistical analyses
Categorical variables were compared with Chi-square test, whilst differences between continuous variables were assessed by T-Student’s/Mann–Whitney or ANOVA/Kruskal–Wallis, depending on the normality of the data and the numbers of groups compared. The effect of SNPs was evaluated by regression analyses adjusting by confounding variables that were selected based on univariate tests or by clinical criteria. Significant covariates used included demographics (age, sex, body-mass index) and clinical parameters, namely hyperlipidaemia, hypertension, and CKD stage. A dominant model of inheritance was chosen for the genetic analyses, as the resulting comparison groups were the most balanced in terms of size, as conducted in previous studies of our group with CKD patients [Citation37,Citation38]. The CV impact of the SNPs was analysed by Kaplan–Meier curves, comparing the different genotypes with the log-rank test. SNPs with p-values lower than 0.1 were included in Cox regression models to establish their effect after controlling for traditional CV risk factors. Patients were followed up until the earliest of CV event, death or end of study.
Gene-gene interaction (epistasis) analyses were performed by using log-likelihood ratio tests adjusted by relevant covariates in a dominant model. In the resulting plots, the diagonal line contains the P values from likelihood ratio test for the crude effect of each SNP, which are sorted by their genomic position. The upper triangle in the matrix contains the P values for the interaction (epistasis) log-likelihood ratio test. The lower triangle contains the P values from likelihood ratio test comparing the two-SNP additive likelihood to the best of the single-SNP models. The network visualisation of the gene-gene interactions was generated by Cytoscape software package v. 3.9.1.
Statistical analyses were performed with the SNPassoc (2.0-11) in the R environment v. 4.1.3 and with IBM SPSS software (SPSS Inc., Chicago, IL, USA, v. 22.0).
Results
Main clinical and demographic characteristics of the population are described in . Median age (and interquartile range) was 57 (17) years for the control group and 63 (18) years for DN patients. The percentage of males was predominant in both groups (54.2 and 65.4%, respectively). Patients had significantly higher values of blood pressure and CCIMT and a higher incidence of hypertension, hyperlipidaemia, atherosclerotic plaques, and CV events experienced in the 4-year follow-up [median follow-up = 46.46 (4.11) months].
Table 1. Demographic and clinical characteristics of the population of study.
Two out of the 23 SNPs, rs371505974 and rs200406921, were monomorphic in our population and hence were ruled out from further analyses. The remaining 21 SNPs did not show deviations from the Hardy-Weinberg equilibrium (p > 0.05 in all cases). The percentage of missing genotype data ranged from 0.2 to 1.2 depending on the specific SNP. Supplementary Table S1 summarises the main characteristics and predicted consequences of the SNPs studied. Statistical power calculations were carried out considering an arbitrary effect size of 2.0 for genetic variants and a type-I error of 0.05. With the reported incidence of the disease in the population [Citation39] and the available sample size available, the statistical power of the study to identify genetic associations ranged from 0.821 to 0.944 depending on the minor allele frequency (Quanto v1.2.4, USC Los Angeles, USA)
Risk analysis
Out of the 21 SNPs assayed, carriers of the rs3758947 A-allele in the ABCC8 gene were at higher risk of DN than non-carriers [OR = 1.38 (1.02-1.89), p < 0.05]. However, after controlling for meaningful covariates, namely age, sex and BMI, the association lost statistical significance. None other risk associations were observed. Supplementary Table S2 shows the results of the risk analysis obtained for all the SNPs.
Associations with renal function
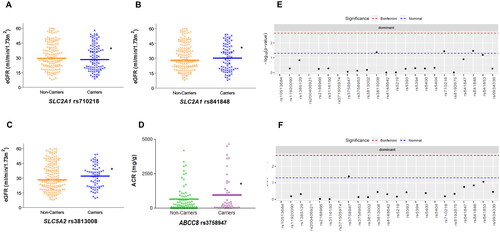
We then analysed the cohort of 318 DN patients to identify associations with renal parameters. Linear regression analysis controlling for sex, hyperlipidaemia, CCIMT and CKD stage, showed that two SNPs in SLC2A1 (coding for the GLUT1 transporter), rs841848 and rs710218, and the rs3813008 variant in SLC5A2 (coding for SGLT2) were associated with eGFR values. Median (and interquartile range) values of carriers vs. non-carriers for these 3 SNPs were 30.41 (22.57) vs. 28.25 (20.10), p < 0.05; 28.95 (21.11) vs. 29.52 (21.66), p < 0.05 and 32.03 (18.06) vs. 28.14 (23.06) ml/min/1.73 m2, p < 0.05, respectively (). With regard to proteinuria, measured as albumin-to-creatinine ratios, ABCC8 rs3758947 was significantly associated with higher median values in the DN patients [193.5 (1139.91) vs. 160 (652.90) mg/g creatinine, p < 0.05; ]. Supplementary Table S3 shows the detailed statistical model obtained for these associations.
Figure 1. Estimated glomerular filtration rate (eGFR) values according to the presence of rs710218 (A), rs841848 (B) and rs3813008 (C) variants, and albumin-to-creatinine ratios (ACR) distributed by rs3758947 genotypes (D) in patients with diabetic nephropathy. Manhattan plots show the p-value for the association of all the SNPs studied regarding eGFR (E) and ACR (F). *p < 0.05.
Associations with atherosclerosis parameters and cardiovascular events
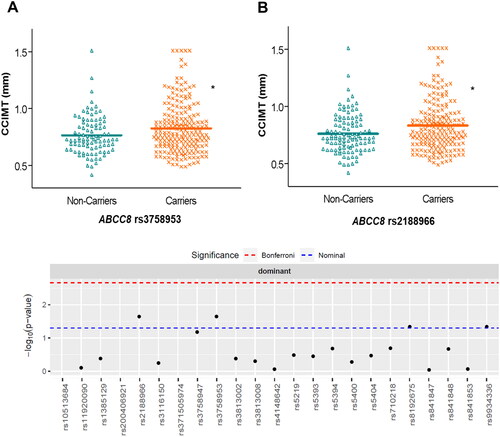
We examined genetic associations with measurements of atherosclerosis in the DN patients. After adjusting linear regression models for confounding factors (age, sex, hyperlipidaemia, hypertension, BMI and CKD stage), we observed that CCIMT median values were higher in carriers of two SNPs in ABCC8, rs3758953 and rs2188966, compared with wild-type subjects [0.78 (0.25) vs. 0.72 (0.22) mm, p < 0.05 and 0.79 (0.26) vs. 0.72 (0.22) mm, p < 0.05, respectively] ( and Supplementary Table S4). We also found that ABCC8 rs1799859 was associated with higher [OR = 1.89 (1.03-3.46), p < 0.05] risk of atherosclerotic plaque after controlling for confounding variables, whilst KCNJ11 rs5219 showed a trend towards lower risk [OR = 0.54 (0.29-1.03), p < 0.05].
Figure 2. Distribution of common carotid intima media thickness (CCIMT) values according to different genotypes of ABCC8 in patients with diabetic nephropathy. The Manhattan plot shows the p-value for the association of all the SNPs studied. *p < 0.05.
Regarding CV events, DN increased their incidence after adjusting for traditional risk factors. A total of 65 patients (20.4%) experienced these events in the four-year follow-up compared with only 9 subjects (1.8%) in the control group [OR = 5.39 (1.61-18.00), p < 0.05]. The proportion of patients affected within the DN cohort is inferior to other series reported, which can be explained by the fact that none of our patients had experienced CV events prior to their enrolment. Demographic and clinical features of DN patients who experienced or not CV events are shown in .
Table 2. Variables of interest in patients of diabetic nephropathy experiencing or not cardiovascular events.
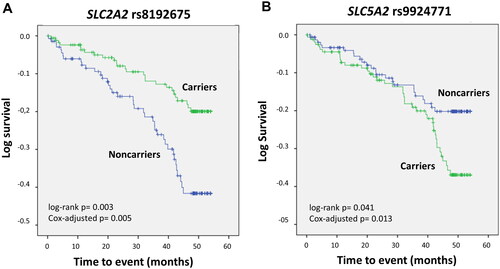
Genetic analyses to determine associations with CV events in the control group could not be tested, as only 9 subjects experienced CV events. Survival analysis in the DN cohort revealed two SNPs with a significant impact. SLC2A2 rs8192675 was associated with an increased estimated CV event-free median (interquartile range) survival [49.19 (0.96) months compared with 44.69 (1.38) for the wild-type genotype; log-rank p < 0.01]. In contrast, patients harbouring the SLC5A2 rs9924771 SNP presented lower survival than non-carriers did [46.27 (1.18) vs. 48.40 (1.11) months, log-rank p < 0.05]. shows Kaplan-Meier curves depicting event-free survival for each of the mentioned genotypes. The statistical significance of these associations was maintained after controlling for traditional CV risk factors in Cox regression models, which resulted in OR values of 0.49 (0.30-0.81), p < 0.01 and 1.92 (1.15-3.21), p < 0.05 for rs8192675 and rs9924771, respectively.
Figure 3. Kaplan–Meier curves depicting cardiovascular event-free survival in patients with diabetic nephropathy carrying the SLC2A2 rs8192675 (A) or SLC5A2 rs9924771 (B) polymorphisms.
shows the estimated impact on event-free survival of a regression model including both SNPs simultaneously.
Table 3. Cox regression analysis showing the effect of rs8192675 and rs9924771 on cardiovascular event-free survival in diabetic nephropathy patients.
Multiple-SNP analysis
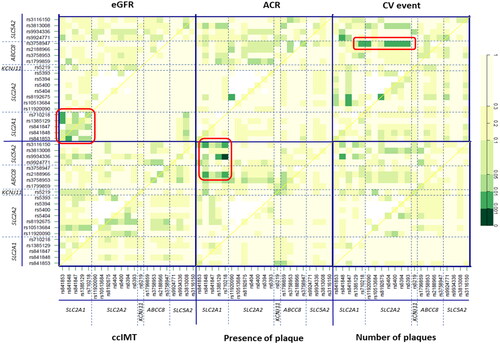
We finally conducted an epistasis study to evaluate interactions between SNP pairs in the genes involved in glucose homeostasis. In relation to parameters of renal function, a quadrant corresponding to significant associations between pairs located within the SLC2A1 gene locus and eGFR estimation was clearly noticeable (p-values ranging between <0.05 and <0.01; ). In addition, the rs8192675-rs11920090 pair in SLC2A2 showed a far higher influence on albumin-to-creatinine (ACR) ratios (p < 0.01) than that of these SNPs by separate (). Regarding CV events, ABCC8 rs3758947 was observed to interact significantly (p-values <0.01) with several consecutive polymorphisms in SLC2A2 (Supplementary Table S5 shows specific p-values for all the SNP-SNP interactions considering CV risk). Finally, the presence of plaque was mostly associated with SNP pairs in the top left quadrants, thus indicating interactions between SLC5A2-SLC2A1 and SLC5A2-ABCC8. The highest significance was observed for the SLC5A2 rs9934336-SLC2A1 rs710218 pair in relation to the presence of plaque (p < 0.001; ). Supplementary Figure S3 shows a network visualisation of the discussed interactions.
Figure 4. Effect of interactions between SNPs in glucose homeostasis genes on several clinical phenotypes in CKD patients. Significant hits discussed in the text are highlighted in red. The diagonal line contains the P values from likelihood ratio test for the crude effect of each SNP, which are sorted by their genomic position. The upper triangle in the matrix contains the P values for the interaction (epistasis) log-likelihood ratio test. Finally, the lower triangle contains the P values from likelihood ratio test comparing the two-SNP additive likelihood to the best of the single-SNP models. eGFR: estimated glomerular filtration rate (ml/min/1.73 m2); ACR: albumin-to-creatinine ratio (mg/g); CV: cardiovascular; CCIMT: common carotid intima media thickness.
Discussion
Patients with DN not only show a disproportionately higher risk of CVD than the general population, but this risk is also greatly elevated in comparison with diabetics who have normal renal function [Citation40]. Given the limitations of current DN biomarkers such as albumin urinary excretion, the identification of new markers of the disease, particularly for its CV implications, has been pointed out as essential for risk stratification, individualisation of treatment and identification of novel therapeutic targets [Citation41–43]. In the present study, we have focussed on the role that variants in loci related to glucose homeostasis may play in this regard.
Our findings show that several SNPs in the KCNJ11 and ABCC8 genes, both coding for subunits of the ATP-sensitive potassium channel (KATP) that participates in insulin secretion [Citation44], were associated with subclinical atherosclerosis (as shown by CCIMT values) and with the presence of atherosclerotic plaque in the CKD patients. These two genes, which are located on the same chromosome locus 11p15.1, are only 4.5 kb apart and indeed genetic variants in both loci have been reported to cause similar phenotypes. Several SNPs in KCNJ11 were initially reported to be linked to T2DM susceptibility [Citation45] and subsequently to vascular-related complications of T2DM such as hypertension [Citation46], coronary artery disease (CAD) [Citation47] or diabetic retinopathy [Citation48]. We observed that rs5219, a nonsynonymous (Glu23Lys) SNP, showed a trend towards lower presence of plaque. In line with this finding, the variant allele in this locus has also been related to decreased risk of CVD, both in the general population [Citation49] and in T2DM patients [Citation50]. However, no previous studies have been carried out in DN patients, nor have there been studies aimed to determine the impact of rs5219 on atherosclerosis measurements.
According to our findings, the most significant gene for atherosclerosis was ABCC8, with two relevant variants in the 5′-UTR region (rs2188966 and rs3758953) and a synonymous AGG1273AGA SNP (rs1799859). This locus is also known to harbour numerous mutations reportedly affecting insulin secretion through impairment of the KATP channel, which may eventually lead to hyperglycaemia and a wide spectrum of T2DM phenotypes [Citation51]. Specifically, the SNPs studied in the present work had been previously associated with T2DM susceptibility [Citation25,Citation52] and response to sulfonylurea treatment [Citation53]. Only a very recent study by Gurzeler et al. [Citation54] has analysed the effect of one other ABCC8 SNP (Glu1506Lys) on atherosclerosis, although this was published after the completion of our work and hence we could not include the SNP in our analyses. These authors found that the 1506Lys variant impaired glucose tolerance and increased arterial inflammation, thus promoting a vulnerable atherosclerotic plaque phenotype in rodents. It is tempting to speculate that other SNPs in the same locus, such as those described herein, may also promote plaque formation through similar mechanisms.
Two SNPs, rs8192675 and rs9924771, displayed a significant impact on CV event-free survival after other traditional risk factors were considered. The first is an intronic variant (transcript NM_000340.2:c.612 + 54T > C) in SLC2A2, which encodes the facilitated glucose transporter GLUT2, and that has been consistently linked to better response to metformin monotherapy in T2DM patients [Citation27,Citation55]. Available gene expression data point to a reduction in GLUT2 expression caused by this rs8192675 [Citation55], but its full functional consequences are still unclear and hence we cannot establish a direct biochemical connection with the observed improved survival. One study has reported that the minor allele was associated with lower levels of high-density lipoproteins in hypertensive subjects, and the authors suggested this could increase metabolic risk of CVD, although this was not confirmed [Citation56]. In contrast, in our study, the minor allele was associated with a 5-month improved CV event-free survival. It should be noted that we did not observe the reported impact of rs8192675 on HDL in our cohort (data not shown). Hence, additional in vitro studies are necessary to unveil other possible mechanisms, e.g. effect on glycaemia or insulin secretion, that may explain why this SNP impacts CV outcomes significantly in CKD patients [Citation57]. The second polymorphism, rs9924771, is located in an intronic region of SLC5A2, a gene that codes for the SGLT2 transporter. This is a tag-SNP, meaning that it represents variability of a whole region in the gene locus [Citation28]. To our knowledge, there have been no studies on the effect of this variant on CV outcomes in CKD. On the other hand, and consistent with our results, variability in the SLC5A2 gene has been recently regarded as an important locus for CVD in a large study with over 400,000 participants [Citation16]. The underlying mechanism remains elusive though, as neither these authors, nor the present work, could find significant associations with atherosclerotic measurements. Furthermore, other reports have not found an impact of rs9924771 on insulin release, plasma glucose or plasma glucagon concentrations [Citation28,Citation58], although it should be noted that we did observe a trend towards higher HbA1c levels in rs9924771 carriers (p = 0.05, data not shown). In any case, even though rs8192675 and rs9924771 correlate with CV outcomes in DN patients, causality is still to be confirmed until an explanatory mechanism has been identified.
The analysis of the effect of SNP pairs interactions on CV traits revealed an intriguing association between ABCC8 rs3758947 and several SNPs mainly located in SLC2A2, which modified the risk of CV events. To our knowledge, there are no studies on the combined effect of SNPs in these genes, but our data show that this interaction could have clinical relevance. The interacting genes code for GLUT2 and SUR1, which work together in pancreatic cells for insulin secretion; therefore, it is tempting to speculate that the combined presence of functional variants could impair insulin release and affect CV phenotypes. The most significant gene-gene interaction regarding CV traits was SLC5A2 rs9934336- SLC2A1 rs710218, which was associated with an increased risk of atherosclerotic plaque formation. However, it should be noted that these genes had not shown a relevant effect on atherosclerosis in the single-SNP approach and hence this association, although it showed a p-value <0.001, should be interpreted with caution.
The study of renal function in the DN cohort revealed that SNPs in SLC2A1 (GLUT1) and SLC5A2 (SGLT2) were associated with eGFR values after adjusting by CKD stage and other variables. However, the fact that these variants did not affect DN risk raises questions about their clinical relevance. These differences were more noticeable for the SLC5A2 rs3813008 variant, an intronic tag-SNP that has been studied in relation to T2DM susceptibility and glycaemic parameters [Citation14,Citation58], but that to date was untested in the CKD setting. The SLC5A2-encoded SGLT2 transporter has been widely studied because of the advent of SGLT2i, which have evolved from glucose-lowering drugs to renoprotective and cardioprotective agents potentially useful in patients with low eGFR [Citation59]. However, and somewhat surprisingly, there are no previous data on the impact of genetic variants in the gene locus (which could somehow mimic the effect of SGLT2i) on renal function. Our results, together with the aforementioned association with CV outcomes in our DN patients suggest that the determination of SLC5A2 genetic variability could be useful in renal patients and a factor to bear in mind when prescribing SGLT2i. As for proteinuria, a hallmark of DN, we observed that carriers of the ABCC8 rs3758947 variant allele had, on average, 268 mg albumin/g creatinine in urine more than wild type patients. Polymorphisms in this gene have been related to T2DM risk because of hyperglycaemia derived from impaired insulin secretion [Citation25]. Although this could be a plausible hypothesis for the association with higher proteinuria, we could not confirm that levels of glucose correlated with the SNP in our cohort (data not shown) and therefore the processes explaining this association are still unclear.
Finally, we analysed a cohort of healthy subjects to identify variants that could be associated with the risk of DN. However, we could not identify relevant SNPs in this regard after adjusting for other risk factors. This result likely stems from a limitation of the study, which is that only 55 of the 506 controls with normal renal function had T2DM. A larger group of fully characterised T2DM patients without CKD would have been desirable to perform risk analyses. Another limitation of the study is that clinical associations lost statistical significance after correction for multiple testing. Furthermore, observed differences of eGFR and proteinuria across genotypes, although statistically significant, might not be as large as to have clinical relevance. Studies in groups with a higher proportion of patients with advanced CKD might provide with a wider range of eGFR and proteinuria values and hence differences according to genotype would presumably be more noticeable.
In summary, our findings indicate that polymorphisms in genes coding for proteins and transporters key for glucose homeostasis may affect CV-related outcomes in patients with DN. Specifically, polymorphisms in the two subunits that form the KATP channel regulating insulin secretion were associated with atherosclerosis measurements in these subjects, which supports the proposed link between T2DM and atherosclerosis [Citation60]. In addition, variability in GLUT2, also involved in insulin secretion, and in the glucose transporter SGLT2, resulted in altered CV event-free survival, which is particularly relevant in a pathology such as DN, which confers an exceptionally high CV risk. On the other hand, the reported differences observed for renal function in our cohort warrant additional, larger studies that can compare patients showing a wide range of eGFR values.
Author contributions
SM-Z recruited patients, carried out genetic analyses and drafted the manuscript; NRR and JMV helped with study design and clinical evaluation of the patients; LMG and JCA-L carried out statistical analyses; JL-G participated in sample collection and clinical analyses; GG designed the study, searched for funding, and wrote the final version of the paper. All authors have read and agreed to the published version of the manuscript.
Supplemental Material
Download TIFF Image (1.5 MB)Supplemental Material
Download TIFF Image (1.2 MB)Supplemental Material
Download TIFF Image (1.2 MB)Supplemental Material
Download MS Word (67.6 KB)Acknowledgments
The authors thank the NEFRONA team, the REDinREN Biobank and the members of the Centro Nacional de Genotipado-Instituto de Salud Carlos III (CEGen; www.cegen.org) for their invaluable technical support.
Disclosure statement
No potential competing interest was reported by the authors.
Data availability statement
The datasets underlying this article can be found at Figshare with DOI 10.6084/m9.figshare.20936788
Additional information
Funding
Related Research Data
References
- Rao Kondapally Seshasai S, Kaptoge S, Thompson A, Emerging Risk Factors Collaboration, et al. Diabetes mellitus, fasting glucose, and risk of cause-specific death. N Engl J Med. 2011;364(9):829–841.
- Alicic RZ, Rooney MT, Tuttle KR. Diabetic kidney disease: Challenges, progress, and possibilities. Clin J Am Soc Nephrol. 2017;12(12):2032–2045.
- Palsson R, Patel UD. Cardiovascular complications of diabetic kidney disease. Adv Chronic Kidney Dis. 2014;21(3):273–280.
- Brownlee M. The pathobiology of diabetic complications: a unifying mechanism. Diabetes. 2005;54(6):1615–1625.
- Nathan DM, Cleary PA, Backlund JY, Diabetes Control and Complications Trial/Epidemiology of Diabetes Interventions and Complications (DCCT/EDIC) Study Research Group, et al. Intensive diabetes treatment and cardiovascular disease in patients with type 1 diabetes. N Engl J Med. 2005;353(25):2643–2653.
- Pistrosch F, Natali A, Hanefeld M. Is hyperglycemia a cardiovascular risk factor? Diabetes care. Diabetes Care. 2011;34 Suppl 2(Suppl 2):S128–S31.
- Patel A, MacMahon S, Chalmers J, ADVANCE Collaborative Group, et al. Intensive blood glucose control and vascular outcomes in patients with type 2 diabetes. N Engl J Med. 2008;358(24):2560–2572.
- Duckworth W, Abraira C, Moritz T, VADT Investigators, et al. Glucose control and vascular complications in veterans with type 2 diabetes. N Engl J Med. 2009;360(2):129–139.
- Gerstein HC, Miller ME, Byington RP, Action to Control Cardiovascular Risk in Diabetes Study Group, et al. Effects of intensive glucose lowering in type 2 diabetes. N Engl J Med. 2008;358(24):2545–2559.
- Wanner C, Lachin JM, Inzucchi SE, EMPA-REG OUTCOME Investigators, et al. Empagliflozin and clinical outcomes in patients with type 2 diabetes mellitus, established cardiovascular disease, and chronic kidney disease. Circulation. 2018;137(2):119–129.
- Jardine AG, Fellstrom B, Logan JO, et al. Cardiovascular risk and renal transplantation: post hoc analyses of the assessment of lescol in renal transplantation (ALERT) study. Am J Kidney Dis. 2005;46(3):529–536.
- Vallon V. Glucose transporters in the kidney in health and disease. Pflugers Arch - Eur J Physiol. 2020;472(9):1345–1370.
- Lam JT, Martin MG, Turk E, et al. Missense mutations in SGLT1 cause glucose-galactose malabsorption by trafficking defects. Biochim Biophys Acta. 1999;1453(2):297–303.
- Drexel H, Leiherer A, Saely CH, et al. Are SGLT2 polymorphisms linked to diabetes mellitus and cardiovascular disease? Prospective study and meta-analysis. Biosci Rep. 2019;39(8):BSR20190299.
- Tziastoudi M, Stefanidis I, Zintzaras E. The genetic map of diabetic nephropathy: evidence from a systematic review and meta-analysis of genetic association studies. Clin Kidney J. 2020;13(5):768–781.
- Katzmann JL, Mason AM, Marz W, et al. Genetic variation in sodium-glucose cotransporter 2 and heart failure. Clin Pharmacol Ther. 2021;110(1):149–158.
- Qin LJ, Lv Y, Huang QY. Meta-analysis of association of common variants in the KCNJ11-ABCC8 region with type 2 diabetes. Genet Mol Res. 2013;12(3):2990–3002.
- Nichols CG, Singh GK, Grange DK. KATP channels and cardiovascular disease: suddenly a syndrome. Circ Res. 2013;112(7):1059–1072.
- Sakamoto Y, Inoue H, Keshavarz P, et al. SNPs in the KCNJ11-ABCC8 gene locus are associated with type 2 diabetes and blood pressure levels in the japanese population. J Hum Genet. 2007;52(10):781–793.
- Sokolova EA, Bondar IA, Shabelnikova OY, et al. Replication of KCNJ11 (p.E23K) and ABCC8 (p.S1369A) Association in russian diabetes mellitus 2 type cohort and Meta-Analysis. PLoS One. 2015;10(5):e0124662.
- Arroyo D, Betriu A, Martinez-Alonso M, investigators from the NEFRONA study, et al. Observational multicenter study to evaluate the prevalence and prognosis of subclinical atheromatosis in a spanish chronic kidney disease cohort: baseline data from the NEFRONA study. BMC Nephrol. 2014;15:168.
- Abajo M, Betriu A, Arroyo D, Investigators of the NEFRONA study, et al. Mineral metabolism factors predict accelerated progression of common carotid intima-media thickness in chronic kidney disease: the NEFRONA study. Nephrol Dial Transplant. 2017;32(11):1882–1891.
- Touboul PJ, Hennerici MG, Meairs S, Advisory Board of the 3rd Watching the Risk Symposium 2004, 13th European Stroke Conference, et al. Mannheim intima-media thickness consensus. Cerebrovasc Dis. 2004;18(4):346–349.
- Stein JH, Korcarz CE, Hurst RT, American Society of Echocardiography Carotid Intima-Media Thickness Task Force, et al. Use of carotid ultrasound to identify subclinical vascular disease and evaluate cardiovascular disease risk: a consensus statement from the American society of echocardiography carotid Intima-Media thickness task force. Endorsed by the society for vascular medicine. J Am Soc Echocardiogr. 2008;21(2):93–111. quiz 189–90.
- Kilpelainen TO, Lakka TA, Laaksonen DE, Finnish Diabetes Prevention Study Group, et al. Physical activity modifies the effect of SNPs in the SLC2A2 (GLUT2) and ABCC8 (SUR1) genes on the risk of developing type 2 diabetes. Physiol Genomics. 2007;31(2):264–272.
- Phani NM, Guddattu V, Bellampalli R, et al. Population specific impact of genetic variants in KCNJ11 gene to type 2 diabetes: a case-control and meta-analysis study. PLoS One. 2014;9(9):e107021.
- Rathmann W, Strassburger K, Bongaerts B, GDS Group, et al. A variant of the glucose transporter gene SLC2A2 modifies the glycaemic response to metformin therapy in recently diagnosed type 2 diabetes. Diab Tologia. 2019;62(2):286–291.
- Zimdahl H, Haupt A, Brendel M, et al. Influence of common polymorphisms in the SLC5A2 gene on metabolic traits in subjects at increased risk of diabetes and on response to empagliflozin treatment in patients with diabetes. Pharmacogenet Genomics. 2017;27(4):135–142.
- Cui W, Du B, Cui Y, et al. Is rs759853 polymorphism in promoter of aldose reductase gene a risk factor for diabetic nephropathy? A meta-analysis. Eur J Med Res. 2015;20:14.
- Karambataki M, Malousi A, Tzimagiorgis G, et al. Association of two synonymous splicing-associated CpG single nucleotide polymorphisms in calpain 10 and solute carrier family 2 member 2 with type 2 diabetes. Biomed Rep. 2017;6(2):146–158.
- Dupuis J, Langenberg C, Prokopenko I, MAGIC investigators, et al. New genetic loci implicated in fasting glucose homeostasis and their impact on type 2 diabetes risk. Nat Genet. 2010;42(2):105–116.
- Gaulton KJ, Willer CJ, Li Y, et al. Comprehensive association study of type 2 diabetes and related quantitative traits with 222 candidate genes. Diabetes. 2008;57(11):3136–3144.
- Laukkanen O, Lindstrom J, Eriksson J, Finnish Diabetes Prevention Study, et al. Polymorphisms in the SLC2A2 (GLUT2) gene are associated with the conversion from impaired glucose tolerance to type 2 diabetes: the finnish diabetes prevention study. Diabetes. 2005;54(7):2256–2260.
- Willer CJ, Bonnycastle LL, Conneely KN, et al. Screening of 134 single nucleotide polymorphisms (SNPs) previously associated with type 2 diabetes replicates association with 12 SNPs in nine genes. Diabetes. 2007;56(1):256–264.
- Chen G, Xu Y, Lin Y, et al. Association study of genetic variants of 17 diabetes-related genes/loci and cardiovascular risk and diabetic nephropathy in the chinese she population. J Diabetes. 2013;5(2):136–145.
- Stefanidis I, Tziastoudi M, Tsironi EE, et al. The contribution of genetic variants of SLC2A1 gene in T2DM and T2DM-nephropathy: association study and meta-analysis. Ren Fail. 2018;40(1):561–576.
- Gonzalez LM, Robles NR, Mota-Zamorano S, et al. Genetic variants in PGE2 receptors modulate the risk of nephrosclerosis and clinical outcomes in these patients. J Pers Med. 2021;11(8):772.
- Mota-Zamorano S, Robles NR, Gonzalez LM, et al. Genetics variants in the epoxygenase pathway of arachidonic metabolism are associated with eicosanoids levels and the risk of diabetic nephropathy. J Clin Med. 2021;10(17):3980.
- Gorostidi M, Sanchez-Martinez M, Ruilope LM, et al. Chronic kidney disease in Spain: Prevalence and impact of accumulation of cardiovascular risk factors. Nefrologia (Engl Ed). 2018;38(6):606–615.
- Maqbool M, Cooper ME, Jandeleit-Dahm KAM. Cardiovascular disease and diabetic kidney disease. Semin Nephrol. 2018;38(3):217–232.
- Kourtidou C, Stangou M, Marinaki S, et al. Novel cardiovascular risk factors in patients with diabetic kidney disease. Int J Mol Sci. 2021;22(20):11196.
- Zhou XF, Zhou WE, Liu WJ, et al. A network pharmacology approach to explore the mechanism of HuangZhi YiShen capsule for treatment of diabetic kidney disease. J Transl Int Med. 2021;9(2):98–113.
- Wang Z, Xiong H, Ren TYS. Repair of damaged pancreatic beta cells: New hope for a type 2 diabetes reversal? J Transl Int Med. 2021;9(3):150–151.
- Ashcroft FM, Rorsman P. Electrophysiology of the pancreatic beta-cell. Prog Biophys Mol Biol. 1989;54(2):87–143.
- Chavali S, Mahajan A, Tabassum R, et al. Association of variants in genes involved in pancreatic beta-cell development and function with type 2 diabetes in North indians. J Hum Genet. 2011;56(10):695–700.
- Koo BK, Cho YM, Park BL, et al. Polymorphisms of KCNJ11 (Kir6.2 gene) are associated with type 2 diabetes and hypertension in the korean population. Diabet Med. 2007;24(2):178–186.
- Xiong C, Zheng F, Wan J, et al. The E23K polymorphism in Kir6.2 gene and coronary heart disease. Clin Chim Acta. 2006;367(1-2):93–97.
- Liu NJ, Wu HH, Li YL, et al. An analysis of the association between a polymorphism of KCNJ11 and diabetic retinopathy in a chinese han population. Eur J Med Res. 2015;20:3.
- Severino P, D'Amato A, Netti L, et al. Susceptibility to ischaemic heart disease: Focusing on genetic variants for ATP-sensitive potassium channel beyond traditional risk factors. Eur J Prev Cardiol. 2020;28(13):1495–1500.
- Aka TD, Saha U, Shati SA, et al. Risk of type 2 diabetes mellitus and cardiovascular complications in KCNJ11, HHEX and SLC30A8 genetic polymorphisms carriers: a case-control study. Heliyon. 2021;7(11):e08376.
- Marucci A, Rutigliano I, Fini G, et al. Role of actionable genes in pursuing a true approach of precision medicine in monogenic diabetes. Genes (Basel). 2022;13(1):117.
- Laukkanen O, Pihlajamaki J, Lindstrom J, Finnish Diabetes Prevention Study Group, et al. Polymorphisms of the SUR1 (ABCC8) and Kir6.2 (KCNJ11) genes predict the conversion from impaired glucose tolerance to type 2 diabetes. The finnish diabetes prevention study. J Clin Endocrinol Metab. 2004;89(12):6286–6290.
- Song J, Yang Y, Mauvais-Jarvis F, et al. KCNJ11, ABCC8 and TCF7L2 polymorphisms and the response to sulfonylurea treatment in patients with type 2 diabetes: a bioinformatics assessment. BMC Med Genet. 2017;18(1):64.
- Gurzeler E, Ruotsalainen AK, Laine A, et al. SUR1-E1506K mutation impairs glucose tolerance and promotes vulnerable atherosclerotic plaque phenotype in hypercholesterolemic mice. PLoS One. 2021;16(11):e0258408.
- Zhou K, Yee SW, Seiser EL, ACCORD Investigators, et al. Variation in the glucose transporter gene SLC2A2 is associated with glycemic response to metformin. Nat Genet. 2016;48(9):1055–1059.
- Le MT, Lobmeyer MT, Campbell M, et al. Impact of genetic polymorphisms of SLC2A2, SLC2A5, and KHK on metabolic phenotypes in hypertensive individuals. PLoS One. 2013;8(1):e52062.
- Thorens B. GLUT2, glucose sensing and glucose homeostasis. Diab Tologia. 2015;58(2):221–232.
- Ordelheide AM, Bohm A, Kempe-Teufel D, et al. Common variation in the sodium/glucose cotransporter 2 gene SLC5A2 does neither affect fasting nor glucose-suppressed plasma glucagon concentrations. PLoS One. 2017;12(5):e0177148.
- Dekkers CCJ, Gansevoort RT. Sodium-glucose cotransporter 2 inhibitors: extending the indication to non-diabetic kidney disease? Nephrol Dial Transplant. 2020;35(Suppl 1):i33–i42.
- Poznyak A, Grechko AV, Poggio P, et al. The diabetes Mellitus-Atherosclerosis connection: the role of lipid and glucose metabolism and chronic inflammation. Int J Mol Sci. 2020;21(5):1835.