
Abstract
Background
Corona Virus Disease 2019 (COVID-19) has a significant impact on sleep quality. However, the effects on sleep quality in the post-COVID-19 pandemic era remain unclear, and there is a lack of a screening tool for Chinese older adults. This study aimed to understand the prevalence of poor sleep quality and determine sensitive variables to develop an effective prediction model for screening sleep problems during infectious diseases outbreaks.
Materials and Methods
The Peking University Health Cohort included 10,156 participants enrolled from April to May 2023. The Pittsburgh Sleep Quality Index (PSQI) scale was used to assess sleep quality. The data were randomly divided into a training-testing cohort (n = 7109, 70%) and an independent validation cohort (n = 3027, 30%). Five prediction models with 10-fold cross validation including the Least Absolute Shrinkage and Selection Operator (LASSO), Stochastic Volatility Model (SVM), Random Forest (RF), Artificial Neural Network (ANN), and XGBoost model based on the area under curve (AUC) were used to develop and validate predictors.
Results
The prevalence of poor sleep quality (PSQI >7) was 30.69% (3117/10,156). Among the generated models, the LASSO model outperformed SVM (AUC 0.579), RF (AUC 0.626), ANN (AUC 0.615) and XGBoost (AUC 0.606), with an AUC of 0.7. Finally, a total of 12 variables related to sleep quality were used as parameters in the prediction models. These variables included age, gender, ethnicity, educational level, residence, marital status, history of chronic diseases, SARS-CoV-2 infection, COVID-19 vaccination, social support, depressive symptoms, and cognitive impairment among older adults during the post-COVID-19 pandemic. The nomogram illustrated that depressive symptoms contributed the most to the prediction of poor sleep quality, followed by age and residence.
Conclusions
This nomogram, based on twelve-variable, could potentially serve as a practical and reliable tool for early identification of poor sleep quality among older adults during the post-pandemic period.
KEY MESSAGE
The poor sleep quality (PSQI >7) was still prevalent among older adults during the post-COVID-19 pandemic.
The LASSO model was the best model to predict poor sleep quality among older adults, compared with SVM, RF, ANN and XGBoost.
This prediction model, based on twelve variables, may potentially serve as a practical and reliable tool for the early identification of poor sleep quality among older adults during the post-pandemic period.
Introduction
Since the World Health Organization (WHO) declared the Corona Virus Disease 2019 (COVID-19) pandemic, more than three years have passed. Quarantine, closure, and limited social support due to infectious diseases outbreaks all pose a threat to psychological well-being worldwide [Citation1–5]. Sleep disturbances, as important health issues, were also identified as critical potential risk factors for morbidity and mortality [Citation6]. The COVID-19 pandemic has led to a significant increase in disease burden of sleep problems. The prevalence of poor sleep quality among general population during the COVID-19 pandemic was 40% [Citation4]. COVID-19 patients also had a higher prevalence of sleep problems. The estimated prevalence of sleep problems was 52.39% among patients infected with Severe Acute Respiratory Syndrome Coronavirus 2 (SARS-CoV-2) [Citation7].
With the increasing number of people aged 60 years and older, healthy aging is essential. Older adults, as a vulnerable population, face a greater threat from the COVID-pandemic and SARS-CoV-2 infection. Ayşe et al. reported that 70.37% of older COVID-19 patients had poor sleep quality in Turkey [Citation8]. The prevalence of poor sleep quality in the elderly varies due to numerous factors, including assessment methods, country, and pandemic period. During the COVID-19 pandemic, there were limited studies focusing on the sleep of older adults, especially in China, compared with general population. Understanding the sleep health of older adults in the post-COVID-19 pandemic era is beneficial for identifying populations at higher risk, implementing intervention measures to improve sleep, reducing the risk of morbidity and mortality, and promoting healthy aging in the face of emerging infectious diseases.
Given the limited evidence on the sleep quality of elderly Chinese individuals and its significance in ensuring healthy aging, this study aims to systematically investigate sleep quality and potential predictors. These predictors include demographic characteristics, lifestyle habits, SARS-CoV-2 infection, depressive symptoms, cognitive function, and social support in the post-COVID-19 pandemic era. Furthermore, this large cross-sectional study developed prediction models for classifying sleep quality using the Least Absolute Shrinkage and Selection Operator (LASSO), Stochastic Volatility Model (SVM), Random Forest (RF), Artificial Neural Network (ANN), and XGBoost model, and compared their performances to identify important predictors.
Methods
Study design and participants
Our study included 10,156 participants from the Peking University Health Cohort in Anning, Yunnan (PKUHC-AN). Registration information was found on ClinicalTrials.Gov (NCT05825651). This study was conducted in Anning, Yunnan, China, from April to May 2023, with the primary goal of investigating the short-term and long-term health effects of COVID-19 on older adults. In order to provide high-quality research evidence for optimizing prevention and control strategies for COVID-19 and other emerging infectious diseases in the real world, we trained family physicians to collect demographic characteristics, lifestyle habits, and health status, using a standardized questionnaire. All the surveys were conducted through face-to-face interviews. If participants were illiterate, investigators assisted them in completing the questionnaire.
Older adults were screened for the following inclusion criteria: (1) aged 60 years or older; (2) residing in Anning for the past six months with no plans to move out in the next year; (3) older adults willing to participate in this study and provide informed consent. Older adults who were unable to answer questions or communicate were excluded. All participants included in the study were informed of the study protocol, and their oral informed consent was obtained at the initial assessment.
The study was approved by the institutional review board at Peking University (IRB00001052-21126). Initially, 11,012 older adults were enrolled. After excluding 83 older adults aged less than 60 years, 685 older adults with a self-reported history of stroke and cerebral infarction, and 88 older adults with a self-reported history of mental diseases (such as epilepsy, Parkinson’s, Alzheimer’s, etc.), a total of 10,156 patients were included. The prediction model was developed and reported in accordance with the Transparent Reporting of a multivariable prediction model for Individual Prognosis or Diagnosis (TRIPOD) Statement [Citation9].
Outcome and predictors
The primary outcome was poor sleep quality assessed by the Pittsburgh Sleep Quality Index (PSQI) [Citation10]. The PSQI, which assessed sleep for a month, consisted of 18 items across 7 subscales: subjective sleep quality, sleep latency, sleep duration, habitual sleep efficiency, sleep disturbance, use of sleeping medications, and daytime dysfunction. A score greater than 7 indicates poor sleep quality [Citation11,Citation12].
Based on previous studies [Citation8,Citation13] and our questionnaire, we included as many relevant variables as possible. Finally, we included 20 predictors covering demographic characteristics (age, gender, ethnicity, educational level, residence, monthly income during the COVID-19 pandemic, marital status, living status), health status (body mass index [BMI, kg/m2], history of chronic diseases, SARS-CoV-2 infection, COVID-19 vaccination, social support, depressive symptoms, falls in the past year, cognitive impairment), and lifestyle habits (smoking status, drinking status, exercise, balanced diet).
Monthly income during the COVID-19 pandemic was classified into four groups based on the interquartile range. The BMI was categorized based on the cutoff points established by the Working Group on Obesity in China [Citation14]. Depressive symptoms were measured using the Patient Health Questionnaire-9 (PHQ-9), with a total score ranging from 0 to 27. Scores of >4 indicated the presence of depressive symptoms [Citation15]. The social support score was assessed using the Social Support Rating Scale (SSRS), which comprised three sub-domains: objective support, subjective support, and support utilization [Citation16]. The total score of SSRS ranged from 12 to 66, with higher scores indicating better social support [Citation17]. The participants’ cognitive function was assessed using the widely used screening tool known as the Chinese version of the Mini-Mental State Examination (MMSE), which comprised 11 questions assessing orientation, registration, attention, calculation ability, recall, and language ability [Citation18]. According to the cultural context of China, several items in the Chinese version were modified while maintaining good validity and reliability [Citation19]. All the questions were answered by the respondents themselves, without a proxy. The total MMSE scores ranged from 0 to 30. The cutoff points were set at 17 for illiteracy, 20 for primary school, and 24 for junior high school and above in this population [Citation19].
Data analysis
Baseline characteristics of the study population were described using means ± standard deviations (SDs) for the continuous variables and percentages for the categorical variables.
The Chi-square test was used for categorical variables, while the Kruskal-Wallis test was employed for continuous variables in univariate analysis. Factors with statistical significance were included in the multivariate models. In order to test the robustness of the results, we conducted two sensitivity analyses: (1) Sensitivity analysis 1: we included all 20 factors in the multivariate models; (2) Sensitivity analysis 2: we replaced depressive symptoms by the PHQ-9 scores to explore the severity of depressive symptoms on poor sleep quality.
In order to ensure the robustness of our findings, we employed five models, including LASSO, SVM, RF, ANN and XGBoost, to select important predictors. We used the area under the curve (AUC) to evaluate the discriminative power of the models [Citation20,Citation21]. Lasso can be extended to generalized regression models, producing some coefficients that are exactly zero. Lasso can give interpretable models that can minimize the residual sum of squares, subject to the condition that the sum of the absolute values of the coefficients is less than a constant [Citation22]. SVM is a linear model, and the ANN can be trained to recognize complex functional relationships between covariates and response variables, making it superior to linear models in several clinical fields [Citation20,Citation23]. Both RF and XGBoost were tree-based methods. RF predicts a class outcome by using the majority vote of trees to minimize training error [Citation20,Citation23]. The data included in the study were randomly partitioned into a training-testing cohort (n = 7109, 70%) and an independent validation cohort (n = 3047, 30%). The calibration was examined using a calibration curve. We estimated the odds ratio (OR) with 95% confidence interval (95%CI) of selected predictors from the prediction model using logistic regression. The nomogram was formulated based on the result of logistic regression for practical application. All analyses were conducted using R 4.2.0. Two-sided P values less than 0.05 were considered to be statistically significant.
Results
Participant characteristics
The characteristics of the 10,156 participants had a mean (SD) age of approximately 72.00 (± 6.65) years old, and 53.61% of the participants were women.
During COVID-19 pandemic, 30.69% of older adults, totaling 3117 individuals, experienced poor sleep quality. According to χ2 tests and the Kruskal-Wallis test, all characteristics except BMI (p > 0.05) differed across sleep quality groups (all p < 0.05, ). Poor sleep quality was more prevalent among older people, females (34.12%), minorities (37.66%), those who were illiterate (35.27%), urban residents (38.31%), those with higher monthly income during the COVID-19 pandemic (38.39%), widowed, divorced or unmarried individuals (37.57%), those living alone (39.54%), individuals with a history of chronic diseases (35.72%), self-reported SARS-CoV-2 infections (39.49%), individuals without COVID-19 vaccination (46.24%), those with lower social support scores, individuals with depressive symptoms (64.08%), individuals who fell in the past year (37.37%), former smokers (34.46%), individuals who consumed alcohol less than once a week (33.60%), those with an unbalanced diet (39.55%), and individuals who exercised about 2 to 5 times per week (35.23%).
Table 1. Characteristics of the study participants.
The selection process for predictors
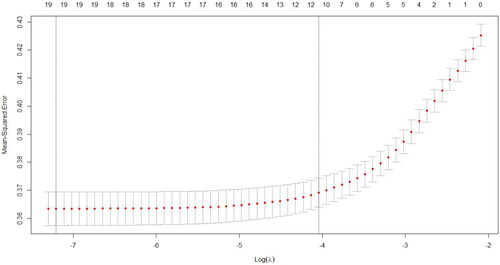
Except BMI, after inputting 19 other predictors into the models, the AUCs for the LASSO, SVM, RF, ANN, and XGBoost models were 0.7, 0.579, 0.626, 0.615 and 0.606 respectively, as shown in the . The ratio of true positive cases (poor sleep quality) to true negative cases (good sleep quality) was nearly 3:1, thus our data was close to a balanced data. The higher AUC value indicates that given a true positive case and a true negative case at random, the possibility, presenting the probability of the model predicts a true positive case is greater than the probability of the model predicts a true negative case, is higher. The AUCs for the LASSO model was 0.7 indicating a moderate distinguish power of 70%. Therefore, we selected the LASSO technique to choose important predictors. Considering the recommended number of selected predictors from (11 ∼ 19) and the efficient coefficients of selected predictors from LASSO technique (Table S1), twelve predictor variables were included in the final model: age, gender, ethnicity, educational level, residence, marital status, history of chronic diseases, SARS-CoV-2 infection, COVID-19 vaccination, social support, depressive symptoms, and cognitive impairment. The sensitivity analysis 1 showed that when all 20 factors were included in multivariate models, LASSO was still the best technique for selecting predictors (AUCs = 0.695) compared to the other four models (Figure S1). Although the recommended number of selected predictors ranged from 12 to 20 (Figure S2), the efficient coefficients of selected predictors from the LASSO technique were the same as the results mentioned above.
Figure 1. Areas under curves (AUCs) of the five models with 19 factors developed.
Notes: All models included age, gender, ethnicity, education, residence, marital status, living status, history of chronic diseases, SARS-CoV-2 infection, cognitive impairment, COVID-19 vaccination, SSRS scores, depressive symptoms, fall in the past year, smoking, drinking, dietary status, and physical activity. ANN = artificial neural network; COVID = Corona Virus Disease 2019; LASSO = least absolute shrinkage and selection operator; RF = random forest; SARS-CoV-2 = Severe Acute Respiratory Syndrome Coronavirus 2; SSRS = social support rating scale; SVM = stochastic volatility model.
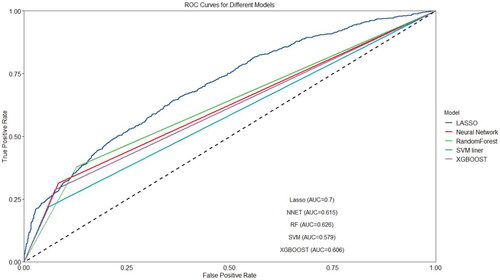
Figure 2. The number of predictors selection via LASSO with 10-fold cross validation in parameter diagram.
Notes: The figure showed that 19 (first dotted line) to 11 variables (second dotted line) were appropriate in LASSO model. LASSO model included age, gender, ethnicity, education, residence, marital status, living status, history of chronic diseases, SARS-CoV-2 infection, cognitive impairment, COVID-19 vaccination, SSRS scores, depressive symptoms, fall in the past year, smoking, drinking, dietary status, and physical activity. COVID = Corona Virus Disease 2019; LASSO = least absolute shrinkage and selection operator; SARS-CoV-2 = Severe Acute Respiratory Syndrome Coronavirus 2; SSRS = social support rating scale.
Older age (aOR =1.04, 95% CI, 1.03–1.05), female (aOR = 1.36, 95% CI: 1.21–1.53), lower educational level (primary school: aOR = 1.26, 95% CI: 1.03–1.53; illiteracy: aOR = 1.35, 95% CI: 1.08–1.69), minorities (aOR = 1.41, 95% CI: 1.18–1.69), living in urban area (aOR = 2.03, 95% CI: 1.79–2.30), history of chronic diseases (aOR = 1.43, 95% CI: 1.26–1.61), SARS-CoV-2 infection (confirmed infection: aOR = 1.22, 95% CI: 1.03–1.46; self-reported infection: aOR = 1.90, 95% CI: 1.69–2.15), depressive symptoms (aOR = 4.19, 95% CI: 3.56–4.93), and cognitive impairment (aOR = 1.39, 95% CI: 1.13–1.71) were associated with a significantly increased risk of poor sleep quality, while higher SSRS scores (aOR = 0.99, 95% CI: 0.98–0.99) and COVID-19 vaccination (aOR = 0.73, 95% CI: 0.56–0.96) was associated with a significantly decreased risk of poor sleep quality (P all <0.05, ). The nomogram illustrated that depressive symptoms contributed the most to the prediction of poor sleep quality, followed by age and residence (). The calibration curve showed good discrimination and calibration of the nomogram in the training-testing cohort and internal validation cohort (Figure S3–S4).
Figure 3. Nomogram for predicting poor sleep quality.
Notes: a nomogram to predict the risk of poor sleep quality among older adults in post-COVID-19 pandemic era. To use the nomogram, draw a vertical line to identify the corresponding points of each variable according to their actual status. Then, add the points for all variables and find the position on the total point axis. With the same line mentioned above, you can determine the risk of poor sleep quality at the lowest line of the nomogram. Model included 12 predictors including age, gender, ethnicity, educational level, residence, marital status, history of chronic diseases, SARS-CoV-2 infection, COVID-19 vaccination, social support, depressive symptoms, and cognitive impairment. COVID: corona virus disease 2019; SARS-CoV-2: severe acute respiratory syndrome coronavirus 2; SSRS:social support rating scale.
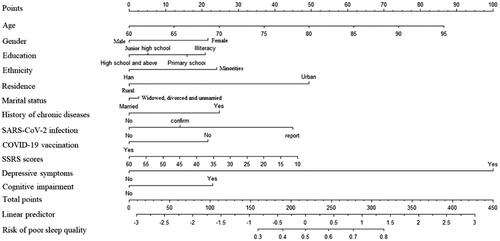
Table 2. Risk factors for poor sleep quality among older adults during COVID-19 pandemic in multivariable models.
Considering that depressive symptoms contributed the most to the prediction of poor sleep quality, we additionally replaced depressive symptoms by the PHQ-9 scores in the model. Sensitivity analysis 2 presented all five models with higher discriminative power (Figure S5). Among them, LASSO was still the best technique for selecting predictors (AUCs = 0.740) compared to the other four models (Figure S5). The recommended number of selected predictors was the same as the above findings (Figure S6). Compared with the above findings, cognitive impairment was not included in the final model, but the other predictors were the same as the above findings (Table S2–S3). The nomogram still illustrated that depressive symptoms contributed the most to the prediction of poor sleep quality, followed by age and residence (Figure S7). The calibration curve showed good discrimination and calibration of nomogram in the training-testing cohort and internal validation cohort (Figure S8–S9).
Discussion
Our study developed and validated a prediction model for early identification of poor sleep quality among older adults during the COVID-19 pandemic. We utilized machine learning techniques based on a large sample of cross-sectional survey data. Among the 10,156 older adults, the prevalence of poor sleep quality (PSQI > 7) was nearly 30% in the post-COVID-19 pandemic era. We finally used LASSO to trained parameters that exhibited moderate predictive power, achieving an AUC of 0.7. Twelve variables across demographic characteristics and health status were identified as risk factors for poor sleep quality in our study.
Among more than 10,000 older adults in China, 30.69% were found to have poor sleep quality. Our study reported a moderately high prevalence of poor sleep quality in post-COVID-19 pandemic era, compared to previous estimates ranging from 8.52% to 64.24% among older adults during the COVID-19 pandemic in previous studies [Citation24–31]. Sleep quality is an important aspect of daily life, and there has been increasing attention on evaluating and intervening in its contributing factors in recent years. The COVID-19 pandemic has not only resulted in short-term deaths and medical burdens but has also led to long-term physical and psychological impacts. Even mild infections can cause brain shrinkage and loss of gray matter [Citation32]. Therefore, in the context of the COVID-19 pandemic, developing a framework of predictors from multiple perspectives, including sociology and psychology, will help in forming an overall assessment and management measures for sleep quality among older adults. The results of this study provide the most recent evidence of sleep health and serve as a reference for predicting sleep health in clinical practice following the COVID-19 pandemic or other infectious disease outbreaks, given the high prevalence of poor sleep quality.
Among the elderly, we found that depressive symptoms (aOR =4.19) were the most significant risk factor for poor sleep quality. Numerous studies have reported that depressive symptoms are associated with poor sleep quality which supports our findings [Citation31,Citation33,Citation34]. Liao et al. reported a positive association between poor sleep quality and depression (aOR = 3.27, 95% CI: 1.60–7.03) among Hong Kong community-dwelling older men during the COVID-19 pandemic [Citation34]. Depressive symptoms and poor sleep quality were both common issues during the COVID-19 pandemic [Citation33]. The aggravated deterioration of each other was the primary concern, particularly as the epidemic advanced [Citation34]. The positive association between poor sleep quality and depression was aggravated in the post-COVID-19 pandemic era [Citation34]. The strong relationship between depressive symptoms and poor sleep quality in our study indicates that the importance of restoring and improving people’s mental health, promoting sleep, and ensuring a high quality of life among Chinese older adults in the post-COVID-19 pandemic era.
Furthermore, the nomogram illustrated that age was the second contributing risk factor to the prediction of poor sleep quality. For every one-year increase in age, the risk associated with poor sleep quality increased by 4%. Chen et al. reported that poor sleep quality (OR = 1.05), inadequate sleep (OR = 1.04), and disturbed sleep (OR = 1.06) were more likely to be associated with older age [Citation31]. We hypothesized that older adults with older age may experience poor sleep quality due to concerns about their physical condition or the severity of SARS-CoV-2 infection. In fact, older individuals who received the COVID-19 vaccine (aOR = 0.73) were less likely to have poor sleep quality in our study. We also found a positive association between health status, including a history of chronic diseases (aOR = 1.43), and SARS-CoV-2 infection (aOR = 1.22–1.90), with poor sleep quality among older adults. COVID-19 patients have reported worsened sleep problems due to cough, headache, muscle pain, and other symptoms after infection [Citation8,Citation35–37]. Furthermore, SARS-CoV-2 infection was associated with a higher level of inflammatory cytokine, which could exacerbate the brain injury and further worsen sleep health [Citation32]. Older adults may experience sleep problems related to the COVID-19 pandemic due to isolation [Citation38]. Higher SSRS scores (aOR = 0.99) were significantly associated with a decreased risk of poor sleep quality in our study. Our study generally provides a framework for understanding the population characteristics of older people with poor sleep quality during an infectious disease outbreak.
In our study, LASSO demonstrated better discriminative power compared to SVM, RF, ANN, and XGBoost. A previous study utilized ANN, RF, and NB to assess sleep quality among college students during the COVID-19 outbreak [Citation20]. The study found that ANN was the best model and demonstrated moderate discriminative power, with an AUC value of 0.713 [Citation20]. One study used LASSO to select the predictors of cognitive impairment in middle-aged and older adults within the community [Citation21]. Our study identified 12 predictors associated with the poor sleep quality during the COVID-19 pandemic using LASSO, with an AUC above 0.7. Twelve variables in the prediction model are easily accessible in the clinical practice and the community. Therefore, this model could serve as a useful and practical tool for early screening of poor sleep quality among the elderly.
There were several strengths in our study. Firstly, our study utilized the PSQI, a standard and simple tool for assessing sleep quality among over 10,000 older adults. The large sample size and comprehensive items ensure a high level of statistical power and accuracy. Secondly, we built a prediction model to assess the predictors of poor sleep quality using five machine learning algorithms. The discrimination and calibration were moderate. However, some limitations should be emphasized. Firstly, our study was a cross-sectional study, so a causal relationship could not be proven. Prospective cohort studies or randomized controlled trials are needed in the future. Secondly, objective sleep measurements are expensive and inconvenient; therefore, they are not commonly used in large-sample studies. Although the PSQI can better reflect the subjective sleep of the elderly and facilitate sleep monitoring in a large population, it may introduce recall bias. Therefore, future studies should make further attempts to use objective sleep measurements with adequate support. Finally, we included influencing factors from multiple aspects, but potential recall bias and residual confounding bias were still existed.
Our findings demonstrate that poor sleep quality is prevalent among Chinese older adults during the COVID-19 pandemic. This nomogram, based on twelve variables, could potentially serve as a practical and reliable tool for early identification of poor sleep quality among older adults during infectious diseases outbreaks. The model is conducive to implementing measures earlier to improve current sleep conditions.
Authors’ contribution statement
JL conceptualized and designed the study, MD, YW, WY, QL, ML, XY and SW did data acquisition, MD did data curation, formal analysis, and visualization, MD did writing - original draft, ML, XY, SW, ML and JL did writing- reviewing and editing.
Ethical approval and consent to participate
This study was approved by the institutional review boards at Peking University (IRB00001052-21126). All participants had oral informed consent at the time of participation. The research has been performed in accordance with the Declaration of Helsinki.
Consent for publication
Not applicable.
Supplemental Material
Download MS Word (1.1 MB)Acknowledgments
We are also grateful to all family physicians and health workers on collection of data.
Disclosure statement
The authors declare that they have no competing interests.
Data availability statement
Data are obtained according to corresponding author permission.
Additional information
Funding
References
- Salanti G, Peter N, Tonia T, et al. The impact of the COVID-19 pandemic and associated control measures on the mental health of the general population: a systematic review and dose-response meta-analysis. Ann Intern Med. 2022;175(11):1–10. doi:10.7326/m22-1507.
- Hossain MM, Nesa F, Das J, et al. Global burden of mental health problems among children and adolescents during COVID-19 pandemic: an umbrella review. Psychiatry Res. 2022;317:114814. doi:10.1016/j.psychres.2022.114814.
- Farooq S, Tunmore J, Wajid Ali M, et al. Suicide, self-harm and suicidal ideation during COVID-19: a systematic review. Psychiatry Res. 2021;306:114228. doi:10.1016/j.psychres.2021.114228.
- Krishnamoorthy Y, Nagarajan R, Saya GK, et al. Prevalence of psychological morbidities among general population, healthcare workers and COVID-19 patients amidst the COVID-19 pandemic: a systematic review and meta-analysis. Psychiatry Res. 2020;293:113382. doi:10.1016/j.psychres.2020.113382.
- Viner R, Russell S, Saulle R, et al. School closures during social lockdown and mental health, health behaviors, and well-being among children and adolescents during the first COVID-19 wave: a systematic review. JAMA Pediatr. 2022;176(4):400–409. doi:10.1001/jamapediatrics.2021.5840.
- Liu L, Ni SY, Yan W, et al. Mental and neurological disorders and risk of COVID-19 susceptibility, illness severity and mortality: a systematic review, meta-analysis and call for action. EClinicalMedicine. 2021;40:101111. doi:10.1016/j.eclinm.2021.101111.
- Jahrami HA, Alhaj OA, Humood AM, et al. Sleep disturbances during the COVID-19 pandemic: a systematic review, meta-analysis, and meta-regression. Sleep Med Rev. 2022;62:101591. doi:10.1016/j.smrv.2022.101591.
- Karaogullarindan A, Erkan SO, Tuhanioglu B, et al. Sleep quality in patients over 65 years of age in the covid-19 pandemic. Turkish Jo Geriatr-Turk Geriatri Dergisi. 2021;24:381–390. doi:10.31086/tjgeri.2021.235.
- Collins GS, Reitsma JB, Altman DG, et al. Transparent reporting of a multivariable prediction model for individual prognosis or diagnosis (TRIPOD): the TRIPOD statement. BMJ. 2015;350:g7594. doi:10.1136/bmj.g7594.
- Buysse DJ, Reynolds CF, 3rdMonk TH, et al. The pittsburgh sleep quality index: a new instrument for psychiatric practice and research. Psychiatry Res. 1989;28(2):193–213. doi:10.1016/0165-1781(89)90047-4.
- Liu XC, Tang MQ, Hu L. Reliability and validity of pittsburgh sleep quality index. Chin J Psychiatry. 1996;029(2):103–107.
- Ma XQ, Jiang CQ, Xu L, et al. Sleep quality and cognitive impairment in older Chinese: Guangzhou biobank cohort study. Age Ageing. 2019;49(1):119–124. doi:10.1093/ageing/afz120.
- Crowley K. Sleep and sleep disorders in older adults. Neuropsychol Rev. 2011;21(1):41–53. doi:10.1007/s11065-010-9154-6.
- Collaborative Group on Data Summary and Analysis of China Obesity Working Group. Prospective study for cut-off points of body mass index in Chinese adults. Chin J Epidemiol. 2002;6:22–25.
- Negeri ZF, Levis B, Sun Y, et al. Accuracy of the patient health questionnaire-9 for screening to detect major depression: updated systematic review and individual participant data meta-analysis. BMJ. 2021;375:n2183. doi:10.1136/bmj.n2183.
- Xiao SY. The theoretical basis and research application of social support rating scale. J Clin Psychiatry. 1994;1994(02):98–100.
- Ma C. The prevalence of depressive symptoms and associated factors in countryside-dwelling older Chinese patients with hypertension. J Clin Nurs. 2018;27(15–16):2933–2941. doi:10.1111/jocn.14349.
- Folstein MF, Folstein SE, McHugh PR. Mini-mental state”. a practical method for grading the cognitive state of patients for the clinician. J Psychiatr Res. 1975;12(3):189–198. doi:10.1016/0022-3956(75)90026-6.
- Huo Z, Lin J, Bat BKK, et al. Diagnostic accuracy of dementia screening tools in the Chinese population: a systematic review and meta-analysis of 167 diagnostic studies. Age Ageing. 2021;50(4):1093–1101. doi:10.1093/ageing/afab005.
- Zheng W, Chen Q, Yao L, et al. Prediction models for sleep quality among college students during the COVID-19 outbreak: cross-sectional study based on the internet new media. J Med Internet Res. 2023;25:e45721. doi:10.2196/45721.
- Pu L, Pan D, Wang H, et al. A predictive model for the risk of cognitive impairment in community middle-aged and older adults. Asian J Psychiatr. 2023;79:103380. doi:10.1016/j.ajp.2022.103380.
- Tibshirani R. Regression shrinkage and selection via the lasso robert tibshirani. JRStatSoc. Series B: stat Methodol. 2007;73:267–288.
- Zafar A, Attia Z, Tesfaye M, et al. Machine learning-based risk factor analysis and prevalence prediction of intestinal parasitic infections using epidemiological survey data. PLOS Negl Trop Dis. 2022;16(6):e0010517. doi:10.1371/journal.pntd.0010517.
- Kim M, Opsasnick L, Batio S, et al. Prevalence and risk factors of sleep disturbance in adults with underlying health conditions during the ongoing COVID-19 pandemic. Medicine . 2022;101(37):e30637. doi:10.1097/md.0000000000030637.
- Garcia Carlini GC, Silva Ribas CM, Maluf di Lernia R, et al. Physical exercise practice was positively associated with better dietary practices of aged people during COVID-19 social distance: a cross-sectional study. Clin Nutr ESPEN. 2023;54:98–105. doi:10.1016/j.clnesp.2023.01.015.
- Kantor J, Kantor BN, Fortgang RG, et al. Sleep quality impairment is associated with pandemic attitudes during the coronavirus disease 2019 (COVID-19) circuit breaker lockdown in England: a cross-sectional study. Front Public Health. 2022;10:819231. doi:10.3389/fpubh.2022.819231.
- Wang Y, Fu P, Li J, et al. Changes in psychological distress before and during the COVID-19 pandemic among older adults: the contribution of frailty transitions and multimorbidity. Age Ageing. 2021;50(4):1011–1018. doi:10.1093/ageing/afab061.
- Udeh-Momoh CT, Watermeyer T, Sindi S, et al. Health, lifestyle, and psycho-social determinants of poor sleep quality during the early phase of the COVID-19 pandemic: a focus on UK older adults deemed clinically extremely vulnerable. Front Public Health. 2021;9:753964. doi:10.3389/fpubh.2021.753964.
- Bhat BA, Mir RA, Hussain A, et al. Depressive and anxiety symptoms, quality of sleep, and coping during the 2019 coronavirus disease pandemic in general population in Kashmir. Middle East Curr Psychiatry. 2020;27(1):61. doi:10.1186/s43045-020-00069-2.
- Amicucci G, Salfi F, D'Atri A, et al. The differential impact of COVID-19 lockdown on sleep quality, insomnia, depression, stress, and anxiety among late adolescents and elderly in Italy. Brain Sci. 2021;11(10):1336. doi:10.3390/brainsci11101336.
- Chen Y, Zhang B. Latent classes of sleep quality and related predictors in older adults: a person-centered approach. Arch Gerontol Geriatr. 2022;102:104736. doi:10.1016/j.archger.2022.104736.
- Douaud G, Lee S, Alfaro-Almagro F, et al. SARS-CoV-2 is associated with changes in brain structure in UK biobank. Nature. 2022;604(7907):697–707. doi:10.1038/s41586-022-04569-5.
- Urmanche AA, Solomonov N, Sankin LS, et al. Research-practice partnership to develop and implement routine mental health symptom tracking tool among older adults during COVID-19. Am J Geriatr Psychiatry. 2023;31(5):326–337. doi:10.1016/j.jagp.2022.12.191.
- Liao G, Huang B, Lee PM, et al. Differences in sleep patterns and mental health problems during different periods of COVID-19 outbreak among community-dwelling older men in Hong Kong. Int J Public Health. 2022;67:1604363. doi:10.3389/ijph.2022.1604363.
- Yadav R, Yadav P, Kumar SS, et al. Assessment of depression, anxiety, and sleep disturbance in COVID-19 patients at tertiary care centre of North India. J Neurosci Rural Pract. 2021;12(2):316–322. doi:10.1055/s-0040-1722811.
- Sârbu F, Oprea VD, Tatu AL, et al. COVID-19-related psychiatric manifestations requiring hospitalization: analysis in older vs. younger patients. Exp Ther Med. 2022;24(2):497. doi:10.3892/etm.2022.11424.
- Liu J, Tao L, Gao Z, et al. Development and validation of a prediction model for early identification of critically ill elderly COVID-19 patients. Aging . 2020;12(19):18822–18832. doi:10.18632/aging.103716.
- Lebrasseur A, Fortin-Bédard N, Lettre J, et al. Impact of the COVID-19 pandemic on older adults: rapid review. JMIR Aging. 2021;4(2):e26474. doi:10.2196/26474.