
Abstract
Introduction: The elderly population grows globally every day, and along with it the incidence of high blood pressure also grows, following these data scientists seek tools to improve the health of this population, a widely used tool for assessing cardiovascular function is the heart rate variability(HRV), that is a mecanism that allows the investigation of oscillations in the intervals between consecutive heart beats (RR intervals). There are already studies on the autonomic nervous system in the elderly population, however, these studies investigated normotensive patients and there is little research in hypertensive patients.
Aim: To compare the cardiac autonomic modulation between healthy elderly and hypertensive elderly.
Method: The total sample was 80 elderly people- 40 healthy elderly and 40 elderly (HBP). Anthropometric data, HRV analysis and IPAQ questionnaire were collected. For the analysis of cardiac modulation data in the time domain (pNN50, SDNN and RMSSD) and frequency domain (LF and HF). The geometric analysis (RRtri, TINN, SD1, SD2 and SD1/SD2 ratios).
Results: In the time domain the MeanRR index presented a HAS increase 832.35 ± 104.46 ms vs control 782.73 ± 112.78 ms (p = 0.040). In the SDNN, there was a 58.35ms decrease vs the SAH 43.15 ms (p = 0.030). In the frequency domain, HF decreased control 247.00 ms2 vs HAS 157.00 ms2 (p = 0.002). In the geometric, the TINN and SD2 in the HAS group decreased in relation to the control from 203.38 ± 80.26 ms to 161.83 ± 53.25 ms (p = 0.018) and from 71.95 ms to 59.40 ms (p = 0.051). The mean SD1/SD2 ratio showed an increase between the Control and SAH groups from 0.22 ± 0.10 to 4.09 ± 1.18 and there was a statistical difference (p = 0.001).
Conclusion: Hypertensive elderly patients present decreased heart rate variability and decreased parasympathetic modulation when compared to normotensive elderly.
Introduction
The elderly population has grown since the beginning of the twenty-first century in the world, and with the arrival of old age some dysphonations begin to affect the human organism, among them the changes of the cardiovascular system are highlighted in this article. With the progression of age the heart suffers decrease of the beats, delayed relaxation of the ventricle that associated with arterial degenations and accumulation of fat decreasing the light of the vessels lead to a high incidence of high blood pressure (HBP) in the elderly [Citation1].
Data collected from a 3-decade study presented in a systematic review [Citation2] indicate that about two-thirds of the elderly have HBP and that the prevalence of the condition was substantially underestimated, in addition to concluding that public interventions to date have failed to reduce the prevalence of hypertension. In the cardiovascular system, there is a neural control closely linked to heart rate and baroreceptor reflex activity. The modulation of the autonomic nervous system through the sympathetic and parasympathetic pathways are linked with the individual's homeostasis and health/disease status [Citation3,Citation4].
In a population older than 40 years [Citation5], in both sexes the global autonomic regulation of the heart decreases linearly. And the parasympathetic flow shows the maximum point of decrease around the 7th decade of life. Changes in heart rate variability (HRV) patterns are associated with health impairments, which is directly related to the increase in morbidity and mortality due to overload of the cardiovascular system. Therefore, analyzing the behavior of modulation in the elderly and especially in the hypertensive elderly can collaborate on measures to identify risk of death, improve complementary treatments, and quality and health promotion in a political context for this population [Citation6].
Thus, the objective of this study was to compare the autonomic cardiac modulation between healthy elderly and hypertensive elderly, bringing as a novelty to the scientific community another tool for future studies of HRV in the elderly population.
Materials and methods
Study design
A cross-sectional study, the data collections occurred from June 2014 to June 2015, in the city of São Bernardo do Campo, Sao Paulo State, Brazil where participants already practiced physical activity regularly. All of them elderly patients over 65 years old who were living with HBP and healthy elderly as a control group were evaluated by the level of physical activity practice measured using the IPAQ short version questionnaire.
Exclusion and inclusion criteria
The inclusion criteria was as follows: individuals with a clinical and laboratory diagnosis of well-controlled hypertension; Be a practitioner of some regular physical activity at Clinica Pathernon were they have to be working out at least one year, 2 to 4 times/week in aquarobics or jogging and be over 65 years old. As exclusion criteria were individuals with pulmonary malformations; changes in the central nervous system and/or neurological syndrome and all those individuals with any medical condition that makes it impossible for them to adhere to the protocol or to perform it safely.
Eighty individuals were included as participants, 40 healthy elderly in control group and 40 elderly patients with hypertension group. The control group consisted of non-hypertensive elderly individuals who did not use any type of medication to control cardiovascular diseases. The hypertensive group were in drug control, only with drugs to control blood pressure without beta-blocking mechanisms. The individuals in hypertension group used diuretics drugs (30%), renin angina aldosterone system inhibitor (30%) and some individuals use the combination of the two drugs (40%).
Ethical aspects
This research was carried out following the norms that regulate human research contained in Resolutions number 466/12 and 251/97 of the National Health Council, according to the Research Ethics Committee of the Medicine of ABC University (CAEE 02830612.1 .0000.0082/Opinion 108.260). All the participants were previously instructed about the research, the procedures explained and signed the Informed Consent Form.
Instruments and data collection
After signing the Informed Consent Form, a General Anamnesis form was used to measure the anthropometric variables weight and height for the verification of body mass index, clinical data and clinical history.
Control of the ambient temperature (between 21° C and 23° C), humidity (between 40 and 60%) and preparation of the equipment to be used were performed before the arrival of the individuals at the test site. The patients were weighed without shoes, without heavy outer clothing or accessories, removing as much clothing as possible, in electronic scale, with capacity up to 150 kg and subdivisions up to 10g. For the measurement of height, patients pressed the heels, calves, buttocks and shoulders to the wall, positioning the head according to the Frankfurt plan [Citation5]. A stadiometer was used, fixed to the wall, with subdivisions in centimeters and millimeters.
After this first evaluation the IPAQ [Citation7] (International Physical Activity Questionnaire) questionnaire was applied. This scale, also validated in Brazil, proposed by the World Health Organization (1998), serves as a global instrument to determine the level of physical activity at the population level.
Measurements of systolic blood pressure, diastolic blood pressure and HRV were initially collected. The systolic blood pressure and diastolic blood pressure data were obtained by a single measure indirectly verified with a Welch Allyn aneroid sphygmomanometer positioned on the individual’s left arm and a Littmann-3M Classic II stethoscope on the median region of the ulnar fossa. For the respiratory rate a timer was used to count the number of chest excursions the patient made in one minute.
The Polar RS800CX heart rate monitor recorded the heart rate. The collection belt was placed on the volunteers' thorax and the heart rate-receiving clock [Citation8] previously validated equipment for heart rate pickup, beat-up and use of their data For HRV analysis.
After placement the band and the monitor the subjects were kept in the supine position and remained in rest for 10 minutes for the baseline HRV uptake. Data collection was performed from 1 pm to 4 pm to avoid alterations from the circadian cycle in HRV. After data collection, the monitor was connected to a computer and wireless receiver and data collection was transferred to a HRV analysis program called Polar Trainer 5.
The analysis was calculated using Kubios HRV analysis software-version 2.0 [Citation9,Citation10]. For this, heart rate behavior was recorded beat-to-beat throughout the experimental protocol, which was determined by time (10 minutes) and prior to the use of the RR series collected for data analysis, a manual digital filtering was performed to eliminate artifacts, and only series with more than 95% of sinus beats were included in the study [Citation9].
For this analysis the initial two minutes of the recovery period were considered, forming four analysis windows with 30 seconds each. According to Goldberg [Citation11], this methodology of analysis is adequate to evaluate the reactivation of post-exercise parasympathetic tone. After digital filtering, the signal was set (also digitally) at one time: the “M1” originated from the 10-minute rest period.
Analysis of heart rate variability
Time domain
In the time domain the statistical and geometric method was used to analyze the data of heart rate variability. In the statistical method are the indices obtained by determining corresponding RR intervals at any point of time [Citation2,Citation10], being RMSSD- It is the square root of the square mean of the differences between the adjacent normal RR intervals, expressed in ms; SDNN- Standard deviation of all normal RR intervals recorded in a time interval, expressed in milliseconds (ms); PNN50- Represents the percentage of adjacent RR intervals with the duration difference greater than 50ms.
The RMSSD and pNN50 indices represent predominantly parasympathetic modulation. The SDNN acts in both branches of the autonomic nervous system and does not allow to distinguish when the alterations are by withdrawal of vagal tone or increase of the sympathetic tone [Citation9,Citation12].
In the analysis by the geometric method [Citation13], the triangular index was calculated from the construction of a density histogram of the normal RR intervals, which shows in the horizontal axis (x axis) the length of the RR intervals and in the vertical axis Y) how often each one occurred. The union of the points of the columns of the histogram forms a figure of a triangle.
The triangle index (corresponding to the base of the triangle) can be calculated by dividing the area (corresponds to the total number of RR intervals used to construct the figure) and the height (corresponds to the number of RR intervals with modal frequency) The RRtri index was calculated from the construction of the density histogram of the normal RR intervals and will be obtained by dividing the histogram integral (this is the total number of RR intervals) by the maximum of the density distribution (modal frequency of the intervals RR), measured on a discrete scale with boxes of 7.8125 ms (1/128 seconds) [Citation12].
The TINN consists of the baseline width of the distribution measured as the base of a triangle, approaching the distribution of all RR intervals, in which the least squares difference was used to determine the triangle [Citation8].
SD1 (Standard deviation of instantaneous beat-to-beat variability) - represents the dispersion of points perpendicular to the line of identity and appears to be an index of instantaneous record of beat-to-beat variability; SD2 (Long-term standard deviation of continuous R-R intervals) - represents the dispersion of points along the identity line and represents the HRV in long-term records. The SD1/SD2 ratio, the ratio of both shows the ratio between the short and long variations of the RR intervals [Citation4].
Frequency domain
For the analysis of the HRV in the frequency domain was used the spectral components of low frequency, high frequency and LF/HF ratio, in ms2 and normalized units. To obtain the spectral indices the frequency Tachogram undergoes mathematical processing, and forms a graph that expresses the variation of the RR intervals as a function time [Citation14].
The tachograph contains a seemingly periodic signal that oscillates over time and is processed by mathematical algorithms, in this case the fast fourier transform. This method is used to obtain an estimate of the HRV spectral power during stationary phases of the experiment with the purpose of allowing comparisons between the results of studies.
The indices are the High Frequency (HF) component, ranging from 0.15 to 0.4Hz, which corresponds to respiratory modulation and is an indicator of the vagus nerve acting on the heart. The Low Frequency (LF) component, varying between 0.04 and 0.15 Hz, is a result of the joint action of the vagal and sympathetic components on the heart, predominantly sympathetic. And the LF/HF Ratio reflects the absolute and relative changes between the sympathetic and parasympathetic components of the autonomic nervous system, and characterize the sympathovagal balance over the heart [Citation15].
Statistical analysis
We used the Excel 2013 programs for the elaboration of the database and the program SPSS (Statistical Package for Social Research) version 21.0 for statistical analysis. The Kolmogorov-Smirnov test was used to verify normality of the data. For the variables that presented normal distribution, Student's t test was used for independent samples and for the variables that did not present normality, the Mann-Whitney test was used. A significance level of 0.05 (5%) was defined for this study, with 95% confidence intervals. The magnitude of the difference between the groups of heart rate variability parameters was quantified by the Cohen's d test. The size of the effect size was small considering values ≤0.2; Average between 0.25 and 0.5 and was large values ≥0.9 [Citation16].
Results
Eighty individuals were evaluated, 40 healthy elderly in control group and 40 elderly patients in the hypertension group. The characteristics of the two groups are showing in the .
Table 1. Characterization of the sample.
According to the data presented in there was an increase in mean MeanRR () of 782.73 ± 112.78ms in the Control group to 832.35 ± 104.46ms in the Hypertension group, there was statistical difference (p = 0.040). SDNN () presented a median decrease of 58.35ms in the Control group to 43.15ms in the Hypertension group and presented statistical difference (p = 0.030). The MeanHR presented a median decrease between the Control and Hypertension groups from 77.49bpm to 71.48bpm and there was a statistical difference (p = 0.034). The median RMSSD increased from 19.65 ms to 20.60 ms between the Control and Hypertension groups, and did not present statistical difference (p = 0.950). The median pNN50 showed a drop between the Control and Hypertension groups from 2.55% to 1.45%, and did not present statistical difference (p = 0.198).
Figure 1. Mean RR interval (MeanRR) of the patients in the control and hypertension groups. The symbols represent each subject from each group. • Control group and ▴Hypertension group.
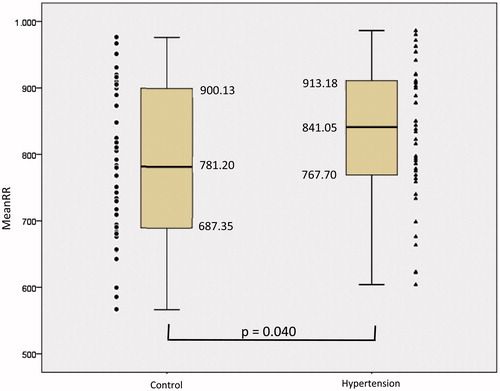
Figure 2. Standard deviation of the mean of all normal RR intervals (SDNN) of the patients in the control and hypertension groups. The symbols represent each subject from each group. • Control group and ▴Hypertension group.
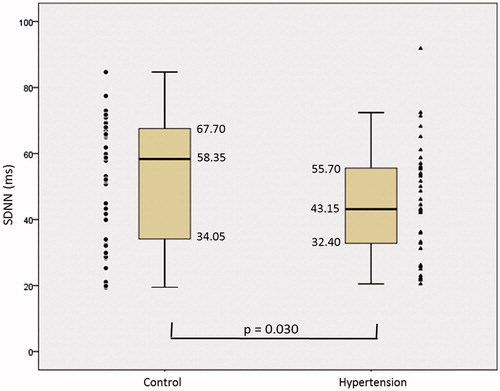
Table 2. Comparison of Heart Rate Variability parameters in the time domain between the control group and the hypertension group.
shows an increase in the median LF of 154.00 ms2 in the Control group to 213.50 ms2 in the Hypertension group and did not present statistical difference (p = 0,480). LF presented a median drop from 71.95nu in the Control group to 66.90nu in the Hypertension group, with no statistical difference (p = 0.071). HF () showed a median drop between Control and HBP from 247.00 ms2 to 157.00 ms2 and there was a statistical difference (p = 0.002). The median HF presented increase of 30,70nu in the Control group to 33,10nu for the Hypertension group, with no statistical difference (p = 0,390). The median LF/HF ratio decreased from 2.51 in the Control group to 2.02 in the Hypertension group, with no statistical difference (p = 0.462).
Figure 3. High frequency (HF), in control and hypertension groups. The symbols represent each subject from each group. • Control group and ▴Hypertension group.
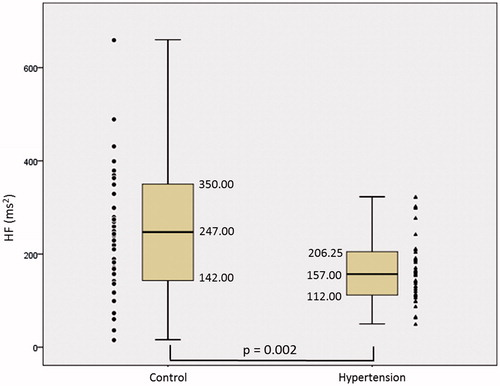
Table 3. Comparison of Heart Rate Variability parameters in the frequency domain between the control group and the hypertension group.
shows a decrease in TINN from 203.38 ± 80.26ms to 161.83 ± 53.25ms between Control and Hypertension groups and presented statistical difference (p = 0.018), there was an increase in the median SD1 of 13.20ms in the Control group for 14.30 ms in the Hypertension group and did not present statistical difference (p = 0.585). There was a decrease in RRTri from 9,61 + 3,5 to 8,62 + 2,53 between Control and Hypertension group (p = 0,053). SD2 presented a median drop of 71.95 ms in the Control group to 59.40 ms in the Hypertension group and presented a marginal statistical difference (p = 0.051). The mean SD1/SD2 ratio () showed an increase between the Control and Hypertension groups from 0.22 ± 0.10 to 4.09 ± 1.18 and there was a statistical difference (p = 0.001).
Figure 4. Ratio between SD1 and SD2 of the patients in the control and hypertension groups. The symbols represent each subject from each group. • Control group and ▴Hypertension group.
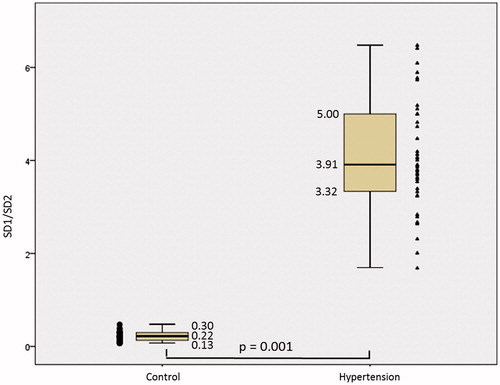
Table 4. Comparison of the geometric indices of Heart Rate Variability between the control group and the hypertension group.
Discussion
The results found in the present study suggest that elderly hypertensive patients present a decrease in heart rate variability when compared to normotensive elderly. In addition, there was a decrease in the parasympathetic modulation in the hypertensive elderly.
A decrease of the HRV in physiological aspects with the passing of the age, is already evidenced in other important scientific works [Citation17,Citation18], however all the studies are applied to normotensive patients, through similar foundation we bring in the present study important information for the elderly population with Hypertension, mainly applied to HRV.
Vascular compliance and blood pressure variability decrease with aging are also related to a higher sympathovagal balance. A study investigated [Citation19] the autonomic modulation in healthy elderly subjects submitted to aerobic exercise, showing an increase in sympathetic modulation and sympathovagal balance, as well as a reduction in vagal modulation in the elderly. Our study showed lower values of SDNN, TINN and SD1/SD2 ratio in the elderly hypertensive group, demonstrating a decrease in global heart rate variability compared to normotensive elderly.
Systemic blood pressure is maintained by sympathetic vasomotor tone regulated by the autonomic nervous system. In the elderly, compensatory adjustments in cardiovascular control result from sympathetic and parasympathetic dysfunction. The characteristics of aging in autonomic nervous control are examined in relation to the treatment of essential hypertension by beta-blockers in the elderly. The baroreceptor reflex and the renin response are decreased in the elderly [Citation20].
Some researchers [Citation18,Citation21] have already showed the use of angiotensin-inhibiting drugs and diuretics to reduce reflex sympathetic activity and increase vagal activity in the treatment of hypertension because these drugs have action on arterial baroreceptors and that hypertensive individuals have a good recovery of these reflexes through use of these drugs. Thus, our findings confirm other studies in the medical literature stating that heart rate variability is diffusely reduced in patients with moderate arterial hypertension. Our results demonstrate that even with a significant improvement in heart rate variability with the renin angiotensin aldosterone system and diuretic drugs, they continue to present a deficiency of vagal activity when compared to normotensive subjects.
Greater sympathetic modulation was established in the early stages of systemic arterial hypertension, suggesting that neurohormonal dysregulation may be the key to its etiology and progression. Our study had lower HF values in the hypertensive elderly group, showing a possible decrease in the parasympathetic modulation, but the LF values did not have statistical difference, thus, not showing sympathetic alterations.
Some studies have demonstrated that the HRV analysis can be used as a tool to aid in the prognosis of cardiovascular stress by the characterization of the autonomic components. It was found [Citation22,Citation23] a reduced HRV in hypertensive patients, showing an increase in LF parameter with a strong relation with hypertensive patients, but some authors [Citation23,Citation24] have shown that not all hypertensive patients have a sympathetic overload due to the fact that hypertension is a multifactorial disease.
Concomitantly to this fact, especially in the elderly population, there is a reduction of the baroreceptor reflex, which is believed to be secondary to an increase in arterial stiffness. It also seems that angiotensin converting enzyme inhibitors are not as effective for the autonomic control, even though one of the main medications used to combat hypertension [Citation22].
Some other studies [Citation24,Citation25] also got similar findings to ours regarding SDNN and RR alterations, but the same studies indicate changes with statistical significance in LF and LF/HF, contrary to our results that did not indicate changes in this activities. These changes may be due to our study being performed only with the elderly population, with resting heart activity.
Evidence also indicates HRV changes in hypertensive patients in relation to normotensive patients, such as the case demonstrated [Citation25], indicating changes with statistical significance in the parameters TP, LF, PNN50 and RMSSD reduced in the hypertensive group, this study was carried out with a general population (young, adult and elderly), contrary to our evidences totally directed to the elderly population where we observed a decrease in the baroreceptor reflex in hypertensive patients, compared to normotensive patients.
Some finds [Citation26], already showed that Cardiac autonomic modulation decreases gradually from infancy to old age, in addition to anothers studies [Citation4,Citation5], being indicators of the healthy elderly population, already having a decrease in HRV compared to younger.
The main information pointed by our study is patients with hypertension presented lower HRV in comparison to normotensive elderly, who already presented lower baroreceptor reflex due to physiological aging and require more attention from the health services. Our scientific contribution still indicates care for this population with greater attention of the cardiac activity, periodic medical visit, preferential aerobic physical exercises, good eating habits and elimination of habits considered unhealthy like alcohol and smoking.
It concluded that hypertensive elderly present a decreased heart rate variability and reduced parasympathetic modulation when compared to normotensive elderly.
Disclosure statement
No potential conflict of interest was reported by the authors.
References
- Bozkurt B, Aguilar D, Deswal A, et al. Contributory risk and management of comorbidities of hypertension, obesity, diabetes mellitus, hyperlipidemia, and metabolic syndrome in chronic heart failure: a scientific statement from the American Heart Association. Circulation. 2016;134:e535–e578.
- Picon RV, Fuchs FD, Moreira LB, et al. Prevalence of hypertension among elderly persons in urban Brazil: a systematic review with meta-analysis. Am J Hypertens. 2013;26:541–548.
- Zulfiqar U, Jurivich DA, Gao W, et al. Relation of high heart rate variability to healthy longevity. Am J Cardiol. 2010;105:1181–1185.
- Vanderlei FM, Rossi RC, Souza NMD, et al. Heart rate variability in healthy adolescents at rest. J Hum Growth Dev. 2012;22:173–178.
- Almeida-Santos MA, Barreto-Filho JA, Oliveira JL, et al. Aging, heart rate variability and patterns of autonomic regulation of the heart. Arch Gerontol Geriatr. 2016;63:1–8.
- Kleiger RE, Stein PK, Bosner MS, et al. Time domain measurements of heart rate variability. Cardiol Clin. 1992;10:487–498.
- Pardini R, Matsudo S, Araújo T, et al. Validation of the International Physical Activity Questionaire (IPAQ version 6): pilot study in Brazilian young adults. Rev Brasil Ciênc Mov. 2001;6:45–51.
- Barbosa MP, da Silva NT, de Azevedo FM, et al. Comparison of Polar® RS800G3™ heart rate monitor with Polar® S810i™ and electrocardiogram to obtain the series of RR intervals and analysis of heart rate variability at rest. Clin Physiol Funct Imaging. 2016;36:112–117.
- Heart rate variability: standards of measurement, physiological interpretation and clinical use. Task Force of the European Society of Cardiology and the North American Society of Pacing and Electrophysiology. Circulation. 1996;93:1043–1065.
- Niskanen JP, Tarvainen MP, Ranta-Aho PO, et al. Software for advanced HRV analysis. Comput Methods Programs Biomed. 2004;76:73–81.
- Goldberg MS, Burnett RT, Bailar JC, et al. Identification of persons with cardiorespiratory conditions who are at risk of dying from the acute effects of ambient air particles. Environ Health Perspect. 2001;109:487–494.
- Novais LD, Sakabe DI, Takahashi ACM, et al. Resting heart rate variability in sedentary healthy men and in trained men with hipertension and coronary heart disease. Rev Bras Fisioter. 2004;8:207–213.
- Rajendra Acharya U, Paul Joseph K, Kannathal N, et al. Heart rate variability: a review. Med Biol Eng Comput. 2006;44:1031–1051.
- Vanderlei LC, Pastre CM, Hoshi RA, et al. Basic notions of heart rate variability and its clinical applicability. Rev Bras Cir Cardiovasc. 2009;24:205–217.
- Mäkikallio TH, Huikuri HV, Mäkikallio A, et al. Prediction of sudden cardiac death by fractal analysis of heart rate variability in elderly subjects. J Am Coll Cardiol. 2001;37:1395–1402.
- Quintana DS. Statistical considerations for reporting and planning heart rate variability case-control studies. Psychophysiol. 2017;54:344–349.
- Nelson ME, Rejeski WJ, Blair SN, et al. Physical activity and public health in older adults: recommendation from the American College of Sports Medicine and the American Heart Association. Med Sci Sports Exerc. 2007;39:1435–1445.
- Menezes Júnior AdS Moreira HG, Daher MT. Análise da variabilidade da freqüência cardíaca em pacientes hipertensos, antes e depois do tratamento com inibidores da enzima conversora da angiotensina II. Arq Bras Cardiol. 2004;83:165–168.
- Umetani K, Singer DH, McCraty R, et al. Twenty-four hour time domain heart rate variability and heart rate: relations to age and gender over nine decades. J Am Coll Cardiol. 1998;31:593–601.
- Dietrich DF, Schindler C, Schwartz J, et al. Heart rate variability in an ageing population and its association with lifestyle and cardiovascular risk factors: results of the SAPALDIA study. Europace. 2006;8:521–529.
- Félix-Redondo FJ, Grau M, Fernández-Bergés D. Cholesterol and cardiovascular disease in the elderly. Facts and gaps. Aging Dis. 2013;4:154–169.
- Collins KJ. Age-related changes in autonomic control: the use of beta blockers in the treatment of hypertension. Cardiovasc Drug Ther. 1991;4(Suppl 6):1257–1262.
- Singh JP, Larson MG, Tsuji H, et al. Reduced heart rate variability and new-onset hypertension: insights into pathogenesis of hypertension: the Framingham Heart Study. Hypertension. 1998;32:293–297.
- Masuo K, Kawaguchi H, Mikami H, et al. Serum uric acid and plasma norepinephrine concentrations predict subsequent weight gain and blood pressure elevation. Hypertension. 2003;42:474–480.
- Sevre K, Lefrandt JD, Nordby G, et al. Autonomic function in hypertensive and normotensive subjects: the importance of gender. Hypertension. 2001;37:1351–1356.
- Moodithaya S, Avadhany ST. Gender differences in age-related changes in cardiac autonomic nervous function. J Aging Res. 2012;2012:679345.