
Abstract
Background: Aortic pulse wave velocity (aPWV) predicts cardiovascular complications, but the association of central arterial properties with blood lead level (BL) is poorly documented. We therefore assessed their association with BL in 150 young men prior to occupational lead exposure, using baseline data of the Study for Promotion of Health in Recycling Lead (NCT02243904).
Methods: Study nurses administered validated questionnaires and performed clinical measurements. Venous blood samples were obtained after 8–12 h of fasting. The radial, carotid and femoral pulse waves were tonometrically recorded. We accounted for ethnicity, age, anthropometric characteristics, mean arterial pressure, heart rate, smoking and drinking, and total and high-density lipoprotein serum cholesterol, as appropriate.
Results: Mean values were 4.14 μg/dL for BL, 27 years for age, 108/79/28 mm Hg for central systolic/diastolic/pulse pressure, 100/10% for the augmentation ratio/index, 1.63 for pressure amplification, 5.94 m/s for aPWV, 27/11 mm Hg for the forward/backward pulse pressure height, and 43% for the reflection index. Per 10-fold BL increase, central diastolic pressure and the augmentation ratio were respectively 5.37 mm Hg (95% confidence interval [CI], 1.00–9.75) and 1.57 (CI, 0.20–2.94) greater, whereas central pulse pressure and the forward pulse pressure height were 3.74 mm Hg (CI, 0.60–6.88) and 3.37 mm Hg (CI, 0.22–6.53) smaller (p ≤ .036 for all). The other hemodynamic measurements were unrelated to BL. The reflected pulse peak time was inversely correlated with diastolic pressure (r = −0.20; p ≤ .017).
Conclusion: At the exposure levels observed in our current study, aPWV, the gold standard to assess arterial stiffness, was not associated with BL. Increased peripheral arterial resistance, as reflected by higher diastolic pressure, might bring reflection points closer to the heart, thereby moving the backward wave into systole and increasing the augmentation ratio in relation to BL.
Introduction
Arterial stiffness predicts cardiovascular complications over and beyond traditional risk factors [Citation1–4]. The arterial pressure wave consists of a forward component generated by the heart and reflected waves returning from peripheral branching sites to the central aorta [Citation5–7]. In a stiff compared with an elastic central arterial tree, reflected waves return faster, reach the proximal aorta during systole, and augment late systolic blood pressure [Citation5–7]. Experts consider aortic pulse wave velocity as the gold standard in the assessment of arterial stiffness [Citation8,Citation9], whereas systolic augmentation is also influenced by other factors, such as cardiac output, stroke volume and left ventricular ejection time [Citation10]. According to the 2018 European guidelines [Citation9], a conservative threshold of aortic pulse wave velocity carrying risk in hypertensive patients is 10 m/s or higher.
Advancing age and higher blood pressure are the main drivers of arterial stiffening and increased aortic pulse wave velocity [Citation5,Citation11]. Whereas there is an abundant, but contradictory, literature on the association of blood pressure with lead exposure, a PubMed search using as keywords “pulse wave velocity” OR “augmentation index” OR “arterial stiffness” OR “pulse pressure” combined with “exposure” or “lead exposure” revealed only ten articles of potential relevance, describing the association of peripheral pulse pressure [Citation12–17], the ambulatory arterial stiffness index [Citation18], or central hemodynamic measurements [Citation19–21] with the lead concentration in blood [Citation12–20], urine [Citation18], toenails [Citation21] or bone [Citation13,Citation14,Citation16]. We therefore assessed the association of central hemodynamic measurements, including central blood pressure, systolic augmentation, aortic pulse wave velocity and pulse wave reflection, with blood lead, using the first in-study assessment (2015–2017) collected in the ongoing Study for Promotion of Health in Recycling Lead (SPHERL; NCT02243904). Study participants were young men examined prior to chronic exposure at lead recycling plants in the United States [Citation22].
Methods
Study design and study population
SPHERL (NCT02243904) is a longitudinal study of newly hired lead workers at battery manufacturing and lead recycling plants in the United States [Citation22]. SPHERL complies with the Helsinki declaration for investigations in humans [Citation23]. The Ethics Committee of the University Hospitals Leuven (Belgium) approved the study protocol and the information sheet and consent form for participants. From 1 May 2015 until 19 September 2017, 556 men applied for a job. All were invited to participate and 460 provided written informed consent (participation rate, 82.7%), of whom 448 completed the baseline examination. The informed consent forms are on file at the study sites and are not transferred to the coordinating center in Leuven to protect the confidentiality of the participants’ identity. Among these 448 men, 185 had their blood lead measured and had a high-quality assessment of their central hemodynamics available for analysis, including both pulse wave analysis and pulse wave velocity. Of the 185 workers eligible for analysis, we excluded 35, because of known previous occupational exposure to lead (N = 18), because they were on antihypertensive drug treatment (N = 13), or because variables had extreme values (N = 4). No worker was excluded because of an extreme blood lead level. In the four workers with outlying covariables, blood lead ranged from 0.60 to 13.6 μg/dL (geometric mean, 5.45 μg/dL). The number of workers statistically analyzed totaled 150.
Clinical and hemodynamic measurements
Study nurses administered validated questionnaires, inquiring into each worker’s medical history, previous occupations, exposure to heavy metals at work or during leisure time, smoking and drinking habits, intake of medications and lifestyle. Ethnicity was self-reported. The umbilicus and greater trochanter were the landmarks for measuring waist and hip circumference. After the workers had rested for 5 minutes in the supine position, nurses measured blood pressures twice to the nearest 2 mm Hg on the right arm, using a standard mercury sphygmomanometer (Riester GmbH, Jungingen, Germany) fitted with the appropriate cuff size according to European guidelines [Citation24]. Pulse pressure was systolic minus diastolic blood pressure. Mean arterial pressure was diastolic pressure plus one third of pulse pressure. Hypertension was a brachial blood pressure of at least 140 mm Hg systolic or 90 mm Hg diastolic.
Next, the nurses recorded during an 8-s period, the radial arterial waveform at the dominant arm by applanation tonometry. They used a high-fidelity SPC-301 micromanometer (Millar Instruments Inc., Houston, TX) interfaced with a laptop computer running the SphygmoCor software (AtCor Medical Pty. Ltd., West Ryde, New South Wales, Australia), version 9.0. Recordings were discarded when systolic or diastolic variability of consecutive waveforms exceeded 5%, when the amplitude of the pulse wave signal was less than 80 mV, and when the operator index was less than 80. From the radial signal, the SphygmoCor software calculates the aortic pulse wave by means of a validated generalized transfer function [Citation25,Citation26]. The software returns the central systolic, diastolic and pulse pressure, and the pressure at the first and second peak (shoulder) of the central waveform. The augmentation ratio and index are quotients of the second over the first peak of the central blood pressure wave and of the absolute difference between the second and first peak over central pulse pressure, both expressed as a percentage. Pressure amplification is the ratio of peripheral to central pulse pressure. From the central waveform, a triangular-flow pressure-based wave separation algorithm [Citation3], as implemented in the SphygmoCor software, allows computing the forward and backward pulse pressure amplitudes (Supplementary Figure 1) and the timing of their peak height relative to the electrocardiographic QRS complex. The reflection index was the ratio of the backward to the forward pulse pressure amplitude expressed as percentage. For pulse wave analysis, mean arterial pressure and diastolic pressure, as obtained from the second brachial blood pressure reading [Citation27], were entered in the SphygmoCor software.
Aortic pulse wave velocity was measured by sequential electrocardiographically gated recordings of the arterial waveform at the carotid and femoral arteries. Nurses measured the distance from the suprasternal notch to the carotid sampling site (distance A), and from the suprasternal notch to the femoral sampling site (distance B). Pulse wave travel distance was calculated as distance B minus distance A [Citation28]. Pulse transit time was the average of 10 consecutive beats [Citation8]. Carotid–femoral pulse wave velocity is the ratio of the travel distance in meters to transit time in seconds. Pulse wave velocity was discarded if the standard error of the mean of 10 beats exceeded 10%. We standardized the augmentation ratio, augmentation index, pressure amplification, the forward and reflected pulse pressure amplitude, and aortic pulse wave velocity to a heart rate of 65 beats per minute (approximately the mean in the study population). The arterial measurements were first regressed on heart rate to obtain the β for each time-dependent hemodynamic variable. Next, we calculated the standardized variables using the formula: standardized variable = crude variable – β × (observed heart rate – 65).
Biochemical measurements
Venous blood samples were obtained after 8–12 h of fasting. Lead levels were determined on whole blood by inductively coupled plasma mass spectrometry at an analytical laboratory certified for blood lead analysis in compliance with the provisions of the OSHA Lead Standard, 29CFR 1910.1025 (Occupational Safety and Health Administration [www.osha.gov]). Prior to analysis, the specimens were digested with nitric acid and spiked with an iridium internal standard. The detection limit was 0.5 µg/dL. Accuracy, defined as the deviation from known lead standards ran along with the samples in each test run, was less than 10%. The bias determined according to the Bland and Altman approach [Citation29] in 30 spilt blood samples with blood lead concentrations (average in duplicate samples) ranging from 0.70 to 27.9 μg/dL, was 0.08 μg/dL. The repeatability coefficient, defined as twice the SD of the signed differences between duplicate measurements [Citation29] was 0.52 (95% confidence interval, –0.01 to 0.18, p=.078). Expressed as a percentage of the mean blood lead concentration or as a percentage of near maximal variation in blood lead (four times the SD of the logarithmically transformed distribution), the repeatability coefficient was 6.7% and 1.9%, respectively. Lower values indicate better repeatability. Serum total and high-density lipoprotein (HDL) cholesterol and blood glucose were measured by automated enzymatic methods and serum insulin and cystatin C by ELISA. We estimated the glomerular filtration rate from serum cystatin C, using the Chronic Kidney Disease Epidemiology Collaboration equations [Citation30]. The analytical laboratory participated in proficiency testing programs, including the PA DOH [Pennsylvania Department of Health] Blood Lead Proficiency Program. Over three evaluations, the laboratory obtained a proficiency score of 100% for lead, 100% for routine biochemistry, and 98% for insulin. From 2015 to 2018, the laboratory also passed proficiency testing for blood lead organized by the College of American Pathologists (CAP), the Wisconsin State Laboratory of Hygiene (WSLH), and the Centers of Disease Control and Prevention Lead and Multielement Proficiency Program (CDC-LAMP).
Data processing and statistical analysis
Database management and statistical analysis were done using SAS 9.4 software (Carey, NC). The flow and quality control of the data are described in the published protocol [Citation22]. Departure from normality was evaluated using Shapiro-Wilk’s statistic. Skewness and kurtosis were computed as the third and fourth moments of the mean divided by the cube of the standard deviation. We applied a base-10 logarithmic transformation to normalize the distributions of blood lead and serum insulin. The central tendency (spread) was represented by the arithmetic mean (SD) for normally distributed variables and by the geometric mean (interquartile range) for log-normally distributed variables. To compare means and proportions, we applied a t-statistic, and the χ2-statistic or Fisher exact test, respectively.
In exploratory analyses, we assessed blood pressure levels and central hemodynamic measurements in participants with a blood lead concentration below and above the median of the distribution. We identified potential covariables by stepwise regression analysis. The covariables considered were ethnicity (white vs. non-white), age, body height, body weight, the waist-to-hip ratio, current smoking and drinking, the total-to-HDL cholesterol ratio, and additionally mean arterial pressure for the time-dependent central hemodynamic measurements. In sensitivity analyses, we also accounted for eGFR and serum insulin. We computed the multivariable-adjusted associations of the blood pressure levels and central hemodynamic measurements with blood lead, using linear regression. Significance was a 2-tailed α-level of 0.05 or less.
Results
Characteristics of participants
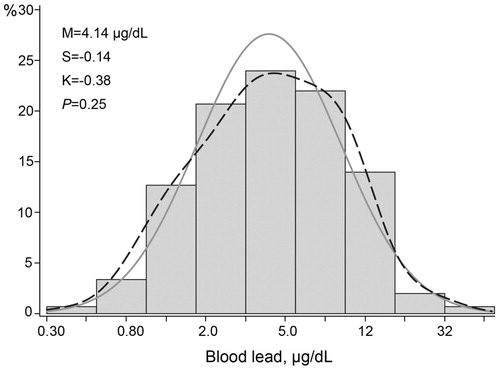
The 150 newly hired workers included 72 Whites (48.0%), 70 Hispanics (46.7%), 4 Blacks (2.7%), 1 Asian (0.7%), and 3 workers of mixed ethnicity (2.0%). Prevalence amounted to 54 (36.2%) for smoking, 67 (45.0%) for alcohol consumption, 37 (24.7%) for hypertension, and 2 (1.3%) for diabetes mellitus. Among all workers, mean values (± SD) were 27.0 ± 8.4 years for age (interquartile range [IQR], 21.0–30.1 years), 125.9 ± 12.8 mm Hg and 78.0 ± 9.9 mm Hg for brachial systolic and diastolic blood pressure, 63.3 ± 10.2 beats per minute for heart rate, 174.6 ± 6.9 cm and 83.8 ± 18.8 kg for body height and weight (Supplementary Table 1). The serum total-to-HDL cholesterol ratio, blood glucose, eGFR and serum insulin averaged 3.93 ± 1.29, 92.0 ± 10.6 mg/dL, 128.4 ± 13.6 mL/min/1.73 m2 and 6.5 μU/mL (IQR, 3.5–11.2 μU/mL), respectively (Supplementary Table 1). The geometric mean blood lead concentration at the pre-employment physical examination was 2.47 μg/dL (IQR, 2.00–3.00 μg/dL). The first in-study assessment of blood lead, done simultaneously with the hemodynamic assessment, was performed 21 days (IQR, 10–31 days) after workers had started employment. At that time point, the geometric mean blood lead concentration was 4.14 μg/dL (IQR, 2.50–8.00 μg/dL; ).
Figure 1. Distribution of the Logarithmically Transformed Blood Lead Concentration. M, S and K indicate the mean and the coefficients of skewness and kurtosis. The solid and dotted lines represent the normal and kernel density distributions. The p value is for departure of the actually observed distribution from normality according to the Shapiro-Wilk test.
lists the characteristics of the workers by the median blood lead concentration. There were no differences between the low and high lead categories except for smoking (27.4% vs. 44.2%; p = .033), body weight (87.4 vs. 80.4 kg; p = .021), body mass index (28.3 vs. 26.4 kg/m2; p = .028), brachial pulse pressure (50.3 vs. 45.6 mm Hg; p = .032) and blood glucose (90.0 vs. 93.9 mg/dL; p = .023). Brachial diastolic pressure was slightly higher in the high than low blood lead group (79.3 vs. 76.4 mm Hg; p = .058).
Table 1. Characteristics of workers by the median of the blood lead distribution.
Central hemodynamic measurements
In all participants, the central systolic, diastolic and pulse pressure averaged 108.1 ± 9.4 mm Hg, 78.8 ± 10.0 mm Hg, 28.3 ± 7.2 mm Hg respectively (Supplementary Table 2). Mean values for the augmentation ratio, the augmentation index and pressure amplification, standardized to a heart rate of 65 beats per minute, were 100.2 ± 3.6%, 10.2 ± 7.6% and 1.63 ± 0.15%. The standardized aortic pulse wave velocity averaged 5.94 ± 1.85 m/s. Mean values for the forward pulse pressure amplitude, reflected pulse pressure amplitude and reflection index, derived from the wave separation analysis and standardized to a heart rate of 65 beats per minute, were 27.4 ± 7.5 mm Hg, 11.4 ± 2.6 mm Hg and 42.9 ± 11.0%, respectively (Supplementary Table 2).
lists the central hemodynamic of the workers by the median of the blood lead distribution. There were no differences between the low and high lead categories (p≥.10) except for central diastolic pressure, central pulse pressure and the forward pulse pressure height. In the high compared with the low blood lead group, central diastolic blood pressure was slightly higher (80.3 vs. 77.2 mm Hg; p = .059), whereas central pulse pressure (28.1 vs. 30.6 mm Hg; p = .029) and the forward pulse pressure height (26.2 vs. 28.8 mm Hg; p = .031) were significantly lower. The findings for the time-dependent central hemodynamic measurements were consistent, irrespective of the standardization for heart rate (Supplementary Table 3).
Table 2. Central hemodynamic measurements by median of the blood lead distribution.
The augmentation ratio, augmentation index, aortic pulse wave velocity and the reflection index increased with older age (Supplementary Figure 2), whereas the forward pulse pressure amplitude decreased with age. The reflected pulse peak time was inversely correlated with peripheral (r = −0.20; p = .017) and central (r = −0.20; p = .013) diastolic pressure.
Peripheral and Central blood pressure
We performed linear regression analysis relating the peripheral and central blood pressure levels to blood lead (), first unadjusted and next adjusted for ethnicity, age, body height, body weight, waist-to-hip ratio, smoking and drinking and the total-to HDL cholesterol ratio. The stepwise regression results for covariables were listed in Supplementary Table 4. Irrespective of the adjustment, peripheral and central systolic pressures were not associated with blood lead (p ≥ .36), the same for mean arterial pressures (p ≥ .073). In unadjusted analyses, the associations of peripheral and central diastolic pressure with blood lead were nonsignificant (p ≥ .13). With adjustment, peripheral and central diastolic pressures were approximately 5.5 mm Hg higher for a 10-fold increase in blood lead (p ≤ .015; ). Irrespective of adjustment, peripheral and central pulse pressures were inversely related to blood lead (). In the adjusted analyses, the association sizes for a 10-fold higher blood lead amounted 6.92 mm Hg (p = .017) for peripheral pulse pressure and 3.74 mm Hg (p = .020) for central pulse pressure ().
Figure 2. Association of central systolic pressure (A), central diastolic pressure (B) and central pulse pressure (C) with blood lead. For each association the adjusted regression line with 95% confidence interval was depicted. The models accounted for ethnicity, age, body height, body weight, the waist-to-hip ratio, smoking and drinking, and the total-to HDL cholesterol ratio.
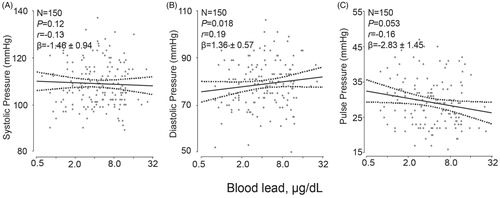
Table 3. Associations of hemodynamic measurements with blood lead.
Time-dependent central hemodynamic measurements
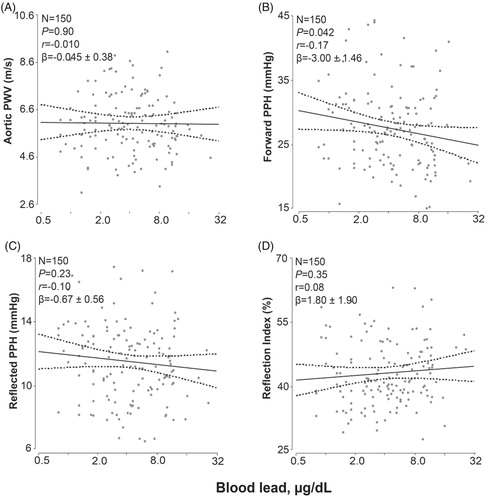
The time-dependent hemodynamic measurements were standardized to a heart rate of 65 beats per minute. Adjusted analyses accounted for the same covariables as mentioned before and additionally for mean arterial pressure. In unadjusted and adjusted analyses (), the augmentation ratio, augmentation index, pressure amplification, the forward and reflected pulse peak times did not correlate with blood lead (p ≥ .23) with exception of the augmentation ratio in the adjusted analysis. The association size for a 10-fold increment in blood lead was 1.57% (p = .025; ). Irrespective of adjustment, aortic pulse wave velocity and the reflection index did not correlate with blood lead (p ≥ .32). However, both the forward and reflected pulse pressure height tended to be lower with higher blood lead (). This trend reached significance for the forward pulse pressure height in the adjusted analysis (−3.37 mm Hg; p = .036; ) and for the reflected pulse pressure height in the unadjusted analysis (−1.19 mm Hg; p = .045).
Figure 3. Association of the augmentation ratio (A), augmentation index (B) and pressure amplification (C) standardized to a heart rate of 65 beats per minute with blood lead. The augmentation ratio was the ratio of the second over the first peak of the central blood pressure wave. The augmentation index was the absolute difference between the second and first peak over central pulse pressure. Pressure amplification was the ratio of peripheral over central pulse pressure. The ratios were expressed in percent and standardized to a heart rate of 65 beats per minute. For each association the adjusted regression line with 95% confidence interval was depicted. The models accounted for ethnicity, age, body height, body weight, the waist-to-hip ratio, mean arterial pressure, smoking and drinking, and the total-to HDL cholesterol ratio.
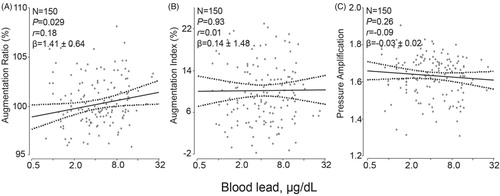
Figure 4. Association of the aortic pulse wave velocity (A), the forward pulse pressure height (B), the reflected pulse pressure height (C) and the reflection index (D) standardized to a heart rate of 65 beats per minute with blood lead. The forward and backward pulse pressure amplitudes were derived from the central pulse wave by a triangular-flow pressure-based wave separation algorithm. The reflection index was the ratio of the backward to the forward pulse pressure amplitude expressed as percentage. The measurements were standardized to a heart rate of 65 beats per minute. For each association the adjusted regression line with 95% confidence interval was depicted. The models accounted for ethnicity, age, body height, body weight, the waist-to-hip ratio, mean arterial pressure, smoking and drinking, and the total-to HDL cholesterol ratio.
Sensitivity analyses
Additional adjustment for serum insulin (or blood glucose) and eGFR produced consistent results for the associations of blood lead with the central blood pressure and the other central hemodynamic indexes (Supplementary Table 5). To exclude a background effect of the cumulative lead dose, we computed the fully adjusted slopes of central diastolic pressure, central pulse pressure, the augmentation ratio and the forward pulse pressure height in participants aged up to 40 years (N = 136) or up to 30 years (N = 112). As shown in Supplementary Table 6, the association sizes of the hemodynamic measurements in these subgroups limited by age were consistent with those reported in . We also performed a sensitive analysis for central hemodynamics calibrated by form factor 0.4 (mean arterial pressure = diastolic blood pressure + 0.4 × pulse pressure). The results (Supplementary Tables 7 and 8) were in close agreement with those reported in and .
Discussion
In the 150 newly hired workers enrolled in our current study, the geometric mean blood lead concentration was 4.14 μg/dL. We failed to demonstrate a significant association of aortic pulse wave velocity, which is the gold standard in the assessment of arterial stiffness [Citation8,Citation9], with blood lead. Peripheral and central diastolic pressure and the augmentation ratio were greater with higher blood lead, whereas the opposite was the case for peripheral and central pulse pressure and for the forward pulse pressure height. The decrease in pulse pressure with higher blood lead concentration can be easily explained by the lack of association of systolic pressure with blood lead and the positive relation of diastolic pressure with blood lead. We propose that increased peripheral arterial resistance, as reflected by higher diastolic pressure [Citation31], brings reflection points closer to the heart and thereby moves the backward wave into systole and increases the augmentation ratio (Supplementary Figure 1) in relation to blood lead. This assumption is supported by the inverse association between the reflected pulse peak time and diastolic pressure (r = −0.20; Supplementary Figure 3).
In a previously published manuscript based on the baseline SPHERL data [Citation32], we assessed the association of blood pressure with blood lead in 236 male workers prior to occupational lead exposure. Consistent with our current findings, in multivariable-adjusted analyses, brachial diastolic pressure on in-office measurement was around 2.67 mm Hg higher for a 10-fold increase in blood lead (p = .043). However, in unadjusted and multivariable-adjusted analyses, the 24-h, awake and asleep systolic and diastolic blood pressures and the odds of having hypertension were unrelated to the blood lead level. The white-coat effect explained the significant association between office diastolic blood pressure and blood lead. Guidelines in North America [Citation33,Citation34] and Europe [Citation35,Citation36] unanimously recommend ambulatory monitoring as the method of choice to record blood pressure. Our interpretation was therefore that the weak positive association between diastolic pressure and blood lead was due either to measurement error inherent to the auscultatory Korotkoff method [Citation37], or to the white-coat effect reflecting arousal and sympathetic activation in a medical environment [Citation38], or both.
The interpretation of the scant literature on the possible association of central hemodynamics with lead exposure is difficult [Citation18–21,Citation39], because most studies applied a suboptimal method to assess central hemodynamics [Citation18,Citation39], had a small sample size [Citation21], or had a case-control design [Citation18–20]. Among 420 men working as bus drivers in Bangkok [Citation39], Thailand, age averaged 41.6 years and the blood lead concentration ranged from 2.5 to 16.2 μg/dL (mean, 6.3 μg/dL). The vascular aging index derived from the second derivative of the finger photo plethysmogram increased with blood lead, but the biomarker of exposure explained only 1.5% of the variance (p = .003) in a stepwise regression model already including age and body mass index [Citation39]. However, this study [Citation39] did not report on systolic pressure augmentation in the ascending aorta, which is also possible to derive from the finger plethysmogram [Citation40]. In an observational follow-up study of 25 welders, there was no association between the augmentation index, measured by the SphygmoCor system, and the lead concentration in toenails [Citation21].
In a case-control study of 53 lead-exposed hypertensive men (mean blood lead, 25.3 μg/dL) and 52 non-exposed controls (5.4 μg/dL), participants (mean age, 44.5 years) underwent wall-tracking ultrasonographic imaging of the carotid artery [Citation19]. Mean values of the carotid intima-media thickness (1.14 vs. 0.98 mm), local carotid stiffness (12.0 vs. 9.8), augmentation index (26.0 vs. 20.1%) and the one-point pulse wave velocity (7.6 vs. 6.9 m/s) were significantly higher in exposed workers, whereas the opposite was the case for carotid arterial compliance (0.57 vs. 0.69 mm3/KPa). In a case-control study of 68 lead-exposed workers (mean age, 34.7 years; median blood and urinary lead concentrations, 40.5 µg/dL and 34.9 µg/L, respectively) without known cardiovascular risk factors matched with 68 healthy controls [Citation18], the ambulatory arterial stiffness index was higher in lead-exposed workers (0.42 vs. 0.37; p = .007) and correlated with both blood (r = 0.42; p < .001) and urinary (r = 0.24; p = .047) lead levels. With adjustments applied the association remained significant with blood lead only [Citation18]. In a case-control study of 41 exposed workers (mean blood lead, 45.4 µg/dL) and 39 healthy controls (1.2 µg/dL) with mean age of 36.3 years, aortic strain (9.4 vs. 12.4%; p = .004) and aortic distensibility (0.45 vs. 0.55; p = .046) were lower in exposed compared with non-exposed participants [Citation20]. The aforementioned case-control studies are no longer relevant for environmental and occupational lead exposure in the United States. Indeed, among American adults, mean blood lead levels decreased from 13.1 μg/dL in the National Health and Nutrition Examination Survey II (NHANES II; 1976–1980) [Citation41,Citation42] to 2.76 μg/dL in NHANES III (1988–1994) [Citation43] and to 1.64 μg/dL in NHANES IV (1999–2002) [Citation43].
Above 60 years of age, pulse pressure is a cardiovascular risk factor [Citation44] and may add to the Framingham risk score [Citation1]. In multivariable-adjusted analyses of 1925 Mexican-American men (mean age, 37.6 years; mean blood lead, 2.47 μg/dL) enrolled in NHANES 1999–2006, brachial diastolic pressure was 1.34 mm Hg lower and pulse pressure 1.42 mm Hg higher for each 2.7-fold increment in blood lead [Citation15]. These associations were not replicated in Mexican-American women and White and Black participants [Citation15]. In a cross-sectional analysis of 593 men not treated with antihypertensive medications enrolled in the Normative Aging Study (mean age, 66.6 years), pulse pressure was positively associated with the tibia lead concentration with a multivariable-adjusted p-value for trend across fifths of the exposure biomarker of 0.02 [Citation13]. The corresponding association with blood lead (mean, 6.1 μg/dL) was far from significant (p = .82). In a study of 193 Chinese women, including 123 lead-exposed crystal toy makers (mean age, 27.3 years; mean blood lead, 55.5 μg/dL), brachial pulse pressure was weakly associated with blood lead. Women with a blood lead concentration of 60 μg/dL or more (N = 47) had a 3.4 greater pulse pressure (p = .022) than non-exposed workers (N = 70; 6.4 μg/dL). None of the above studies [Citation12,Citation13,Citation15] reported on central pulse pressure.
Our current study also suggested a negative association between forward pulse pressure amplitude and blood lead, which might indicate that lead exposure is associated with impaired systolic left ventricular dysfunction. We previously reported that in a randomly recruited population sample [Citation45], a doubling of blood lead was associated with slightly decreases in global longitudinal strain (–0.392%; p = .034), regional longitudinal strain (–0.618%; p = .028) and strain rate –0.113 s−1; p = .008). In this population sample, the geometric mean blood lead level was 4.19 µg/dL, which is comparable with the blood lead levels in our current worker study. However, the healthy worker effect might exclude extrapolation of population data to the laborers [Citation46].
Strengths and limitations of the study
To our knowledge, our current study is the first to report on the association of blood lead with the central blood pressure level and other time-dependent central hemodynamic variables, as measured by the state-of-the-art SphygmoCor tonometric approach [Citation47,Citation48]. Nevertheless, our current findings must also be interpreted within the context of their limitations. First, of 448 workers examined, only 150 (33.5%) could be included in the present analysis. Workers analyzed compared with those not analyzed (Supplementary Table 9) were slightly younger (27.0 vs. 29.5 years; p = .012) and leaner (27.4 vs. 29.7 kg/m2; p = .0004) and had lower blood glucose (90.0 vs. 95.2 mg/dL; p = .002). However, the other characteristics, including blood pressure, total and HDL serum cholesterol, serum insulin, eGFR and blood lead were similar in both groups (p ≥ .30). Second, findings in workers cannot be extrapolated to the general population, because of the so-called healthy worker effect [Citation46]. Third, although our study population was ethnically diverse, it included a majority of Whites and no women. Fourth, the mechanisms underlying our current observations need further clarification. The arterial system is usually modeled as a two-element (resistance and compliance) or three-element (resistance, compliance and aortic characteristic impedance) windkessel model, where a central reservoir fills during systole and empties during diastole [Citation49]. A variant of the windkessel model has been proposed, which incorporates both reservoir- and wave-based approaches in a single model [Citation50], but this model remains under discussion [Citation31]. More importantly, the SphygmoCor approach only offers an instantaneous approach to assess the central hemodynamics and does not provide information on the diurnal variation in the central hemodynamics [Citation51]. Our current observations and our previous findings [Citation32] suggest that assessing sympathetic nervous activity during the assessment of the central hemodynamics might clarify why we observed a positive relation between brachial diastolic pressure and blood lead [Citation32]. Finally, a potential limitation of our study was that we did not measure bone lead as exposure marker. Approximately 95% of the total body burden of lead is stored in the skeleton, and measurement of bone lead levels can provide a more accurate measure of the internal dose [Citation52]. However, blood lead reflects both recent exogenous exposure and endogenous redistribution of the lead stored in bone [Citation52]. To exclude confounding by the total lead body burden, we ran a sensitivity analysis confined to middle-aged and young workers age, which produced consistent results (Supplementary Table 6).
Conclusions
At the exposure levels observed in our current study, aortic pulse wave velocity, the gold standard to assess arterial stiffness [Citation8,Citation9], was not associated with blood lead. Increased peripheral arterial resistance, as reflected by higher diastolic pressure, might bring reflection points closer to the heart, thereby moving the backward wave into systole and increasing the augmentation ratio in relation to blood lead. The workers enrolled in SPHERL are being followed up for 2 years, during which time they will be chronically exposed to lead and their blood lead concentration is expected to increase three- to five-fold. This longitudinal follow-up will potentially generate new insights relating central hemodynamics to lead exposure, thereby clarifying whether altered arterial properties might be an intermediate mechanism in explaining the possible association of cardiovascular mortality with blood lead among US adults [Citation53].
Spchpb7_spl.doc
Download MS Word (2.7 MB)Acknowledgements
The authors gratefully acknowledge the nursing staff employed at the study sites in the United States and the expert clerical assistance of Vera De Leebeeck and Renilde Wolfs at the Studies Coordinating Centre in Leuven, Belgium.
Disclosure statement
No potential conflict of interest was reported by the authors.
Additional information
Funding
References
- Nawrot TS, Staessen JA, Thijs L. Should pulse pressure become part of the Framingham risk score? J Hum Hypertens. 2004;18:279–286.
- Hansen TW, Staessen JA, Torp-Pedersen C, et al. Prognostic value of aortic pulse wave velocity as index of arterial stiffness in the general population. Circulation 2006;113:664–670.
- Lieber A, Millasseau S, Bourhis L, et al. Aortic wave reflection in women and men. Am J Physiol Heart Circ Physiol. 2010; 299:H236–H242.
- Ben-Shlomo Y, Spears M, Boustred C, et al. Aortic pulse wave velocity improves cardiovascular event prediction: an individual participant meta-analysis of prospective observational data from 17.635 subjects. J Am Coll Cardiol. 2014;63:636–646.
- Mitchell GF, Parise H, Benjamin EJ, et al. Changes in arterial stiffness and wave reflection with advancing age in healthy men and women: the Framingham Heart Study. Hypertension. 2004;43:1239–1245.
- Segers P, Rietzschel ER, De Buyzere ML, et al. Noninvasive (input) impedance, pulse wave velocity, and wave reflection in healthy middle-aged men and women. Hypertension. 2007;49:1248–1255.
- Li Y, Gu H, Fok H, et al. Forward and backward pressure waveform morphology in hypertension. Hypertension. 2017;69:375–381.
- Laurent S, Cockcroft J, Bortel LV, et al. Expert consensus document on arterial stiffness: methodological issues and clinical applications. Eur Heart J. 2006;27:2588–2605.
- Williams B, Mancia G, Spiering W, et al. 2018 ESC/ESH Guidelines for the management of arterial hypertension: The Task Force for the management of arterial hypertension of the European Society of Cardiology and the European Society of Hypertension. J Hypertens. 2018;36:1953–2041.
- O'Rourke MF. Influence of ventricular ejection on the relationship between central aortic and brachial pressure pulse in man. Cardiovasc Res. 1970;4:291–300.
- Mitchell GF, Guo CY, Benjamin EJ, et al. Cross-sectional correlates of increased aortic stiffness in the community: the Framingham Heart Study. Circulation. 2007;115:2628–2636.
- Nomiyama K, Nomiyama H, Liu SJ, et al. Lead induced increase of blood pressure in female lead workers. Occup Environ Med. 2002;59:734–738.
- Perlstein T, Weuve J, Schwartz J, et al. Cumulative community-level lead exposure and pulse pressure: the normative aging study. Environ Health Perspect. 2007;115:1696–1700.
- Zhang A, Park SK, Wright RO, et al. HFE H63D polymorphism as a modifier of the effect of cumulative lead exposure on pulse pressure: the Normative Aging study. Environ Health Perspect. 2010;118:1261–1266.
- Scinicariello F, Abadin HG, Murray HE. Association of low-level blood lead and blood pressure in NHANES 1999-2006. Environ Res. 2011;111:1249–1257.
- Jhun MA, Hu H, Schwartz J, et al. Effect modification by vitamin D receptor genetic polymorphisms in the association between cumulative lead exposure and pulse pressure: a longitudinal study. Environ Health. 2015;14:5.
- Zachariah JP, Wang Y, Penny DJ, et al. Relation between lead exposure and trends in blood pressure in children. Am J Cardiol. 2018;S0002–9149:31732–31736.
- Karakulak UN, Yilmaz ӦH, Tutkun E, et al. Evaluation of the ambulatory arterial stiffness index in lead-exposed workers. Anatol J Cardiol. 2017;18:10–14.
- Poręba R, Gać P, Poręba M, et al. Relationship between occupational exposure to lead and local arterial stiffness and left ventricular diastolic function in individuals with arterial hypertension. Toxicol Appl Pharmacol. 2011;254:342–348.
- Ozturk MT, Yavuz B, Ozkan S, et al. Lead exposure is related to impairment of aortic elasticity parameters. J Clin Hypertens (Greenwich). 2014;16:790–793.
- Wong JYY, Fang SC, Grashow R, et al. The relationship between occupational metal exposure and arterial compliance. J Occup Environ Med. 2015;57:355–360.
- Hara A, Gu YM, Petit T, et al. Study for promotion of health in recycling lead – rationale and design. Blood Pressure. 2015;24:147–157.
- General Assembly of the World Medical Association. World Medical Association Declaration of Helsinki: ethical principles for medical research involving human subjects. J Am Coll Dent. 2014;81:14–18.
- Mancia G, Fagard R, Narkiewicz K, et al. 2013 ESH/ESC Guidelines for the management of arterial hypertension: The Task Force for the management of arterial hypertension of the European Society of Hypertension (ESH) and of the European Society of Cardiology (ESC). Eur Heart J. 2013;34:2159–2219.
- Karamanoglu M, O’Rourke MF, Avolio AP, et al. An analysis of the relationship between central aortic and peripheral upper limb pressure waves in man. Eur Heart J. 1993;14:160–167.
- Pauca AL, O’Rourke MF, Kon ND. Prospective evaluation of a method for estimating ascending aortic pressure from the radial artery pressure waveform. Hypertension. 2001;38:932–937.
- Van Bortel LM, Balkestein EJ, van der Heijden-Spek JJ, et al. Non-invasive assessment of local arterial pulse pressure: comparison of applanation tonometry and echo-tracking. J Hypertens. 2001;19:1037–1044.
- Weber T, Ammer M, Rammer M, et al. Noninvasive determination of carotid-femoral pulse wave velocity depends critically on assessment of travel distance: a comparison with invasive measurement. J Hypertens. 2009;27:1624–1630.
- Bland JM, Altman DG. Statistical methods for assessing agreement between two methods of clinical measurement. Lancet. 1986;1:307–310.
- Inker LA, Schmid CH, Tighiouart H, et al. Estimating glomerular filtration rate from serum creatinine and cystatin C. N Engl J Med. 2012;367:20–29.
- Smulyan H, Mookherjee S, Safar ME. The two faces of hypertension: role of aortic stiffness. J Am Soc Hypertens. 2016;10:175–183.
- Yang WY, Efremov L, Mujaj B, et al. Association of office and ambulatory blood pressure with blood lead in workers before occupational exposure. J Am Soc Hypertens. 2018;12:14–24.
- Siu AL, U.S. Preventive Services Task Force. Screening for high blood pressure in adults: U.S. Preventive Services Task Force recommendation statement. Ann Intern Med. 2015;163:778–786.
- Leung AA, Nerenberg K, Daskalopoulou SS, et al. Hypertension Canada’s 2016 Canadian Hypertension Education Program guidelines for blood pressure measurement, diagnosis, assessment of risk, prevention, and treatment of hypertension. Can J Cardiol. 2016;32:569–588.
- National Institute for Health and Clinical Excellence (NICE). The clinical management of primary hypertension in adults. Clinical Guideline 127. Methods, evidence and recommendations. 2011; http://www.nice.org.uk/guidance/CG127.
- O’Brien E, Parati G, Stergiou G, et al. European Society of Hypertension position paper on ambulatory blood pressure monitoring. J Hypertens. 2013;31:1731–1767.
- O’Brien E, Asmar R, Beilin L, et al. Practice guidelines of the European Society for Hypertension for clinic, ambulatory and self blood pressure management. J Hypertens. 2005;23:697–701.
- Mancia G, Bertinieri G, Grassi G, et al. Effects of blood pressure measurement by the doctor on patient’s blood pressure and heart rate. Lancet 1983;ii:695–698.
- Kaewboonchoo O, Saleekul S, Powwattana A, et al. Blood lead level and blood pressure of bus drivers in Bangkok, Thailand. Ind Health. 2007;45:590–594.
- Takazawa K, Tanaka N, Fujita M, et al. Assessment of vasoactive agents and vascular aging by the second derivative of the photoplethysmogram waveform. Hypertension 1998;32:365–370.
- Gartside PS. The relationship of blood lead levels and blood pressure in NHANES II: additional calculations. Environ Health Perspect. 1988;78:31–34.
- Pirkle JL, Brody DJ, Gunter EW, et al. The decline in blood lead levels in the United States. The National Health and Nutrition Examination Surveys (NHANES). JAMA 1994;272:284–291.
- Muntner P, He J, Vupputuri S, et al. Blood lead and chronic kidney disease in the general United States population: results from NHANES III. Kidney Int. 2003;63:1044–1050.
- Gu YM, Thijs L, Li Y, et al. Outcome-driven thresholds for ambulatory pulse pressure in 9938 participants recruited from 11 populations. Hypertension 2014;63:229–237.
- Yang WY, Zhang ZY, Thijs L, et al. Left ventricular structure and function in relation to environmental exposure to lead and cadmium. J Am Heart Assoc. 2017;6:e004692.
- Nuyts GD, Elseviers MM, De Broe ME. Healthy worker effect in a cross-sectional study of lead workers. J Occup Med. 1993;35:387–391.
- O'Rourke MF. 2007. Arterial aging: pathophysiological principles. Vasc Med. 2007;12:329–341.
- Butlin M, Qasem A. Large artery stiffness assessment using SphygmoCor technology. Pulse (Basel). 2016;4:180–192.
- McEniery CM, Cockcroft JR, Roman MJ, et al. Central blood pressure: current evidence and clinical importance. Eur Heart J. 2014;35:1719–1725.
- Wang JJ, O’Brien AB, Shrive NG, et al. Time-domain representation of ventricular-arterial coupling as a windkessel and wave system. Am J Physiol Heart Circ Physiol. 2003;284:H1358–H1368.
- Boggia J, Luzardo L, Lujambio I, et al. The diurnal profile of central hemodynamics in a general Uruguayan population. Am J Hypertens. 2016;29:737–746.
- Hu H, Shih R, Rothenberg S, et al. The epidemiology of lead toxicity in adults: measuring dose and consideration of other methodologic issues. Environ Health Perspect. 2007;115:455–462.
- Menke A, Muntner P, Batuman V, et al. Blood lead below 0.48 micromol/L (10 microg/dL) and mortality among US adults. Circulation 2006;114:1388–1394.