
 ?Mathematical formulae have been encoded as MathML and are displayed in this HTML version using MathJax in order to improve their display. Uncheck the box to turn MathJax off. This feature requires Javascript. Click on a formula to zoom.
Abstract
Purpose: Elevated blood pressure induces electrocardiographic changes and is associated with an increase in cardiovascular disease later in life compared to normal blood pressure levels. The purpose of this study was to evaluate the association between normal to high normal blood pressure values (90–139/50–89 mmHg) and electrocardiographic parameters related to cardiac changes in hypertension in healthy young adults.
Methods: Data from 1449 volunteers aged 18–30 years collected at our centre were analyzed. Only subjects considered healthy by a physician after review of collected data with systolic blood pressure values between 90 and 139 mmHg and diastolic blood pressure values between 50 and 89 mmHg were included. Subjects were divided into groups with 10 mmHg systolic blood pressure increment between groups for analysis of electrocardiographic differences. Backward multivariate regression analysis with systolic and diastolic blood pressure as a continuous variable was performed.
Results: The mean age was 22.7 ± 3.0 years, 73.7% were male. P-wave area, ventricular activation time, QRS-duration, Sokolow–Lyon voltages, Cornell Product, J-point–T-peak duration corrected for heart rate and maximum T-wave duration were significantly different between systolic blood pressure groups. In the multivariate model with gender, body mass index and cholesterol, ventricular rate (standardized coefficient (SC): +0.182, p < .001), ventricular activation time in lead V6 (SC= +0.065, p = .048), Sokolow–Lyon voltage (SC= +0.135, p < .001), and Cornell product (SC= +0.137, p < .001) were independently associated with systolic blood pressure, while ventricular rate (SC= +0.179, p < .001), P-wave area in lead V1 (SC= +0.079, p = .020), and Cornell product (SC= +0.091, p = .006) were independently associated with diastolic blood pressure.
Conclusion: Blood pressure-related electrocardiographic changes were observed incrementally in a healthy young population with blood pressure in the normal range. These changes were an increased ventricular rate, increased atrial surface area, ventricular activation time and increased ventricular hypertrophy indices on a standard 12 lead electrocardiogram.
Introduction
Hypertension induces structural and functional adaptations to the heart such as myocardial fibrosis formation and microvascular endothelial dysfunction which results clinically in left ventricular hypertrophy (LVH), diastolic dysfunction, and ultimately heart failure [Citation1,Citation2]. Electrocardiographically, in hypertensive patients, the abovementioned changes result in an increased P-wave duration, P-wave dispersion, PR-interval [Citation3–8], increased QRS duration [Citation9–11], increased LVH criteria such as Sokolow–Lyon and Cornell product [Citation12–15], and an increased QT interval and QT dispersion [Citation14–18]. These electrocardiographical (ECG) findings are independently associated with an increased prevalence of atrial fibrillation, stroke and coronary artery disease [Citation6–13,Citation19–22].
The ECG changes have already been reported to be present in high normal blood pressure (130–139/80–89 mmHg) [Citation3,Citation4,Citation15,Citation16]. However, to which extent these ECG changes can be observed in normotensive individuals is unknown. Furthermore, systolic blood pressure induced ECG changes, such as ventricular activation time, QT-interval and T-wave changes independently from anatomical adaptations in animal experiments [Citation23–25]. To which extent these findings can be translated to humans is currently unknown. The improved characterization of blood pressure-related ECG changes in humans is of particular interest in drug research, where knowledge of normal physiological changes help differentiate between physiological and potentially harmful or unknown pharmacodynamic effects such as prolongation of the QRS duration or QT-interval through QT-subinterval analysis [Citation26]. The purpose of the present study was to characterize the association between blood pressure and selected ECG parameters recognized to be associated with hypertension in a healthy, young, normotensive and elevated blood pressure population.
Methods
Data from 1449 male and female volunteers aged 18–30 years with a systolic blood pressure between 90 and 139 mmHg and diastolic blood pressure between 50 and 89 mmHg were included in the present study. All data were collected at the Centre for Human Drug Research in Leiden, The Netherlands, a clinical research organization specialized in early phase drug development studies. Data collected during the mandatory medical screening to verify study eligibility between 2010 and 2016 were included in the present study. Ethical approvals from the Medical Ethical Review Committee for the intended studies were acquired and informed consent documents were signed by the volunteers prior to any data collection. The present study was performed in accordance with local regulations. All activities were performed in accordance with applicable standard operating procedures.
Medical screening
The medical screening consisted of a single visit to the clinical unit where a detailed anamnesis, a physical examination, vital signs including blood pressure, temperature, weight and height measurement, body mass index calculation, and a twelve-lead electrocardiogram (ECG) were recorded. Additionally, haematology and chemistry blood panels, urine dipstick, and a urine drug test were analyzed.
Blood pressure measurement
Subjects were placed in a supine, resting position for five minutes preceding the blood pressure measurement. The blood pressure cuff was placed on the upper arm just above the elbow crease. Brachial blood pressure was measured using a calibrated and yearly maintained Dash 3000/4000 or a Carescape V100 Dinamap device (General Electric Healthcare, Chicago, Illinois, USA). The blood pressure measurement was immediately entered electronically into a validated database system (Promasys, OmniComm, Fort Lauderdale, FL, USA).
ECG measurement
The 12-lead ECGs were recorded with the volunteer in the supine position and after a five minute resting period. The twelve-lead ECGs were recorded using an electrocardiograph (Marquette 800/5500/2000 or Dash 3000; General Electric Healthcare, Milwaukee, USA) and 12 disposable electrodes placed in the standard anatomical position. The ECG data were then uploaded into the ECG warehouse (Muse Cardiology Data Management System v7, General Electric Healthcare, Chicago, IL, USA). The Marquette Cubic Spline filter and Finite Residual Filter were used for artefact and noise management. The ECG warehouse automatically assesses interval and amplitude data from the digital ECGs with the Marquette 12SL algorithm, which provides a variety of ECG measurements which have been used in previous studies [Citation27,Citation28]. Independent evaluation showed that the Marquette 12SL algorithm passed all of the amplitude measurement requirements (maximum of 10 ms deviation) as defined in International Electrotechnical Commission, as described in the GE Physician’s Guide (version 2036070-006). In addition to the algorithm, a physician reviewed all ECGs for quality, legibility, and abnormalities. Description, methods of determination and calculation, and units of the ECG parameters are described in .
Table 1. Methods of determination or calculation of the electrocardiographic (ECG) variables used in the analysis of the healthy volunteers aged 18–30 years with an optimal (<120/80 mmHg), normal (120–129/<80 mmHg), or high normal (130–139 mmHg systolic) blood pressure.
Statistical analysis
Only subjects who were considered healthy by a physician after review of all the collected data, including an ECG with sinus rhythm were included in the current study. Data are reported as mean ± standard deviation (SD), median with interquartile range or percentage where appropriate. Subjects were divided in groups based on systolic blood pressure with 10 mmHg increments (90–99 mmHg, 100–109 mmHg, 110–129 mmHg, 120–129 mmHg, and 130–139 mmHg) and based on diastolic blood pressure with 10 mmHg increments (50–59 mmHg, 60–69 mmHg, 70–79 mmHg, and 80–89 mmHg) for analysis. Possible gender-related differences were investigated using a Chi-square test. Variances were compared using the Analysis of Variance (ANOVA) test with a post-hoc Tukey analysis. A linear univariate and a backward linear multivariate regression model analysis were performed with systolic blood pressure and diastolic blood pressure as the dependent continuous variable, respectively. Due to collinearity, selected variables were dropped from the backward linear multivariate regression model analysis based on a Variance Inflation Factor higher than 3.0. This concerned QRS duration, JpTpc interval, and QTcF duration. The decision which parameter to exclude was based on R-squared values; the combination of variables that yielded the largest R-squared value without any parameter displaying a VIF of >3 was reported in the multivariate analysis. Additionally, because we found an association between systolic blood pressure and QTcF, a separate backward multivariate analysis to identify which subintervals of the QT-interval with systolic blood pressure as the dependent variable was performed. These subintervals were: ventricular activation time, QRS duration, J-point–T-peak interval, corrected for heart rate (JpTpc) and T-peak-T-end interval (TpTe). The correction of the JpTpc interval was performed using the formula proposed by Johannesen [Citation26]:
Probabilities of less than 0.10 in the linear univariate regression model were added to the backward linear multivariate regression model. Results are reported as the unstandardized coefficient (USC) and standardized coefficient (SC) with the corresponding p-value. Statistical analyses were performed using IBM SPSS version 25 (IBM corporation, Armonk, NY, USA).
Results
In total, 1449 subjects were included in the present study. Mean age was 22.7 ± 3.0 years, 73.7% were male. Subject characteristics for the systolic and diastolic blood pressure groups are shown in and , respectively. Incrementally with systolic blood pressure, the percentage of male gender increased significantly between the systolic groups. Furthermore, body mass index, diastolic blood pressure, ventricular rate, and serum calcium were significantly different between the systolic blood pressure groups as can be observed in . Between diastolic blood pressure groups, age, temperature, systolic blood pressure, ventricular rate, serum cholesterol, and Cornell Product differed significantly between the groups as can be observed in . Other baseline characteristics were not significantly different among systolic or diastolic blood pressure groups.
Table 2. Relation between patient characteristics and electrocardiographic parameters to systolic blood pressure of included healthy volunteers (n = 1449).
Table 3. Relation between patient characteristics and electrocardiographic parameters to diastolic blood pressure of included healthy volunteers (n = 1285).
Systolic blood pressure and ECG parameters
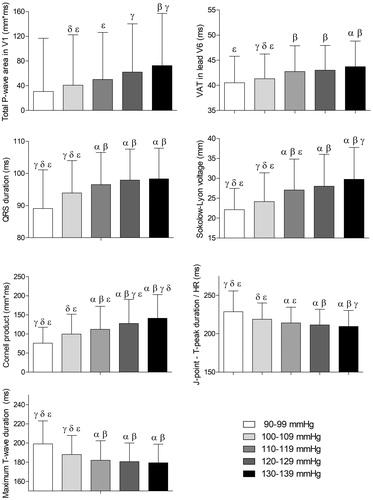
displays the association between the systolic blood pressure groups and the evaluated ECG parameters, respectively. P-wave area in lead V1, ventricular activation time in lead V6, QRS-duration, Sokolow–Lyon voltages, Cornell Product, JpTpc interval, and maximum T-wave duration were significantly different between systolic blood pressure groups, as displayed in .
Figure 1. Associations of systolic blood pressure with electrocardiographic parameters. Results were based on analysis of variance (ANOVA) test between systolic blood pressure groups, and expressed as difference in the electrocardiographic parameter (with 95% confidence interval) per systolic blood pressure groups using a post hoc Tukey analysis. The symbols α, ß, γ, δ, and ε represent a significant difference (p < .05) compared to that group. If no symbols are present, no significance was found between the groups. HR: heart rate; VAT: ventricular activation time; ms: milliseconds; mm*ms: millimetre times milliseconds.
Linear regression analysis systolic blood pressure
In the univariate analysis of the data, systolic blood pressure was significantly associated with female gender (SC= −0.349, p < .001), body mass index (SC= +0.216, p < .001), ventricular rate (SC= +0.138, p < .001), serum cholesterol (SC= +0.095, p = .003), serum sodium (SC= +0.082, p = .002), serum calcium (SC= +0.180, p < .001), P-wave area in lead V1 (SC= +0.136, p < .001), ventricular activation time in lead V6 (SC= +0.156, p < .001), QRS duration (SC= +0.171, p < .001), Sokolow–Lyon voltage (SC= +0.221, p < .001), Cornell product (SC= +0.235, p < .001), JpTpc interval (SC= −0.175, p < .001), maximum T-wave duration (SC= −0.164, p < .001), and QTcF duration (SC= −0.073, p = .005), as can also be observed from .
Table 4. Univariate regression model analysis with systolic blood pressure as dependent variable. Results are reported as unstandardized coefficient (USC) and standardized coefficient (SC) with the corresponding P-value and the R-square value in the linear univariate regression model.
Due to collinearity between JpTpc interval and maximum T-wave duration, maximum T-wave duration was dropped from the multivariate analysis. In addition, ventricular activation time in lead V6 was collinear with QTcF duration, therefore QTcF duration was dropped from the multivariate analysis. This resulted in a drop of the R-square value from 0.244 to 0.237 of the overall multivariate model.
In the backward multivariate analysis, female gender (SC= −0.232, p < .001), body mass index (SC= +0.198, p < .001), ventricular rate (SC= +0.189, p < .001), serum cholesterol (SC= +0.082, p = .004), ventricular activation time in lead V6 (SC= +0.065, p = .049), Sokolow–Lyon voltage (SC= +0.136, p < .001), and Cornell product (SC= +0.137, p < .001) were independently associated with systolic blood pressure, as can also be observed in . The R-square of the multivariate model was 0.237.
Table 5. Backward linear multivariate regression model analysis with systolic blood pressure as dependent variable.
QT subintervals
In the multivariate analysis with the QT subintervals, systolic blood pressure was associated with QRS duration (SC= +0.109, p < .001), and JpTpc interval (SC= −0.117, p < .001), but not to TpTe interval (SC= −0.032, p = .250), as can be observed in . The R-square of the second backward multivariate model was 0.039.
Table 6. Backward linear multivariate regression model analysis with systolic blood pressure as dependent variable to identify which subintervals of the QT-interval with systolic blood pressure as dependent variable.
Diastolic blood pressure and ECG parameters
displays the association between the diastolic blood pressure groups or diastolic blood pressure groups and the evaluated ECG parameters. Only Cornell Product was significantly different between diastolic blood pressure groups. Other ECG parameters were not significantly different among diastolic blood pressure groups.
Linear regression analysis diastolic blood pressure
In the univariate analysis of the data, diastolic blood pressure was significantly associated with age (SC= +0.132, p < .001), female gender (SC= −0.063, p = .024), temperature (SC= +0.074, p = .010), ventricular rate (SC= +0.151, p < .001), serum cholesterol (SC= +0.161, p < .001), serum calcium (SC= +0.075, p = .008), P-wave area in lead V1 (SC= +0.054, p = .055), Sokolow–Lyon voltage (SC= +0.048, p = .088), Cornell product (SC= +0.068, p = .015), and minimum T-wave duration (SC= −0.051, p = .069) as can also be observed in .
Table 7. Univariate regression model analysis with diastolic blood pressure as dependent variable.
In the backward multivariate analysis, age (SC= +0.129, p < .001), ventricular rate (SC= +0.179, p < .001), serum cholesterol (SC= +0.136, p < .001), P-wave area in lead V1 (SC= +0.079, p = .020), and Cornell product (SC= +0.091, p = .006) were independently associated with systolic blood pressure, as can also be observed in . No variables were dropped from the multivariate analysis because of collinearity. The R-square of the multivariate model was 0.090.
Table 8. Backward linear multivariate regression model analysis with diastolic blood pressure as dependent variable.
Discussion
This study found an association between hypertension associated ECG parameters and blood pressure in healthy, young (18–30 years) adults with a systolic blood pressure between 90 and 139 mmHg and a diastolic blood pressure between 50 and 89 mmHg. A higher systolic blood pressure was independently associated with an increased ventricular rate, prolongation of ventricular activation time in lead V6, increased Sokolow–Lyon voltages, Cornell product, and an increased maximum T-wave duration. Furthermore, a higher diastolic blood pressure was independently associated with an increased P-wave area in lead V1 and Cornell Product, though comparatively less than systolic blood pressure. These results indicate that blood pressure-related cardiac changes can be observed in a surface ECG in a healthy, young population.
Hypertension induced atrial remodelling consists of cardiomyocyte hypertrophy and differentiation of fibroblasts into myofibroblasts as well as atrial dilation [Citation1,Citation2]. These ECG changes can be observed as prolongation of the P-wave and PR-interval on surface ECGs [Citation3–8]. In the present study, we also observed these changes although these were not independent from other parameters. We hypothesize that blood pressure-related atrial structural changes may occur but are preceded by ventricular changes, which is supported by previously reported findings in animal studies [Citation29,Citation30]. Nevertheless, the P-wave area in lead V1 was independently associated with diastolic blood pressure and showed an association with systolic blood pressure. A previous study reported that P-wave area in lead V1 was associated with atrial dilation on cardiac MRI, thus, hypothetically, the present study suggests that blood pressure induces atrial geometrical changes in subjects with a normal blood pressure [Citation31].
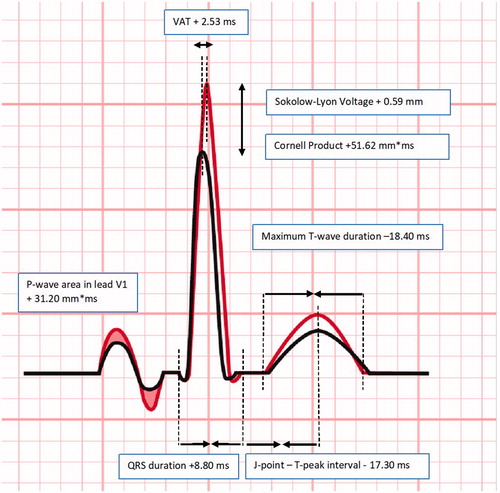
Figure 2. Overview of significant changes of electrographic parameters in normotensive volunteers between 90–99 mmHg and 120–129 mmHg systolic blood pressure groups. Results were based on analysis of variance (ANOVA) test between systolic blood pressure groups, and expressed as difference in the electrocardiographic parameter (with 95% confidence interval) per systolic blood pressure groups using a post hoc Tukey analysis. VAT: ventricular activation time; ms: milliseconds; mm*ms: millimetre times milliseconds.
Hypertension induced ventricular structural changes mainly constitute an increased left ventricular mass (LVM), thickness, and stiffness [Citation1,Citation2,Citation9,Citation32], which ultimately results in restricted left ventricular filling and function [Citation1,Citation9–11]. These adaptations induce conduction changes, such as prolongation of the ventricular activation time (46 ± 0.4 ms) or prolongation of QRS duration (100–109 ± 5 ms) [Citation10,Citation11,Citation25,Citation32], and increased LVH markers such as increased Sokolow–Lyon (2.4–3.8 ± 1.0 mV) and Cornell (148–282 ± 110 mm*ms) on a surface ECG [Citation12–15]. All of these were also observed in the present study involving healthy young volunteers, although in general these were more subtle in the present study as compared to studies in elderly hypertensive patients.
Previous studies indicated that the QTc interval duration was increased in high normal and stage 1 hypertensive patients compared to normotensive patients and was correlated to increases in LVM and LVH criteria on an ECG [Citation15–18,Citation33]. However, systolic blood pressure may also induce a prolonged ventricular activation time and duration of the QT-interval and T-wave changes independently from the LVM index [Citation23–25]. Moreover, regional differences in static QT interval measurement on an ECG may provide an indication of an underlying non-homogeneity of ventricular repolarization caused by LVH and left ventricular size in hypertensive patients [Citation17,Citation34,Citation35].
In the present study, we also observed an association between the QTc interval and systolic blood pressure. QTc subinterval analysis was performed, which allows for improved characterization of the effect on the QT interval and differentiation between early and late repolarization [Citation26]. The subinterval analysis has been reported to be of use to differentiate channel interactions of novel compounds [Citation26]. Our subinterval analysis found that blood pressure increases the QTc interval mainly through prolongation of the QRS interval. This is substantially different from IKR channel induced QTc interval prolongation, which is typically of interest in drug induced QT prolongation. The results in the present study can be used in drugs that have an effect on blood pressure. When evaluating a compound that induces an increase in blood pressure, this is likely to be associated with an increase in QT interval. QT subinterval analysis can be used to discriminate direct blood pressure induced effects (QRS prolongation) from IKR channel induced effects (prolongation of repolarization duration). Future research should be aimed at describing the interaction between blood pressure and the ECG over time. The present study does not allow for differentiation between acute effects and chronic effects of blood pressure on the surface ECG. The present study also does not allow to assess the time course over which these ECG changes are induced, although hypothetically, these effects will be induced over multiple years.
Limitations
The limitations of this study are the retrospective, cross-sectional design, and the usage of automatically calculated ECG data. The automated assessment has been validated but is nevertheless not considered the gold standard [Citation36].
Conclusion
In conclusion, we found that hypertension related electrocardiographic changes can be observed incrementally in healthy young individuals with a normal to high normal elevated blood pressure. These changes were related to an increased ventricular rate, increased atrial surface area, increased ventricular activation time, increased ventricular hypertrophy indices and an altered ventricular repolarization on a standard twelve lead electrocardiogram.
Acknowledgements
The authors thank Ms. Hassing for assistance for Figure 2.
Disclosure statement
The authors declare that there are no conflicts of interest regarding this study.
References
- Moreno MU, Eiros R, Gavira JJ. The hypertensive myocardium: from microscopic lesions to clinical complications and outcomes. Med Clin North Am. 2017;101(1):43–52.
- Hiremath P, Bauer M, Aguirre AD, et al. Identifying early changes in myocardial microstructure in hypertensive heart disease. PLoS One. 2014;9(5):e97424.
- Vaidean GD, Manczuk M, Magnani JW. Atrial electrocardiography in obesity and hypertension: clinical insights from the Polish-Norwegian Study (PONS). Obesity. 2016;24(12):2608–2614.
- Cagirci G, Cay S, Karakurt O, et al. P-wave dispersion increases in prehypertension. Blood Pressure. 2009;18(1–2):51–54.
- Emiroglu MY, Bulut M, Sahin M, et al. Assessment of atrial conduction time in patients with essential hypertension. J Electrocardiol. 2011;44(2):251–256.
- Lau YF, Yiu KH, Siu CW, et al. Hypertension and atrial fibrillation: epidemiology, pathophysiology and therapeutic implications. J Hum Hypertens. 2012;26(10):563–569.
- Francia P, Ricotta A, Balla C, et al. P-wave duration in lead aVR and the risk of atrial fibrillation in hypertension. Ann Noninvasive Electrocardiol. 2015;20(2):167–174.
- Magnani JW, Lopez FL, Soliman EZ, et al. P wave indices, obesity, and the metabolic syndrome: the atherosclerosis risk in communities study. Obesity. 2012;20(3):666–672.
- Brenyo A, Zaręba W. Prognostic significance of QRS duration and morphology. Cardiol J. 2011;18(1):8–17.
- Joseph J, Claggett BC, Anand IS, et al. QRS duration is a predictor of adverse outcomes in heart failure with preserved ejection fraction. JACC Heart Fail. 2016;4(6):477–486.
- Erdogan T, Durakoglugil ME, Cicek Y, et al. Prolonged QRS duration on surface electrocardiogram is associated with left ventricular restrictive filling pattern. Interv Med Appl Sci. 2017;9(1):9–14.
- Okin PM, Devereux RB, Jern S, et al. Regression of electrocardiographic left ventricular hypertrophy during antihypertensive treatment and the prediction of major cardiovascular events. Jama. 2004;292(19):2343–2349.
- Ang D, Lang C. The prognostic value of the ECG in hypertension: where are we now? J Hum Hypertens. 2008;22(7):460–467.
- Lonati LM, Magnaghi G, Bizzi C, et al. Patterns of QT dispersion in athletic and hypertensive left ventricular hypertrophy. Ann Noninvasive Electrocardiol. 2004;9(3):252–256.
- Ale OK, Ajuluchukwu JN, Ok DA, et al. Impact of prehypertension on left ventricular mass and QT dispersion in adult black Nigerians. Cardiovasc J Africa. 2014;25(2):78–82.
- Dogru MT, Guneri M, Tireli E, et al. QT interval and dispersion differences between normal and prehypertensive patients: effects of autonomic and left ventricular functional and structural changes. Anadolu Kardiyol Derg. 2009;9(1):15–22.
- Oikarinen L, Nieminen MS, Viitasalo M, et al. Relation of QT interval and QT dispersion to echocardiographic left ventricular hypertrophy and geometric pattern in hypertensive patients. The LIFE study. The Losartan Intervention For Endpoint Reduction. J Hypertens. 2001;19(10):1883–1891.
- Kabutoya T, Ishikawa S, Ishikawa J, et al. P-wave morphologic characteristics predict cardiovascular events in a community-dwelling population. Ann Noninvasive Electrocardiol. 2012;17(3):252–259.
- Lewington S, Clarke R, Qizilbash N, et al. Age-specific relevance of usual blood pressure to vascular mortality: a meta-analysis of individual data for one million adults in 61 prospective studies. Lancet. 2002;360(9349):1903–1913.
- Salles GF, Cardoso CR, Muxfeldt ES. Prognostic value of ventricular repolarization prolongation in resistant hypertension: a prospective cohort study. J Hypertens. 2009;27(5):1094–1101.
- Siscovick DS, Raghunathan TE, Rautaharju P, et al. Clinically silent electrocardiographic abnormalities and risk of primary cardiac arrest among hypertensive patients. Circulation. 1996;94(6):1329–1333.
- Williams B, Mancia G, Spiering W, et al. 2018 Practice Guidelines for the management of arterial hypertension of the European Society of Cardiology and the European Society of Hypertension. Blood Pressure. 2018;27(6):314–340.
- Tanindi A, Alhan A, Tore HF. Tp-e/QT ratio and QT dispersion with respect to blood pressure dipping pattern in prehypertension. Blood Pressure Monit. 2015;20(2):69–73.
- Klimas J, Stankovicova T, Kyselovic J, et al. Prolonged QT interval is associated with blood pressure rather than left ventricular mass in spontaneously hypertensive rats. Clin Exp Hypertens. 2008;30(7):475–485.
- Boles U, Almuntaser I, Brown A, et al. Ventricular activation time as a marker for diastolic dysfunction in early hypertension. Am J Hypertens. 2010;23(7):781–785.
- Johannesen L, Vicente J, Gray RA, et al. Improving the assessment of heart toxicity for all new drugs through translational regulatory science. Clin Pharmacol Ther. 2014;95(5):501–508.
- Garg A, Lehmann MH. Prolonged QT interval diagnosis suppression by a widely used computerized ECG analysis system. Circ Arrhythm Electrophysiol. 2013;6(1):76–83.
- Poon K, Okin PM, Kligfield P. Diagnostic performance of a computer-based ECG rhythm algorithm. J Electrocardiol. 2005;38(3):235–238.
- De Jong AM, Van Gelder IC, Vreeswijk-Baudoin I, et al. Atrial remodeling is directly related to end-diastolic left ventricular pressure in a mouse model of ventricular pressure overload. PLoS One. 2013;8(9):e72651.
- Hanif W, Alex L, Su Y, et al. Left atrial remodeling, hypertrophy, and fibrosis in mouse models of heart failure. Cardiovasc Pathol. 2017;30:27–37.
- Weinsaft JW, Kochav JD, Kim J, et al. P wave area for quantitative electrocardiographic assessment of left atrial remodeling. PLoS One. 2014;9(6):e99178.
- Oikarinen L, Nieminen MS, Viitasalo M, et al. QRS duration and QT interval predict mortality in hypertensive patients with left ventricular hypertrophy: the Losartan Intervention for Endpoint Reduction in Hypertension Study. Hypertension. 2004;43(5):1029–1034.
- Porthan K, Virolainen J, Hiltunen TP, et al. Relationship of electrocardiographic repolarization measures to echocardiographic left ventricular mass in men with hypertension. J Hypertens. 2007;25(9):1951–1957.
- Roukema G, Singh JP, Meijs M, et al. Effect of exercise-induced ischemia on QT interval dispersion. Am Heart J. 1998;135(1):88–92.
- Reyes S, Terzic A, Mahoney DW, et al. K(ATP) channel polymorphism is associated with left ventricular size in hypertensive individuals: a large-scale community-based study. Hum Genet. 2008;123(6):665–667.
- ICH. E14 (R3). Clinical evaluation of QT/QTc interval prolongation and proarrhythmic potential for non-antiarrhythmic drugs – questions and answers. 2016. Available from: https://www.ich.org/products/guidelines/efficacy/efficacy-single/article/questions-answers-the-clinical-evaluation-of-qtqtc-interval-prolongation-and-proarrhythmic-poten.html
- Sokolow M, Lyon TP. The ventricular complex in left ventricular hypertrophy as obtained by unipolar precordial and limb leads. 1949. Ann Noninvasive Electrocardiol. 2001;6(4):343–368.
- Molloy TJ, Okin PM, Devereux RB, et al. Electrocardiographic detection of left ventricular hypertrophy by the simple QRS voltage-duration product. J Am Coll Cardiol. 1992;20(5):1180–1186.]