
Abstract
Purpose
Raised blood pressure, with the renin-angiotensin system (RAS) as a central regulatory component, is one of the most important contributors to early development of left ventricular hypertrophy. Factors such as increased age, sex, black ethnicity and a low socio-economic status also contribute to left ventricular remodelling. To better understand early contributors to left ventricular mass, we investigated the relationship between left ventricular mass index (LVMi) and the components of the RAS in young healthy adults while considering ethnicity, sex and socio-economic status.
Materials and methods
Black and white women and men (N = 1186) between the ages of 20–30 years were included. By using standard echocardiography, we determined LVMi. Ultra-pressure-liquid chromatography tandem-mass spectrometry (LC-MS/MS) was used to measure the RAS-fingerprint®.
Results
Components of the RAS such as plasma renin activity (PRA-S), angiotensin I (Ang I), angiotensin II (Ang II) and aldosterone were suppressed in the black compared to the white group (all p < 0.001). No associations between LVMi and the RAS were evident in the total, black or white groups. With additional grouping according to sex and socio-economic status, inverse associations between LVMi and PRA-S (β= −0.168; p = 0.017), Ang I (β= −0.155; p = 0.028) and Ang II (β= −0.172; p = 0.015) were found only in low socio-economic black women.
Conclusion
Despite a suppressed RAS in the black compared to the white group, components of the RAS were not associated with LVMi in this young cohort. The low socio-economic black women of this study population may be vulnerable to future RAS-related increases in left ventricular mass.
Introduction
The renin-angiotensin system (RAS) is central to blood pressure control as well as sodium and potassium homeostasis [Citation1–3]. Dysregulation of the RAS and consequent increased blood pressure may therefore lead to increased left ventricular wall stress and eventual left ventricular hypertrophy [Citation1–3]. In addition, the release of aldosterone and the direct action of angiotensin II (Ang II) on cardiomyocytes may also play a significant role in the development of left ventricular hypertrophy [Citation4]. Previous studies focussing on the relationship between hypertension, left ventricular mass and the RAS were conducted in older hypertensive patients [Citation5,Citation6], with a limited focus on the early factors related to increased left ventricular mass.
In black populations, high blood pressure accompanied with a suppressed RAS, also referred to as the low renin phenotype, are frequently reported [Citation7–11]. In addition to black ethnicity, other cardiovascular disease risk factors such as sex and socio-economic status may also be important role players in the link between left ventricular mass and the RAS [Citation12,Citation13]. Socio-economic conditions such as low income, unemployment and low education are predisposing factors towards adverse health outcomes as demonstrated by the link between low socio-economic status and cardiovascular disease [Citation14–17].
This is especially concerning for low- and middle-income countries, including South Africa in which a large proportion of South Africans, 30.4 million (55.5%) (South African poverty trend report, 2006–2015), particularly black South Africans, are living in poverty [Citation14]. Additionally, a large proportion (63.4%) of the South African youth (aged 15–34 years) are unemployed and contribute to this poverty percentage [Citation18].
In this study we investigated the relationship between left ventricular mass index (LVMi) and components of the RAS in young adults (20–30 years) while considering ethnicity, sex and socio-economic status.
Methods
Study design and population
This study forms part of the African Prospective study on Early Detection and Identification of Cardiovascular disease and Hypertension (African-PREDICT) and utilised existing baseline data. Detail on the methodology of this study was previously published [Citation19]. In short, the study has a longitudinal design, aimed at investigating early cardiovascular disease-related pathophysiology by tracking young (aged 20–30 years) apparently healthy black and white adults over time [Citation19]. Participants were recruited on a voluntary basis from the North West Province of South Africa and during screening procedures were considered for inclusion if clinic blood pressure was <140/90 mmHg [Citation20], HIV uninfected, not diagnosed with chronic diseases or using medication for chronic diseases (self-reported), nor pregnant or lactating women (self-reported). This cross-sectional study included the full baseline cohort of 1 202 young adults. Upon removal of participants with missing data for the RAS (N = 11) and left ventricular dimensions (N = 5), we included 1 186 black and white adults (N = 599 black and N = 587 white). This study (NWU-00032-19-A1) was approved by the Health Research Ethics Committee of the North-West University and adhered to the principles set out in the Declaration of Helsinki. All participants provided written informed consent.
Questionnaires
Demographic data were collected using a General Health and Demographic Questionnaire. Data obtained included age, sex, ethnicity, education level, employment information, household income, smoking, alcohol consumption and medication use including hormonal contraceptive use. From the demographic information, socio-economic status was calculated using a point system adapted from Kuppuswamy’s Socioeconomic Status Scale 2010 [Citation21] for a South African environment. Participants were scored in three categories: skill level (classified according to the South African Standard Classification of Occupation (SASCO)), education and income. These three factors were used to categorise participants into socio-economic classes (low, middle, high) and to determine the socio-economic status score.
Anthropometric and physical activity measurements
Anthropometric measurements were taken in accordance with the guidelines of the International Society for the Advancement of Kinanthropometry (ISAK) [Citation22] to obtain height (m), determined by the SECA 213 Portable Stadiometer (SECA, Hamburg, Germany), weight (kg), using the SECA 813 Electronic Scales (SECA, Hamburg, Germany) and waist circumference (cm), using the Lufkin Steel Anthropometric Tape (W606 PM; Lufkin, Apex, NC, USA). Body mass index (BMI) (weight (kg)/height (m2)) and body surface area [Citation23] were then calculated. Mean activity energy expenditure was determined with the compact chest worn ActiHeart device (CamNtech, Cambridge, UK) physical activity monitor over a maximum of 7 consecutive days [Citation24,Citation25].
Cardiovascular measurements
Clinic blood pressure was measured at the left and right brachial artery in duplicate using Dinamap Procare 100 Vital Signs Monitor (GE Medical Systems, Milwaukee, WI, USA) with an appropriately sized cuff and the participant in the upright sitting position. Participants were requested to rest for a 5-min period before and between each measurement and not to have exercised, smoked or eaten for the last 30-min prior to commencement of measurements. The mean of the two left measurements was used in this study.
Ambulatory blood pressure measurements (ABPM) were obtained over 24 h using the Card(X)plore (Meditech, Budapest, Hungary) apparatus with an appropriately sized cuff. The Card(X)plore has three functions for a complex cardiovascular risk analysis namely 24 h blood pressure monitoring, electrocardiogram (ECG) and movement detection [Citation26]. The device measured blood pressure in 30-min intervals during daytime (6 a.m. to 10 p.m.) and hourly during the night (10 p.m. to 6 a.m.). The mean successful inflation rate over the 24 h time period was 88%. Participants also completed an ambulatory diary card.
A continuous measurement of resting cardiovascular variables was performed using the Finometer device (Finapres Measurement Systems, Amsterdam, The Netherlands) [Citation27–29]. This was done for a 5-min period after a 2-min calibration to adjust the finger arterial pressure with the brachial arterial pressure to provide an individual subject-level adjustment [Citation28]. Total peripheral resistance was obtained by dividing the mean arterial pressure (mmHg) and cardiac output (L/min) [TPR (mmHg.min ∕ L) = MAP (mmHg) ∕CO (L ∕ min)], this calculation was done using the Beatscope® software [Citation30].
Transthoracic echocardiography was performed according to the guidelines of the American Society of Echocardiography using the General Electric Vivid E9 device (GE Vingmed Ultrasound A/S, Horten, Norway), with a 2.5–3.5 MHz transducer and a single ECG lead [Citation31,Citation32]. Left ventricular dimensions were measured, and analysed using the EchoPAC software (GE, version 10.8.1). From the dimensions the interventricular septum thickness at end-diastole (IVSd), the left ventricular posterior wall thickness at end-diastole (LVPWd), the left ventricular internal diameter at end-diastole (LVIDd) and relative wall thickness (RWT) (defined as the ratio of twice the posterior wall thickness and LVIDd) were determined. Left ventricular mass was calculated by the corrected Devereux formula and was normalised for body surface area, from which left ventricular mass index (LVMi) was derived [Citation33].
Biochemical analyses
A registered nurse obtained early-morning blood samples and a spot urine sample from fasted participants. A 24 h urine sample was also collected in accordance with the Pan American Health Organisation/World Health Organisation protocol for population level sodium determination [Citation34]. The biological samples were immediately prepared and aliquoted into cryovials and stored at −80 °C until analysis. The RAS-Fingerprint® (Attoquant Diagnostics, Vienna, Austria) was used to analyse the components of the RAS using ultra-pressure-liquid chromatography-tandem mass spectrometry (LC-MS/MS) generated multiplex parameters consisting of the precisely quantified concentrations of 10 angiotensin (Ang) peptides (Ang I Ang II, Ang 1-9, Ang 1-7, Ang 1-5, Ang 2-8, Ang 3-8, Ang 3-7, Ang 2-7, Ang 2-10) and aldosterone. Angiotensin I presented a coefficient of variation (CV) of 11.2%, Ang II a CV of 7.3% and aldosterone a CV of 9.6%. The validated [Citation35] surrogate markers, plasma renin activity (PRA-Surrogate) (Ang I + Ang II) and angiotensin converting enzyme (ACE-Surrogate) (Ang II/Ang I) were calculated using equilibrium angiotensin levels. For the alternative RAS peptides, data from most of the participants were below the lowest level of quantification (LLOQ) (Supplementary Table 1).
The Cobas Integra® 400 plus (Roche, Basel, Switzerland) was used to analyse gamma-glutamyl transferase, the lipid profile (total cholesterol, high-density lipoprotein cholesterol, low density lipoprotein cholesterol and triglycerides), creatinine, high sensitivity C-reactive protein in serum samples, glucose levels in sodium fluoride plasma samples, as well as sodium and potassium levels in 24 h urine, from which the sodium-potassium ratio were calculated [Citation36]. Glomerular filtration rate was estimated (eGFR) using the Chronic Kidney Disease Epidemiology Collaboration (CKD-EPI) equation [Citation36,Citation37]. Oestradiol, progesterone and cortisol were analysed using the e411 (Roche, Basel Switzerland) in serum samples. For the above-mentioned biochemical analysis, both intra and inter assay CV ≤ 4.1%. Cotinine was analysed from serum samples using the Immulite (Siemens, Erlangen, Germany) apparatus with intra assay CV ≤ 10.8%.
Statistical analyses
Statistical analyses were performed with Statistica 13.3 (Tibco, Palo Alto, CA, USA). Variables were tested for normality and logarithmically transformed if skewed. Logged variables included weight, waist circumference, LVMi, total peripheral resistance, cortisol, gamma-glutamyl transferase, total cholesterol, high-density lipoprotein cholesterol, low-density lipoprotein cholesterol, triglycerides, C-reactive protein, cotinine and the renin-angiotensin-aldosterone system peptides. Normally distributed variables were reported as mean and standard deviation, and logarithmically transformed variables were presented by the geometric mean, 5th and 95th percentile intervals. Aligned with the aim of this study, data was analysed in the total group, divided by ethnicity and divided by ethnicity, sex and socio-economic status (median split). The characteristics between groups were compared using the Chi-square test to compare categorical variables, and independent t-tests to compare continuous variables. Single and multivariable adjusted regression analyses were performed to determine associations between LVMi and the RAS components in separate models. Various potential confounders and covariates were considered for inclusion in the models based on bivariate correlations with LVMi and RAS components. In the total group the basic model included age, ethnicity, sex, socio-economic status, 24 h systolic blood pressure, total cholesterol, gamma-glutamyl transferase and C-reactive protein. In black and white groups, the basic model without ethnicity was used and in groups further divided by sex and socio-economic status the basic model with oestradiol and without ethnicity, sex and socio-economic status were used.
Results
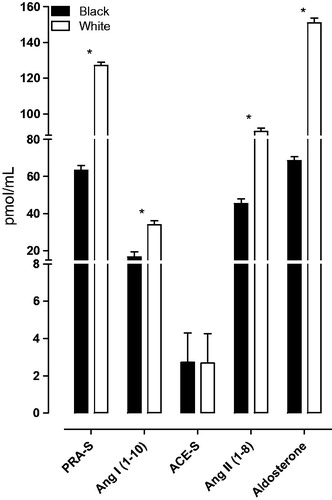
The characteristics of the total group and a comparison between the black and white groups are shown in Supplementary Table 2. The black group displayed lower socio-economic status and adiposity markers including weight, BMI, waist circumference and body surface area (all p ≤ 0.003). Cardiovascular measurements revealed higher clinic blood pressure (systolic blood pressure and diastolic blood pressure), relative wall thickness, total peripheral resistance and lower 24 h systolic blood pressure and left ventricular internal diameter at end-diastole (all p ≤ 0.016) in the black compared to the white group. The black group also displayed a suppressed RAS with lower PRA-S, Ang I, Ang II and aldosterone levels (all p < 0.001) (]. Despite the observed typical low renin phenotypic profile (suppressed RAS and higher blood pressure values) multivariable adjusted regression analysis in the total, black and white groups revealed no associations between LVMi and the RAS (Supplementary Table 3).
Figure 1. Renin-angiotensin system comparison between black and white participants.
When comparing black women with high and low socio-economic status no differences in blood pressure or left ventricular dimensions were observed between the low vs high socio-economic black (] or white women (Supplementary Table 4) (p ≥ 0.149). Regarding the RAS profile, aldosterone (p = 0.016) was lower in black women with low socio-economic status than in their high socio-economic counterparts. In the white women no difference was found in the RAS profile between low vs high socio-economic groups (p ≥ 0.295). When comparing other biochemical characteristics, black women with low socio-economic status presented with higher cortisol (p = 0.001), gamma-glutamyl transferase (p = 0.003), and 24 h urinary sodium-potassium ratio (p < 0.001) than did their high socio-economic counterparts. In the comparison between low and high socio-economic black (Supplementary Table 5) and white men (Supplementary Table 6), we found that for both black and white men with low socio-economic status, clinic diastolic blood pressure (p = 0.035 and p = 0.006) and 24 h diastolic blood pressure (p = 0.001 and p = 0.009) were lower than those with high socio-economic status. No differences in left ventricular dimensions were observed in either black or white men with low vs high socio-economic status. With regard to the RAS, black men with low socio-economic status presented with higher ACE-S (p = 0.028) and lower aldosterone (p < 0.001) than did black men with high socio-economic status. White men (low vs high socio-economic status) showed no differences between the RAS peptides (all p ≥ 0.610).
Table 1. Characteristics of black women according to socio-economic status.
We also determined whether LVMi is associated with the RAS components. In black women with low socio-economic status, single regression analyses ( and Supplementary Table 7) indicated negative correlations between LVMi with PRA-S (r= −0.14; p = 0.044) and Ang II (r= −0.15; p = 0.030), with a borderline correlation with Ang I (r= −0.11; p = 0.099). In multivariable adjusted regression analyses performed in black women with low socio-economic status (], independent negative associations were indicated between LVMi with PRA-S (β= −0.168; p = 0.017), Ang I (β= −0.155; p = 0.028) and Ang II (β= −0.172; p = 0.015). No associations were found between LVMi and the RAS in black women with high socio-economic status, in white women (low or high socio-economic status) or in black men (low or high socio-economic status). White men with high socio-economic status presented with a positive association between LVMi and aldosterone in single regression (r = 0.15; p = 0.034) analysis. However, this association lost significance in multivariate analysis (Adj. R2=0.031; β=0.132; p = 0.060).
Figure 2. Single regression analysis of left ventricular mass index with plasma renin activity-S and angiotensin II in black women according to socio-economic status.
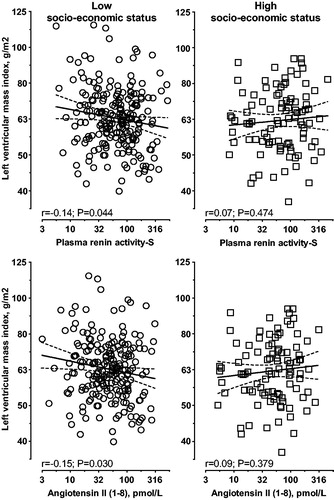
Table 2. Multiple regression analyses of left ventricular mass index with the renin-angiotensin system in black women according to socio-economic status.
Sensitivity analyses
We additionally performed a sensitivity analysis in black women with low socio-economic status and included 24 h urinary sodium excretion as an additional covariate. This was done since sodium is known to suppress the RAS [Citation38] and can contribute to raised blood pressure [Citation39]. After the additional adjustment for 24 h urinary sodium excretion, the association between LVMi with Ang I lost significance (Adj. R2=0.068; β= −0.151; p = 0.062), whereas the independent associations between LVMi with PRA-S (Adj. R2=0.072; β= −0.164; p = 0.042) and Ang II (Adj. R2=0.073 β= −0.169; p = 0.036) remained significant.
Discussion
In young healthy adults, we investigated the relationship between LVMi and the components of the RAS in the total group and while taking ethnicity, sex and socio-economic status into account. Despite evidence of higher blood pressure and a suppressed RAS in the black group, no associations were evident between LVMi and RAS components. Inverse associations between LVMi and RAS components (renin activity as well as Ang I and Ang II) were only evident when taking sex and socio-economic status also into account (low socio-economic black women), suggesting a potential vulnerability in this group.
The lack of associations between LVMi and the RAS in the total group and different ethnic groups were unexpected, since it is well known that as a central blood pressure regulating mechanism a dysregulated RAS may result in increased blood pressure with consequent increases in left ventricular mass [Citation4]. A possible explanation may involve the opposing effects of ethnicity, sex hormones and socio-economic status on the RAS, blood pressure and cardiac dimensions [Citation7–13]. Previous studies investigating the link between left ventricular mass and the RAS were typically conducted in older (≥45 years) patients with hypertension [Citation5,Citation6] and not in young apparently healthy participants.
Our finding of an inverse association between LVMi with the RAS components in black women with low socio-economic status is in contradiction to previous findings indicating that increased LVMi is associated with over-activation of the RAS [Citation1–3,Citation40]. Activation of the RAS is controlled by renin release, which is stimulated by several factors, including a decrease in renal perfusion pressure and sodium delivery to the macula densa [Citation1–3,Citation10,Citation40]. With an over-activity of the RAS, increased Ang II may lead to vasoconstriction, fibrosis and the release of aldosterone, thereby mediating sodium and volume retention [Citation1–3,Citation40]. If sustained over time, this may increase blood pressure and contribute to the development of hypertension-mediated left ventricular hypertrophy [Citation1–3,Citation40].
The mechanism at play to explain the inverse association between LVMi with renin activity and its downstream consequents observed in the black women with low socio-economic status may involve the interplay of various factors. With an increase in salt intake (and low potassium intake), the RAS may be suppressed [Citation10]. Higher plasma sodium levels may result in increased plasma volume and cardiac output with resultant raised blood pressure, which is known to be a primary contributor to increased left ventricular mass over time [Citation41]. Suppression of the RAS in this group of women may be further amplified by factors related to low socio-economic environments such as increased stress (raised cortisol) [Citation42–44], increased alcohol consumption (raised gamma-glutamyl transferase) [Citation45–47] and poor diet (high sodium-potassium ratio) [Citation48–50] – which were all evident in this group. On the other hand, metabolic factors such as total cholesterol seems to be an important contributor to LVMi in the white groups. These behavioural risk factors may be attributed to limited financial means to purchase healthy foods, or a lack of knowledge on cardiovascular-related health behaviours. A meta-analysis of studies in high income countries demonstrated that low education levels (amongst other socio-economic determinants such as occupation and income) indicated the strongest association with increased prevalence of hypertension [Citation51], especially in women. Our finding is therefore aligned with, and adds to this as we demonstrated a similar vulnerability in women with low socio-economic status. It was further found that higher education and income are associated with a healthier lifestyle including more exercise, preventive medical care as well as healthy eating habits, with less alcohol intake and smoking [Citation51,Citation52].
Several methodological strengths and limitations of the study should be considered. The cross-sectional design prevents us from inferring causal relationships. We could also not rule out the possibility of residual confounding due to unmeasured covariates. A major strength of our study is the fact that we included a young apparently healthy population with a detailed RAS estimation using a sensitive LC-MS/MS method.
In conclusion, the association between LVMi and a suppressed RAS in young black women with low socio-economic status may reflect how multiple factors, including blood pressure and lifestyle factors, may all contribute to the increase in left ventricular mass overtime.
Recommendations for future studies
In order to prevent dysregulation of the RAS and improve cardiovascular health, factors such as socio-economic status, the RAS, blood pressure and the influence thereof on microvascular and macrovascular changes should be a focus of future research. This may include longitudinal studies to determine how the RAS, including the alternative RAS changes over time and how these changes associate with changes in hemodynamic variables, such as cardiac output, vascular resistance, but also subclinical organ damage such as arterial stiffness and left ventricular mass. Furthermore, the black population seems to be vulnerable to suppression of the RAS regardless of the fact that blood pressure is still within normal ranges [Citation14–17]. Hence future research needs to establish optimal ranges for RAS components, electrolytes (sodium, potassium) and blood pressure in populations of African ancestry. Lastly, low socio-economic status and cardiovascular disease are strongly associated [Citation51,Citation52]. Due to the challenging nature to improve socio-economic status in low-middle income countries and the cardiovascular disease burden, future research needs to focus on the improvement of socio-economic status as a preventative strategy against the development of cardiovascular disease. This may include educational programs and skills development. In turn, higher education and skills may increase employment opportunities and income, which may lead to healthier behaviours and a decrease in cardiovascular disease [Citation51,Citation52].
Supplementary_Material.docx
Download MS Word (52.2 KB)Acknowledgements
The authors are grateful towards all individuals participating voluntarily in the study. The dedication of the support and research staff as well as students at the Hypertension Research and Training Clinic at the North-West University are also duly acknowledged.
Disclosure statement
No potential conflict of interest was reported by the author(s).
Additional information
Funding
References
- Schmieder RE, Hilgers KF, Schlaich MP, et al. Renin-angiotensin system and cardiovascular risk. Lancet. 2007;369:1208–1219.
- Mehta PK, Griendling KK. Angiotensin II cell signaling: physiological and pathological effects in the cardiovascular system. Am J Physiol Cell Physiol. 2007;292:C82–C97.
- Atlas SA. The renin-angiotensin aldosterone system: pathophysiological role and pharmacologic inhibition. J Manag Care Pharm. 2007;13:9–20.
- Cowan BR, Young AA. Left ventricular hypertrophy and renin-angiotensin system blockade. Curr Hypertens Rep. 2009;11:167–172.
- Jia G, Aroor AR, Hill MA, et al. Role of renin-angiotensin-aldosterone system activation in promoting cardiovascular fibrosis and stiffness. Hypertens. 2018;72:537–548.
- Ferrario CM. Cardiac remodelling and RAS inhibition. Ther Adv Cardiovasc Dis. 2016;10:162–171.
- James GD, Sealey JE, Muller F, et al. Renin relationship to sex, race and age in a normotensive population. Int J Hypertens. 1986; 4:S387–S399.
- Swart R, van Rooyen JM, Mels CMC. Change in renin, cardiovascular and inflammatory markers over three years in a black and white population: the SABPA study. BMC Cardiovasc Disord. 2017;17:104–111.
- van Rooyen JM, Poglitsch M, Huisman HW, et al. Quantification of systemic renin-angiotensin system peptides of hypertensive black and white African men established from the RAS-Fingerprint®. J Renin Angiotensin Aldosterone Syst. 2016;17:1470320316669880.
- Sagnella GA. Why is plasma renin activity lower in populations of African origin? J Hum Hypertens. 2001;15:17–25.
- van Rooyen JM, Schutte AE, Huisman HW, et al. End-organ damage in urbanized Africans with low plasma renin levels: the SABPA study. Clin Exp Hypertens. 2014;36:70–75.
- Capingana DP, Magalhães P, Silva ABT, et al. Prevalence of cardiovascular risk factors and socioeconomic level among public-sector workers in Angola. BMC Public Health. 2013;13:732–738.
- Rodriguez CJ, Sciacca RR, Diez-Roux AV, et al. Relation between socioeconomic status, race–ethnicity, and left ventricular mass. Hypertens. 2004;43:775–779.
- Stats SA. Poverty on the rise in South Africa. 2017 [accessed 2019 Sep]. Available from: http://wwwstatssagovza/?p=10334
- Callander EJ, McDermott R. Measuring the effects of CVD interventions and studies across socioeconomic groups: a brief review. Int J Cardiol. 2017; 227:635–643.
- Rosengren A, Smyth A, Rangarajan S, et al. Socioeconomic status and risk of cardiovascular disease in 20 low-income, middle-income, and high-income countries: the Prospective Urban Rural Epidemiologic (PURE) study. Lancet Glob Health. 2019; 7:748–760.
- Schultz WM, Kelli HM, Lisko JC, et al. Socioeconomic status and cardiovascular outcomes: challenges and interventions. Circulation. 2018;137:2166–2178.
- Stats SA. Youth graduate unemployment rate increases in quarter 1 of 2019. 2019 [accessed 2019 Oct]. http://wwwstatssagovza/?p=12121
- Schutte AE, Gona PN, Delles C, et al. The African Prospective study on the Early Detection and Identification of Cardiovascular disease and Hypertension (African-PREDICT): design, recruitment and initial examination. Eur J Prev Cardiol. 2019;26:458–470.
- Mansia G, De Backer G, Dominiczak A, et al. 2007 ESH-ESC guidelines for the management of arterial hypertension: the task force for the management of arterial hypertension of the European Society of Hypertension (ESH) and of the European Society of Cardiology (ESC). Blood Press. 2007;16:135–232.
- Patro B, Jeyashree K, Gupta P. Kuppuswamy’s Socioeconomic Status Scale 2010-the need for periodic revision. Indian J Pediatr. 2012;79:395–396.
- Marfell-Jones M, Stewart A, de Ridder J. International standards for anthropometric assessment. Wellington (New Zealand): International Society for the Advancement of Kinanthropometry; 2012.
- Mosteller RD. Simplified calculation of body-surface area. N Engl J Med. 1987;317:1098.
- Brage S, Brage N, Franks PW, et al. Reliability and validity of the combined heart rate and movement sensor Actiheart. Eur J Clin Nutr. 2005;59:561–570.
- Barreira T, Kang M, Caputo J, et al. Validation of the Actiheart monitor for the measurement of physical activity. Int J Exerc Sci. 2009; 2:1–12.
- Morrin NM, Stone MR, Henderson KJ. Reproducibility of 24-h ambulatory blood pressure and measures of autonomic function. Blood Press Monit. 2017;22:169–172.
- Imholz B, Wieling W, van Montfrans G, et al. Fifteen years experience with finger arterial pressure monitoring: assessment of the technology. Cardiovasc Res. 1998;38:605–616.
- Guelen I, Westerhof B, van der Sar G, et al. Validation of brachial artery pressure reconstruction from finger arterial pressure. J Hypertens. 2008;26:1321–1327.
- Schutte A, Huisman H, van Rooyen J, et al. Validation of the Finometer device for measurement of blood pressure in black women. J Hum Hypertens. 2004;18:79–84.
- Hill LK, Sollers Iii JJ, Thayer JF. Resistance reconstructed estimation of total peripheral resistance from computationally derived cardiac output. Biomed Sci Instrum. 2013; 49:216–223.
- Lang RM, Badano LP, Mor-Avi V, et al. Recommendations for cardiac chamber quantification by echocardiography in adults: an update from the American Society of Echocardiography and the European Association of Cardiovascular Imaging. J Am Soc Echocardiogr. 2015;28:1–39.
- Nagueh SF, Smiseth OA, Appleton CP, et al. Recommendations for the evaluation of left ventricular diastolic function by echocardiography: an update from the American Society of Echocardiography and the European Association of Cardiovascular Imaging. J Am Soc Echocardiogr. 2016;29:277–314.
- Devereux RB, Alonso DR, Lutas EM, et al. Echocardiographic assessment of left ventricular hypertrophy: comparison to necropsy findings. Am J Cardiol. 1986;57:450–458.
- Campbell N, Cappuccio F, Hennis A, et al. Protocol for population level sodium determination in 24-hour urine samples. 2010.
- Pavo N, Goliasch G, Wurm R, et al. Low- and high-renin heart failure phenotypes with clinical implications. Clin Chem. 2018;64:597–608.
- Swanepoel B, Schutte A, Cockeran M, et al. Sodium and potassium intake in South Africa: an evaluation of 24-hour urine collections in a white, black, and Indian population. J Am Soc Hypertens. 2016;10:829–837.
- Levey AS, Stevens LA. Estimating GFR using the CKD Epidemiology Collaboration (CKD-EPI) creatinine equation: more accurate GFR estimates, lower CKD prevalence estimates, and better risk predictions. Am J Kidney Dis. 2010;55:622–627.
- Patel S, Rauf A, Khan H, et al. Renin-angiotensin-aldosterone (RAAS): the ubiquitous system for homeostasis and pathologies. Biomed Pharmacother. 2017; 94:317–325.
- Ha SK. Dietary salt intake and hypertension. Electrolyte Blood Press. 2014;12:7–18.
- Murro DG, Beavers M, Harshfield GA, et al. Aldosterone contributes to elevated left ventricular mass in black boys. Pediatr Nephrol. 2013;28:655–660.
- Gonzalez A, Ravassa S, Lopez B, et al. Myocardial remodeling in hypertension. Hypertens. 2018;72:549–558.
- Cohen S, Doyle W, Baum A. Socioeconomic status is associated with stress hormones. Psychosom Med. 2006;68:414–420.
- Castro-Diehl C, Diez Roux AV, Seeman T, et al. Associations of socioeconomic and psychosocial factors with urinary measures of cortisol and catecholamines in the Multi-Ethnic Study of Atherosclerosis (MESA). Psychoneuroendocrinology. 2014;41:132–141.
- Duprez D, De Buyzere M, Paelinck M, et al. Relationship between left ventricular mass index and 24-h urinary free cortisol and cortisone in essential arterial hypertension. J Hypertens. 1999; 17:1583–1588.
- Liu CF, Gu YT, Wang HY, et al. Gamma-glutamyltransferase level and risk of hypertension: a systematic review and meta-analysis. PLoS One. 2012;7:e48878.
- Schutte AE, Schutte R, Huisman HW, et al. Are behavioural risk factors to be blamed for the conversion from optimal blood pressure to hypertensive status in black South Africans? A 5-year prospective study. Int J Epidemiol. 2012;41:1114–1123.
- Ujihara I, Hitomi S, Ono K, et al. The ethanol metabolite acetaldehyde induces water and salt intake via two distinct pathways in the central nervous system of rats. Neuropharmacology. 2015; 99:589–599.
- Cook NR, Obarzanek E, Cutler JA, et al.; Trials of Hypertension Prevention Collaborative Research Group. Joint effects of sodium and potassium intake on subsequent cardiovascular disease: the trials of hypertension prevention follow-up study. Arch Intern Med. 2009;169:32–40.
- Frohlich ED, Varagic J. The role of sodium in hypertension is more complex than simply elevating arterial pressure. Nat Rev Cardiol. 2004;1:24–30.
- Meneton P, Jeunemaitre X, de Wardener HE, et al. Links between dietary salt intake, renal salt handling, blood pressure, and cardiovascular diseases. Physiol Rev. 2005;85:679–715.
- Leng B, Jin Y, Li G, et al. Socioeconomic status and hypertension: a meta-analysis. J Hypertens. 2015;33:221–229.
- Darmon N, Drewnowski A. Does social class predict diet quality? Am J Clin Nutr. 2008;87:1107–1117.