
Abstract
Mineral deposits are commonly associated with and hosted in volcanic successions. Volcanic facies analysis as applied in mineral exploration is powerful for characterising host stratigraphy to understand volcanological and eruption processes, depositional setting, and tectonic processes before, during and after ore-forming events. However, the specialist experience required in studying ancient, deformed successions impedes the uptake of facies analysis as a routinely applied technique in mineral exploration. This challenge is reflected in the literature with a paucity of examples where 3D models are developed directly from facies analysis and is worth addressing, as stratigraphic approaches are commonly inadequate for understanding and modelling the complexities within ancient volcanic terrains. We address this gap by demonstrating a technique that uses digitised graphic logs to construct correlation charts in a graphics editor to interpret ‘restored’ volcanic successions within fault blocks. This approach is validated with concurrent cross-sections that depict the structural-stratigraphic framework. The work is iteratively revised until the interpretation is internally consistent across both the correlation chart and the cross-section. This technique is presented within a four-phase workflow that guides the reader from initial scoping, through to graphic logging, interpretation of volcanic successions by locality (or fault block) and finally a synthesis and 3D model. This workflow was developed from our experiences in the buried and deformed Ordovician Cowal Igneous Complex that hosts world-class gold deposits that are currently being mined at E42 (open pit) and GRE46 (underground mine). A case study of the Cowal Igneous Complex is presented to demonstrate the value and real-world application of this workflow.
KEY POINTS
Volcanic facies analysis is a powerful tool for the production of 3D models with application to mining and exploration settings.
Graphic logging-based techniques and workflows were developed during 3D reconstructions of ancient and buried volcanic successions in the Cowal Igneous Complex of the Ordovician Macquarie Arc of New South Wales.
Introduction
Interpreting facies architecture is valuable for understanding subsurface geology and is widely applied in hydrocarbon exploration in conjunction with sequence stratigraphy (Catuneanu, Citation2020; Emery & Myers, Citation2009; Miall, Citation2022). These approaches are not as common in mineral exploration, as seismic data are not routinely acquired (Bellefleur et al., Citation2019; Malehmir et al., Citation2017). Volcano-sedimentary successions are also more complex than those from any other depositional setting (Cas & Wright, Citation1987), as volcanism drastically changes topography (e.g. Ramalho et al., Citation2013), affects the rate, volume and types of sediment input, contributes to transport and depositional processes (e.g. Branney & Kokelaar, Citation2002; Carey & Schneider, Citation2011), and produces volcanic particles with an extreme variety in size, density and shape (Houghton & Wilson, Citation1989; Manville et al., Citation2002). Volcano-sedimentary facies are generally laterally discontinuous or confined to sectors (Allen et al., Citation2007; Gamberi, Citation2001; Kokelaar & Romagnoli, Citation1995; Németh & Palmer, Citation2019), which may result in a lack of reliable marker beds across a region (Martí et al., Citation2018). Additionally, hydrothermal alteration, metamorphism and deformation can impose false ‘pseudo-breccia’ (or ‘pseudo-clastic’) and ‘pseudo-coherent’ textures. When interpreting primary volcano-sedimentary facies, careful observation is required to see through the effects of later hydrothermal, tectonic and metamorphic processes (Allen, Citation1988; Cas et al., Citation2011; Gifkins et al., Citation2005).
There are examples where volcanic successions are effectively documented in mining districts, particularly in volcano-sedimentary hosted deposits (Allen et al., Citation1996; DeWolfe & Pittman, Citation2018; Donaire et al., Citation2020; Doyle & Allen, Citation2003; White & McPhie, Citation1996; Yamada & Yoshida, Citation2004) but also in porphyry–epithermal deposits (Blackwell et al., Citation2014; Harris et al., Citation2006, Citation2014; Simpson et al., Citation2005; Squire & McPhie, Citation2007). Despite the benefits of volcanic facies analysis, the requisite specialist expertise is a barrier to the uptake of these techniques by mineral-exploration groups as part of routine data collection or ore-body characterisation. A possible contributing factor is a paucity of literature that integrates traditional facies analysis with 3D modelling for mineral exploration (e.g. Schetselaar, Citation2013). This present paper seeks to address this gap by presenting workflows developed during the authors’ experiences in the mineralised Cowal Igneous Complex (CIC) in the Ordovician Macquarie Arc of New South Wales, Australia ( and ).
Figure 1. (a) Orogens of the Tasmanides, eastern Australia after Glen (Citation2005, Citation2013) and Zhang et al. (Citation2019) with inset of Eastern Gondwana adapted from Boger and Miller (Citation2004). (b) Simplified geological map of the Macquarie Arc (adapted from Glen et al., Citation2011).
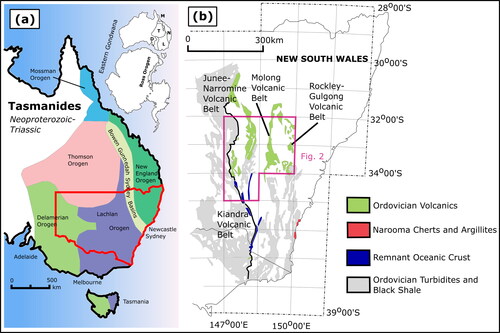
Figure 2. Map showing three northern belts of the Macquarie Arc divided into phases of arc development and with Ordovician turbidites in grey. Based on Percival and Glen (Citation2007) and Glen et al. (Citation2011). The Cowal Igneous Complex (CIC) is indicated by the pink box, which is also the map area for . Inset at lower right shows location of Macquarie Arc volcanic rocks in the Lachlan Orogen, Ordovician turbidites and black shales (craton derived continental margin terranes), and cherts and argillites of the Narooma oceanic plate terrane. Lower-case single letters on the main map are notable localities in the Junee–Narromine Volcanic Belt, m, Marsden Cu–Au porphyry prospect; g, Goonumbla; n, Northparkes alkalic porphyry deposits.
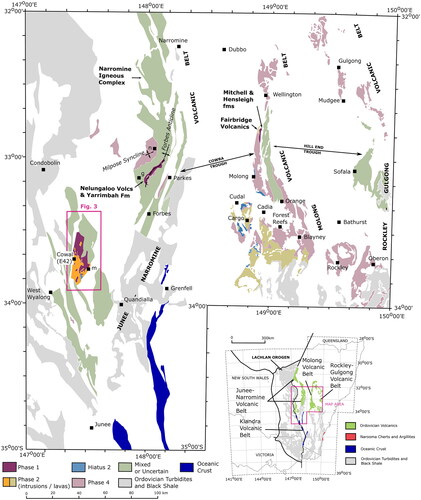
The CIC is a 44 × 17 km fault bounded block of Ordovician mafic–intermediate volcanics and intrusions (Glen, Spencer et al., Citation2007) that is almost completely buried under 50–100 m of Cenozoic and recent cover, and hosts current gold mining operations at the E42 open pit and the GRE46 underground mine (Barker et al., Citation2019; Henry et al., Citation2014; Zukowski et al., Citation2014). This methodology paper is part of a broader study on the volcanic facies architecture of the CIC that seeks to understand the setting, volcanism and sedimentation processes operating in the CIC during the Early Ordovician. The main challenges have been unravelling the structural complexity caused by multiple cycles of later tectonism and interpreting mineralised and hydrothermally altered volcanic textures from diamond drill core alone.
Aims
The aims of this paper are to:
Demonstrate techniques for effectively integrating traditional volcanic facies analysis with mining databases for three-dimensional (3D) modelling of volcanic facies architecture. Although this approach was developed in a buried, highly deformed environment in a mature mineral district with active mining, we show it can be applied at research and exploration projects at all levels of development.
Demonstrate a graphical approach that encourages interrogation and iterative testing, with volcano-sedimentary successions interpreted on correlation charts while structure and stratigraphy is concurrently interpreted on cross-sections.
Present a regional structural and stratigraphic framework for the CIC to demonstrate the value of the method and to inform future contributions on the volcanic architecture of the CIC.
Geological setting
The Lachlan Orogen and the Macquarie Arc
The Paleozoic Lachlan Orogen spans central and eastern New South Wales, Victoria, and northeastern Tasmania (), and records the Ordovician to Carboniferous history of Gondwana’s eastern margin (Foster & Gray, Citation2000; Glen, Citation2005, Citation2013). Controversy surrounds the Lachlan Orogen’s Ordovician history arising from two closely juxtaposed, coeval features with contradictory settings implied. The first feature is comprised of four belts of mafic, commonly K-rich rocks, generally accepted as remnants of the Ordovician intra-oceanic Macquarie Arc (Crawford et al., Citation2007) surrounded by the second feature, coeval Lower–Middle Ordovician craton derived quartz-rich turbidites ().
The ambiguity for the mafic belts is reflected in the diverse tectonic settings postulated for their origins including intra-oceanic island arc (Cas, Citation1983; Cas et al., Citation1980; Oversby, Citation1971; Pemberton & Offler, Citation1985; Scheibner, Citation1973), island arc on Precambrian substrate (Scheibner, Citation1987), continental rift (Wyborn, Citation1977), hotspot mantle plume (Campbell & Hill, Citation1988; Fergusson & Coney, Citation1992), oceanic intraplate (Wyborn, Citation1992) and localised cycles of extension on a previously established back-arc substrate (Glen, Citation2013; Quinn et al., Citation2014). By contrast, the coeval quartz-rich turbidites have been assigned both active-margin (Packham, Citation1973) and passive margin settings (Cas, Citation1983; VandenBerg & Stewart, Citation1992).
From west to east, the Junee–Narromine Volcanic Belt (JNVB), the Molong Volcanic Belt and the Rockley-Gulgong Volcanic Belt are the main belts of the Macquarie Arc. The Kiandra Volcanic Belt near the NSW–Victoria border is regarded as a smaller strike-slip continuation of the JNVB ().
Four magmatic phases were initially described by Crawford et al. (Citation2007) for the Macquarie Arc, with two intervening hiatuses associated with uplift and shallow marine sedimentation (Percival & Glen, Citation2007). This synthesis has been refined with the acquisition of more zircon U–Pb geochronology data (e.g. Kemp et al., Citation2020). The fourth and final phase of shoshonitic alkalic magmatism is the most economically important of all the magmatic phases and has made the Macquarie Arc the second most significant alkalic porphyry Cu–Au district in the world (Cooke et al., Citation2007). This mineralising event coincides with the earliest Silurian Benambran Orogeny, which terminated magmatism during the arc’s accretion to Gondwana’s eastern margin (Glen, Meffre, et al., Citation2007).
After the Benambran Orogeny, extensional Silurian deep-water sedimentary basins (Hill End, Cowra, Tumut and Ngunawal basins) developed with coeval S-type granitoids from 432 to 424 Ma. Crustal stretching in a back-arc extensional setting is invoked as the trigger for crustal melting and magmatism (Collins, Citation2002; Fergusson, Citation2010). These events split the Macquarie Arc into its present meridional configuration () with its rafted remnants separated by Siluro-Devonian deep-water–fluvial–lacustrine–shallow marine sedimentary basins (or troughs).
The extensional setting changed to a compressional-extensional regime (Cas, Citation1983; Fergusson, Citation2017) in the Devonian–Carboniferous, with episodic compressional events such as the Bindian, Tabberrabberan and Kanimblan orogenies, interspersed with extensional tectonic basin forming phases (Cas, Citation1983). Structural styles include faulting, folding, development of cleavage and inversion of Siluro-Devonian basins (Gray & Gregory, Citation2003; Orth et al., Citation1993, Citation1995; Willman et al., Citation2002). Ordovician quartz turbidites have undergone low-grade metamorphism with local high temperature low-pressure metamorphic complexes also present (Barron, Citation1999).
The Cowal Igneous Complex (CIC)
The CIC is an igneous sequence in the southwest of the JNVB. It is completely buried under Cenozoic cover and can be viewed as a 44 × 17 km north-northeast-trending oval-trapezoid-shaped feature in regional aeromagnetic imagery (Glen, Spencer et al., Citation2007).
Modern regional exploration was initiated to the north at Goonumbla (now known as Northparkes) in 1972 by Geopeko (Jones, Citation1985), culminating in the 1977 discoveries of Endeavour 22, 26 and 27. From 1980 to 1988, exploration had progressed to the CIC, which saw the delineation of a north–south structural corridor of gold anomalies (Endeavour 40, 42 and 46) on the western edge of Lake Cowal, achieved through geophysical methods and systematic rotary air-blast drilling. Endeavour 42 (E42) has been an open cut mine since 2004, with current resources for both the E42 open pit and the GRE46 underground deposit totalled at 285.1 Mt @ 0.98 g/t Au for 8.99 MOz (Evolution Mining Ltd, Citation2024). Gold-bearing veins at E42 contain calcite–quartz–pyrite ± adularia ± sphalerite ± galena and occur in steeply dipping faults and associated veins, cross-cut by later veins that are moderately southwest- and west-dipping (Henry et al., Citation2014). Typical auriferous veins at GRE46 have a similar mineral assemblage (Barker et al., Citation2019).
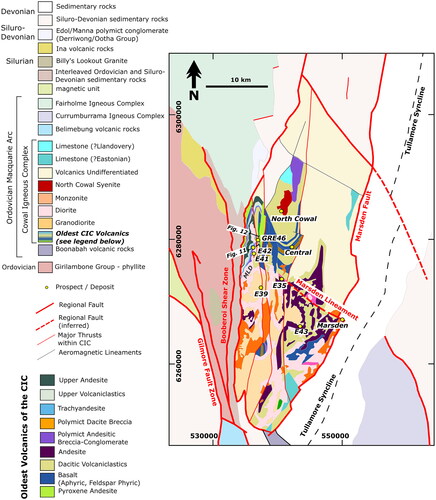
The majority of the Cowal gold deposits are hosted in a sequence of semi-conformable sedimentary, volcaniclastic and volcanic rocks, intruded by the Muddy Lake Diorite Sill (), which is locally discordant (McInnes, Citation2015). This sequence is well defined for the E42 open pit mine (Cannell, Citation2003; Miles & Brooker, Citation1998; Strickland, Citation2005), but only tenuous correlations have been made to the adjacent underground deposit at GRE46 (Barker et al., Citation2019; Simpson & Cooke, Citation2006) and further afield to other ore deposits in the CIC such as E41 (Zukowski, Citation2010; Zukowski et al., Citation2014), Decoy (Gemmel, Citation2008; Sealey, Citation2012) and Marsden (Rush, Citation2013). The CIC can be broadly viewed as two halves (), bisected across the west-northwest-trending Marsden Lineament, with supracrustal stratigraphy in the north and various Early and Middle–Late Ordovician batholiths, stocks and plutons to the south.
Figure 3. Modified from Radford (Citation2020), Henry et al. (Citation2014) and new graphic logging, facies analysis and 3D modelling () to show internal stratigraphic divisions for the oldest rocks of the Cowal Igneous Complex. Cross-section positions for and are also indicated on the map. The ‘Muddy Lake Diorite’ is in light pink and labelled with ‘MLD’ on the map.
Methods
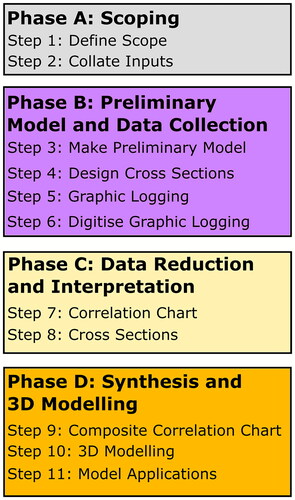
We designed an idealised workflow for 3D modelling and reconstructions of volcanic architecture using graphical logging techniques and facies analysis (). The method consists of 11 steps organised into four phases: (a) a scoping phase for applying this workflow and collating relevant inputs; (b) a working hypothesis phase where relevant inputs are synthesised into a 3D preliminary model and tested on cross-sections through graphic logging; (c) a data reduction and interpretation phase where digitised scalable vector graphics (svg) files of the graphic logging are organised into correlation charts and cross-sections for iterative testing of facies architecture, stratigraphy and structure; and (d) a synthesis phase where the graphic logging is used to revise and update the preliminary model into a 3D model of the volcanic facies architecture. A set of definitions is given in the Appendix.
Figure 4. Phases of workflow for establishing scope and preliminary model, carrying out graphic logging and facies analysis, plotting correlation charts and cross-sections and synthesising a 3D Model.
Phase A: Scoping
Step 1: Define scope for applying the workflow
It is important to clearly define (i) the goals for applying this workflow, (ii) the work area and scale and (iii) the time frame (). This definition guides decisions later in the workflow such as: (i) what datasets to include in the preliminary model, cross-sections and 3D modelling (steps 2, 4, 5 and 11); (ii) cross-section design and drill hole selection for logging (step 4); (iii) choosing the scale of logging (step 5); and (iv) the assigning of facies and rock unit names (steps 5 and 7).
Figure 5. Phase A: Scoping phase of workflow.
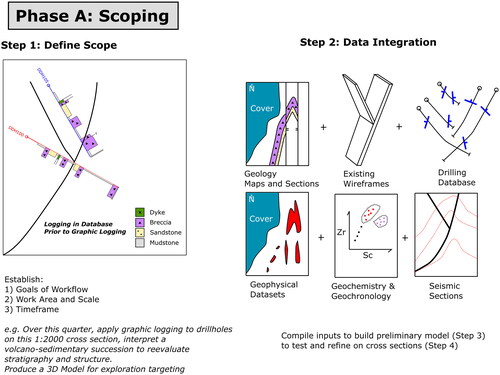
Step 2: Collate inputs
Collate source data for the preliminary model (developed in step 3). For most projects, this will primarily be company data, although regional datasets from geological surveys can also be utilised. Some of these datasets are represented on as an example.
Existing maps and remote sensing imagery
Geology maps, geophysical and remote sensing data are some examples of existing maps and cross-sections that could inform a preliminary model. In 3D modelling for the CIC, key features from these types of datasets (for example lineaments on magnetics imagery) were digitised as points and polylines that informed the isosurfacing in Leapfrog (see Cowal Igneous Complex case study).
Mining or company database
Existing wireframes and drill-hole databases are some examples of interpreted models from mining and exploration activities that can be used to extract point data or structural measurements as inputs for fault wireframes.
Mining or company database—data for isosurfaces
At the scoping phase of the workflow, it is also worth considering how 3D models of the facies architecture might be integrated later with other datasets. As an example, testing the interpretations against a chemo-stratigraphic model might be a future priority. In that case, preliminary models and cross-sections should be designed through spatial positions in the data with the most appropriate geochemistry.
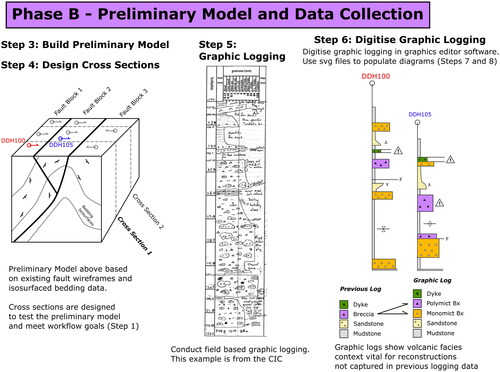
Phase B: Preliminary model and data collection
Step 3: Build preliminary model
The ‘preliminary model’ refers to a volume of the project area, divided into fault blocks using fault wireframes interpreted from the various datasets described in step 2. Supporting the preliminary model with isosurfaces is an effective way of leveraging the high volumes of data commonly available at mines and advanced exploration sites ().
Figure 6. Phase B: Preliminary model and data collection phase of workflow.
The goal is to establish a preliminary model with relevant data and isosurfaces that (i) serve the goals of applying the workflow (step 1), (ii) can be projected onto cross-sections for testing and refining (step 4), and (iii) provide a surface that those modelling the geology can reference while linking cross-sections in 3D (step 10).
Fault wireframing
For software with implicit modelling functions (e.g. Leapfrog Geo and Micromine Origin), faults can be interpolated from polylines digitised on existing maps and remote sensing imagery, from point data generated from the drilling database or from a combination of both input types. For software with explicit triangulation methods only (e.g. Micromine, Surpac and Datamine), wireframing will have to be achieved through traditional methods such as serial cross-sections.
Fault blocks
Fault blocks can be modelled by having the fault wireframes intersect each other and divide a model volume. This function will differ depending on the software being used (e.g. Vulcan, Micromine, Datamine, GOCAD and Leapfrog).
Isosurfaces
Isosurfacing of structural measurements (e.g. bedding, foliation, faults and fractures) permits a 3D visualisation of structural fabrics. Other company data (e.g. metal assays, alteration and mineralisation logging, and whole rock geochemistry) can also be isosurfaced in a similar way.
Step 4: Design cross-sections
Cross-sections should be designed to meet the workflow goals (step 1) and to test the preliminary model (step 3). Longer-term objectives of integrating facies architecture with other datasets might also factor into the cross-section design and drill-hole selection.
Step 5: Graphic logging
The descriptive to genetic terminology scheme in Cas et al. (Citation2009) is recommended, as it serves as a systematic checklist of features to record. Cas and Wright (Citation1987) and McPhie et al. (Citation1993) are recommended texts for designing an appropriate graphic logging methodology.
Graphic logging of volcanic facies does require significant training and experience so an expert can be engaged to either carry out this step or to train industry geologists to do so. Regardless of the approach taken, those involved in the logging will have compiled a systematic list of textures, contact relationships and deformation styles by applying the Cas et al. (Citation2009) scheme. As those who conduct the graphic logging will have made key observations of facies characteristics that inform interpretations on processes, they should also be directly involved in the stratigraphic correlations and structural interpretations (steps 7 and 8) and 3D modelling (step 10).
The scale of logging should be appropriate to the workflow objectives (step 1). If possible, scale-appropriate facies or rock unit names could be assigned during graphic logging (Cas et al., Citation2009), which will assist stratigraphic correlations during step 8. Standard logging codes as commonly applied in industry (e.g. AusIMM Field Geologist Manual, Berkman, Citation2001) can capture basic lithological and grainsize data, but graphic logging has the advantage of pictorially conveying facies characteristics immediately (e.g. bedding thickness, bedforms, sedimentary structures, clast types and sizes). This facilitates interpretations on volcano-sedimentary processes that cannot be replicated by standard logging.
Although graphic logs can be produced in some industry software (e.g. Micromine Geobank) we recommend that the graphic logs be hand drawn, at least initially. In our experience, hand-drawn logs remain the best way of conveying complexity and producing good-quality graphic logs in volcanic terrains.
Distinctive facies intervals can be distinguished in a graphic log, which then depicts a stratigraphy of those facies at one location or in a single drill hole. That lithofacies stratigraphy can then be compared with the lithofacies stratigraphy in nearby holes for lateral continuity and correlations. Once a lithofacies stratigraphy has been established in one fault block, it can be compared with the lithofacies stratigraphy in adjacent fault blocks with the aim of attempting correlations across major structures, such that a composite lithofacies stratigraphy can be assembled for the region in question. Both lateral continuity and discontinuity of units need to be explained in terms of possible factors (e.g. irregular depositional topography, sector-directed dispersal processes, selective erosion, faulting, intrusive complications and geometry).
Structural measurement is also part of the logging procedure. A clearly defined scale and scope (step 1) will guide the type and density of structural measurements to effectively interpret structure on the cross-sections (step 8). Advanced mining and exploration sites may have structural data that can be utilised but we encourage collecting an independent structural dataset (i) to verify existing measurements but more importantly (ii) to take structural readings that are pertinent to the stratigraphic-structural interpretation (e.g. establishing fold wavelengths for different stratigraphic units).
Digital graphic logging
Digital graphic logging through a graphics editor using a stylus and touch screen laptop (or tablet) may be more efficient than graphic logging. The digital logging template could simply be a scan or digital file of the logging template, displayed in a graphics editor as a base layer.
Since the logging template is digital, there is no paper size limitation. Several logging templates can instead be vertically ‘stacked’ in the base layer, so that an entire drill hole can be digitised into one file. This replaces the stitching in steps 7 and 8.
Applying logging ‘red-flags’ for alteration-induced pseudo-clastic textures
In exploration or mining settings, reviews of the geology are commonly done from core photographs. Alteration-induced modifications of primary textures present a challenge, as they are best interpreted with a hand lens across several specimens.
Where pseudo-clastic textures have been recognised, we suggest using a symbol next to the logging to indicate that an interval that may appear to be a breccia, is in fact coherent (and vice versa). For this project, an exclamation mark within a triangle was used (see ). Use of simple symbols that can be digitised and easily carried through all steps of the workflow ensures that the logging of pseudo-breccia or pseudo-coherent domains are not dismissed by future geologists who may be restricted to core photos when reviewing the geology.
Collecting samples for thin-sections
Samples for thin-sections can also be taken during the graphic logging, particularly for facies or components that require petrographic confirmation. Alternatively, thin-section samples could be taken later if there are any difficulties encountered while interpreting the stratigraphy (step 7).
Step 6: Digitise graphic logging
Using a consistent logging template for the entirety of a logging program will help with later digitisation. We used a logging template adapted from McPhie et al. (Citation1993) for the CIC project (Supplemental data).
Scan the logging sheets and import and digitise in a graphics editor. For the CIC, the logging was digitised in Inkscape software as a scalable vector graphics file (svg) using a touchscreen laptop and stylus; the same work can be achieved with Adobe Illustrator. The goal is to have the logging available as an svg file to be utilised repeatedly in steps 7, 8 and 9, across multiple platforms. With this approach, the logging is only digitised once.
Logging software such as Stratter or SedLog is another option worth considering for rapidly producing graphic logging svg files. These software packages have the advantage of automatically outputting graphical logs from an Excel spreadsheet. Populating a spreadsheet based on the criteria from Cas et al. (Citation2009) is one possible approach for adapting this methodology to Stratter or SedLog. The main disadvantages, however, are the limited grading shapes and profiles, which would impede facies analysis for complex volcanic successions.
Phase C: Data reduction and interpretation
Step 7: Correlation chart (stratigraphic interpretation)
The correlation chart should be plotted by collating the digitised logging in a graphics editor. The goal is to divide the graphic logs into columns that correspond to fault blocks on the cross-section. This is best viewed in the examples from the CIC where circled numbers denote fault blocks on the cross-section and the corresponding correlation chart (see Cowal Igneous Complex case study). With the graphic logs assembled on the correlation chart, evidence from younging indicators (shown on the graphic logging) can then be applied to invert the digitised logging in the graphics editor and ‘restore’ that interval to its inferred undeformed state.
To compile this chart (), we suggest starting in the fault block that the drill hole is collared in and following the logging downhole. Where the drill hole passes across a fault on the cross-section, this should be reflected on the correlation chart by segmenting the log and moving the remaining logging into a new column. Repeat this process for all fault blocks that the drill hole transects.
Figure 7. Step 7: Diagram showing the process for building the correlation chart using graphic logging and a graphics editor. Refer to text in ‘step 7’ for descriptions.
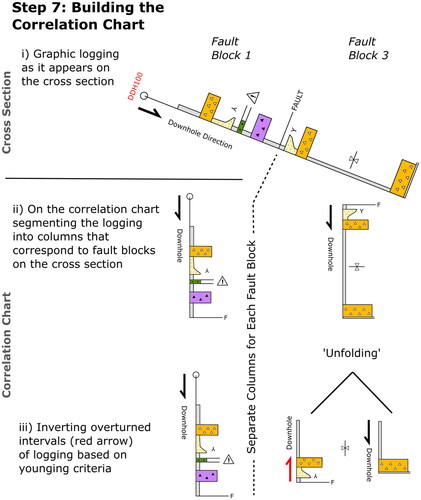
This process should be applied to all drill holes on the cross-section and then the steps below carried out to interpret the volcanic successions within fault blocks:
The first objective is to use younging indicators to plot the digitised graphic logging ‘strips’ so that they are younging up the chart. For example, a graphic logging strip with entirely overturned stratigraphy should be inverted to restore the stratigraphy the right way up ().
Some fault blocks may only have minor segments that are locally overturned (owing to parasitic folds, for example). There are two options here of subdividing the logging strips into fold limbs that both young up, or keeping the longer logging interval but indicating a local fold. Choose an approach that best facilitates correlations or matches the structural style interpreted on the cross-section (step 8).
In deformed volcanic successions, facies architecture or stratigraphic continuity should be proven and not assumed with clear evidence for interpreting lateral or vertical links between facies across fault blocks. Applying the Cas et al. (Citation2009) approach to terminology during graphic logging (step 5) should have produced a systematic list of textures, contact relationships, setting and emplacement features that will help with defining facies names and interpreting the facies architecture. This may require several iterations, as a single drill hole or cross-section will rarely have all the criteria to resolve all ambiguities in deformed volcanic successions.
If facies names cannot be defined, at least attempt unit groupings of principal lithofacies on the correlation charts and assess whether correlations can be made across fault blocks. A lack of clear younging directions (e.g. intrusions or tectonic deformation) may cause ambiguity. In areas of significant uncertainty, try to infer a way up from any subtle (or perhaps equivocal) younging indicators that are present in drill core, while balancing this against the overall stratigraphic succession for the project area that might be better constrained in other drill holes or on other cross-sections. Producing composite correlation charts (step 9) may help with regional scale context.
Step 8: Cross-section (structural interpretation)
Drill traces and fault wireframes should be plotted on a cross-section using industry software. The cross-section can then be imported into a graphics editor as a base layer where the digitised logging (step 6) is superimposed against the drill traces ( and ).
Figure 8. Step 8: Plotting of drill traces and various datasets onto cross-sections (fault wireframes in red, isosurfaced data in blue). The plotted cross-section serves a base layer, and within a graphics editor, the digitised graphic logs are superimposed against the drill traces.
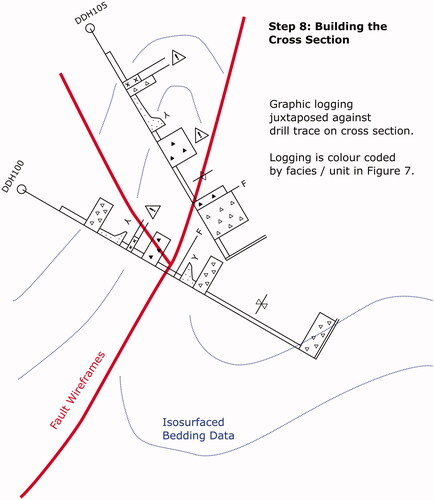
Figure 9. Phase C: Data reduction and interpretation phase of workflow.
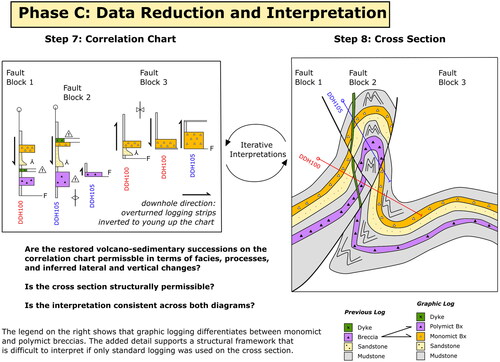
The process outlined below (see ) can be applied, with the objective of cross-validating the ‘restored’ volcano-sedimentary successions on the correlation chart (step 7) with the structural style interpreted on the cross-section.
Colour code the logging on the cross-section with the facies names or lithofacies groupings from the correlation chart.
Use structural data collected during the graphic logging to interpret the structural style on the cross-section. This can be supported by existing structural data where appropriate.
Related to the above point, using isosurfaces of structural data (e.g. bedding, foliation and faults) may also help with interpreting a stratigraphic and structural framework on the cross-section. It is recommended as it may also help to establish spatial links between cross-sections during 3D modelling.
Repeat steps 7 and 8 of the workflow with an iterative process of validating and cross-checking the interpretation. The volcanic successions on the correlation chart and the structure on the cross-section should be internally consistent and permissible ().
Using this workflow across multiple cross-sections adds the further challenge of taking the stratigraphic and structural framework from one cross-section plane and extending it to adjacent cross-sections. Again, this will be an iterative process: data and interpretations on one cross-section may compel revisions on the other.
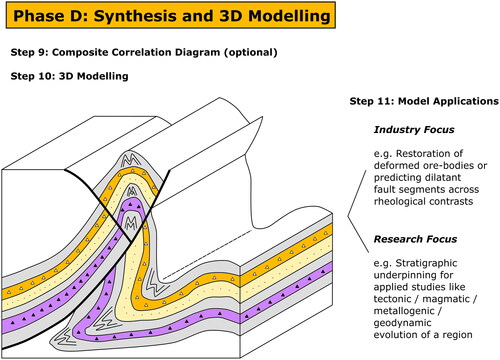
Phase D: Synthesis and 3D modelling
Step 9: Composite correlation chart
This step in the workflow is optional but worth applying in areas of great complexity. Once there is more than one cross-section, a composite correlation chart can be synthesised at any time. It is a useful output to produce in the interim if more work is required to synthesise a 3D model ().
Figure 10. Phase D: Synthesis and 3D modelling phase of workflow.
To produce the composite correlation chart, logging from multiple correlation charts is compiled in a graphics editor. Several drill holes within the same fault block may reveal insights with variations in the facies and the stratigraphy of lithofacies.
Step 10: Modelling stratigraphy and structure in 3D
Once there are enough cross-sections to support it, standard industry workflows for 3D modelling can be applied. A discussion on how Leapfrog Geo was applied for 3D modelling in the CIC is presented in the case study.
Step 11: Outputs and applications of a 3D facies model
3D models of facies architecture would have applications on several fronts, discussed below.
Research focus
A research-centred focus could be taken with further advancing the stratigraphy and structure. For example, the workflow could be re-applied at a larger scale to refine the stratigraphy at local deposits or areas. Alternatively, applying the workflow to smaller-scale regional geology may broaden the understanding of an area or identify regional exploration targets.
The stratigraphy and modelling could also guide targeted research. Some examples of this would be selecting samples for geochronology and geochemistry, or the planning of drill holes for stratigraphy.
Mining and exploration focus
The stratigraphy and 3D model might be applied to mining and exploration efforts. Some examples would be identifying mineralised horizons or time periods within the stratigraphy, doing structural restorations to locate extensions of deformed ore bodies or understanding the rheological contrasts in a volcanic succession that might assist with predicting dilatant segments on syn-mineralisation structures.
Cowal Igneous Complex case study
Background to case study
The value of this methodology is demonstrated through a case study of 3D facies architecture modelling for the CIC. Important outputs are presented for the E42 open pit and GRE46 underground deposit (). The stratigraphy for E42 has been well constrained by Miles and Brooker (Citation1998); however, passing east across the Cowal Shear (exposed in the northeastern wall of the open pit), it has been difficult to establish links to the GRE46 underground deposit. This is exemplified in (modified from Barker et al., Citation2019) and shows the GRE46 position hosted in undifferentiated volcaniclastics.
Figure 11. E42-GRE46 cross-section adapted from Barker et al. (Citation2019) showing the geology prior to the CIC facies architecture project. E42 has been well constrained since Miles and Brooker (Citation1998), but correlations with other prospects have been tenuous. Note the undifferentiated coarse and fine volcaniclastics at GRE46 and the lack of inferred facies or stratigraphic links to E42. An example of how this workflow was applied at Cowal is shown in and on the cross-section through the GRE46 deposit ∼1 km to the north (see for cross-section position). GRE46 underground deposit is indicated by dashed red oval. ‘V-clastics’, volcaniclastics.
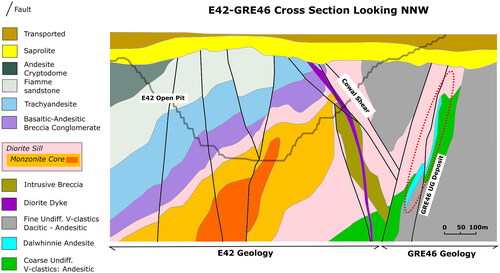
Figure 12. Cowal Igneous Complex (CIC) facies architecture project. A digitised cross-section depicting fault blocks (circled numbers) and a structural-stratigraphic framework. The associated correlation chart is shown in , which also shows the legend for the colours on the cross-section. The position of this cross-section is shown in a map of the CIC in .
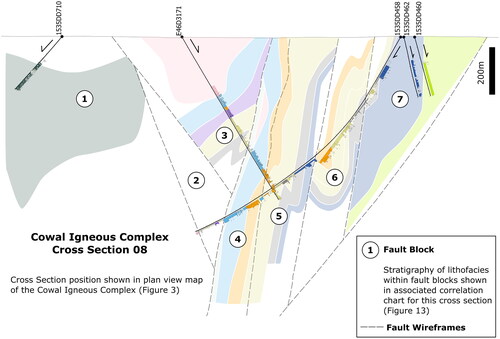
Figure 13. Cowal Igneous Complex (CIC) facies architecture project. This is the correlation chart for the cross-section shown in .
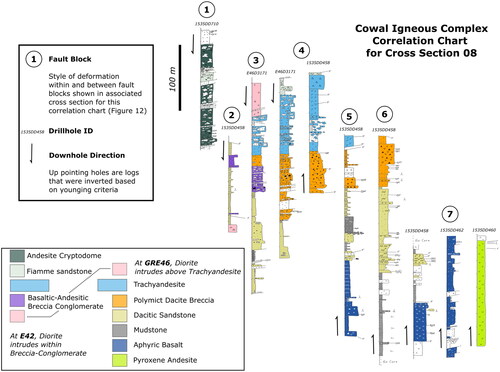
Figure 14. Example of a composite correlation chart taken from the broader PhD project studying the facies architecture of the CIC. This chart was produced in a graphics editor by combining graphic logs from correlation charts from several cross-sections in the CIC. Fault blocks are named in boxes at the top of the chart. Drill-hole names and the ‘source’ cross-section are labelled at the base of the logs. Location of indicated by dashed line rectangle. Locations of the E42 open pit and GRE46 underground mine are indicated by thick red dashed line. The stratigraphic and spatial positions of graphic logs from cross-section 08 (discussed in and ) are indicated by the horizontal red arrows. Lower-case bold letters in circles indicate areas that have been previously documented: (a) Miles and Brooker (Citation1998) originally described the stratigraphy at the E42 open pit, (b) Cannell (Citation2003) extended the upper parts of the E42 stratigraphy adding the ‘Andesite Cryptodome’, (c) Barker et al. (Citation2019) documented correlations between ‘trachyandesite lavas’ from E42 into GRE46, and (d) Decoy was documented as a VMS (Gemmel, Citation2008; Sealey, Citation2012), although no stratigraphic correlations were made to other prospects.
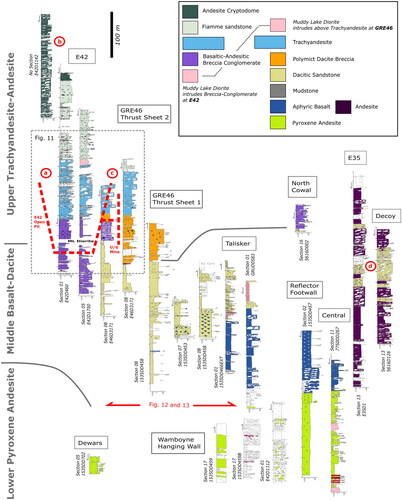
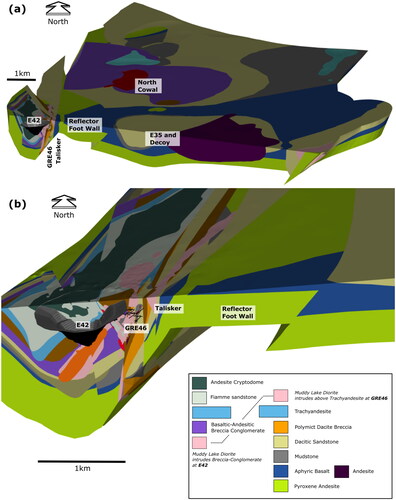
Figure 15. Screenshots of 3D Model in Leapfrog. (a) North-looking view showing the ∼15 km cross-sectional area of the entire CIC. (b) Closer view of ore deposits and adjacent prospects. Selected prospect names are annotated to show locations of the successions shown on the composite correlation chart in .
Graphic logging and facies analysis has addressed the lack of regional-scale correlations between prospects by providing the basis for interpreting volcanic successions across separate deposit areas, recognising commonalities in setting, processes and componentry (i.e. volcano-sedimentary particles), and identifying regionally extensive marker facies. These all serve to support stratigraphic correlations across structures with effective 3D modelling contributing a vital role in visualising the structural complexity.
Applying the workflow to the Cowal Igneous Complex
The initial goal of the overarching project was to confirm the volcanic stratigraphy at the E42 open pit (Miles & Brooker, Citation1998) while characterising facies at the GRE46 underground mine to investigate if there was any basis for interpreting stratigraphic continuity between these deposits (step 1). However, the scope soon expanded to include other deposit areas such as E41 (Zukowski, Citation2010; Zukowski et al., Citation2014), the Decoy VMS deposit (Gemmel, Citation2008; Sealey, Citation2012) and the Marsden porphyry Cu–Au deposit (Rush, Citation2013).
Geology maps (Radford, Citation2020), regional seismic lines (Glen et al., Citation2002), RTP magnetics and mine-scale fault wireframes were the collated datasets (step 2) used to inform the fault wireframing and fault blocks in the preliminary model (step 3). Bedding data were considered appropriate for isosurfaces in the preliminary model owing to the density of data points and the assumption that, as it was a basic measurement, it had a high likelihood of being consistently collected across a range of geologists and companies. This was important, as Cowal has had active drilling since the late 1980s (McInnes, Citation2015), and of the structural measurements that are dated in the database, the earliest are from 2013.
Bedding measurements were generally more abundant in well-bedded mudstones. Where they could be reconciled with specific stratigraphic positions and confirmed as regionally extensive facies (e.g. seafloor mudstones), the bedding isosurfaces were useful for visualising changes in regional bedding orientations across fault blocks and throughout the CIC.
This preliminary model was tested on cross-sections generally plotted at 1:2000 to 1:2500 scale on A0 sheets in landscape orientation (step 4). In this idealised workflow, these cross-sections would inform the drill hole selection for graphic logging (step 5). In practice (before this workflow was fully realised), graphic logging was conducted to achieve an even spatial spread of data through the CIC with cross-sections designed later to incorporate relevant graphic logging data in the cross-section plane.
Graphic logging was digitised as svg files in the graphics editing software Inkscape (step 6). These svg files were transposed against drill traces on the cross-section. A stratigraphic succession was interpreted on correlation charts (step 7), while structure was interpreted on the associated cross-section (step 8).
Composite correlation charts were compiled whenever there was a significant advance in understanding the stratigraphy and structure (step 9). Eventually, a 3D model for the CIC was achieved using Leapfrog Geo (step 10). Although the following paragraph describes modelling techniques specific to the Leapfrog Geo software, the method can be applied across different software packages commonly used in industry. The main objective is to digitise the cross-sections to model 3D geometries of the facies to interrogate and refine the preliminary model (step 3).
As a brief summary of the Leapfrog Geo modelling process: (i) the cross-sections were used to digitise polylines for the various interpreted facies; (ii) using the geological models function, surfaces were interpolated with these polylines to check their geometries in 3D space against other datasets, particularly the bedding isosurfaces; (iii) other point data were also included in the interpolation of the 3D surfaces, such as vertices extracted from existing wireframes, or contact points generated via category selections of lithologies from the drill-hole database; and (iv) the ‘fault framework’ function was then applied to subdivide the model volume into fault blocks with internal stratigraphy. In some instances, the 3D modelling compelled revisions of the stratigraphy and structure (steps 7 and 8).
This 3D model is currently being applied in a research context (step 11) to support facies analysis for the Early Ordovician volcanics of the CIC before it was affected by various intrusions and cycles of deformation. The model is also being utilised by Evolution Mining Ltd, particularly with establishing regional context for prospects throughout the CIC (step 11).
Summary of advances in CIC geology
The stratigraphy in the E42 open pit has been well constrained, since it was documented by Miles and Brooker (Citation1998) with Cannell (Citation2003) extending the upper stratigraphy through the addition of the ‘Andesite Cryptodome’. Extrapolating the understanding at E42 to other fault blocks in the CIC has been difficult, and correlations have been either limited (Barker et al., Citation2019) or not attempted at all (e.g. Decoy VMS prospect; Gemmel, Citation2008; Sealey, Citation2012). illustrates the understanding of the geology at E42 and GRE46 (Barker et al., Citation2019) before this facies architecture project commenced. shows the logging coverage that has been achieved in extending the lithostratigraphy beyond E42 and GRE46.
The composite correlation chart () is one component of a new facies architecture and stratigraphy that will be presented in a future paper. In summary, three informal regional stratigraphic units have been defined for the oldest known volcanics of the CIC. In stratigraphic-chronological order, these are: (1) the lower pyroxene andesite unit, which is dominantly composed of an amygdaloidal pyroxene-rich andesite with a minimum thickness of ∼160 m, with local associations with clast-supported matrix poor breccias. This unit is inferred to be unconformably overlain by (2) the middle basalt-dacite unit, composed of porphyritic basalt, aphyric basalt, fluidal basalt breccia and mafic sandstone that, passing up in the stratigraphy, conformably transitions to dacitic sandstones and breccias composed of fiamme, pumice, dacite lithic clasts and former glass shards, and (3) the upper trachyandesite–andesite unit, which mostly corresponds to the E42 stratigraphy (Cannell, Citation2003; Miles & Brooker, Citation1998).
In delineating the stratigraphy and associated 3D models, a structural framework of steeply west-dipping faults and gently north-plunging, polydeformed folds has developed. The faults and fold hinges are predominantly north to north-northeast striking, and although the ∼2.8 km fold wavelengths in the western third of the CIC () are smaller in scale, it resembles the Milpose Syncline and Forbes Anticline fold pair (∼10 km fold wavelength; ) in the hanging wall to the steeply west-dipping Parkes Thrust (Glen, Meffre, et al., Citation2007; Raymond et al., Citation2000; Simpson et al., Citation2005). The north-northeast-striking folds and thrusts that appear to dominate the structural architecture of the CIC are attributed to the broadly east–west-directed cycles of Siluro-Devonian extension (Collins, Citation2002; Fergusson, Citation2010) and episodic compressional events such as the Bindian, Tabberabberan and Kanimblan orogenies during the Devonian and Carboniferous (Cas, Citation1983; see Geological setting). This is supported by Devonian Ar–Ar age dates of 411 Ma ±2 Ma (Foster et al., Citation1999; Lyons et al., Citation2000) from sericite in the Booberoi Shear Zone, a regional north–south-directed structure that bounds the western margin of the CIC ().
Additionally, a view of the structural complexities associated with major Early to Middle Ordovician intrusions in the CIC (Phase 2 of Crawford et al. Citation2007) has emerged. The most notable example of this is the Muddy Lake Diorite Sill, which is conformable to stratigraphy (e.g. E42) but is locally discordant across the northwest-oriented, moderately northeast-dipping Cowal Shear ( and ). This suggests an earlier history of north block down normal faulting prior to the emplacement of the mid-Ordovician Muddy Lake Diorite.
In summary, the facies analysis and the workflow in this paper have: (1) extended a lithofacies architecture through the entire CIC well beyond E42 and GRE46, (2) established regional stratigraphic units and marker horizons within the oldest known volcanics, which has permitted, (3) an unravelling of later deformation associated with significant Ordovician batholiths and sills and later east–west-directed cycles of Siluro-Devonian extension and compression.
Discussion
Graphic logging and facies analysis develops an understanding of volcano-sedimentary successions that is difficult to replicate with industry-based logging codes and procedures, even if they are highly detailed. The case study at the CIC shows that applying this methodology has been crucial for understanding facies, processes and the setting of the oldest known volcanics while unravelling the complexity imposed by later intrusions and tectonism. Previous stratigraphic correlations and 3D models beyond E42 have been tenuous for this reason; the standardised logging codes and volcano-sedimentary successions were developed at the E42 deposit but are not easily reconciled with units encountered elsewhere.
In summary, this method clearly defines the scope, scale and objectives to effectively frame graphic logging and facies analysis projects. Datasets such as existing maps, remote sensing imagery and drill-hole data are collated to produce a preliminary model that is then tested on cross-sections with graphic logging. An iterative process is applied where digitised logs are amended in a graphics editor to interpret structurally ‘restored’ volcanic successions within fault blocks, while the structural-stratigraphic framework is concurrently interpreted on cross-sections. These key outputs provide robust constraints that can be advanced through to a 3D model of the facies architecture.
The main drawbacks of this method are that (i) this process is time-consuming, and (ii) experience is required with graphic logging of volcanic facies (particularly in ancient settings) with many pitfalls such as not recognising key features or misinterpreting volcanic textures. Nevertheless, we encourage workers to trial this approach—we suggest that a cross-section through the area of least complexity in a region might be a suitable initial project. An assessment can then be made on the time frames required to produce the outputs presented in this paper, to inform planning for long-term projects of greater scope. Acquiring expertise in volcanology and identification of volcanic textures in mineralised and deformed settings before and after this initial trial of the methodology is suggested to facilitate guided observations of volcanic facies and to tailor the training of exploration staff to the facies and geological setting specific to a region.
Another drawback is the degree of difficulty for the 3D modelling, particularly with what is presented for the CIC in the case study. We suggest that this should not be a barrier to applying this method. The key output is in fact the understanding of facies, volcano-sedimentary successions and processes, developed through the iterative workflow of concurrently interpreting cross-sections and correlation charts. The objective with 3D modelling is mainly to verify the geometries interpreted on the cross-sections. Implicit modelling software such as Leapfrog Geo or Micromine Origin is preferred for the speed of modelling, but we believe this method can be applied on all industry software (e.g. Vulcan, Micromine, Datamine, GOCAD), including those that utilise traditional sectional wireframing techniques.
Reconstructing volcanic facies architecture in altered and mineralised terranes that host later intrusions and have been affected by metamorphism and deformation is difficult and becomes more challenging as mineral exploration is driven under cover. We believe this methodology provides field geologists with a means to systematically develop robust volcano-sedimentary, stratigraphic and structural constraints that are difficult to replicate with standard logging approaches. The workflow can be routinely applied in exploration or mining settings, allowing industry geologists to regularly practice the mechanics of graphic logging and facies analysis. Cross-sections and correlation charts are the valuable outputs regularly produced in this workflow and are the rewards for mining and exploration groups that invest in (and remain committed to) this approach. These outputs can then be advanced all the way to meaningful, but falsifiable 3D models as demonstrated in our case study of the CIC.
Conclusions
The proposed modelling workflow has global applications in a variety of settings but is especially useful where it can leverage the data-rich nature of mining and advanced exploration environments. Methods are described and a case study presented of how to integrate remote sensing datasets and company databases to establish a falsifiable, working 3D structural framework. Traditional facies analysis methods are then applied to map the internal stratigraphy and deformation style within and across fault blocks. An iterative workflow is described where volcanic successions are interpreted on correlation charts, while structure is concurrently interpreted on accompanying cross-sections.
Outputs and three-dimensional models from this workflow have these advantages:
Inherent and meaningful integration with remote sensing and company datasets that informed the initial 3D structural framework and cross-section design.
Transparency on how volcanic successions were interpreted and the structural style and stratigraphic correlations across fault blocks.
A clear basis for testing, falsifying and refining facies architecture, stratigraphic correlations and structural framework using a correlation chart and an accompanying cross-section.
Supplemental Material
Download MS Excel (20.4 KB)Acknowledgements
The authors would like to acknowledge Evolution Mining Ltd, Ned Howard for his consistent support of the project, Zach Murphy (and previously Andrew Barker) and the geologists at Cowal, and Stephen Casey, Braiden Gage and field technicians who made the drill core logging possible. We are also grateful for the in-kind support from the Geological Survey of NSW, particularly Dr Michael Bruce who prepared thin-sections for this project. Dr Carol Simpson and Dr Gerard Tripp provided insightful reviews that significantly improved the figures and text. Vinicius G.P. da Cruz is acknowledged for thoughtful feedback on an earlier manuscript.
Disclosure statement
No potential conflict of interest was reported by the author(s).
Data availability statement
The data that support the findings of this study are available from Evolution Mining Ltd. Restrictions apply to the availability of these data and are available from MI with the permission of Evolution Mining Ltd. A graphic logging template is given in the supplemental data.
Additional information
Funding
References
- Allen, R. L. (1988). False pyroclastic textures in altered silicic lavas, with implications for volcanic-associated mineralization. Economic Geology, 83(7), 1424–1446. https://doi.org/10.2113/gsecongeo.83.7.1424
- Allen, R. L., Lundstrom, I., Ripa, M., & Christofferson, H. (1996). Facies analysis of a 1.9 Ga, continental margin, back-arc, felsic caldera province with diverse Zn–Pb–Ag–(Cu–Au) sulfide and Fe oxide deposits, Bergslagen region, Sweden. Economic Geology, 91(6), 979–1008. https://doi.org/10.2113/gsecongeo.91.6.979
- Allen, S. R., Hayward, B. W., & Mathews, E. (2007). A facies model for a submarine volcaniclastic apron: The Miocene Manukau Subgroup, New Zealand. Geological Society of America Bulletin, 119(5-6), 725–742. https://doi.org/10.1130/B26066.1
- Barker, A., Milojkovic, T., Fredericksen, D., Reid, B., & Biggam, J. (2019). Cowal—11 MOz and growing. AIG Bulletin, Discoveries in the Tasmanides, 69, 19. https://www.aig.org.au/wp-content/uploads/2019/10/Barker_Cowal.pdf
- Barron, L. M. (1999). Metamorphism. In N. S. Meakin & E. J. Morgan (Eds.), Dubbo 1:250 000 Geological Sheet SI/55—4 (2nd ed., pp. 393–395). Geological Survey of New South Wales.
- Bellefleur, G., Malinowski, M., & Urosevic, M. (2019). Editorial for special issue “Seismic methods in mineral exploration”. Minerals, 9(10), 630. https://doi.org/10.3390/min9100630
- Berkman, D. A. (2001). Field geologists’ manual (Fourth Edition). The Australasian Institute of Mining and Metallurgy, Monograph 9.
- Blackwell, J. L., Cooke, D. R., McPhie, J., & Simpson, K. A. (2014). Lithofacies associations and evolution of the volcanic host succession to the Minifie Ore Zone: Ladolam Gold Deposit, Lihir Island, Papua New Guinea. Economic Geology, 109(4), 1137–1160. https://doi.org/10.2113/econgeo.109.4.1137
- Boger, S. D., & Miller, J. M. (2004). Terminal suturing of Gondwana and the onset of the Ross–Delamerian Orogeny: The cause and effect of an Early Cambrian reconfiguration of plate motions. Earth and Planetary Science Letters, 219(1-2), 35–48. https://doi.org/10.1016/S0012-821X(03)00692-7
- Branney, M. J., & Kokelaar, B. P. (2002). Pyroclastic density currents and the sedimentation of ignimbrites. Geological Society of London, Memoir 27.
- Campbell, I. H., & Hill, R. I. (1988). A two-stage model for the formation of the granite-greenstone terrains of the Kalgoorlie-Norseman area, Western Australia. Earth and Planetary Science Letters, 90(1), 11–25. https://doi.org/10.1016/0012-821X(88)90107-0
- Cannell, J. (2003). Lithological units of the E42 deposit, description, classification and depositional setting [Unpublished internal report]. Barrick Gold of Australia.
- Carey, S. N., & Schneider, J-L. (2011). Chapter 7—Volcaniclastic processes and deposits in the deep-sea. In H. HüNeke & T. Mulder (Eds.), Developments in sedimentology (Vol. 63, pp. 457–515). Elsevier. https://doi.org/10.1016/B978-0-444-53000-4.00007-X
- Cas, R. (1983). A review of the palaeogeographic and tectonic development of the palaeozoic Lachlan Fold Belt of southeastern Australia. Geological Society of Australia. Special Publication 10.
- Cas, R., Giordano, G., Balsamo, F., Esposito, A., & Mastro, S. L. (2011). Hydrothermal breccia textures and processes: Lisca Bianca Islet, Panarea Volcano, Aeolian Islands, Italy. Economic Geology, 106(3), 437–450. https://doi.org/10.2113/econgeo.106.3.437
- Cas, R. A. F., Porritt, L., Pittari, A., & Hayman, P. C. (2009). A practical guide to terminology for kimberlite facies: A systematic progression from descriptive to genetic, including a pocket guide. Lithos, 112, 183–190. https://doi.org/10.1016/j.lithos.2009.03.051
- Cas, R. A. F., Powell, C. M., & Crook, K. A. W. (1980). Ordovician palaeogeography of the Lachlan Fold Belt: A modern analogue and tectonic constraints. Journal of the Geological Society of Australia, 27(1-2), 19–31. https://doi.org/10.1080/00167618008729115
- Cas, R. A. F., & Wright, J. V. (1987). Volcanic successions modern and ancient: A geological approach to processes, products and successions. Allen & Unwin.
- Catuneanu, O. (2020). Chapter 23—Sequence stratigraphy. In N. Scarselli, J. Adam, D. Chiarella, D. G. Roberts, & A. W. Bally (Eds.), Regional geology and tectonics (2nd ed., pp. 605–686). Elsevier. https://doi.org/10.1016/B978-0-444-64134-2.00021-3
- Chattopadhyay, A., Plantinga, S., & Vegter, G. (2012). Certified meshing of radial basis function based isosurfaces. The Visual Computer, 28(5), 445–462. https://doi.org/10.1007/s00371-011-0627-2
- Collins, W. J. (2002). Nature of extensional accretionary orogens. Tectonics, 21(4), 6-1–6-12. https://doi.org/10.1029/2000TC001272
- Cooke, D. R., Wilson, A. J., House, M. J., Wolfe, R. C., Walshe, J. L., Lickfold, V., & Crawford, A. J. (2007). Alkalic porphyry Au–Cu and associated mineral deposits of the Ordovician to Early Silurian Macquarie Arc, New South Wales. Australian Journal of Earth Sciences, 54(2-3), 445–463. https://doi.org/10.1080/08120090601146771
- Crawford, A. J., Meffre, S., Squire, R. J., Barron, L. M., & Falloon, T. J. (2007). Middle and Late Ordovician magmatic evolution of the Macquarie Arc, Lachlan Orogen, New South Wales. Australian Journal of Earth Sciences, 54(2-3), 181–214. https://doi.org/10.1080/08120090701227471
- DeWolfe, Y. M., & Pittman, N. (2018). Subaqueous strombolian eruptions, and eruption-fed pyroclastic deposits in a Paleoproterozoic rifted-arc: Hidden formation, Flin Flon, Canada. Precambrian Research, 316, 48–65. https://doi.org/10.1016/j.precamres.2018.07.010
- Donaire, T., Pascual, E., Sáez, R., & Toscano, M. (2020). Facies architecture and palaeoenvironmental constraints of subaqueous felsic volcanism in the Iberian Pyrite Belt: The Paymogo Volcano-Sedimentary Alignment. Journal of Volcanology and Geothermal Research, 405, 107045. https://doi.org/10.1016/j.jvolgeores.2020.107045
- Doyle, M. G., & Allen, R. (2003). Subsea-floor replacement in volcanic-hosted massive sulfide deposits. Ore Geology Reviews, 23(3-4), 183–222. https://doi.org/10.1016/S0169-1368(03)00035-0
- Emery, D., & Myers, K. (2009). Sequence stratigraphy. John Wiley & Sons.
- Evolution Mining Ltd. (2024, February 14). Annual Mineral Resources and Ore Reserves Statement as at 31 December 2023. https://evolutionmining.com.au/wp-content/uploads/2024/02/2680687-Annual-Mineral-Resources-and-Ore-Reserves-Statement.pdf
- Fergusson, C. L. (2010). Plate-driven extension and convergence along the East Gondwana active margin: Late Silurian–Middle Devonian tectonics of the Lachlan Fold Belt, southeastern Australia. Australian Journal of Earth Sciences, 57(5), 627–649. https://doi.org/10.1080/08120099.2010.494767
- Fergusson, C. L. (2017). Mid to late Paleozoic shortening pulses in the Lachlan Orogen, southeastern Australia: A review. Australian Journal of Earth Sciences, 64(1), 1–39. https://doi.org/10.1080/08120099.2017.1273257
- Fergusson, C. L., & Coney, P. J. (1992). Implications of a Bengal Fan-type deposit in the Paleozoic Lachlan fold belt of southeastern Australia. Geology, 20(11), 1047–1049. https://doi.org/10.1130/0091-7613(1992)020<1047:IOABFT>2.3.CO;2
- Foster, D. A., & Gray, D. R. (2000). Evolution and structure of the Lachlan fold belt (orogen) of eastern Australia. Annual Review of Earth and Planetary Sciences, 28(1), 47–80. https://doi.org/10.1146/annurev.earth.28.1.47
- Foster, D. A., Gray, D. R., & Bucher, M. (1999). Chronology of deformation within the turbidite-dominated, Lachlan orogen: Implications for the tectonic evolution of eastern Australia and Gondwana. Tectonics, 18(3), 452–485. https://doi.org/10.1029/1998TC900031
- Gamberi, F. (2001). Volcanic facies associations in a modern volcaniclastic apron (Lipari and Vulcano offshore, Aeolian Island Arc). Bulletin of Volcanology, 63(4), 264–273. https://doi.org/10.1007/s004450100143
- Gemmel, B. (2008). Report on the Decoy Prospect, Lake Cowal Region, NSW for Barrick Australia [Internal unpublished Consultant Report]. Barrick Australia.
- Gifkins, C. C., Herrmann, W., & Large, R. R. (2005). Altered volcanic rocks: A guide to description and interpretation. University of Tasmania. https://figshare.utas.edu.au/articles/book/Altered_volcanic_rocks_a_guide_to_description_and_interpretation/23248787/1
- Glen, R. A. (2005). The Tasmanides of eastern Australia. In A. P. M. Vaughan, P. T. Leat, & R. J. Pankhurst (Eds.), Terrane processes at the margins of Gondwana (pp. 23–96). Geological Society, London, Special Publications 246. https://doi.org/10.1144/GSL.SP.2005.246.01.02
- Glen, R. A. (2013). Refining accretionary orogen models for the Tasmanides of eastern Australia. Australian Journal of Earth Sciences, 60(3), 315–370. https://doi.org/10.1080/08120099.2013.772537
- Glen, R. A., Korsch, R. J., Direen, N. G., Jones, L. E. A., Johnstone, D. W., Lawrie, K. C., Finlayson, D. M., & Shaw, R. D. (2002). Crustal structure of the Ordovician Macquarie Arc, Eastern Lachlan Orogen, based on seismic-reflection profiling. Australian Journal of Earth Sciences, 49(2), 323–348. https://doi.org/10.1046/j.1440-0952.2002.00925.x
- Glen, R. A., Meffre, S., & Scott, R. J. (2007). Benambran Orogeny in the Eastern Lachlan Orogen, Australia. Australian Journal of Earth Sciences, 54(2-3), 385–415. https://doi.org/10.1080/08120090601147019
- Glen, R. A., Saeed, A., Quinn, C. D., & Griffin, W. L. (2011). U–Pb and Hf isotope data from zircons in the Macquarie Arc, Lachlan Orogen: Implications for arc evolution and Ordovician palaeogeography along part of the east Gondwana margin. Gondwana Research, 19(3), 670–685. https://doi.org/10.1016/j.gr.2010.11.011
- Glen, R. A., Spencer, R., Willmore, A., David, V., & Scott, R. J. (2007). Junee–Narromine Volcanic Belt, Macquarie Arc, Lachlan Orogen, New South Wales: Components and structure. Australian Journal of Earth Sciences, 54(2-3), 215–241. https://doi.org/10.1080/08120090601146805
- Gray, D. R., & Gregory, R. T. (2003). Fault geometry as evidence for inversion of a former rift basin in the Eastern Lachlan Orogen. Australian Journal of Earth Sciences, 50(4), 513–523. https://doi.org/10.1046/j.1440-0952.2003.01008.x
- Harris, A. C., Bryan, S. E., & Holcombe, R. J. (2006). Volcanic setting of the Bajo de la Alumbrera Porphyry Cu–Au Deposit, Farallón Negro Volcanics, northwest Argentina. Economic Geology, 101(1), 71–94. https://doi.org/10.2113/gsecongeo.101.1.71
- Harris, A. C., Percival, I. G., Cooke, D. R., Tosdal, R. M., Fox, N., Allen, C. M., Tedder, I., McMillan, C., Dunham, P., & Collett, D. (2014). Marine volcanosedimentary basins hosting porphyry Au–Cu deposits, Cadia Valley, New South Wales, Australia. Economic Geology, 109(4), 1117–1135. https://doi.org/10.2113/econgeo.109.4.1117
- Henry, A., McInnes, P., & Tosdal, R. M. (2014). Structural evolution of auriferous veins at the Endeavour 42 gold deposit, Cowal mining district, NSW, Australia. Economic Geology, 109(4), 1051–1077. https://doi.org/10.2113/econgeo.109.4.1051
- Houghton, B. F., & Wilson, C. J. N. (1989). A vesicularity index for pyroclastic deposits. Bulletin of Volcanology, 51(6), 451–462. https://doi.org/10.1007/BF01078811
- Jones, G. J. (1985). The Goonumbla porphyry copper deposits, New South Wales. Economic Geology, 80(3), 591–613. https://doi.org/10.2113/gsecongeo.80.3.591
- Kemp, A. I. S., Blevin, P. L., & Norman, M. D. (2020). A SIMS U–Pb (zircon) and Re–Os (molybdenite) isotope study of the early Paleozoic Macquarie Arc, southeastern Australia: Implications for the tectono-magmatic evolution of the paleo-Pacific Gondwana margin. Gondwana Research, 82, 73–96. https://doi.org/10.1016/j.gr.2019.12.015
- Kokelaar, P., & Romagnoli, C. (1995). Sector collapse, sedimentation and clast population evolution at an active island-arc volcano: Stromboli, Italy. Bulletin of Volcanology, 57(4), 240–262. https://doi.org/10.1007/BF00265424
- Lyons, P., Raymond, O. L., & Duggan, M. B. (2000). Forbes 1: 250 000 geological sheet SI55-7, explanatory notes. Australian Geological Survey Organisation Record, 20.
- Malehmir, A., Maries, G., Bäckström, E., Schön, M., & Marsden, P. (2017). Developing cost-effective seismic mineral exploration methods using a landstreamer and a drophammer. Scientific Reports, 7(1), 10325. https://doi.org/10.1038/s41598-017-10451-6
- Manville, V., Segschneider, B., & White, J. D. L. (2002). Hydrodynamic behaviour of Taupo 1800a pumice: Implications for the sedimentology of remobilized pyroclasts. Sedimentology, 49(5), 955–976. https://doi.org/10.1046/j.1365-3091.2002.00485.x
- Martí, J., Groppelli, G., & Brum da Silveira, A. (2018). Volcanic stratigraphy: A review. Journal of Volcanology and Geothermal Research, 357, 68–91. https://doi.org/10.1016/j.jvolgeores.2018.04.006
- McInnes, P. (2015). Cowal Gold Project. The geology and mineralisation of the Cowal Igneous Complex [Unpublished internal report]. Barrick Gold of Australia.
- McPhie, J., Doyle, M., & Allen, R. (1993). Volcanic textures; a guide to the interpretation of textures in volcanic rocks. University of Tasmania, Centre for Ore Deposit and Exploration Studies.
- Miall, A. D. (2022). Facies analysis. In A. D. Miall (Ed.), Stratigraphy: A modern synthesis (pp. 91–174). Springer International Publishing. https://doi.org/10.1007/978-3-030-87536-7_3
- Miles, I. N., & Brooker, M. R. (1998). Endeavour 42 deposit, Lake Cowal, New South Wales: A structurally controlled gold deposit. Australian Journal of Earth Sciences, 45(6), 837–847. https://doi.org/10.1080/08120099808728439
- Németh, K., & Palmer, J. (2019). Geological mapping of volcanic terrains: Discussion on concepts, facies models, scales, and resolutions from New Zealand perspective. Journal of Volcanology and Geothermal Research, 385, 27–45. https://doi.org/10.1016/j.jvolgeores.2018.11.028
- Orth, K., VandenBerg, A. H. M., King, R. L., Nott, R. J., & Tickell, S. J. (1993). Murrindal 1: 100 000 geological map. Geological Survey of Victoria.
- Orth, K., VandenBerg, A. H. M., Nott, R. J., & Simons, B. A. (1995). Murrindal 1: 100 000 map geological report. Geological Survey of Victoria Report, 100.
- Oversby, B. (1971). Palaeozoic plate tectonics in the southern Tasman Geosyncline. Nature Physical Science, 234(46), 45–47. https://doi.org/10.1038/physci234045a0
- Packham, G. H. (1973). A speculative Phanerozoic history of the south-west Pacific. In P. J. Coleman (Ed.), The Western Pacific: Island arcs, marginal seas, geochemistry (pp. 369–388). University of Western Australia Press.
- Pemberton, J. W., & Offler, R. (1985). Significance of clinopyroxene compositions from the Cudgegong Volcanics and Toolamanang Volcanics: Cudgegong-Mudgee district, NSW, Australia. Mineralogical Magazine, 49(353), 591–599. https://doi.org/10.1180/minmag.1985.049.353.14
- Percival, I. G., & Glen, R. A. (2007). Ordovician to earliest Silurian history of the Macquarie Arc, Lachlan Orogen, New South Wales. Australian Journal of Earth Sciences, 54(2-3), 143–165. https://doi.org/10.1080/08120090601146789
- Plantinga, S., & Vegter, G. (2007). Isotopic meshing of implicit surfaces. The Visual Computer, 23(1), 45–58. https://doi.org/10.1007/s00371-006-0083-6
- Quinn, C. D., Percival, I., Glen, R. A., & Xiao, W. (2014). Ordovician marginal basin evolution near the palaeo-Pacific east Gondwana margin, Australia. Journal of the Geological Society, 171(5), 723–736. https://doi.org/10.1144/jgs2012-034
- Radford, D. (2020, December). Updated map and stratigraphy of the Cowal Igneous Complex [Internal Unpublished Presentation]. Evolution Mining Ltd.
- Ramalho, R. S., Quartau, R., Trenhaile, A. S., Mitchell, N. C., Woodroffe, C. D., & Ávila, S. P. (2013). Coastal evolution on volcanic oceanic islands: A complex interplay between volcanism, erosion, sedimentation, sea-level change and biogenic production. Earth-Science Reviews, 127, 140–170. https://doi.org/10.1016/j.earscirev.2013.10.007
- Raymond, O. L., Sherwin, L., Wallace, D. A., Wyborn, D., Young, G. C., Percival, I. G., & Glen, R. A. (2000). Parkes 1st edition (1: 100 000 Geological Map 8531). Australian Geological Survey Organisation; New South Wales Department of Mineral Resources.
- Rush, J. A. (2013). Geology of the Marsden Cu–Au Porphyry, NSW [Unpublished BSc Honours thesis]. University of Tasmania.
- Scheibner, E. (1973). A plate tectonic model of the Palaeozoic tectonic history of New South Wales. Journal of the Geological Society of Australia, 20(4), 405–426. https://doi.org/10.1080/00167617308728826
- Scheibner, E. (1987). Paleozoic tectonic development of eastern Australia in relation to the Pacific region. In J. W. H. Monger & J. Francheteau (Eds.), Circum‐Pacific orogenic belts and evolution of the Pacific Ocean Basin. Geodynamic Series 18. (pp. 133–165). American Geophysical Union.
- Schetselaar, E. M. (2013). Mapping the 3D lithofacies architecture of a VMS ore system on a curvilinear-faulted grid: A case study from the Flin Flon mining camp, Canada. Ore Geology Reviews, 53, 261–275. https://doi.org/10.1016/j.oregeorev.2013.01.012
- Sealey, C. (2012). The “Decoy” Cu–Au volcanic-hosted massive sulphide deposit (Lake Cowal, Australia): Lithogeochemical characteristics and criteria for the recognition of mineralised horizons [Unpublished BSc Honours thesis]. University of Sydney.
- Simpson, C. J., Cas, R. A. F., & Arundell, M. C. (2005). Volcanic evolution of a long-lived Ordovician island-arc province in the Parkes region of the Lachlan Fold Belt, southeastern Australia. Australian Journal of Earth Sciences, 52(6), 863–886. https://doi.org/10.1080/08120090500304273
- Simpson, K., & Cooke, D. R. (2006). Volcanic facies architecture of the E46 prospect, Lake Cowal, NSW. Shallow- and deep level alkalic mineral deposits: Developing an integrated exploration model. Sponsors meeting [Unpublished Meeting Notes]. University of Tasmania.
- Squire, R. J., & McPhie, J. (2007). Complex volcanic facies architecture of the Forest Reefs Volcanics near Cadia, New South Wales, associated with prolonged arc-related volcanism. Australian Journal of Earth Sciences, 54(2-3), 273–292. https://doi.org/10.1080/08120090601146995
- Strickland, T. (2005). The geology of the E42 breccia complex, Cowal Au deposit, NSW, Australia [Unpublished BSc Honours thesis]. University of Tasmania.
- VandenBerg, A. H. M., & Stewart, I. R. (1992). Ordovician terranes of the southeastern Lachlan Fold Belt: Stratigraphy, structure and palaeogeographic reconstruction. Tectonophysics, 214(1-4), 159–176. https://doi.org/10.1016/0040-1951(92)90195-C
- White, M. J., & McPhie, J. (1996). Stratigraphy and palaeovolcanology of the Cambrian Tyndall group, Mt Read Volcanics, western Tasmania. Australian Journal of Earth Sciences, 43(2), 147–159. https://doi.org/10.1080/08120099608728244
- Willman, C. E., VandenBerg, A. H. M., & Morand, V. J. (2002). Evolution of the southeastern Lachlan fold belt in Victoria. Australian Journal of Earth Sciences, 49(2), 271–289. https://doi.org/10.1046/j.1440-0952.2002.00914.x
- Wyborn, D. (1992). The tectonic significance of Ordovician magmatism in the eastern Lachlan Fold Belt. Tectonophysics, 214(1-4), 177–192. https://doi.org/10.1016/0040-1951(92)90196-D
- Wyborn, L. A. I. (1977). Aspects of the geology of the Snowy Mountains region and their implications for the tectonic evolution of the Lachlan Fold Belt [Unpublished PhD thesis]. The Australian National University.
- Yamada, R., & Yoshida, T. (2004). Volcanic sequences related to Kuroko mineralization in the Hokuroku district, northeast Japan. Resource Geology, 54(4), 399–412. https://doi.org/10.1111/j.1751-3928.2004.tb00216.x
- Zhang, Q., Buckman, S., Bennett, V. C., & Nutman, A. (2019). Inception and early evolution of the Ordovician Macquarie Arc of Eastern Gondwana margin: Zircon U-Pb-Hf evidence from the Molong Volcanic Belt, Lachlan Orogen. Lithos, 326-327, 513–528. https://doi.org/10.1016/j.lithos.2019.01.008
- Zukowski, W. (2010). Geology and mineralisation of the Endeavour 41 gold deposit, Cowal district, NSW, Australia [Unpublished PhD thesis]. University of Tasmania.
- Zukowski, W., Cooke, D. R., Deyell, C. L., McInnes, P., & Simpson, K. (2014). Genesis and exploration implications of epithermal gold mineralization and porphyry-style alteration at the Endeavour 41 Prospect, Cowal District, New South Wales, Australia. Economic Geology, 109(4), 1079–1115. https://doi.org/10.2113/econgeo.109.4.1079
Appendix
—Definitions
Some terms may have different meanings in other contexts and are stated here for clarity. Implicit modelling software (e.g. Leapfrog) was preferred for the speed of modelling, but ‘industry software’ is stated below, as we believe this methodology can be applied across all software packages.
3D modelling: the process of using software to delineate 3D planes and volumes for geological features such as (but not limited to) lithologies, facies and faults, which this paper focusses on. The term is inclusive of both implicit and explicit modelling software when using this term (see Isosurfaces).
Base layer: a method in which industry software is used to make cross-sections of the preliminary model. This cross-section is imported into graphics editing software as a base layer, upon which other layers can be overlain (e.g. superimposing the digitised graphic logging against drill traces on the cross-section).
Cross-section: a 2D plane, generally vertically oriented, showing a ‘slice’ through the Earth, used to interpret the subsurface geology and establish stratigraphic correlations.
Drill-hole database: routinely collected data associated with drill core samples such as descriptive logging, metal assays and geochemistry.
Facies: “a body or interval of rock, which has a unique definable character that distinguishes it from other facies (…). The definable character may be compositional or textural or may be based on the sedimentary structures or fossils present. A facies is the product of a unique set of conditions in the depositional environment” (Cas & Wright, Citation1987).
Fault blocks: the 3D blocks that are delineated in industry software using fault wireframes to subdivide a 3D volume. The fault blocks are a key structural component of the preliminary model.
Graphic logging: a pictorial downhole logging technique that graphically represents grainsize, components, bedding thickness and contacts to summarise sedimentary or volcanic successions.
Graphics editor: graphical software such as Inkscape and Adobe Illustrator to produce lines, shapes and colours as a scalable vector graphics (svg) file.
Isosurfaces: an output from implicit modelling software where algorithms (commonly the radial basis function—“RBF”) interpolate meshless, smooth geometric objects through scattered data (Chattopadhyay et al., Citation2012; Plantinga & Vegter, Citation2007). Some examples of data types commonly used for isosurfaces include 3D point clouds from LIDAR surveys, bedding measurements and geochemical assays. This differs significantly from traditional cross-section-based workflows where polylines are digitised from cross-sections, and ‘tie-lines’ are used to link polylines between cross-section planes to produce 3D geometries.
Logging: or ‘company logging’, referring to rock description and recording of associated data generated during routine data collection in exploration and mining environments.
Preliminary model: the fault blocks, isosurfaces, wireframes and datasets that are collated into a 3D model for the purpose of plotting onto cross-sections to apply the technique in this paper.
Pseudo-breccia: an apparent clastic texture induced by later processes such as hydraulic fracturing, hydrothermal alteration or metamorphism, where a rock that is coherent appears to be a primary volcanic breccia.
Pseudo-coherent: an apparent coherent texture where clast outlines are masked by hydrothermal alteration, and a rock that is clastic appears to be coherent.
Serial cross-sections: a set of cross-sections through the Earth, generally established with consistent paper sizes, scales, viewing orientations and spacing between cross-sections. Serial cross-sections were traditionally the base layers upon which interpretations were drawn with polylines digitised for section based wireframing (explicit modelling method).
Source data: in this paper, the various datasets, both in industry and from government geology surveys, that are collated for the purpose of establishing preliminary models for testing on cross-sections.
Wireframe: a 3D volume or plane generated in industry software that in the context of this paper would represent 3D lithological or facies domains. Although modelled faults are generally planes, and not 3D volumes, this term is also applied to ‘fault wireframes’.