
 ?Mathematical formulae have been encoded as MathML and are displayed in this HTML version using MathJax in order to improve their display. Uncheck the box to turn MathJax off. This feature requires Javascript. Click on a formula to zoom.
ABSTRACT
Malaria fever is a potentially fatal disease caused by the Plasmodium parasite. Identifying Plasmodium parasites in blood smear images can help diagnose malaria fever rapidly and precisely. According to the World Health Organization (WHO), there were 241 million malaria cases and 627 000 deaths worldwide in 2020, while 95% of malaria cases and 96% of malaria deaths occurred in Africa. Also in Africa, children that are less than five years old accounted for an estimated 80% of all malaria deaths. To address the menace of malaria, this paper proposes a novel deep learning model, called a data augmentation convolutional neural network (DACNN), trained by reinforcement learning to tackle this problem. The performance of the proposed DACNN model is compared with CNN and directed acyclic graph convolutional neural network (DAGCNN) models. Results show that DACNN outperforms previous studies in processing and classification images. It achieved 94.79% classification accuracy in malaria blood sample images of balanced class dataset obtained from the Kaggle dataset. The proposed model can serve as an effective tool for the detection of malaria parasites in blood smear images.
Introduction
Malaria is an endemic infection that has affected over 228 million people worldwide. In 2018, 405,000 people died in 106 countries and territories (World Health Organization Citation2020). Malaria in Nigeria is a major health problem, accounting for more cases and deaths than any other nation in the world. Malaria posed a threat to about 97% of the population of Nigeria because of location. Only about 3% of the Nigerian population is accounted as malaria-free zone and this small percentage protects the remaining 3% of the population (Okeke Citation2012). There are more than 100 million malaria cases in Nigeria alone with more than 300,000 deaths per year, which is even higher compared to 215,000 HIV/AIDS fatalities per year in Nigeria. Malaria also accounts for around 11% of maternal deaths (National Population Commission Citation2019).
Malaria parasites are transmitted to people through infected female Anopheles mosquitoes called malaria vectors (Poostchi et al. Citation2018). Five different kinds of parasites cause malaria in humans, namely Plasmodium falciparum, Plasmodium vivax, Plasmodium knowlesi, Plasmodium ovale, and Plasmodium malariae. Several approaches have been proposed to address the problem of detecting malaria parasites in blood samples (Bibin et al. Citation2017; Rajaraman, Jaeger, and Antani Citation2019; Yadav and Jadhav Citation2019).
Before the adoption of deep learning models for the classification of blood sample images, some of the approaches that have been used to solve this problem include manual blood sample inspection to discover the existence of parasites in the blood sample image (Roy et al. Citation2018). The effectiveness of the analysis depends on the skill of the human expert and is subject to human error. The manual examination is labor intensive, as medical personnel must examine thousands of cells at higher magnification (Centers for Disease Control and Prevention Citation2020). The downside of this approach, apart from the one mentioned before, is that it is inefficient, slow, and strenuous.
To overcome the challenges associated with the manual examination, the polymerase chain reaction (PCR) and rapid diagnostic test (RDT) were developed for a rapid diagnosis of malaria patients (Shah et al. Citation2020). These techniques are very fast, but they are characterized by low accuracy. In addition, these methods require skilled and experienced operators. The time taken to screen blood samples is drastically reduced by computerizing the process. Therefore, the dependability of the diagnosis process is greatly improved. These methods have exhibited considerable efficiency in handling these problems. However, they have not succeeded in efficiently handling the issue of low accuracy in the detection of malaria parasites in blood sample images.
Recently, deep learning techniques have proven to be the most effective approach in medical diagnostics. They have been used to detect a wide variety of diseases from biomedical images such as breast cancer (Irfan et al. Citation2021), COVID-19 (Khan et al. Citation2021), retinal hemorrhages (Maqsood, Damaševičius, and Maskeliūnas Citation2021), and Alzheimer’s disease (Odusami et al. Citation2021). Deep learning methods can be used to classify image blood samples into infected and uninfected data sets (Fuhad et al. Citation2020; Gunčar et al. Citation2018) and to segment leucocytes from blood smear images (Kadry et al. Citation2021). This is carried out by providing a deep learning model with a dataset of image blood samples as input. At this stage, the input data set is divided into training and testing sets. The deep learning algorithm is then used to train the training dataset and a trained model is created that will be used by the deep learning model for further processing. The patterns existing in the input data set are used to build the training model. In the successive stage, the test data set is arbitrarily given to the classifier and then compared with the trained model which generates the result in the form of image blood samples classification result.
Conventional methods of malaria parasite detection and classification are characterized by low precision and time wastage (Tangpukdee et al. Citation2009). Therefore, deep learning models such as AlexNet (Krizhevsky, Sutskever, and Hinton Citation2012), GoogLeNet (Szegedy et al. Citation2015), VGGNet (Simonyan and Zisserman Citation2014), ResNet (He et al. Citation2016) and DenseNet (Huang et al. Citation2018) were proposed to solve these problems. These techniques are very efficient in detecting malaria parasites in blood samples. Deep learning algorithms are often used in clinical studies because they are fast and effective computational methods (Litjens et al. Citation2017; Miotto et al. Citation2018). They also reduce the costs of health care in activities to prevent infection compared to experimental methods. Some of the areas of applications of the computational method and deep learning models in relation to health include diagnostic plans, the development of treatment protocols, the development of drugs, the follow-up of patients and care (Ahuja Citation2019).
Recently, reinforcement learning has been adopted to improve the training process of deep neural networks (Alom et al. Citation2019; Hernandez-Leal, Kartal, and Taylor Citation2019; Wang et al. Citation2020). It has also been used for the classification of biomedical images (Mahmud et al. Citation2018). For example, reinforcement learning was used in segmenting transrectal ultrasound images to assess the location and volume of the prostate (Sahba, Tizhoosh, and Salama Citation2008). Zhang et al. (Zhang et al. Citation2019) proposed a reinforcement sampling strategy to address the problem of unbalanced data in the breast tumor image dataset. Tian et al. (Citation2020) describe the image segmentation process as a Markov decision process. Then an agent is trained using a deep reinforcement learning (DRL) algorithm to perform segmentation of regions of interest in medical images.
The main novelty and contribution of this work is the fusion of directed acyclic graph and data enhancement with a convolutional neural network (CNN) to enhance the performance of malaria parasite detection in blood smear images. Reinforcement learning is adopted to obtain superior malaria parasite blood sample detection and classification results.
The contributions of the paper are outlined below:
The method of detecting and diagnosing malaria using time saving and effective deep learning technique was developed in this paper,
A novel deep learning model, known as data augmentation convolutional neural network (DACNN) which is a the combination of directed acyclic graph and data enhancement with a convolutional neural network (CNN) with enhanced accuracy was proposed,
Reinforcement learning was applied to train DACNN to obtain better detection and classification accuracy of about 94.79%,
The application of DACNN rather than using traditional classifier such as Random Forest to take advantage of the ability of the classifier to operate directly on blood smear images was accomplished,
The rest of this paper is organized as follows: Section 2 discusses related works in the field of cassava mosaic disease detection. The proposed methodology used in this work is explained in Section 3. The results and the discussion of the results are presented in Section 4 and Section 5 is the conclusion of the paper.
Related Works
In this section, we briefly discuss recent researches conducted in the field of malaria disease detection. Machine learning and deep learning algorithms have gained wide acceptance among researchers and academicians for detecting malaria in blood smear images. This can be attributed to the efficacy of these algorithms in solving the problems associated with the detection and classification of malaria. During the past decade, a wide range of deep learning models has been used in clinical study and healthcare. In one of the studies, the Deep Belief Network (DBN) was proposed in Bibin, Nair, and Punitha (Citation2017) to detect malaria parasites on blood images. The proposed method contains stack Boltzmann machines that use the contrastive divergence strategy to classify blood image samples as either parasite or nonparasite. The performance of the proposed system is satisfactory. However, there is still room for further improvement as the image dataset used for the experiment is small, and therefore it cannot be ascertained if their technique can effectively handle a large dataset.
Rajaraman, Jaeger, and Antani (Citation2019) investigated the performance of CNNs in detecting malaria parasites in blood samples. The main intention of the authors is to design an ensemble CNN model that have a superior performance compared to other state-of-the-art models in terms of robustness and accuracy. The proposed system classifies blood samples as parasitized or normal. The experimental results indicated that the ensemble of VGG-19 and SqueezeNet outperformed the other ensemble models used for the study.
Qanbar et al. (Citation2019) applied a Residual Attention Network (RAN) to assist in the analysis and decision making system for classifying blood samples as infected or non-infected. The result showed that the RAN model achieves a good prediction performance in the processing and classification of image blood samples compared to other types of algorithms. RAN achieved a 95.79% accuracy rate compared to an 83.30% accuracy rate obtained using the support vector machine (SVM).
Chaya and Usha (Citation2019) proposed three techniques which are: the Cuckoo Search-Based Ensemble Classifier (CSEC), Scale to Estimate Premature Malaria Parasites Scope (SEMP), and Hybrid Classification of Malaria Blood Smear Images. The experimental result indicated that CSEC performs better than the hybrid classifier method in terms of accuracy. The strength of their approach is that it employed a metaheuristic optimization algorithm instead of machine learning. The shortcoming of the method is that metaheuristics do not guarantee that a globally optimal solution can be found in some classes of problems (Torres-Jimenez and Pavon Citation2014).
Kumari, Singh, and Kumar (Citation2019) applied feature selection technique with Logistic Regression, Naive Bayes, KNN, Decision Trees, Random Forest Classifier, Support Vector Machine (SVM) and Artificial Neural Network (ANN) machine learning models to predict liver disease from UCI dataset. Simulation results show that rightly choosing feature extraction method for each model is very important in getting good results. The combination of feature selection and machine learning models produce enhanced accuracy of up to 92%. This is an improvement compared to when machine learning classifiers alone were used. The downside of their work is that accuracy is the only performance metric used for evaluating the effectiveness of the proposed model. Moreover, the only liver disease dataset used in the work was the one obtained from UCI. Furthermore, the size of the dataset is small, and therefore is not sufficient to prove the efficacy of the technique presented by the authors.
Negi, Kumar, and Chauhan (Citation2021) proposed deep CNN model to identification and recognition of plant diseases. Experimental results indicated that the proposed technique attained an accuracy of 96.02% which is very good. However, the authors did not use many of the state-of-the-art performance measures to evaluate the performance of the proposed system. Oyewola et al. (Citation2021) presented a unique deep residual convolution neural network (DRNN) for detection of Cassava Mosaic Disease in cassava leaf images. The proposed method can counterbalance the imbalanced image dataset of cassava diseases, and enhance the number of images accessible for training and testing by using different block processing. Furthermore, Gamma correction and decorrelation stretching was used to improve color separation in images with high band-to-band correlation. The results of the simulations show that employing a balanced dataset of images improves classification accuracy. The proposed DRNN model outperforms the simple convolutional neural network (PCNN) by producing balanced accuracy of 94–99% with a considerable margin of 9.25% on Kaggle cassava disease dataset which comprises of 5,656 images. One limitations of this work is that every deep learning based techniques are inclined to overfit the training dataset, which hinders them from generalizing. Moreover, image enhancement using gamma correction is not likely the most ideal technique in case of hostile photographing situations.
Alok, Krishan, and Chauhan (Citation2021) proposed deep learning technique for detecting malaria. The authors used a malaria dataset that contains 27587 images which was divided into training set (23448 images) and validation set (4139 images) for their experiments. The proposed method achieved 95.70% accuracy in detecting and classifying malaria cells. Also, the method proposed in the paper attained precision, recall, and f1-score of 0.96.
Negi and Kumar (Citation2021) proposed deep learning method for the detection and classification of citrus diseases to assist crop productivity. The dataset includes 759 images of both Citrus fruits and collectively leaves safe and unhealthy images. The proposed method was able to recognize and classify the diseases satisfactorily especially in the first stage. A precision of 97.65%, Recall of 91.21%, and f1-Score of 94.32% was attained for first phase. For the second phase of the proposed method, a training accuracy of 65.94% and validation accuracy of 62.50% was recorded. One of the limitations of the work is that the combined average classification accuracy of the two stages is still relatively low. Moreover, the dataset used for the work is not balanced. Also, the dataset used for the experiments is small in size.
presents a summary of all related works considered in this paper.
Table 1. Summary of all the related works with other algorithms and contributions.
Methodology
Convolutional Neural Networks (CNN)
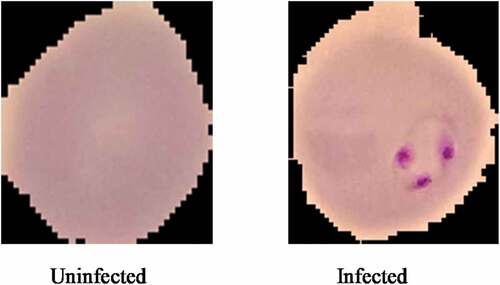
Presented in is the random display of training images for both Uninfected and Infected Malaria blood samples. The CNN model mainly consists of three types of layers: convolution, pooling, and fully connected layers. The primary layers are, convolution and pooling layers which extract features while the third, a fully connected layer, map the extracted features into the final (classification or regression) output (as shown in ).
Figure 1. Images of infected and uninfected blood samples.
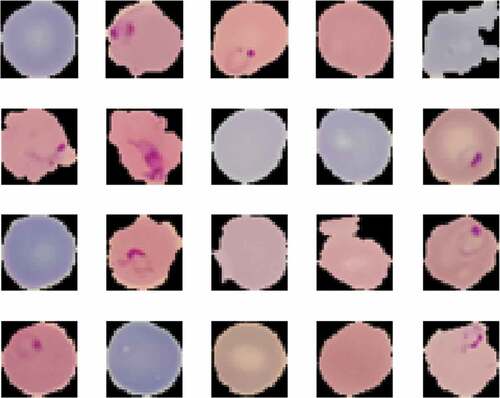
Figure 2. General architecture of convolutional neural networks.
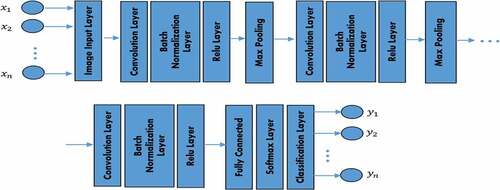
The convolutional layer serves as the feature extractor and learns the features properties of the input images. The neurons are grouped into feature (characteristics) maps in the convolutional layers. The neuron is organized into a feature map in the convolutional layers. A neuron within a feature map has a receptive field linked to a neuron region of the preceding layer, often referred to as a filter bank, and has a series of trainable weights (LeCun, Bengio, and Hinton Citation2015). The feature map can be computed as follows:
where the input image is denoted by , the convolutional filter related to the
feature map is denoted by
,
is the bias and
represents the nonlinear activation function.
A batch normalization layer as the name implies normalizes, scales, and moves mini-batch data to boost network stability from the previous layer (Bjorck et al. Citation2018). The batch normalization layer mathematical equation is given as:
where is the mean,
is the variance,
is the normalized data,
are the parameters, γ β to be learned for proper scaling and shifting the normalized data.
A rectified linear unit (ReLU) (Nair and Hinton Citation2010) represents actual neurons more complexly. It is produced through the creation of numerous sigmoid copies. This can be done under the premise that all the repeated items learn the same weights and biases. The ReLU is given as follows:
Where is given in EquationEquation (1)
(1)
(1) .
Pooling layers is another elementary unit of CNN. This layer increasingly decrease the spatial dimension of the model to lower the number of parameters and processing in the network. Pooling layers help to reduce complexity further and increase network strength. The most common form of pooling layers is Max pooling and average pooling. Note that in any of the pooling layers there is no learnable parameter, whereas filter size, stride, and padding are similar to hyper-parameters in pooling operations (Suárez-Paniagua and Segura-Bedmar Citation2018). Max pooling layer extracts patches outputs and feature maps of the input features, the maximum value for each patch, and discard all other values. To prevent overfitting, the dropout layers are used (Srivastava et al. Citation2014).
The final output layer for CNN consists of one or more fully connected layers also called dense layers, in which each input matches each learning outcome (Teuwen and Moriakov Citation2020). After extraction of features from the convolution layers and downsampling by the pooling layers, the outcome is to assign the features in a subset of the fully connected layers to each group in the classification tasks. In general, the final fully connected layer usually contains the same number of output nodes as the class number. The output layer is given as an unconstrained problem:
Where is the output layer and
is the probability of the observed data.
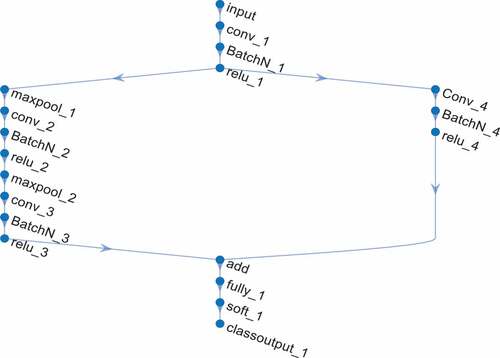
Directed Acyclic Graph Convolutional Neural Network (DAGCNN)
A directed acyclic graph (DAG) is a graph containing cycles, which is a similar node that has coordinated paths from beginning to end (Li, Li, and He Citation2019). It is a non-cycle diagram. We utilize DAGCNN in this paper by incorporating it with the CNN features due to impressive performance on both image classification and object detection (He et al. Citation2016). The coordinated paths that follow each convolution layer for classification are shown in , starting with the image input layer and ending with the classification layer. shows the DAGCNN structure with all the layers.
Figure 3. Directed acyclic graph network.
Data Augmentation of Convolutional Neural Network (DACNN)
This paper used data augmentation technique on the malaria blood sample data from infected and uninfected malaria blood samples. To the best of our knowledge this method has not been used before now for detection of malaria in blood samples. In both the training and test set of the malaria blood sample images, data augmentation was used on the dataset. The data was augmented from basic image transformation, such as rotation, translation, horizontal and vertical scale, random shear, and random reflection. The augmentations used in this study are random rotation, random translation, and horizontal and vertical scale. The images are rotated along the axis between −20° and 20° to the right or left. Rotation stability is calculated by the rotation degree parameter. Rotations between 20° and −20° help to improve the accuracy of the malaria blood sample of both infected and uninfected blood sample images utilized in this paper (Shorten and Khoshgoftaar Citation2019). Shifting images to the left, right, and down is useful to prevent positional bias in the malaria blood sample images. In this study, the images are translated between +3 and −3 pixels. The translated images of malaria blood samples are filled with a constant value which enables it to preserve the spatial dimension of images (Zheng et al. Citation2020). Horizontal and vertical scaling to the malaria blood sample dataset was also applied here. Each image is scaled randomly between 1 and 1.
Reinforcement Learning
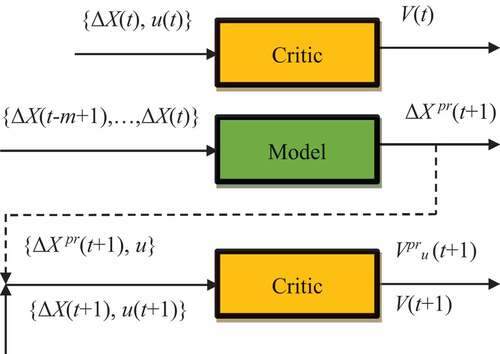
The general scheme of reinforcement learning adopted in this paper is shown in . An agent interacting with the external environment in discrete time was considered. The agent in state
performs the action
, receives reinforcement
and goes into the state
. The agent’s goal is to maximize the total reward
that can be received in the future. The
value is estimated by considering the forgetting coefficient:
Figure 4. Schematics of reinforcement learning. The critic is intended to assess the quality of situations for the current situation
.
where is the estimate of the total reward expected after time t;
is the forgetting coefficient (
), with the help of which it is considered that the further the agent “looks” into the future, the less confidence he has in assessing the reward.
An agent, which aims to maximize its performance function was considered. The agent seeks to increase his performance
by changing the value of
.
where ,
– is a parameter.
Following [4], we use the logarithmic scale . Current reinforcement
is equal to:
The agent’s control system is an adaptive critic, consisting of two neural networks: Model and Critic (see ). The adaptive critic aims to maximize . Assuming the agent’s state
depends only on two quantities
and
. The model is a two-layer neural network, the work of which is described by the formulas:
where – input vector,
– output vector of the hidden layer,
and
– weights of neurons.
The critic is intended to assess the quality of situations , i.e., to assess the utility function
for an agent in the state
. The critic is a two-layer neural network, whose work is described by the formulas:
where is the input vector,
is the vector of the outputs of the neurons of the hidden layer, and are the weights of the neurons.
For each time , the following operations are performed:
1) The critic estimates the value of for the current state
for both possible actions
, where
,
or
.
2) The ε-greedy rule is applied: the action that corresponds to the maximum value is chosen with probability
, whereas an alternative action is chosen with probability
. The choice of action is
:
, or
.
3) The selected action is executed. Reinforcement
is calculated according to EquationEquation (11)
(11)
(11) . The observed value
is compared with
. The weights of the neural network are adjusted to minimize the prediction error by backpropagation:
where – is the training speed (
).
4) The Critic network calculates . Then, the error is computed:
The value of characterizes the error in the estimate
, which is the total reward that can be obtained based on the state
. The error
is calculated considering the current award
and the estimate of the total award
.
5) Weights of the Critic neural network are adjusted to minimize the value of , this training is carried out by the stochastic gradient descend method:
where – is the training speed of the Critic (
). Presented in : Schematics of reinforcement learning.
Performance Measurements
The prediction performance of the proposed system was evaluated using three metrics: Mean Absolute Error (MAE), Root Mean Square Error (RMSE), and Mean Absolute Scaled Error (MASE), Accuracy ( Specificity (
Sensitivity (
Kappa
and detection rate
. MAE is defined as the average of the difference between predicted and actual values in the test.
RMSE is defined as the standard deviation of prediction errors in a test.
MASE is defined as a measure of the accuracy of predictions that represents it as a percentage in comparison to a standard mean error.
The classification performance measures are defined as follows:
Where is the accuracy,
is the sensitivity,
is the Kappa,
is the true positive,
is the true negative,
is the false positive,
is the detection rate,
is the false negative,
is the probability of the observed accuracy and
is the probability of expected accuracy obtained from the confusion matrix.
Results and Discussion
Datasets
Images of Malaria Cells used in this paper were obtained from the Kaggle database (Kaggle Citation2018). A balanced dataset was used for our experiments. The dataset comprises 27,558 photos of cells with equivalent instances of infected cells (13,779) and uninfected cell images (13,779) taken from the samples of blood cells using a microscope. Sample of malaria-infected and uninfected images are shown in . This dataset is then divided into sets of training (80%) and test (20%). As a result, the training dataset consists of 22,046 images while the test set consists of 5,512 images.
Figure 5. Images of uninfected and infected malaria blood samples.
Results and Discussion
Deep learning technologies such as Convolutional Neural Networks (CNN) are commonly employed in classifying images. They are designed to work with images as inputs, but they can also handle text, signals, and other continuous responses. The anatomical structure of a visual cortex, which incorporates configurations of basic and complex cells, is the inspiration for CNN. Based on the sub-regions of a visual field, these cells are discovered to activate. Receptive fields refer to these sub-regions. The neurons in a convolutional layer link to sub-regions of the layers preceding it, rather than being totally connected as in other types of neural networks, as a result of the findings of this study. Outside of these sub-regions in the image, the neurons are unresponsive. Convolutional layers, batch normalization, max-pooling layers, softmax, and fully connected layers are among the layers that make up CNN. The neurons in each layer of a CNN are organized in three dimensions, translating a three-dimensional input into a three-dimensional output. Malaria image input of the infected and uninfected in the first layer (input layer) retains the images as 3-D inputs, with the dimensions being height, width, and the color channels of the image, which were set as 32,32,1 accordingly. The neurons in the first convolutional layer link to the areas of these malaria images and turn them into a 3-D output. The hidden units (neurons) in each layer learn nonlinear combinations of the original inputs, a process known as feature extraction. These learnt characteristics, also called as activations, from one layer become the inputs for the following layer. The learnt features are used as inputs to the classifier function at the end of the network. Optimizers based on Stochastic Gradient Descent with Momentum (SGDM) were used to train the network. The size of the mini-batch is specified using the MiniBatchSize pair parameter of training Options, and MaxEpochs is set to 50 for fine-tuning and transfer learning. The second method presented in this paper is the Directed Acyclic Graph Convolutional Neural Network (DAGCNN). A DAGCNN contains layers that are organized as a directed acyclic graph and is more sophisticated than a series architecture of CNN, which has layers that have inputs from several layers and outputs to numerous layers. When used to image processing, these structures combine pixel localization information from beginning layers into final layers. The third approach is Data Augmentation Convolutional Neural Network (DACNN) with Reinforcement Learning. DACNN prevents the network from overfitting and remembering the specifics of the training images. It also aids in the improvement of CNN performance and outcomes by generating new and diverse instances for training datasets. We build an imageDataAugmenter object to specify image augmentation preparation options including scaling, rotation, translation, and reflection. Randomly translate and rotate the malaria images by up to three pixels horizontally and vertically, and by up to 20 degrees. Matlab R2018a was used to run the experiments. The machine utilized has a DELL motherboard, 4 GB of RAM, and an Intel Dual Core @ 2.20 GHz processor. The computer operating system utilized in this study was Windows 8.1.
In this paper, the performance of Convolution Neural Network (CNN), Directed Acyclic Graph Convolutional Neural Network (DAGCNN), and Data Augmentation Convolutional Neural Network (DACNN) was compared. Data augmentation is an approach that artificially builds new training data from existing training data. It can expand the size of a training dataset by generating better versions of data in the dataset. Training deep convolution neural network models using extra data can result in more effective models. Moreover, the augmentation methods can generate disparities of the images that can augment the capacity of the suitable models to hypothesize what they have learned to new images. The overall performance of CNN, DAG, and DACNN models are evaluated using eight performance measures: MAE, RMSE, Mean Absolute Scaled Error MASE, Sensitivity, Detection Rate, NPV, Prevalence, Accuracy, Kappa, and 95% CI.
displays the performance metrics for each criterion used in this paper. As shown in this table, DACNN has the lowest error rate compared to other algorithms. However, the performance of CNN and DAGCNN are evaluated using sensitivity, detection rate, NPV, prevalence, accuracy, kappa, and CI (as shown in ).
Table 2. Performance evaluation of models based on MAE, RMSE, and MASE.
Table 3. Performance metrics of CNN of malaria blood sample images.
Table 4. Performance metrics of DAGCNN of malaria blood sample images.
Table 5. Performance metrics of DACNN of malaria blood sample images.
Table 6. Overall evaluation of CNN, DAGCNN, and DACNN models based on , and
.
CNN failed to classify malaria blood smear images as shown in the performance metrics such as and Prevalence. Sensitivity (
of the CNN of the two classes of malaria blood smear images, for example, Infected and Uninfected is within the range of 65–81% as shown in . DAGCNN on the other hand also failed to classify malaria blood smear images as shown in the performance metrics such as
and Prevalence (as shown in ). The Sensitivity (
of the DACNN of the two classes of malaria blood smear images, for example, Infected and Uninfected is within the range of 92–96%, Detection Rate (
is 41–53%, NPV is 94–95% while Prevalence is 44–55%. This shows that DACNN performs better than CNN and DAGCNN as shown in .
is the overall evaluation of CNN, DAGCNN and DACNN models based on and
. DAGCNN failed to classify malaria blood smear images. According to , DACNN performed best with an accuracy of 94.79%, and kappa of 89.44%, followed by CNN, with an accuracy of 72.62%. This shows that integrating Data Augmentation and Convolution Neural Network data can improve the classification efficiency of malaria smear imaging.
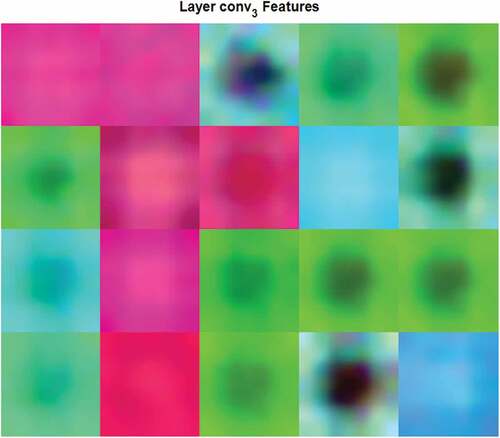
CNNs use image features for classification. These features are learned by the network during the training process. In this study, the hidden layer output visualizes features used for diagnosis of malaria disease from blood sample images was adopted. The complex patterns and textures of the infected blood samples produced by the third convolutional layer are shown in .
Figure 6. Activations from the third CNN layer of malaria blood sample images.
Despite these promising results, the proposed approach has several drawbacks. To begin with, all deep learning methods have a tendency to overfit the training dataset. Because the purpose of deep learning models is for them to generalize successfully from training data to any data from the problem domain, it is critical for CNN to make predictions on datasets it has never seen before. Overfitting occurs when a model tries to learn too many details from the training data while still allowing for noise. As a result, the model’s performance on unknown or test datasets is unsatisfactory. This can make the network to fail in generalizing the training dataset’s features or patterns. This inhibits people from making broad generalizations. Moreover, gamma correction may not be the ideal strategy for image enhancement in poor lighting circumstances.
Conclusion
A new deep learning model, called the data augmentation convolutional neural network (DACNN) was proposed in this paper. The proposed model was trained by reinforcement learning to tackle this problem. The paper compared DACNN with other variations of CNN to investigate its performance. Simulation results show that DACNN performs better than the convolutional neural network (CNN) and the directed acyclic graph convolutional neural network (DAGCNN). The result shows that DACNN outperforms the previous techniques used in earlier studies in image processing and classification. DACNN achieves 94.79% classification accuracy while utilizing DAGCNN or CNN achieved just 68.61%, and 72.62% accuracy, respectively. Therefore, the deep learning methods combined with reinforcement learning can produce faster and more accurate (with an accuracy of 94.79%) results in malaria screening using image recognition.
This paper shows the benefits of data augmentation in improving the classification performance of malaria blood smear images using deep learning-based image classification techniques.
In the future, we aim to adopt interdisciplinary methods that combine medical professionals’ knowledge and experience with deep learning-based systems to further increase the effectiveness and diversity of the model. In addition to this is the deployment of the model on low-cost consumer smartphones for tele-healthcare applications.
Disclosure statement
No potential conflict of interest was reported by the author(s).
References
- Ahuja, A. S. 2019. The impact of artificial intelligence in medicine on the future role of the physician. PeerJ 7:e7702. doi:10.7717/peerj.7702.
- Alok, N., K. Krishan, and P. Chauhan. 2021. Deep learning‐Based image classifier for malaria cell detection. Machine Learning for Healthcare Applications 187–2256.
- Alom, M. Z., T. M. Taha, C. Yakopcic, S. Westberg, P. Sidike, M. S. Nasrin, and V. K. Asari. 2019. A state-of-the-art survey on deep learning theory and architectures. Electronics 8 (3). doi: 10.3390/electronics8030292.
- Bibin, D., M. S. Nair, and P. Punitha. 2017. Malaria parasite detection from peripheral blood smear images using deep belief networks. IEEE Access 5:9099–108. doi:10.1109/ACCESS.2017.2705642.
- Bjorck, N., C. P. Gomes, B. Selman, and K. Q. Weinberger. 2018. Understanding batch normalization. 32nd Conference on Neural Information Processing Systems (NeurIPS 2018), Montréal, Canada.
- Centres for Disease Control and Prevention. 2020. CDC malaria. http://www.cdc.gov/malaria/about/biology/.
- Chaya, J. D., and R. N. Usha. 2019. Predictive analysis by ensemble classifier with machine learning models. International Journal of Computers and Applications 1–8. doi:10.1080/1206212X.2019.1675019.
- Fuhad, K., J. F. Tuba, M. Sarker, S. Momen, N. Mohammed, and T. Rahman. 2020. Deep learning based automatic malaria parasite detection from blood smear and its smartphone-based application. Diagnostics 10 (5):329. doi:10.3390/diagnostics10050329.
- Gunčar, G., M. Kukar, M. Notar, M. Brvar, P. Černelč, M. Notar, and M. Notar. 2018. An application of machine learning to haematological diagnosis. Scientific Reports 8:411. doi:10.1038/s41598-017-18564-8.
- He, K., X. Zhang, S. Ren, and J. Sun. 2016. Deep residual learning for image recognition. 2016 IEEE Conference on Computer Vision and Pattern Recognition (CVPR), 770–78, Las Vegas, NV.
- Hernandez-Leal, P., B. Kartal, and M. E. Taylor. 2019. A survey and critique of multiagent deep reinforcement learning. Autonomous Agents and Multi-Agent Systems 33 (6):750–97. doi:10.1007/s10458-019-09421-1.
- Huang, G., Z. Liu, L. van der Maaten, and K. Weinberger. 2018. Densely connected convolutional networks. arXiv Preprint arXiv: 1608.06993.
- Irfan, R., A. A. Almazroi, H. T. Rauf, R. Damaševičius, E. A. Nasr, and A. E. Abdelgawad. 2021. Dilated semantic segmentation for breast ultrasonic lesion detection using parallel feature fusion. Diagnostics 11 (7):1212. doi:10.3390/diagnostics11071212.
- Kadry, S., V. Rajinikanth, D. Taniar, R. Damaševičius, and X. P. B. Valencia. 2021. Automated segmentation of leukocyte from hematological images—a study using various CNN schemes. The Journal of Supercomputing. doi:10.1007/s11227-021-04125-4.
- Kaggle. 2018. Malaria cell images dataset. https://www.kaggle.com/iarunava/cell-images-for-detecting-malaria.
- Khan, M. A., M. Alhaisoni, U. Tariq, N. Hussain, A. Majid, R. Damaševičius, and R. Maskeliūnas. 2021. Covid-19 case recognition from chest ct images by deep learning, entropy-controlled firefly optimization, and parallel feature fusion. Sensors 21 (21):7286. doi:10.3390/s21217286.
- Krizhevsky, A., I. Sutskever, and G. Hinton. 2012. ImageNet classification with deep convolutional neural networks. Advances in neural information processing systems, 25, pp.1097-1105.
- Kumari, S., M. Singh, and K. Kumar. 2019. December. Prediction of liver disease using grouping of machine learning classifiers. International Conference on Deep Learning, Artificial Intelligence and Robotics, 339–49. Cham: Springer.
- LeCun, Y., Y. Bengio, and G. Hinton. 2015. Deep learning. Nature 521 (7553):436–44. doi:10.1038/nature14539.
- Li, J., X. Li, and D. He. 2019. A directed acyclic graph network combined with CNN and LSTM for remaining useful life prediction. IEEE Access 7:75464–75. doi:10.1109/ACCESS.2019.2919566.
- Litjens, G., T. Kooi, B. E. Bejnordi, A. A. A. Setio, F. Ciompi, M. Ghafoorian, J. A. W. M. van der Laak, B. van Ginneken, and C. I. Sánchez. 2017. A survey on deep learning in medical image analysis. Medical Image Analysis 42:60–88. doi:10.1016/j.media.2017.07.005.
- Mahmud, M., M. S. Kaiser, A. Hussain, and S. Vassanelli. 2018. Applications of deep learning and reinforcement learning to biological data. IEEE Transactions on Neural Networks and Learning Systems 29 (6):2063–79. doi:10.1109/TNNLS.2018.2790388.
- Maqsood, S., R. Damaševičius, and R. Maskeliūnas. 2021. Haemorrhage detection based on 3d CNN deep learning framework and feature fusion for evaluating retinal abnormality in diabetic patients. Sensors 21 (11). doi: 10.3390/s21113865.
- Mehedi Masud, M., H. Alhumyani, S. S. Alshamrani, O. Cheikhrouhou, S. Ibrahim, G. Muhammad, M. S. Hossain, and M. Shorfuzzaman. 2020. Leveraging deep learning techniques for malaria parasite detection using mobile application. Wireless Communications and Mobile Computing 2020:Article ID 8895429, 1–15. doi:10.1155/2020/8895429.
- Miotto, R., F. Wang, S. Wang, X. Jiang, and J. T. Dudley. 2018. Deep learning for healthcare: Review, opportunities and challenges. Briefings in Bioinformatics 19 (6):1236–46. doi:10.1093/bib/bbx044.
- Nair, V., and G. E. Hinton. 2010. Rectified linear units improve restricted Boltzmann machines. Proceedings of the 27th International Conference on International Conference on Machine Learning (ICML’10), 807–14, Omnipress, Madison, WI, USA.
- National Population Commission (NPC) [Nigeria] and ICF. 2019. Nigeria demographic and health survey 2018. Abuja, Nigeria, and Rockville, Maryland, USA: NPC and ICF.
- Negi, A., and K. Kumar. 2021. Classification and detection of citrus diseases using deep learning. In Data science and its applications, 63–85. Chapman and Hall/CRC, London.
- Negi, A., K. Kumar, and P. Chauhan. 2021. Deep neural network-based multi‐class image classification for plant diseases. Agricultural informatics. Wiley, Hoboken, pp 117–129.
- Odusami, M., R. Maskeliūnas, R. Damaševičius, and T. Krilavičius. 2021. Analysis of features of Alzheimer’s disease: Detection of the early stage from functional brain changes in magnetic resonance images using a finetuned resnet18 network. Diagnostics 11 (6):1071. doi:10.3390/diagnostics11061071.
- Okeke, E. U. 2012. Nigerian malaria: The problems and the fight. Malaria Journal 11 (Suppl 1):122. doi:10.1186/1475-2875-11-S1-P122.
- Oyewola, D. O., E. G. Dada, S. Misra, and R. Damaševičius. 2021. Detecting cassava mosaic disease using a deep residual convolutional neural network with distinct block processing. PeerJ Computer Science 7:e352. doi:10.7717/peerj-cs.352.
- Pan, W. D., Y. Dong, and D. Wu. 2018. Classification of malaria-infected cells using deep convolutional neural networks. Machine Learning - Advanced Techniques and Emerging Applications. doi:10.5772/intechopen.72426.
- Poostchi, M., K. Silamut, R. J. Maude, S. Jaeger, and G. Thoma. 2018. Image analysis and machine learning for detecting malaria. Translational Research 194:36–55. doi:10.1016/j.trsl.2017.12.004.
- Qanbar, M. M., and S. Tasdemir. 2019. Detection of malaria diseases with residual attention network. International Journal of Intelligent Systems and Applications in Engineering 7 (4):238–44. doi:10.18201/ijisae.2019457677.
- Rajaraman, S., S. Jaeger, and S. K. Antani. 2019. Performance evaluation of deep neural ensembles toward malaria parasite detection in thin-blood smear images. PeerJ 7:e6977. doi:10.7717/peerj.6977.
- Roy, K., S. Sharmin, R. B. M. Mukta, and A. Sen. 2018. Detection of malaria parasite in giemsa blood sample using image processing. International Journal of Computer Science and Information Technology 10 (1):55–65. doi:10.5121/ijcsit.2018.10105.
- Sahba, F., H. R. Tizhoosh, and M. M. A. Salama. 2008. Application of reinforcement learning for segmentation of transrectal ultrasound images. BMC Medical Imaging 8 (1):8. doi:10.1186/1471-2342-8-8.
- Shah, D., K. Kawale, M. Shah, S. Randive, and R. Mapari. 2020. Malaria Parasite Detection Using Deep Learning: (Beneficial to humankind). 2020 4th International Conference on Intelligent Computing and Control Systems (ICICCS), 2020 May 13, 984–88, IEEE, Madurai, India.
- Shorten, C., and T. M. Khoshgoftaar. 2019. A survey on image data augmentation for deep learning. Journal of Big Data 6:60. doi:10.1186/s40537-019-0197-0.
- Simonyan, K., and A. Zisserman. 2014. Very deep convolutional networks for large-scale image recognition. arXiv Preprint arXiv: 1409.1556.
- Srivastava, N., G. Hinton, A. Krizhevsky, I. Sutskever, and R. Salakhutdinov. 2014. Dropout: A simple way to prevent neural networks from overfitting. Journal of Machine Learning Research 15 (1):1929–58.
- Suárez-Paniagua, V., and I. Segura-Bedmar. 2018. Evaluation of pooling operations in convolutional architectures for drug-drug interaction extraction. BMC Bioinformatics 19 (8):39–47. doi:10.1186/s12859-018-2195-1.
- Szegedy, C., W. Liu, Y. Jia, P. Sermanet, S. Reed, D. Anguelov, D. Erhan, V. Vanhoucke, and A. Rabinovich. 2015. Going deeper with convolutions. 2015 IEEE Conference on Computer Vision and Pattern Recognition (CVPR), 1–9. doi:10.1109/CVPR.2015.7298594.
- Tangpukdee, N., C. Duangdee, P. Wilairatana, and S. Krudsood. 2009. Malaria diagnosis: A brief review. The Korean Journal of Parasitology 47 (2):93–102. doi:10.3347/kjp.2009.47.2.93.
- Teuwen, J., and N. Moriakov. 2020. Convolutional neural networks. In Handbook of medical image computing and computer-assisted intervention, Kevin Zhou, Daniel Rueckert, Gabor Fichtinger eds., 481–501. Academic Press.
- Tian, Z., X. Si, Y. Zheng, Z. Chen, and X. Li. 2020. Multi-step medical image segmentation based on reinforcement learning. Journal of Ambient Intelligence and Humanized Computing. doi:10.1007/s12652-020-01905-3.
- Torres-Jimenez, J., and J. Pavon. 2014. Applications of metaheuristics in real-life problems. Progress in Artificial Intelligence 2:175–76. doi:10.1007/s13748-014-0051-8.
- Wang, H., N. Liu, Y. Zhang, D. Feng, F. Huang, D. Li, and Y. Zhang. 2020. Deep reinforcement learning: A survey. Frontiers of Information Technology and Electronic Engineering 21 (12):1726–44. doi:10.1631/FITEE.1900533.
- World Health Organization. 2020. Malaria. Accessed June 5, 2020. https://www.who.int/news-room/fact-sheets/detail/malaria.
- Yadav, S. S., and S. M. Jadhav. 2019. Deep convolutional neural network-based medical image classification for disease diagnosis. Journal of Big Data 6:1–18. doi:10.1186/s40537-019-0276-2.
- Zhang, J., A. Saha, Z. Zhu, and M. A. Mazurowski. 2019. Hierarchical convolutional neural networks for segmentation of breast tumours in MRI with application to radiogenomics. IEEE Transactions on Medical Imaging 38 (2):435–47. doi:10.1109/TMI.2018.2865671.
- Zheng, Q., M. Yang, X. Tian, N. Jiang, and D. Wang. 2020. A full stage data augmentation method in deep convolutional neural network for natural image classification. Discrete Dynamics in Nature and Society 2020:Article 4706576, 11. doi:10.1155/2020/4706576.