
 ?Mathematical formulae have been encoded as MathML and are displayed in this HTML version using MathJax in order to improve their display. Uncheck the box to turn MathJax off. This feature requires Javascript. Click on a formula to zoom.
ABSTRACT
The Sub-Saharan countries are leading in dropout rates in secondary schools by 37.5% followed by South Asia 15.5% and Middle East 11% in 2018. In Tanzania, student dropouts in secondary schools increased from 3.8% in 2018 to 4.2% in 2019. Different initiatives such as parent-workshops, parent-teacher meetings, community empowerment programs, school feed programs, and secondary education development program (SEDP) have been used to address student dropout but unfortunately, the dropout problem still persists. The persisting dropout problem especially in secondary schools is attributed to a lack of proper identification of root causes and unavailability of formal methods that can be used to project the severity of the problem. In addressing this problem, machine learning (ML) techniques have done a great job in predicting secondary school dropouts. However, most of the ML models suffer from processing features, and hyper-parameters tuning leads to poor prediction accuracy in identifying the root causes of the student dropout. In this study, the AutoML model has been used to improve prediction accuracy by selecting the corresponding hyper-parameters, features, and ML algorithm for the acquired dataset. The proposed model achieved a better prediction accuracy of DT = 99.8%, KNN = 99.6%, MLP = 99% and NB = 97%. The improved prediction score indicates an accurate selection of features that cause student dropout that can be looked in a close eye in the learning process for early intervention.
Introduction
School dropout is untimely withdrawal from school, which make students prematurely end up not obtaining a minimal credential (Witte et al. Citation2013). By the year 2017, it was estimated that a total of 5.1 million children aged 7–17 have dropped out from school, including nearly 1.5 million of secondary-school-aged children (HRW Citation2017). The Sub-Saharan countries are leading in dropout rates in secondary schools by 37.5%, followed by South Asia 15.5% and the Middle East 11% in 2018 (Stastica Citation2022). On the other hand, student dropout in secondary schools in Tanzania increased from 3.8% in 2018 to 4.2% in 2019 (PO-RALG Citation2019, Citation2020). There have been various initiatives to address student dropout in developing countries. Faruk (Citation2015) proposed the teachers’ training, seminars, and workshops raise students not dropout from school. Similarly, Bibi (Citation2018) evidenced that parents-teachers meetings contribute 93.5%, and parents workshops 82.3% to control student dropout rate. Likewise, authority in United Republic of Tanzania (URT) introduced the Secondary Education Development Program (SEDP) in 2005 at least one secondary school in every administrative ward so as to increase availability of secondary school to reduce the distance from their homes (URT Citation2008). The authority also introduced Big Results Now Initiative (World Bank Citation2014) to fast track quality improvement of the education in secondary schools. It is proven that machine learning techniques provide a convenient way to solve student dropout problems and deliver good guarantees for the solutions (Iam-On and Boongoen Citation2017; Kumar, Singh, and Handa Citation2017). The studies by Mduma, Kalegele, and Machuve (Citation2019), Lee and Chung (Citation2019), Chareonrat (Citation2016), Aguiar (Citation2015) and Sara et al. (Citation2015) have focused on establishing machine learning (ML) prediction models, as measures to fight against student dropout in secondary schools. However, ML algorithms suffer from feature processing and selection of the optimal algorithms (Vaccaro, Sansonetti, and Micarelli Citation2021; Wen, Ye, and Gao Citation2020). This representation compromises prediction accuracy in machine learning algorithms and ensemble learning techniques. The ML hyperparameters have different optimums to achieve the best performance in various datasets (Yang and Shami Citation2020).
This paper develops the AutoML model to improve the prediction accuracy for the given datasets for optimal machine learning models (Feurer et al. Citation2015). The enhancement of the AutoML model was deployed by hyper-parameter optimization techniques; grid search, randomized search, Bayesian optimization, and tree-based pipeline tool (Yang and Shami Citation2020). Hyper-parameter Optimization is an approach used to find different values for a model that uses machine learning techniques to select influential features contributed better predictive accuracy (Probst, Boulesteix, and Bischl Citation2019). Most of ML prediction models did not cover Automated machine learning (AutoML) to obtain more significant features to appropriate prediction methods to improve accuracy (Tuggener et al. Citation2019). Hence, prediction accuracy has been challenged by feature preprocessing for the particular dataset, algorithm selection, hyper-parameter tuning and ensemble building (Tuggener et al. Citation2019). Agrapetidou et al. (Citation2021) proved that the AutoML model provided better prediction accuracy compared to traditional models such as DT, RF and SVM. Therefore, there is a need to use AutoML prediction model to accurately identify features that lead to student dropout. This paper intends to answer the following research question: How can an enhanced machine learning model for predicting student dropouts in secondary schools in Tanzania be developed? The rest of the paper is organized as follows. Section 2 discusses the related works. Section 3 presents the methodology and Section 4 presents the results. Last, Section 5 presents the conclusion and future scope of the work.
Related Works
Mirza and Hassan (Citation2020) conducted student dropout intervention using the socioeconomic and school factors such as sex, age, disability, marriage, number of siblings, income, residence, distance from School, transport facility, toilet facility, and drinking water. Their study showed that RF = 96%, SVM = 93%, NB = 94%, DT = 89%, and GLM = 98%. The study provided general results implemented in machine learning algorithms. The authors did not show the most contributing factors that lead student dropout.
Mduma, Kalegele, and Machuve (Citation2019) explored factors which reduce secondary student dropout from school namely; the main source of household income, boy’s pupil latrines ratio, the school has girl’s privacy room, student gender, a parent who check his/her child’s exercise book once in a week, and so on. Their prediction enhancement was achieved by the ensemble classifier which combined the Logistic Regression and Multilayer Perceptron to predict secondary students’ dropout. Moreover, Mduma, Kalegele, and Machuve (Citation2019) evidenced improvement of prediction accuracy after deploying tuning parameters. Their results showed LR = 89.7%, MLP = 86.5%, NB = 78.4%, and RF = 88.8% when compared with traditional ML algorithms training for under-sampling technique; LR = 75%, MLP = 76%, RF = 75%, and KNN = 73%, and for over-sampling; LR = 78%, MLP = 64%, RF = 50%, and KNN = 55% to avoid under-fitting and overfitting problem of the machine learning prediction.
Hutagaol (Citation2019) results revealed the performance of ML algorithms individually; K-Nearest Neighbor (98.2%), Naïve Bayes (98.2%), and Decision Tree (97.9%) and later combined them to build the ensemble classifier that showed a performance of 98.8% when compared to the individual classifiers. His study applied student grade, student location, parent’s income, parent’s education, student gender, age, homework, and attendance as the student dropout factors. Student attendance and homework has been recommended as the most contributing student dropout factors followed by mid test and final test.
Sara et al. (Citation2015) performed prediction based on gender, absence, missing assignments, education history, average income, school size, class size, travel time to school and teacher-pupil ratio. However, their study predicted only the first three months of studies while there are factors which persist for a long time in education tenure. These student dropout factors applied to conventional machine learning algorithms which demonstrated individual performance of each algorithm such as Random Forest 93.5%, SVM 90.5%, CART 89.8% and Naïve Bayes 85.6%. However, prediction accuracy can be improved by the averaged output of ensemble learning prediction model.
Moreover, this study applied machine learning algorithms such as Decision Tree, Naïve Bayes, Random Forest, Support Vector Machines, Multilayer Perceptron, Logistic Regression and K-Nearest Neighbors to build the AutoML prediction model. The identification of the optimal prediction model depends on the voting scheme from the majority of the constituent methods implemented on AutoML model (Zeineddine, Braendle, and Farah Citation2021). Therefore, the study used the proposed AutoML model to identify the optimal ML algorithms and features that improved the prediction accuracy. These optimal features stress close observation to reduce the student dropout in secondary schools and take proactive better strategies to avoid the risk of dropping out the school.
Methodology
The AutoML model for predicting student dropout in secondary schools was developed by selecting best related model using literature reduction process (Page et al. Citation2021). The AutoML refers to a combination of various automated techniques that produce an end ML model such as data preparation, feature engineering, model generation and model evaluation as shown in . The AutoML model refers to the large scale automation of data preprocessing, feature engineering, model searching and hyperparameter optimization (Nagarajah and Poravi Citation2019). The model generation is divided into search space and optimization techniques such as hyperparameter optimization techniques (He, Zhao, and Chu Citation2021). This paper adapted Zeineddine, Braendle, and Farah (Citation2021) methodology approach to develop the improved model for predicting the student dropouts. Their study developed model to predict the student performance in higher learning institutions. The selection of the methodology based on the relevant model components to improve the prediction accuracy, and obtain influential features for the optimal prediction model using hyper-parameter optimization techniques as grid and randomized search. The corresponding hyper-parameter values for the best features and machine learning algorithm greatly improves the prediction accuracy (Wu et al. Citation2019). Automation of feature processing and hyper-parameters are important for ML since they directly control the behaviors of training algorithms and have a significant impact on the performance of ML models (Wu et al. Citation2019).
Data Preprocessing Methods
This study extracted the dataset from the TwawezaUwezo information repository. These datasets included students dropping out of school in Tanzania, Uganda, and Kenya. The datasets were in Stata(.dta) file format, Jupyter Notebook used to read and merge file, and then converted to CSV file format. Datasets contained 385,634 records with 37 features before Scikit-learn data analysis and classification. The remained dataset was 206885 samples and 15 features after removing inconsistent rows and features using univariate feature processing method imputed values in the i-th feature dimension using only non-missing values in that feature dimension (Emmanuel et al. Citation2021). The missing values was handled by imputation technique using mean of each column in which the missing values are found (Rezaie et al. Citation2010). Then, 36,723 records with outliers were removed by inter-quartile range (IQR). IQR finds the outliers from the dataset by identifying the data that is over ranging from the dataset (Whaley Citation2005). IQR is evaluated as IQR = Q3-Q1 where Q3 and Q1 are the upper and lower quartiles, respectively. The lower limit was 25 percentiles, and the upper limit was set to 75 percentiles where Q1 = dataset.quantile(0.25) and Q3 = dataset.quantile(0.75) to handle outliers. Last, data converted from categorical to numerical values so that enable machine learning algorithms to read file using Jupyter Notebook tool. After data conversion, missing values and outliers properly handled to improve predictive accuracy of the model. shows features that only 15 features are most relevant to the task of student dropout prediction out of original number of 37 features.
Table 1. Features Description
Feature Engineering Techniques
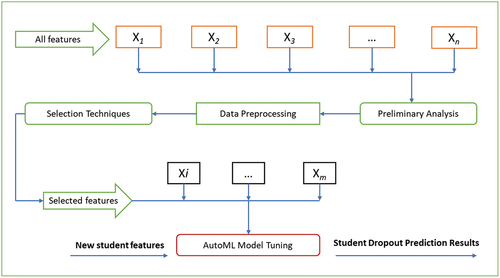
This paper analyzed the relationship between one feature/variable and the target variable, each feature got its test score. Thus, all test scores compared to obtain features with top scores. There are types of the feature selection methods; filter methods and wrapper methods (Zhao et al. Citation2020). The filter methods evaluated all features except the target feature before data is applied to the machine learning algorithm (Nnamoko et al. Citation2014). The evaluation of the feature is performed by ranking scores of each feature using information gain, chi squared, and Gini index (Guyon and Elisseeff Citation2003). The chi squared method selects the minimum number of features needed to represent the data accurately (Liu and Setiono Citation1995). Therefore, the selection of influential features using the chi squared method affect the performance of the ML algorithms (Nurhayati et al. Citation2019). Information Gain measures the usefulness of the feature in a given dataset. The impurity of the feature in the student dataset is measured by Entropy (Tangirala Citation2020). The lower value of entropy gives higher information purity of the node (Azad et al. Citation2021). Moreover, the Gini checks the purity of specific class after splitting along a particular feature. The feature with a lower Gini index is chosen for a split (Zaman, Kaul, and Ahmed Citation2020). The wrapper methods evaluates subset based on the learning algorithm performance (Venkatesh and Anuradha Citation2019). The wrapper methods are recursive feature elimination, sequential feature selection and genetic algorithms computationally more expensive than filter methods that use repeated learning steps and cross validation (Zhao et al. Citation2020). shows adaptation of the feature selection methodology presented by Aissaoui et al. Citation2020). The selection criterion of the methodology is based on the relevance of the proposed model components that demands feature enhancement methods to improve prediction accuracy.
Figure 1. Automatic Feature Engineering.
shows 15 features selected out of 37 after Scikit-learn analysis. This paper adopted DT and Chi Squared method to select the important feature in classification. Ten (10) features were selected, then the five (5) were not considered due to less contribution for predicting student dropouts. The experiment shows that student marks (57%), student age (18%), distance (7%) and number of children (5%) are most statistically significant to student dropout compared to father’s education (3%), student gender (3%), and means to school (2.5%).
Figure 2. Univariate Feature Selection Process.
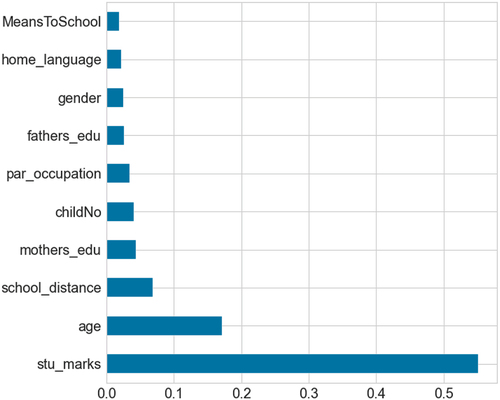
Figure 3. Information gain feature processing.
Application of Machine Learning Algorithms to Student Features
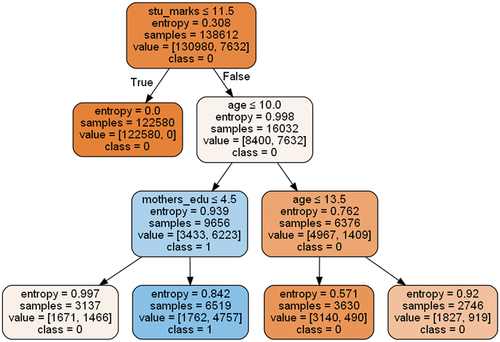
The DT selects features in a top-down approach beginning with the attribute that offers the highest degree of information gain with the lower entropy (Berens et al. Citation2018). The lower value of entropy gives higher information purity of the node (Azad et al. Citation2021). The probabilities describing the possible outcomes of each feature vector are modeled using the logistic function (sigmoid function) (Rovira, Puertas, and Igual Citation2017). LR suffers from small dataset, and it considers as input 0 when recall and precision applied to evaluate the performance of the model (Rovira, Puertas, and Igual Citation2017). In NB each feature was assumed to contribute independently to the probability that a student can dropout or not (Aguiar Citation2015). Random forest works for the large datasets (Kemper, Vorhoff, and Wigger Citation2020). Therefore, significant improvements in classification accuracy have resulted from growing an ensemble of trees and letting them vote for the most popular class (Breiman Citation2001). shows the lower value of each feature indicate the highest information purity from the splitting node.
Hyper-parameter Optimization Techniques
HPO definition: ML algorithm A has N hyper-parameters to be organized, the domain of the n-th hyper-parameter denoted by , then the overall hyper-parameter configuration space can be computed by
. D represents the given the dataset, L represents hyper-parameters that can minimize the loss of the model generated by algorithm A with hyper-parameter λ on the training data
and evaluated on validation data
(Zahedi et al. Citation2021). The optimization of the model can be formulated by;
.
This paper deployed grid search and randomized search to select proper features/variables and machine learning algorithms for better predictive accuracy. The grid search method completes the search manually for the acquired dataset of the hyper-parameter space of the training algorithm (Liashchynskyi and Liashchynskyi Citation2019). The advantage of Grid search is that it always finds the best set of hyper-parameters from the given hyper-parameters (Gada et al. Citation2021). This paper applied the grid search to optimize the performance of ML algorithms that can explore all regions of defined search space (Schaer, Müller, and Depeursinge Citation2016). Random search replaces the manual enumeration of all combinations by random selection. This method was applied to discrete settings but generalized to continuous and mixed space (Liashchynskyi and Liashchynskyi Citation2019). Random search handles high-dimensional spaces than grid search which is slow and computationally expensive (Bergstra and Bengio Citation2012).
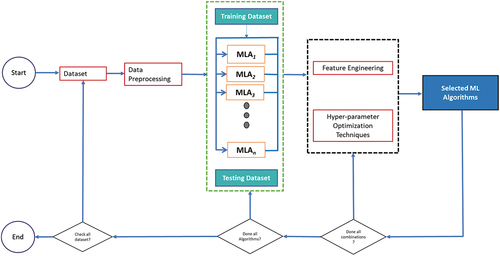
presents the prediction model looped through different predictive models and corresponding values to identify the optimal model with the best prediction accuracy. The output of the best prediction accuracy derived by the following steps; input dataset is passed to the data preprocessing and the list of ML algorithms are passed to feature engineering techniques to obtain influential features. Then, hyper-parameter optimization technique selected and returned the optimal hyper-parameter value for the model. Last, the models were trained and analysis was done by the model evaluation metrics to obtain the best classification models. Data preprocessing aimed to obtain clean dataset and to avoid the curse of dimensionality before applying to the ML model. Likewise, feature engineering phase was applied to extract the importance features corresponding the hyperparameter values to derive the optimal prediction model.
Figure 4. AutoML prediction Model.
Results and Discussion
Results of this study is divided into two sections. First experiment was the training, and testing using default/conventional machine learning algorithms in and , and second experiment deployed the hyper-parameter optimization techniques in and . The first and experiment applied 15 features described in . The grid search performed better compared to randomized search hyper-parameter optimization technique in . Furthermore, shows that when a recall<0.5 indicates that the classifier has a high number of false negatives which can be an outcome of imbalanced class or untuned model hyper-parameters and if a recall is 1.0% shows that classifier has accurately predicted for the given features in . Moreover, when Area Under the Curve (AUC) = 1 or approaches to 1, then the classifier has perfectly distinguished between all the positive and negative class points correctly and if AUC = 0, then the classifier predicted all negatives as positives, and all positives as negatives.
Figure 5. ML Algorithms performance without parameters tuning.
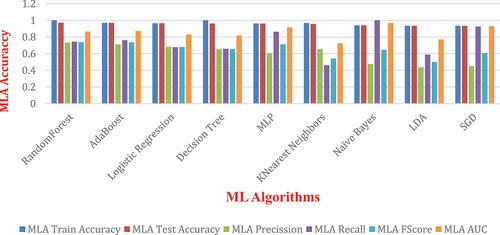
Figure 6. ROC Curve for ML Algorithms.
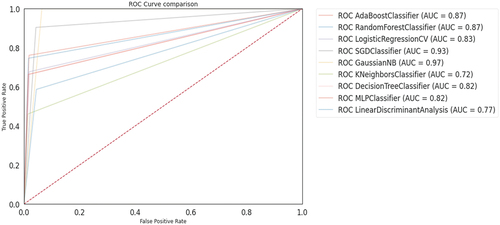
Figure 7. Hyper-parameter optimization by Grid Search.
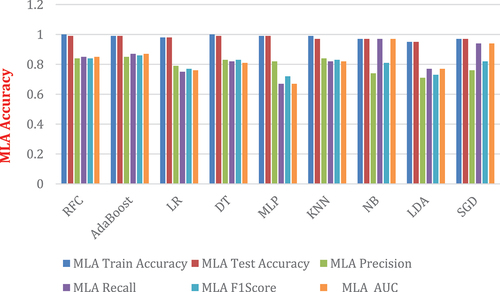
Figure 8. Hyper-parameter optimization by Randomized Search.
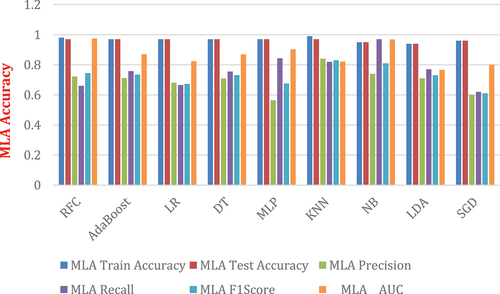
Table 2. Conventional Training of ML algorithms Performance
Table 3. Grid search HPO tuning
Receiver Operating Characteristics (ROC) Curve plots the true positive rate (TPR) against the false positive rate (FPR) at various threshold settings (Vujović Citation2021). shows the classifiers that give curves closer to the top left corner indicate better performance. Also, the classifier curve comes closer to the 45-degree diagonal of the ROC space leads to less accurate test (Zou, O’Malley, and Mauri Citation2007). A probability in [0.0, 0.49] indicates negative outcome (0) and when the probability in [0.5, 1.0] shows the positive outcome (1). The experiment results show NB = 0.97, and SGD = 0.93 closer to the top left corner. RF = 0.87, AdaBoost = 0.87, LR = 0.83, DT = 0.82, MLP = .82, LDA = 0.77, and KNN = 0.72 are showing the probability to the better prediction.
Similarly, shows improved accuracies of ML algorithms compared to with less prediction accuracy. Therefore, this confirms that AutoML model improves prediction accuracy when hyper-parameter optimization techniques are applied in training algorithms, feature selection as well as hyper-parameters tuning.
shows better performance of six (6) evaluation metrics compared to with default settings of the parameters. Experimental results indicate RFC and NB have 96% AUC, followed by SGD = 94%, MLP = 90%, Adaboost and DT have 87%, and LDA has the lowest value of 76%. Moreover, LDA has proven to work well with other metrics when Grid search HPO tuning is applied. The hyperparameter tuning in LDA increases performance results compared to default training (Muhajir et al. Citation2022).
shows RF = 87.5%, DT = 86.9% and KNN = 82.5% better improvement of the AUC compared in with 86% for RF, DT = 81%, and KNN = 72%. Other ML algorithms such as AdaBoost, MLP, LDA have slight improvement of 87%, 90%, 77% respectively. Likewise, DT shows precision of 70.9%, MLP = 71.4%, NB = 51%, SGD = 71% compared to table x shows 65%, 61%, 48%, 45% respectively. The randomized search in shows improvement of accuracy compared with that did not deploy parameters tuning. The grid search performs better when a small dataset is used by the model but suffers from the curse of dimensionality and performs less as data extrapolated increases computational cost and wastage of space (Verleysen and François Citation2005). This paper applied the Manhattan metric and 11 neighbors as the best parameters used in KNN. The Manhattan distance metric is consistently preferable to the Euclidean distance metric for the high dimensional datasets (Aggarwal, Hinneburg, and Keim Citation2001). The KNN hyper-parameter optimization in performed better than in grid search in . Data classified by a majority vote of its neighbors assigned to the class measured between two data points x and y by a distance function (Jawthari and Stoffová Citation2021).
Table 4. Randomized search HPO tuning
Table 5. Hyperparameter tuning for DT Classifier
Table 6. Hyperparameter tuning for RF Classifier
Table 7. Hyperparameter tuning for SGD Classifier
Table 8. Hyperparameter tuning for AdaBoost Classifier
show hyperparameter techniques and the corresponding average accuracy, and the set of the best hyperparameter values that represent the model configuration obtained by each technique.
This paper grounded on previous models performances attempted by various authors to improve prediction results. Results by Lee and Chung (Citation2019) evidenced DT = 89.4%, and Gil, Delima, and Vilchez (Citation2020) Gil, Delima, and Vilchez (Citation2020) demonstrated DT = 98.95%. Similarly, Said (Citation2020) confirmed random forest performed better than gradient boosting, KNN, and MLP with 85.5%, 82.6%, 78.1%, 74.1%, respectively. Mduma et al. (Citation2019) evidenced improvement of prediction accuracy after deploying tuning parameters by classification metrics, results showed LR = 89.7%, MLP = 86.5%, NB = 78.4%, and RF = 88.8% when compared with traditional ML algorithms training for under-sampling technique; LR = 75%, MLP = 76%, RF = 75%, and KNN = 73%, and for over-sampling; LR = 78%, MLP = 64%, RF = 50%, and KNN = 55% to avoid under-fitting and overfitting problem of the machine learning prediction. Likewise, Machine learning algorithms’ performances depend on well-processed datasets that add value to prediction accuracy. Previous studies show factors that; age (95.2%), gender (91.1%), distance (88.8%), absence (91.1%), class activities (90.9%), early marriage (95.3%), and family income (95%), family size (93%), parents’ occupation (90.7%), student repetition (89.3%), and attendance (90.1%) have a high impact on prediction accuracy (Gil, Delima, and Vilchez Citation2020; Márquez-Vera et al. Citation2016; Sansone Citation2019; Sara et al. Citation2015). Moreover, Mirza and Hassan (Citation2020) and Bibi (Citation2018) evidenced that family financial constraints or poverty in developing economies lead to student dropout by 100%. Similarly, student truancy by 43% causes the student to leave school (Bridgeland, Dilulio, and Morison Citation2006). Said (Citation2020) results revealed that distance contributed 53.7% students not to persevere, and time spent by student in school was 46.5%. Student attendance and homework have been recommended as the most contributing student dropout factors followed by mid-test and final tests (Hutagaol Citation2019), and poor performance in academics contributes 51.2% to student dropout (Lee and Chung Citation2019). The proposed prediction model maximizes the chance of supporting the successful learning of students by considering the impacts of the identified features and planning appropriately school resources.
Conclusion and Future Research Directions
Machine learning algorithms have contributed a lot to student dropout prediction in secondary schools. However, predicting student dropout by conventional machine learning algorithms has led to inappropriate selection of significant features and algorithms for problem intervention. The improvement of prediction accuracy is driven by influential features and machine learning algorithms with outstanding performance. The study contributes mainly to the improvement of prediction accuracy for secondary schools dropout prediction. Results show that Random Forest, Decision Tree, K-Nearest Neighbors, AdaBoost, Multilayer Perceptron and Logistic Regression outperformed better than Stochastic Gradient, Linear Discriminant Analysis and Naïve Bayes. Results show that student marks (57%), student age (18%), distance (7%) and number of children (5%) are most statistically significant to student dropout compared to father’s education (3%), student gender (3%), and means to school (2.5%). This study offers comprehensive evaluation by comparing the performance of machine learning algorithms without and with the randomized and grid search hyper-parameter optimization techniques. Moreover, the grid search and randomized search performs better than the default settings of the machine learning algorithms. The improved prediction score indicates an accurate selection of features that cause student dropout that can be looked in a close eye in the learning process for early intervention. Furthermore, the study recommends other computation approaches such as Bayesian Optimization and Genetic Algorithms to accurately predict the student dropouts in developing countries.
Acknowledgments
The Ministry of Education, Science and Technology (MoEST) is highly acknowledged for sponsoring this study.
Disclosure Statement
No potential conflict of interest was reported by the author(s).
References
- Aggarwal, C. C., A. Hinneburg, and D. A. Keim (2001). On the surprising behavior of distance metrics in high dimensional space. Database Theory ICDT 2001 8th International Conference, Januaary 4-6 London, UK, 433–451. 10.1007/3-540-44503-x_27
- Agrapetidou, A., P. Charonyktakis, P. Gogas, T. Papadimitriou, and I. Tsamardinos. 2021. An AutoML application to forecasting bank failures. Applied Economics Letters 28 (1):5–9. doi:10.1080/13504851.2020.1725230.
- Aguiar, E . 2015. Identifying Students at Risk and Beyond: A Machine Learning Approach. ProQuest LLC, Ann Arbor, Michigan, U.S: University of Notre Dame. Issue July.
- Aissaoui, O. El, Madani, Y. E. A. El, Oughdir, L., Dakkak, A., & Allioui, Y. El. (2020). A Multiple Linear Regression-Based Approach to Predict Student Performance. International Conference on Advanced Intelligent Systems for Sustainable Development, 9–23. https://doi.org/10.1007/978-3-030-36653-7_2
- Azad, M., I. Chikalov, S. Hussain, and M. Moshkov. 2021. Entropy-Based Greedy Algorithm for Decision Trees Using Hypotheses. Journal of Entropy 23 (808):1–8. doi:10.3390/e23070808.
- Berens, J., K. Schneider, S. Gortz, S. Oster, and J. Burghoff. 2018. Early Detection of Students at Risk: Predicting Student Dropouts Using Administrative Student Data and Machine Learning Methods. Schumpeter School of Business and Economics 11 (3): 1–41. https://doi.org/10.5281/zenodo.3594771
- Bergstra, J., and Y. Bengio. 2012. Random Search for Hyper-parameter Optimization. Journal of Machine Learning Research 13:281–305.
- Bibi, T. 2018. Factors Affecting Dropout Rate at Secondary School Level in Private Schools of Punjab, Pakistan. International Journal of Management Sciences and Business Research 7 (4):1–7.
- Breiman, L. 2001. Random Forests. Machine Learning 45 (1): 5–32.
- Bridgeland, J. M., J. J. Dilulio, and K. B. Morison (2006). The Silent Epidemic: Perspectives of High School Dropouts. https://eric.ed.gov/?id=ED513444
- Chareonrat, J. 2016. Student Dropout Factor Analysis and Trend Prediction using Decision Tree. Journal of Science and Technology 23 (2):187–93.
- Emmanuel, T., T. Maupong, D. Mpoeleng, T. Semong, B. Mphago, and O. Tabona. 2021. A survey on Missing Data in Machine Learning. Journal of Big Data 8 (1): Springer International Publishing. doi:10.1186/s40537-021-00516-9.
- Faruk, B. U. 2015. Assessment of Primary and Secondary Schools Education in Katsina State. International Journal of Strategic Research in Education, Technology and Humanities 2 (2):13–27.
- Feurer, M., A. Klein, K. Eggensperger, J. T. Springenberg, M. Blum, and F. Hutter. 2015. Efficient and robust automated machine learning NIPS'15: Proceedings of the 28th International Conference on Neural Information Processing Systems December 7-12 2 (55 Hayward St., Cambridge, MA, United States: MIT Press) . 2755–2763 doi:10.5555/2969442.2969547.
- Gada, M., Z. Haria, A. Mankad, K. Damania, and S. Sankhe (2021). Automated Feature Engineering and Hyperparameter optimization for Machine Learning. 2021 7th International Conference on Advanced Computing and Communication Systems, ICACCS 2021 March 19-20 1 (Coimbatore, India: Piscataway, New Jersey: IEEE) , 981–86. 10.1109/ICACCS51430.2021.9441668
- Gil, J. S., A. J. P. Delima, and R. N. Vilchez. 2020. Predicting Students’ Dropout Indicators in Public School using Data Mining Approaches. International Journal of Advanced Trends in Computer Science and Engineering 9 (1):774–78. doi:10.30534/ijatcse/2020/110912020.
- Guyon, I., and A. Elisseeff. 2003. An Introduction to Variable and Feature Selection 1 Introduction. Journal OfMachine Learning Research 3:1157–82.
- He, X., K. Zhao, and X. Chu. 2021. AutoML: A survey of the state-of-the-art. Knowledge-Based Systems 212: . . 106622. 10.1016/j.knosys.2020.106622.
- HRW. (2017). I Had a Dream to Finish School. Barriers to Secondary Education in Tanzania: Human Rught Watch (HRW). https://www.hrw.org/report/2017/02/14-had-dream-finish-school/barriers-secndary-education-tanzania
- Hutagaol, N. S. 2019. Predictive modelling of student dropout using ensemble classifier method in higher education. Advances in Science, Technology and Engineering Systems 4 (4):206–11. doi:10.25046/aj040425.
- Iam-On, N., and T. Boongoen. 2017. Generating Descriptive Model for Student Dropout: A Review of Clustering Approach. Human-Centric Computing and Information Sciences 7 (1):1–24. doi:10.1186/s13673-016-0083-0.
- Jawthari, M., and V. Stoffová. 2021. Predicting Students’ Academic Performance using a Modified kNN algorithm. Pollack Periodica 16 (3):20–26. doi:10.1556/606.2021.00374.
- Kemper, L., G. Vorhoff, and B. U. Wigger. 2020. Predicting Student Dropout: A Machine Learning Approach. European Journal of Higher Education 10 (1):28–47. doi:10.1080/21568235.2020.1718520.
- Kumar, M., A. J. Singh, and D. Handa. 2017. Literature Survey on Educational Dropout Prediction. International Journal of Education and Management Engineering 7 (2):8–19. doi:10.5815/ijeme.2017.02.02.
- Lee, S., and J. Y. Chung. 2019. The Machine Learning-Based Dropout Early Warning System for Improving the Performance of Dropout Prediction. Applied Sciences 9 (15):3093. doi:10.3390/app9153093.
- Liashchynskyi, P., and P. Liashchynskyi. 2019. Grid Search, Random Search, Genetic Algorithm: ABig Comparison for NAS. . vol. 2017. 1–11. http://arxiv.org/abs/1912.06059
- Liu, H., and R. Setiono (1995). Chi2: Feature Selection and Discretization of Numeric Attributes. In Proceedings of the IEEE 7th International Conference on Tools with Artificial Intelligence, November 5-8, Herndon, Virginia, USA (pp. 388–391). 10.1109/tai.1995.479783
- Márquez-Vera, C., A. Cano, C. Romero, A. Y. M. Noaman, H. Mousa Fardoun, and S. Ventura. 2016. Early Dropout Prediction using Data Mining: A case Study with High School Students. Expert Systems 33 (1):107–24. doi:10.1111/exsy.12135.
- Mduma, N., K. Kalegele, and D. Machuve. 2019. Machine Learning Approach for Reducing Students Dropout Rates. International Journal of Advanced Computer Research 9 (42):156–69. doi:10.19101/ijacr.2018.839045.
- Mirza, T., and M. M. Hassan. 2020. Prediction of School Drop outs witht the help of Machine Learning Algorithms. GIS Science Journal 7 (7):253–63.
- Muhajir, D., M. Akbar, A. Bagaskara, and R. Vinarti. 2022. Improving classification algorithm on education dataset using hyperparameter tuning. Procedia Computer Science 197:538–44. doi:10.1016/j.procs.2021.12.171.
- Nagarajah, T., and G. Poravi (2019). A Review on Automated Machine Learning (AutoML) Systems. 2019 IEEE 5th International Conference for Convergence in Technology, I2CT 2019, Hamburg, Germany, 1–6. 10.1109/I2CT45611.2019.9033810
- Nnamoko, N. A., F. N. Arshad, D. England, J. Vora, and J. Norman (2014). Evaluation of Filter and Wrapper Methods for Feature Selection in Supervised Machine Learning. PGNET Proceedings of the 15th Annual Postgraduate Symposium on the Convergence of Telecommunications, Networking and Broadcasting, Liverpool, United Kingdom.
- Nurhayati, Putra, A. E., Wardhani, L. K., & Busman. (2019). Chi-Square Feature Selection Effect on Naive Bayes Classifier Algorithm Performance for Sentiment Analysis Document. 2019 7th International Conference on Cyber and IT Service Management, CITSM 2019, November. https://doi.org/10.1109/CITSM47753.2019.8965332
- Page, M. J., J. E. McKenzie, P. M. Bossuyt, I. Boutron, T. C. Hoffmann, C. D. Mulrow, L. Shamseer, and J. M. Tetzlaff. 2021. The PRISMA 2020 statement: An updated guideline for reporting systematic reviews. Journal of Clinical Epidemiology 74 (9):790–99.
- PO-RALG. 2019.Pre-Primary, Primary, Adult and Non Formal Education Statistics . (Dodoma, Tanzania: President's Office Regional Administration and Local Government
- PO-RALG.2020 Pre-Primary, Primary, Adult and Non Formal Education Statistics .Dodoma, Tanzania: President's Office Regional Administration and Local Government.
- Probst, P., A. L. Boulesteix, and B. Bischl. 2019. Tunability: Importance of hyperparameters of machine learning algorithms. Journal of Machine Learning Research 20:1–32.
- Rezaie, M. G., H. S. Zadeh, H. Ying, and M. Dong. 2010. Selection-Fusion Approach for Classification of Datasets with Missing Values. Pattern Recognit 43 (6):1–27. doi:10.1016/j.patcog.2009.12.003.
- Rovira, S., E. Puertas, and L. Igual. 2017. Data-Driven System to Predict Academic Grades and Dropout. PLoS ONE 12 (2):1–21. doi:10.1371/journal.pone.0171207.
- Said, H. 2020. Developing Dropout Predictive System for Secondary Schools, By Using Classification Algorithm: A Case Study of Tabora Region. Dodoma City: University of Dodoma
- Sansone, D. 2019. Beyond Early Warning Indicators: High School Dropout and Machine Learning. Oxford Bulletin of Economics and Statistics 81 (2):456–85. doi:10.1111/obes.12277.
- Sara, N. B., R. Halland, C. Igel, and S. Alstrup (2015). High-School Dropout Prediction using Machine Learning: A Danish Large-scale Study. ESANN 2015 Proceedings, European Symposium on Artificial Neural Networks, Computational Intelligence and Machine Learning, April 22-24, Bruges, Belgium.
- Schaer, R., H. Müller, and A. Depeursinge. 2016. Optimized distributed hyperparameter search and simulation for lung texture classification in CT using Hadoop. Journal of Imaging 2 (2):19. doi:10.3390/jimaging2020019.
- Stastica. 2022. Pupils out of lower secondary school by gender and region Brahms Kontor, Hamburg. https://www.statista.com.
- Tangirala, S. 2020. Evaluating the impact of GINI index and information gain on classification using decision tree classifier algorithm. International Journal of Advanced Computer Science and Applications 11 (2):612–19. doi:10.14569/ijacsa.2020.0110277.
- Tuggener, L., M. Amirian, K. Rombach, S. Lorwald, A. Varlet, C. Westermann, and T. Stadelmann (2019). Automated Machine Learning in Practice: State of the Art and Recent Results. Proceedings - 6th Swiss Conference on Data Science, SDS 2019, Los Alamitos, California, 31–36. 10.1109/SDS.2019.00-11
- URT. 2008. The United Republic of Tanzania: Education Sector Development Programme 2008-2017. Dar es Salaam, Tanzania: Ministry of Education, Science and Technology.
- Vaccaro, L., G. Sansonetti, and A. Micarelli. 2021. An empirical review of automated machine learning. Journal of Computers 10 (1):1–27. doi:10.3390/computers10010011.
- Venkatesh, B., and J. Anuradha. 2019. A Review of Feature Selection and its Methods. Cybernetics and Information Technologies 19 (1):3–26. doi:10.2478/CAIT-2019-0001.
- Verleysen, M., and D. François. 2005. Computational Intelligence and Bioinspired Systems, 8th International Work-Conference on Artificial Neural Networks, IWANN 2005 June 8-10, Vilanova i la Geltrú, Barcelona, Spain. . 758–770.
- Vujović, Ž. 2021. Classification Model Evaluation Metrics. International Journal of Advanced Computer Science and Applications 12 (6):599–606. doi:10.14569/IJACSA.2021.0120670.
- Wen, L., X. Ye, and L. Gao. 2020. A new Automatic Machine Learning based Hyperparameter Optimization for Workpiece Quality Prediction. Measurement and Control (United Kingdom) 53 (7–8):1088–98. doi:10.1177/0020294020932347.
- Whaley, D. L. (2005). The Interquartile Range: Theory and Estimation. In Electronic Theses and Dissertations. http://dc.etsu.edu/etd%0Ahttp://dc.etsu.edu/etd
- Witte, K., S. Cabus, G. Thyssen, W. Groot, and H. M. Van Den Brink. 2013. A critical review of the literature on school dropout. Educational Research Review 10:13–28. doi:10.1016/j.edurev.2013.05.002.
- World Bank. (2014). How Tanzania Plans to Achieve “Big Results Now” in Education. http://www.worldbank.org/en/news/feature/2014/07/10/how-tanzania-plans-to-achieve-big-reforms-now-in-education
- Wu, J., X. Y. Chen, H. Zhang, L. D. Xiong, H. Lei, and S. H. Deng. 2019. Hyperparameter optimization for machine learning models based on Bayesian optimization. Journal of Electronic Science and Technology 17 (1):26–40. doi:10.11989/JEST.1674-862X.80904120.
- Yang, L., and A. Shami. 2020. On hyperparameter optimization of machine learning algorithms: Theory and practice. Neurocomputing 415:295–316. doi:10.1016/j.neucom.2020.07.061.
- Zahedi, L., F. G. Mohammadi, S. Rezapour, M. W. Ohland, and M. H. Amini (2021). Search Algorithms for Automated Hyper-Parameter Tuning. 1–10. http://arxiv.org/abs/2104.14677
- Zaman, M., S. Kaul, and M. Ahmed. 2020. Analytical Comparison between the Information Gain and Gini index using Historical Geographical Data. International Journal of Advanced Computer Science and Applications 11 (5):429–40. doi:10.14569/IJACSA.2020.0110557.
- Zeineddine, H., U. Braendle, and A. Farah. 2021. Enhancing prediction of student success: Automated machine learning approach. Computers and Electrical Engineering 89 (November):106903. doi:10.1016/j.compeleceng.2020.106903.
- Zhao, X., K. Liu, W. Fan, L. Jiang, X. Zhao, M. Yin, and Y. Fu (2020). Simplifying Reinforced Feature Selection via Restructured Choice Strategy of Single Agent. Proceedings - IEEE International Conference on Data Mining, ICDM, 2020-Novem Sorrento, Italy, 871–80. 10.1109/ICDM50108.2020.00096
- Zou, K. H., A. J. O’Malley, and L. Mauri. 2007. Receiver-operating characteristic analysis for evaluating diagnostic tests and predictive models. Circulation 115 (5):654–57. doi:10.1161/CIRCULATIONAHA.105.594929.