
 ?Mathematical formulae have been encoded as MathML and are displayed in this HTML version using MathJax in order to improve their display. Uncheck the box to turn MathJax off. This feature requires Javascript. Click on a formula to zoom.
ABSTRACT
The particulate matter (PM) is emitted from diverse sources and affects the human health very badly. In the past, researchers applied different automated computational tools in the predication of PM. Accurate prediction of PM requires more relevant features and feature importance. In this research, we first extracted the multimodal features from time domain standard deviation average (SDAPM), standard deviation of standard deviation (SDSD), standard deviation of particulate matter (SDPM), root-mean square of standard deviation (RMSSD), and nonlinear dynamical measure wavelet entropy (WE) – Shannon, norm, threshold, multiscale entropy based on KD tree (MSEKD), and multiscale approximate entropy (MAEnt). We then applied the intelligent-based Bayesian inference approach to compute the strength of relationship among multimodal features. We also computed total incoming and outgoing forces between the features (nodes). The results reveal that there was a very highly significant correlation (p-value <0.05) between the selected nodes. The highest total force was yielded by WE-norm followed by SDAPM and SDPM. The association will further help to investigate that which extracted features are more positively or negatively correlated and associated with each other. The results revealed that the proposed methodology can further provide deeper insights into computing the association among the features.
Introduction
The human health is severely affected due to the pollutant particulate matters (PMs) time series (Ostro, Broadwin, and Lipsett Citation2000; Weng, Chang, and Lee Citation2008). The size of the PMs varies in diamete from few nanometers (nm) to tens of micrometers (µm). The types of PMs are . The human health is hazardously affected by these PMs due to the variation in distribution, size, and composition (Ostro, Broadwin, and Lipsett Citation2000). The ultrafine particles (
) have a more impact on the human health than coarse particles (
) (Laden et al. Citation2014; Mar et al. Citation2006). According to the survey in 1993, it was observed by the World Bank that about 50% of the diseases are spreading due to the poor household environment (Albalak et al. Citation1999; L. P. Naeher et al. Citation2001). The indoor PMs are inhaled from cigarette smoking, cooking, wood burning stoves, and malfunctioning combustion appliances (C. K. Lee and Lin Citation2008; Martínez et al. Citation2016). The other sources affect the human health via respiratory systems (Zhiqiang et al. Citation2000) such as cough, asthma, bronchitis, cancer, fever, bronchial constriction, and obstructive disease (Repace and Lowrey Citation1980). Moreover, 90% of the people who are affected by the PM are spending most of their time at home rather than outside (Kado et al. Citation1994). Moreover, the people living in the rural areas are using domestic wood combustion heaters during cold or moderate weather, which severely affect their health (Ancelet et al. Citation2013; GLASIUS et al. Citation2006; Grange et al. Citation2013; Molnár and Sallsten Citation2013; Trompetter et al. Citation2013). The respiratory symptoms and exacerbations especially in children and young adults are associated with elevated concentration of ambient PM in wood burning communities (Lipsett, Hurley, and Ostro Citation1997; McGowan et al. Citation2002; Luke P. Naeher et al. Citation2007; Town Citation2001). The studies indicate that wood smoke affects the human health in a similar way as that of diesel and gasoline. There is a dire need to study the health impacts of ambient PM emitted from wood combustion heaters and other sources. The research also reveals that wood smoke contains the polycyclic aromatic hydrocarbon compounds having carcinogenic properties, and ultimately, the indoor exposure to wood smoke increases the cancer risk (Hosgood et al. Citation2010).
The optimal and modern combustion engines produce the diesel exhaust particles that are primarily , a substantial component of which are
. These particles are highly complex comprising the core of elemental carbon and absorbed organic compounds and small amount of nitrate, sulfate, metal, and many trace elements (Wichmann Citation2007).
The diesel exhaust study is very problematic as the PM of diesel exhaust varies in chemical composition and size with respect to the engine type (light duty, heavy duty, or method of fuel injection), operating condition of the engines (accelerating, decelerating, or idle), and fuel formulation (low/high, petroleum-based diesel, sulfur fuel, or biodiesel). These differences are yet unclear that how much they change the toxicity (Matti Maricq Citation2007; Y. Wang et al. Citation2015). The lifetime of the atmospheric PM ranges from minutes to several days. The impact of these particles on health can be of greater extent as they age in the atmosphere (Duncan et al. Citation2008).
There is a literature evidence of possible risks attributed from specific source of emission, i.e., domestic wood combustion heaters produce exacerbations and respiratory symptoms (Ancelet et al. Citation2013; GLASIUS et al. Citation2006; Grange et al. Citation2013; Molnár and Sallsten Citation2013; Trompetter et al. Citation2013), respiratory morbidity (Andersen et al. Citation2007), cardiovascular morbidity (Sarnat et al. Citation2008), airway inflammation, and compromised lung immunity (Reed et al. Citation2004; Seagrave et al. Citation2005; Zelikoff et al. Citation2002).
Likewise, the crustal dust produces the health risks including respiratory mortality(>75 years of age) (Zauli Sajani et al. Citation2011), cardiovascular mortality (Chan and Ng Citation2011; de Longueville et al. Citation2013; Elliott, Henderson, and Wan Citation2013; H. Lee et al. Citation2013, Citation2014), asthma exacerbation (Kanatani et al. Citation2010; J.-W. Lee and Lee Citation2014; PARK et al. Citation2005; C.-H. Wang, Chen, and Lin Citation2014; Yoo et al. Citation2008), respiratory and COPD morbidity (Chiu et al. Citation2008; TAM et al. Citation2012), pneumonia (Cheng et al. Citation2008; Griffin Citation2007), reduced lung function in children (Hong et al. Citation2010), lung inflammation (Ghio et al. Citation2014; Lei et al. Citation2004), and infectious diseases (Goudie Citation2014; Sprigg et al. Citation2014; Yang Citation2006). The PMs spreading from diverse sources have a very severe impact on human health. With the passage of time, the environment due to the polluted PMs, weather environmental changes, huge constructions, increase in motor vehicles, and other sources that are used as means of facilities severely impact our health due to spreading the concentration of PMs on diverse means. Thus, if no precautionary measures and tools are developed and concerned health-care professionals and environmental professionals are provided with scientific solutions, there might be severe future impacts and challenges on human health.
In the past, researchers utilized traditional machine-learning algorithms. However, we need a more comprehensive analysis to determine the associations and other Bayesian measures to further strengthen our analysis to unfold the hidden dynamics for further improving the PM concentration prediction. The parametric information from the data in the recent studies has been investigated using a probabilistic propagation algorithm (Bayes Rule) by applying Bayesian networks (BNs). The degree of uncertainty and associations of variables varies from different sources such as numerical data, empirical data, and expert opinion to capture the conditional dependencies of a variable upon others (Kaikkonen et al. Citation2021). BNs have successfully been utilized in many studies by different researchers such as Kocian et al. (Citation2020), Amaral et al. (Citation2019), Laurila-Pant et al. (Citation2019), and Zhang et al. (Citation2019). The causal relationships can be studied between variables, which compute the probabilities of a variable when other variables in the model are known. Moreover, the Monte-Carlo analysis (MCA) can be used at random sampling of probability distribution functions (PDFs) to denote the inputs of Bayesian model to produce hundreds or thousands of possible outcomes (Sperotto et al. Citation2019). Recently, BNs have successfully been utilized in many applications ranging from predicting energy crop yield (Gandhi, Armstrong, and Petkar Citation2016), prediction of coffee rust disease using BNs (Corrales Citation2015), and sustainable planning and management decision (Musango and Peter Citation2007). The BNs computed the interrelation among variables that impacts climate change scenarios in agriculture (Ershadi and Seifi Citation2020). Moreover, recently, Lu et al. (Citation2020) utilized BNs to investigate the complex causal interactions between environments and plant diseases. Previous studies did not focus on association among features to further unfold nonlinear dynamics in order to further improve the health care and environmental issues regarding PM time series.
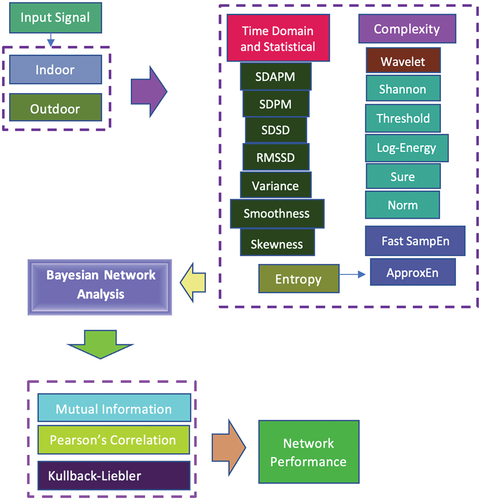
In the present study, we aimed to apply the Bayesian inference (BI) approach for comprehensive analysis to unfold the nonlinear and hidden dynamics present in the nonlinear and nonstationary indoor and outdoor PM time-series data. The PM concentrations have a very severe health impact, so there is a dire need to unfold nonlinear hidden dynamics and associations among extracted features based on Bayesian artificial intelligence methods so that the concerned health professional can take the precautionary measures to reduce the mortality risks. We computed the associations and strength of relationships among multimodal extracted features. The Bayesian approach recently gained its popularity and utilized in many biomedical signal and image processing problems. The BI evaluates the posterior probability, which can be yielded from a weighted combination of local estimates known as likelihood and estimates in surrounding spatial units. Researchers are developing intelligent methods based on machine-learning algorithms, which require the extraction of most relevant features. Our research objective was multifold; first, we computed the multimodal features based on time domain, frequency domain, and entropy-based complexity measures. We then ranked the features based on EROC value. The higher the ROC value, the more important the feature indicates. Second, once we ranked the features, we then selected the high-ranked feature as our target node and then further computed the detailed Bayesian analysis with other features to further unfold the underlying hidden dynamics. We computed the relationship analysis among the extracted nodes using mutual information (MI), Kullback–Leibler (KL) divergence, and Pearson’s correlation. The strength of relationship was computed using arc analysis with 3D mapping. We then computed the parent–child relationship and node force between the nodes. The association graph for segment profile analysis was computed for further analysis. Moreover, the network performance and significance of prominence were computed using tornado diagram. The flow of our work is presented in . We first took the PM time-series input signal, then extracted the multimodal features, applied the features to BN, and utilized different methods for detailed analysis. Finally, the network performance was evaluated using different metrics.
Figure 1. Schematic diagram to reflect the flow of work.
The diesel exhaust also produces risks of various pathologies including lung and esophageal cancer mortality (Attfield et al. Citation2012; Silverman et al. Citation2012), respiratory mortality (Achilleos et al. Citation2017), cardiovascular morbidity (Peng et al. Citation2009), nose and throat irritation (Costa et al. Citation2014), effects on offspring from exposure during pregnancy (Ema et al. Citation2013; Manners et al. Citation2014; Weldy et al. Citation2014), atopy, and susceptibility to infection (Acciani et al. Citation2013; Noah et al. Citation2012; Takahashi et al. Citation2010).
This study is aimed to predict the PM time series by extracting multimodal features from time domain, statistical, and entropy-based complexity measures by applying BN analysis method. We investigated the network performance including the strength of relationship and node force among the nodes (features) using MI, Pearson’s correlation (PC), and KL.
Materials and Methods
Dataset
The dataset of indoor and outdoor PM time series utilized in this study was previously utilized by us and is detailed inHussain et al. (Citation2020a).
Feature Extraction
In machine learning, the most important step is to compute the most relevant features. Researchers in the past computed the most relevant features. To detect the colon cancer, the authors (Ferland et al. Citation2017; Rathore et al. Citation2014) computed the hybrid features. Recently, Hussain and coworkers computed multimodal features and texture features to compute the various pathologies in signal and imaging problems (Abbasi et al. Citation2020; A multi-modal, multi-atlas-based approach for Alzheimer detection via machine learning, 28 Citation2018; Anjum et al. Citation2021; Hussain Citation2020b, Citation2018; Iqbal et al. Citation2021; Lal et al. Citation2021). Moreover, Hussain et al. (Citation2020a) computed multimodal features from time domain, statistical, and entropy-based features to detect the PM time series. Feature extraction is an important step successfully utilized in most of the image and signal processing problems (Barbhuiya, Karsh, and Jain Citation2021; Li, Huang, and Srivastava Citation2021; Xie et al. Citation2021). We utilized the features from time domain, frequency domain, statistical, entropy, and wavelet-based complexity features as detailed by Hussain et al. (Citation2020a).
Feature Ranking Algorithms
The feature ranking algorithm is used to rank the importance of features using supervised ranking algorithms. This ranking is based on the scoring values of the algorithms (H. Wang, Khoshgoftaar, and Gao Citation2010). Different ranking algorithmic methods including wrapper are utilized (Shakir et al. Citation2019). Recently, MATLAB toolbox with a total of 30 FIR methods have been utilized by Yu et al. (Citation2019) to integrate the paves to select the features and diagnose intelligently the real-world applications. We computed the feature importance of the multimodal features extracted from PM time series. We used EROC to compute the extracted feature importance. The EROC was computed as area between the empirical receiver operating characteristic curve (EROC) and random classifier slope. The higher EROC value indicates the more important feature that contains the most important information to further unfold the nonlinear and hidden information of the data of interest. After extracting the features, the important step is to apply the feature selection methods to rank the important features (ROFFO et al. Citation2020; Teng et al. Citation2019; Venkatesh and Anuradha Citation2019; Yu et al. Citation2019).
Bayesian Network Analysis
The Bayesian analysis is successfully utilized in various signal and image processing applications (Chen et al. Citation2021; Kottke et al. Citation2021; Ni, Zhang, and Liu Citation2022; Yarnell et al. Citation2021). The causal effect and their relationship are determined using Bayesian method and directed acyclic graph (DAG) (Pearl Citation1986). Consider X = {X1, X2, X3, … … Xn} a set of m-dimensional variables, the BN is defined with couplet , where G denotes the DAG and P denotes the set of parameters that quantify the network that contains the probabilities of each possible value of xi for each variable Xi. Mathematically:
Here, represents a set of parent variables of
for direct acyclic graph G. The posterior probability is thus computed using this algorithm through inference of variable of interest.
BayesiaLab V10 was employed for detailed analysis (Bayesia Citation2017). The Shannon entropy (Shannon Citation1948) was computed using:
The MI algorithm calculates the difference between marginal entropy of the target variable and conditional entropy of the predicted variable (Shannon Citation1948); mathematically,
which is equivalent to:
Moreover, conditional mutual information (CMI) is defined as:
The p (X, Y) shows joint probability distribution of X and Y. However, p(X) and p (Y) indicate the marginal distribution of X and Y, respectively. The relevant Gaussian distribution of co-variance matrix variables X1, X2, X3, … . Xn (Xiao et al. Citation2016) can be computed as:
By applying the mathematical transformation function, the MI and CMI2 can be calculated using the following formulae:
To correct the underestimation of conditional Mutual Information 1 (CMI1) (Janzing et al. Citation2013), the CMI2 is used to integrate the interventional probability and KL divergence (Kullback and Leibler Citation1951).
Using the Gaussian distribution, the CMI2 can be easily calculated with the same hypothesis.
The relationship between the two random variables can be computed using the Pearson’s correlation coefficient (PCC) initially proposed by Pearson (“VII. Mathematical contributions to the theory of evolution. – III. Regression, heredity, and panmixia Citation1896) to measure the strength and direction of relationship (J. Lee and Nicewander Citation1988). PCC is utilized in many applications including classification (Tyagi Citation2015), data analysis (Tyagi Citation2015), biological research (Puth, Neuhäuser, and Ruxton Citation2014), decision-making and clustering (Liao, Xu, and Zeng Citation2015), and (Puth, Neuhäuser, and Ruxton Citation2014) finance analysis (Kim, Kim, and Ergün Citation2015). Mathematically, it can be computed using the following formula.
Here, represents the mean of X, and
represents the mean of Y.
The coefficient ranges from −1 to 1. The PCC provides the strength of linear relationships between the two random variables X and Y. The value denotes the degree of relationship, positive sign shows the direct relationship, and negative sign denotes the inverse relationship. The zero value shows that there is no correlation. The value of
closer to 1 indicates the stronger relationship.
Statistical Analysis
We computed the multimodal features from indoor and outdoor PM time series using MATLAB. We then provided the feature matrix to BayesiaLab for further detailed analysis. We conducted the analysis using BayesiaLab 10.0. We used the BayesiaLab with minimum description length (MDL) of candidate network in its score-based algorithm to compare the BN structure (Conrady and Jouffe Citation2015). The statistical independence test (GKL-test; p-values >0.05) was used to validate the connections among the descriptors, which were identified by the learning algorithm. The p-values or independence probabilities were utilized to check the significance of each individual relationship between the nodes or between the nodes and the target node (Harris et al. Citation2014; Thai et al. Citation2012).
Exploratory Analysis of the Unsupervised Network
The exploratory analysis can be utilized to determine the potential relationship between variables of interest (Moreno-Jiménez et al. Citation2011). We can further explore the global analysis of problem of interest by computing influence between nodes and influence of nodes under investigation. We build our model by learning unsupervised learning algorithm utilizing maximum spanning tree algorithm approach developed in BayesiaLab V10 (Wilhere Citation2012). We also computed maximum spanning tree (MWST). A lowest value of MDL indicates best trade-off between complexity and data representation.
Sensitivity Analysis
A detailed sensitivity analysis was performed to check the relationship among the nodes in the selected network. To understand the relationship between the nodes, we computed the highest and lowest values of PM, MI, and KL, and node force between the nodes was examined globally on the network. The probabilistic dependencies were computed using MI between the nodes in the network. The tornado plots are used to display the influential knowledge of each node using sensitivity analysis on probability of each descriptor, and maximum strength of individual relationship between the nodes and descriptors was computed. The lowest and highest probability values for each node are displayed from the tornado plots to achieve hard evidence placed on the corresponding descriptor state . The confidence and consistency levels of the sensitivity analysis using the BN model are verified by validating the model (Goerlandt and Montewka Citation2015; Hänninen and Kujala Citation2012; Tanackov et al. Citation2018) to verify different conditions.
Segment Profile Analysis of Energy
The analysis was also done using segment profile analysis using radar chart for normalized mean values conditionally to energy for all other multimodal features. The significance was tested using Bayesian test (Best) and NHST t-test (a frequentist test). Using NHST t-test, the two-tailed t-test is utilized for null hypothesis significance testing. The Bayesian (Best) test is detailed by John K. Kruschke (Kruschke Citation2013), which follow the student’s t-distribution. Moreover, 95% confidence interval (CI) is utilized. When the mean values are estimated significant, a square is added next to the label.
Results and Discussions
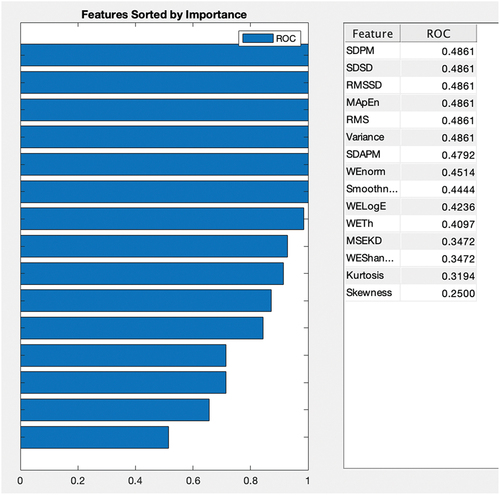
In this study, we first computed the time domain, frequency domain, and entropy-based complexity features from PM time-series data. The features were ranked using ROC. The SDPM, SDSD, RMSSD, MApEn, RMS, and variance yielded the highest ROC (0.4861). For the rest of the analysis, we have chosen the SDPM as our target variable.
shows the ranking of multimodal features using ROC values. The higher ROC value indicates the more important feature. The higher entropy value indicates the more complex and important feature. We extracted the features from time domain, frequency domain, and entropy-based complexity features from PM time series of indoor and outdoor environment. The features are ranked without utilizing any unsupervised or supervised machine-learning algorithm. A specific method that ranks the features is based on the assigned score values (H. Wang, Khoshgoftaar, and Gao Citation2010). Finally, based on these scores, the features are ranked and the features with redundant information are further eliminated for classification. In this study, we ranked the multimodal features based on ROC values developed in MATLAB diagnostic tool.
Figure 2. Feature ranking based on entropy values.
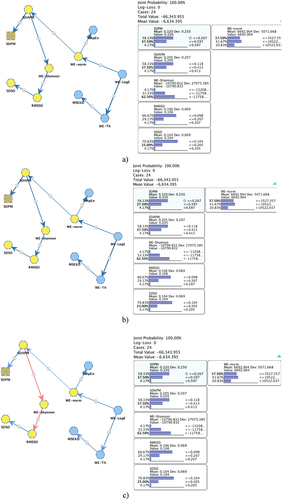
depicts the relationship analysis using BI methods including the MI, KL, and PC. The bold lines represent the stronger relationship, the lighter lines indicate the smaller relationship. The blue color indicates the positive relationship, whereas the red color indicates the negative relationship. Moreover, the arrows indicate the relationship. We kept our target node as SDPM using MI; probability of occurrence for the state ≤0.267 (58.33%), state ≤0.597 (37.50%), and state >0.597 (4.17%) with joint probability for all states is 100%. The probability distribution with other extracted nodes at selected states is depicted in (a–c).
Figure 3. Relationship analysis using different Bayesian inference approaches such as (a) mutual information (MI), (b) Kullback–Leibler (KL) divergence, and (c) Pearson’s correlation by applying the unsupervised learning using maximum spanning tree and selecting SDPM as our target node.
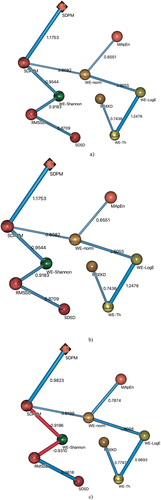
represents the 3D mapping arc analysis to show the relationship among the multimodal extracted features. The nodes represent the features and lines represent the relationship between the nodes. The strength of relationship is denoted by the width of line. The blue color represents the positive relationship, whereas the red color denotes the negative relationship. Using the MI, the highest strength of relationship was obtained between the nodes followed by (SDAPM
SDPM, 1.1753),
and so on as reflected in . shows the association between the nodes using KL. The highest strength of relationship was yielded between the nodes
followed by
1.1753),
, and so on. denotes the relationship between nodes using Pearson’s correlation. The highest strength of relationship was yielded between the nodes (WE - LogE
followed by
and so on. The highest negative relationship was yielded between the nodes
followed by
Shannon, – 9186) and so on. All other nodes exhibit the positive relation, where a week relationship was yielded between the nodes cluster WE-norm and SDAPM. The strength of relationship using these methods is also reflected in . Moreover, the highly significant results (p-value <0.005) were yielded for all
relationships except the last two pairs.
Table 1. Parent–child relationship on extracted multimodal features to distinguish the particulate matter (indoor and outdoor) time series using mutual information (MI), Kullback–Leibler (KL) divergence, and Pearson’s correlation.
Figure 4. Arc analysis 3D mapping to determine the relationship among the nodes: (a) mutual information, (b) Kullback–Leibler (KL) divergence, and (c) Pearson’s correlation.
reflects the incoming, outgoing, and total force of different extracted multimodal features from PM time-series data. The SDAPM node has outgoing force (22.1297), incoming force (0.6082), and total force (2.7379); the eWE-Norm node has outgoing force (1.2634), incoming (0.8055), and total force (2.0688) and so on. The highest outgoing and total force was yielded by the node SDAPM such as 2.1297 and 2.7379, respectively. The highest incoming force was yielded by the node WE-Th (1.2478).
Table 2. Node force of extracted multimodal features from particulate time-series data.
We first extracted the multimodal features of PM time series. We then ranked the features before applying the BI approach. The SDAPM was highly ranked features measured using EROC and random classifier slope, which was selected as our target for further Bayesian analysis. We computed the association of top ranked SDAPM feature with other features to further unfold the association among the features. There were four states represented by ≤0.267, ≤0.597, and >0.59 with the highest data points to lowest data points in ascending order, respectively, as represented in the Mosaic association graph in and .
Table 3. Analysis of target node SDAPM with other extracted nodes.
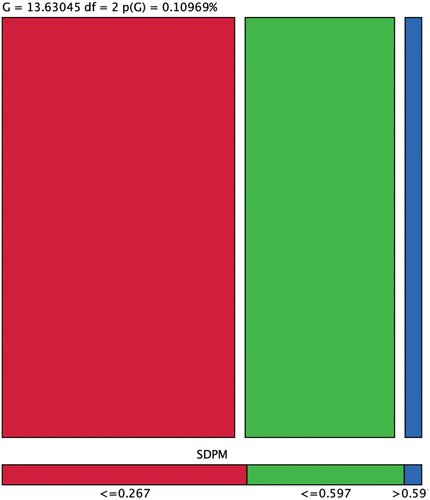
Figure 5. Analysis of target node energy with other extracted nodes using mosaic graph based on selected target node SDPM and predictions of occurrence made against each state ≤0.267, ≤0.597, and >0.59.
reflects the overall analysis of target node SDAPM with other nodes. All nodes exhibit the highly significant results.
Table 4. Overall analysis of target node SDAPM with other extracted multimodal features.
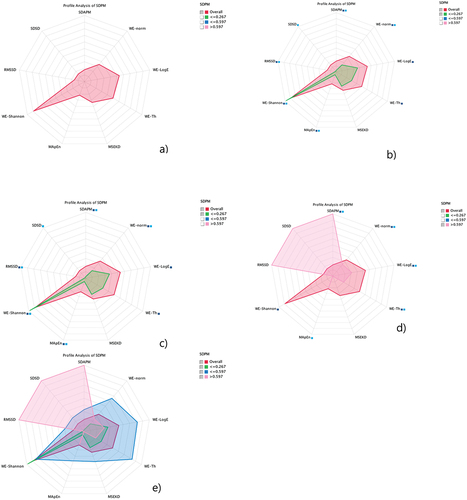
depicts the analysis of association graph for segment profile analysis of top ranked target node with other extracted multimodal features using the radar chart, which reflect the distributions based on 1–12 clock hours. reflects the overall probability, and we used the NHST t-test and Bayesian test to find the significance to distinguish with other different states such as (a) ≤0.267, (b) ≤0.597, and (c) >0.597 as reflected in . The highest significance using both the tests is reflected by double boxes blue and light blue, where the significance with any one test is reflected by single box. The node with no box shows no significance at all with any test.
Figure 6. Association graph of segment profile analysis of SDAPM node with other extracted multimodal features using radar chart graph at different selected states: (a) overall and overall with selected states (b) ≤ 0.267, (c) ≤0.597, and (d) >0.597; overall with (e) all selected states.
The network performance of the selected target node SDAPM with other selected nodes yielded the highest predictions with 100% reliability and precision for all the selected states as shown in . A relative Gini index of 99.49% and ROC index of 100% were obtained as reflected in .
Figure 7. Network performance target evaluation SDAPM node with other selected nodes: (a) Occurrence, reliability, and precision report; (b) gain report of state ≤0.267; and (c) ROC index of state ≤0.267.
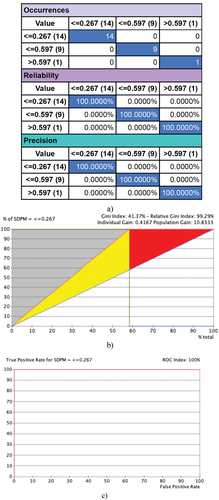
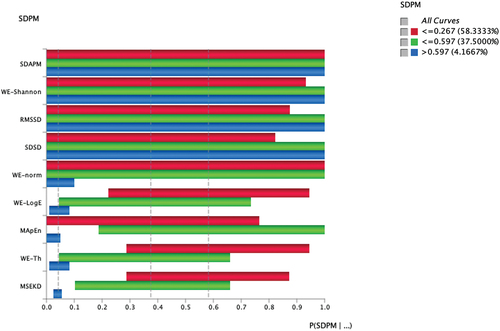
Using the tornado graph as reflected in , we visualize the maximum deltas in the posterior probabilities of the target states, and hard evidence is set on the selected variables. The strong deltas are shown at the top of the graph. The highest association was yielded with SDAPM, WE-Shannon, RMSSD, and SDSD for state ≤0.267 (58.33%) followed by cluster state ≤0.597 and >0.597 as reflected in . This indicates that high top ranked SDAPM feature prevails high associations with SDPM, WE-Shannon, RMSSD, and SDSD, which can be used as a better predictor for improved analysis and mass concentration of PM time series.
Figure 8. Tornado diagram of posterior probabilities to compute the significance of SDAPM node with all nodes at selected cluster states (≤0.267, ≤0.597, and > 0.597).
Most of the studies employed prediction methods. However, after extracting hand-crafted features, ranking of features and computing associations among features can further help the concerned health departments and researchers to further improve the health-care systems and environments by understanding the association and strength of relationship among the extracted features. Recently, the researchers developed different methods to predict the PMs using classification methods. Hussain et al. (Citation2020b) applied machine-learning classification methods to distinguish the indoor PM time series. Recently, Mengash et al. (Citation2022) improved the classification accuracy by further optimizing the robust machine-learning algorithms and applying feature selection methods. Doreswamy, Gad, and Gad (Citation2020) applied regression methods to forecasting ahead the concentration of PM time series. Moreover, Doreswamy, Gad, and M, Y (Citation2021) utilized spatiotemporal clustering to investigate the PM time series. Hosahalli and Gad (Citation2018) applied methods to handle the missing data for weather station data. Likewise, Doreswamy, Gad, and Gad (Citation2020) employed Seasonal Autoregressive Integrated Moving Average (SARIMA) model to monitor the air quality. Most of these studies are utilizing classification, regression, and forecasting methods. However, our direction is to unfold the nonlinear hidden dynamics from extracted multimodal features from indoor and outdoor PM concentration time series. We first extracted multimodal features from time domain (to capture the time variations), frequency domain (to capture the spectral variations), entropy, and wavelet-based features (to capture the nonlinear hidden dynamics); the same features were previously utilized for classification, which provided the 100% classification performance. However, accurate classification cannot convey much information for concerned health-care professionals, instead to provide them the importance of features, along with the association among features that can be helpful in making the decision. We previously investigated the association among morphological features to predict the prostate cancer (Lal Hussain et al. Citation2019). In this study, after ranking the features and finding the association among features, we investigated a detailed comprehensive analysis of target variables with other computed variables as reflected in radar graph that how much important significance was found. We also computed the impact in terms of tornado diagram to see the overall impact of target variable with other features. The strength of relationship and other important measures further unfold the nonlinear hidden dynamics present in the indoor and outdoor PM time series.
Conclusions
Currently, the PMs spreading from diverse sources severely affect the human health. The different sources include anthropogenic and organic, chemical, and soluble compositions. The researchers are devising different methods to study the dynamics of PM time series. This study quantifies the associations computed between the multimodal features extracted from PM time-series data utilizing BI approach. Previous studies utilized mostly the classification and regression methods. Recently, we applied the BI method and computed the association among the multimodal features, sensitivity analysis, target node analysis, and all computed node network analysis for deeper understanding the hidden dynamics to further unfold the nonlinear dynamics in PM time series. The results reveal that the proposed approach can be very helpful for health and environment professionals to take precautionary measures to reduce the health risk due to the PM time series. Currently, we have limited data of PM time series; however, in future, we will acquire more data from diverse sources including construction areas, crush plants, heavy traffic zones, farming lands and cultivations, and wooden combustion areas. We will also extend our analysis with more in-depth analysis of PM time series. We will further apply the segment analysis, target profile analysis and other posterior probability methods, tree optimizations, function optimization, and posterior mean analysis.
Acknowledgments
Not applicable
Disclosure statement
No potential conflict of interest was reported by the authors.
Additional information
Funding
References
- Abbasi, A. A., L. Hussain, I. A. Awan, I. Abbasi, A. Majid, M. S. A. Nadeem, and Q.-A.-A. Chaudhary. 2020. Detecting prostate cancer using deep learning convolution neural network with transfer learning approach. Cognitive Neurodynamics 14 (4):523–3075. doi:10.1007/s11571-020-09587-5.
- Acciani, T. H., E. B. Brandt, G. K. Khurana Hershey, and T. D. Le Cras. 2013. Diesel exhaust particle exposure increases severity of allergic asthma in young mice. Clinical & Experimental Allergy 43 (12):1406–18. doi:10.1111/cea.12200.
- Achilleos, S., M.-A. Kioumourtzoglou, C.-D. Wu, J. D. Schwartz, P. Koutrakis, and S. I. Papatheodorou. 2017. Acute effects of fine particulate matter constituents on mortality: A systematic review and meta-regression analysis. Environment International 109:89–100. doi:10.1016/j.envint.2017.09.010.
- Albalak, R., G. J. Keeler, A. R. Frisancho, and M. Haber. 1999. Assessment of PM10 concentrations from domestic biomass fuel combustion in two rural Bolivian highland villages. Environmental Science and Technology 33 (15):2505–09. doi:10.1021/es981242q.
- Amaral, C. B. D., G. H. F. D. Oliveira, K. Eghrari, R. Buzinaro, and G. V. Môro. 2019. Bayesian network: A simplified approach for environmental similarity studies on maize. Crop Breeding and Applied Biotechnology 19 (1):70–76. doi:10.1590/1984-70332019v19n1a10.
- Ancelet, T., P. K. Davy, W. J. Trompetter, A. Markwitz, and D. C. Weatherburn. 2013. Carbonaceous aerosols in a wood burning community in rural New Zealand. Atmospheric Pollution Research 4 (3):245–49. doi:10.5094/APR.2013.026.
- Andersen, Z. J., P. Wahlin, O. Raaschou-Nielsen, T. Scheike, and S. Loft. 2007. Ambient particle source apportionment and daily hospital admissions among children and elderly in Copenhagen. Journal of Exposure Science & Environmental Epidemiology 17 (7):625–36. doi:10.1038/sj.jes.7500546.
- Anjum, S., L. Hussain, M. Ali, M. H. Alkinani, W. Aziz, S. Gheller, A. A. Abbasi, A. R. Marchal, H. Suresh, and T. Q. Duong. 2021. Detecting brain tumors using deep learning convolutional neural network with transfer learning approach. International Journal of Imaging Systems and Technology 32 (February):1–17. doi:10.1002/ima.22641.
- Asim, Y., Raza, B., Malik, A. K., Rathore, S., Hussain, L., & Iftikhar, M. A. 2018. A multi‐modal, multi‐atlas‐based approach for Alzheimer detection via machine learning. International Journal of Imaging Systems and Technology 28(2), 113‐123.
- Attfield, M. D., P. L. Schleiff, J. H. Lubin, A. Blair, P. A. Stewart, R. Vermeulen, J. B. Coble, and D. T. Silverman. 2012. The diesel exhaust in miners study: A cohort mortality study with emphasis on lung cancer. JNCI: Journal of the National Cancer Institute 104 (11):869–83. doi:10.1093/jnci/djs035.
- Barbhuiya, A. A., R. K. Karsh, and R. Jain. 2021. CNN based feature extraction and classification for sign language. Multimedia Tools and Applications 80 (2):3051–69. doi:10.1007/s11042-020-09829-y.
- Bayesia, S. C. (2017). BayesiaLab7. Bayesia USA 305 Lockhart Court Franklin, TN 37069 USA.
- Chan, -C.-C., and H.-C. Ng. 2011. A case-crossover analysis of Asian dust storms and mortality in the downwind areas using 14-year data in Taipei. Science of the Total Environment 410-411 (410– 411):47–52. doi:10.1016/j.scitotenv.2011.09.031.
- Chen, D., D. Wang, Y. Zhu, and Z. Han. 2021. Digital twin for federated analytics using a Bayesian approach. IEEE Internet of Things Journal 8 (22):16301–12. doi:10.1109/JIOT.2021.3098692.
- Cheng, M.-F., S.-C. Ho, H.-F. Chiu, T.-N. Wu, P.-S. Chen, and C.-Y. Yang. 2008. Consequences of exposure to Asian dust storm events on daily pneumonia hospital admissions in Taipei, Taiwan. Journal of Toxicology and Environmental Health, Part A 71 (19):1295–99. doi:10.1080/15287390802114808.
- Chiu, H.-F., -M.-M. Tiao, S.-C. Ho, H.-W. Kuo, T.-N. Wu, and C.-Y. Yang. 2008. Effects of Asian dust storm events on hospital admissions for chronic obstructive pulmonary disease in Taipei, Taiwan. Inhalation Toxicology 20 (9):777–81. doi:10.1080/08958370802005308.
- Conrady, S., and L. Jouffe. 2015. Bayesian networks and BayesiaLab: A practical introduction for researchers. Franklin: Bayesia USA.
- Corrales, D. C. 2015. Toward detecting crop diseases and pest by supervised learning. Ingenieria Y Universidad 19 (1):207. doi:10.11144/Javeriana.iyu19-1.tdcd.
- Costa, S., J. Ferreira, C. Silveira, C. Costa, D. Lopes, H. Relvas, C. Borrego, P. Roebeling, A. I. Miranda, and J. Paulo Teixeira. 2014. Integrating health on air quality assessment—Review report on health risks of two major european outdoor air pollutants: PM and NO 2. Journal of Toxicology and Environmental Health, Part B 17 (6):307–40. doi:10.1080/10937404.2014.946164.
- de Longueville, F., P. Ozer, S. Doumbia, and S. Henry. 2013. Desert dust impacts on human health: An alarming worldwide reality and a need for studies in West Africa. International Journal of Biometeorology 57 (1):1–19. doi:10.1007/s00484-012-0541-y.
- Doreswamy, H. K. K. S., I. Gad, and I. Gad. 2020. Time series analysis for prediction of PM 2.5 using seasonal autoregressive integrated moving average (Sarima) model on Taiwan air quality monitoring network data. Journal of Computational and Theoretical Nanoscience 17 (9):3964–69. doi:10.1166/jctn.2020.8997.
- Doreswamy, K. S., H. Gad, and K. M, Y. (2021). Spatio-temporal clustering analysis for air pollution particulate matter (pm 2.5) using a deep learning model. 2021 International Conference on Computing, Communication, and Intelligent Systems (ICCCIS), Greater Noida, India, 529–35. 10.1109/ICCCIS51004.2021.9397129
- Duncan, B. N., J. J. West, Y. Yoshida, A. M. Fiore, and J. R. Ziemke. 2008. The influence of European pollution on ozone in the near East and Northern Africa. Atmospheric Chemistry and Physics 8 (8):2267–83. doi:10.5194/acp-8-2267-2008.
- Elliott, C. T., S. B. Henderson, and V. Wan. 2013. Time series analysis of fine particulate matter and asthma reliever dispensations in populations affected by forest fires. Environmental Health 12 (1):11. doi:10.1186/1476-069X-12-11.
- Ema, M., M. Naya, M. Horimoto, and H. Kato. 2013. Developmental toxicity of diesel exhaust: A review of studies in experimental animals. Reproductive Toxicology 42:1–17. doi:10.1016/j.reprotox.2013.06.074.
- Ershadi, M. M., and A. Seifi. 2020. An efficient Bayesian network for differential diagnosis using experts’ knowledge. International Journal of Intelligent Computing and Cybernetics 13 (1):103–26. doi:10.1108/IJICC-10-2019-0112.
- Ferland, R. J., J. Smith, D. Papandrea, J. Gracias, L. Hains, S. B. Kadiyala, B. O’Brien, E. Y. Kang, B. S. Beyer, and B. J. Herron. 2017. Multidimensional genetic analysis of repeated seizures in the hybrid mouse diversity panel reveals a novel epileptogenesis susceptibility locus. G3 (Bethesda Md) g3.117.042234. doi:10.1534/g3.117.042234.
- Gandhi, N., L. J. Armstrong, and O. Petkar (2016). Predicting rice crop yield using Bayesian networks. 2016 International Conference on Advances in Computing, Communications and Informatics (ICACCI), Jaipur, India, 795–99. 10.1109/ICACCI.2016.7732143
- Ghio, A. J., S. T. Kummarapurugu, H. Tong, J. M. Soukup, L. A. Dailey, E. Boykin, M. Ian Gilmour, P. Ingram, V. L. Roggli, H. L. Goldstein, et al. 2014. Biological effects of desert dust in respiratory epithelial cells and a murine model. Inhalation Toxicology 26 (5):299–309. doi:10.3109/08958378.2014.888109.
- GLASIUS, M., M. Ketzel, P. WAHLIN, B. Jensen, J. Monster, R. Berkowicz, and F. Palmgren. 2006. Impact of wood combustion on particle levels in a residential area in Denmark. Atmospheric Environment 40 (37):7115–24. doi:10.1016/j.atmosenv.2006.06.047.
- Goerlandt, F., and J. Montewka. 2015. Maritime transportation risk analysis: Review and analysis in light of some foundational issues. Reliability Engineering & System Safety 138:115–34. doi:10.1016/j.ress.2015.01.025.
- Goudie, A. S. 2014. Desert dust and human health disorders. Environment International 63:101–13. doi:10.1016/j.envint.2013.10.011.
- Grange, S. K., J. A. Salmond, W. J. Trompetter, P. K. Davy, and T. Ancelet. 2013. Effect of atmospheric stability on the impact of domestic wood combustion to air quality of a small urban township in winter. Atmospheric Environment 70:28–38. doi:10.1016/j.atmosenv.2012.12.047.
- Griffin, D. W. 2007. Atmospheric movement of microorganisms in clouds of desert dust and implications for human health. Clinical Microbiology Reviews 20 (3):459–77. doi:10.1128/CMR.00039-06.
- Hänninen, M., and P. Kujala. 2012. Influences of variables on ship collision probability in a Bayesian belief network model. Reliability Engineering & System Safety 102:27–40. doi:10.1016/j.ress.2012.02.008.
- Harris, M., K. Bhuvaneshwar, T. Natarajan, L. Sheahan, D. Wang, M. G. Tadesse, I. Shoulson, R. Filice, K. Steadman, M. J. Pishvaian, et al. 2014. Pharmacogenomic characterization of gemcitabine response – A framework for data integration to enable personalized medicine. Pharmacogenetics and Genomics 24 (2):81–93. doi:10.1097/FPC.0000000000000015.
- Hong, Y.-C., X.-C. Pan, S.-Y. Kim, K. Park, E.-J. Park, X. Jin, S.-M. Yi, Y.-H. Kim, C.-H. Park, S. Song, et al. 2010. Asian dust storm and pulmonary function of school children in Seoul. Science of the Total Environment 408 (4):754–59. doi:10.1016/j.scitotenv.2009.11.015.
- Hosahalli, D., and I. Gad (2018). A generic approach of filling missing values in NCDC weather stations data. 2018 International Conference on Advances in Computing, Communications and Informatics (ICACCI), Bangalore, India, 143–49. 10.1109/ICACCI.2018.8554394
- Hosgood, H. D., P. Boffetta, S. Greenland, Y.-C. A. Lee, J. McLaughlin, A. Seow, E. J. Duell, A. S. Andrew, D. Zaridze, N. Szeszenia-Dabrowska, et al. 2010. In-home coal and wood use and lung cancer risk: a pooled analysis of the international lung cancer consortium. Environmental Health Perspectives 118 (12):1743–47. doi:10.1289/ehp.1002217.
- Hussain, L., A. Ali, S. Rathore, S. Saeed, A. Idris, M. U. Usman, M. A. Iftikhar, and D. Y. Suh. 2019. Applying Bayesian network approach to determine the association between morphological features extracted from prostate cancer images. IEEE Access 7:1586–601. doi:10.1109/ACCESS.2018.2886644.
- Hussain, L., W. Aziz, S. Saeed, I. A. Awan, A. A. Abbasi, and N. Maroof. 2020a. Arrhythmia detection by extracting hybrid features based on refined Fuzzy entropy (FuzEn) approach and employing machine learning techniques. Waves in Random and Complex Media 30(4. doi:10.1080/17455030.2018.1554926.
- Hussain, L., W. Aziz, S. Saeed, M. Rafique, M. S. A. Nadeem, S.-O. Shim, S. Aftar, and J.-R. Pirzada. 2020a. Extracting mass concentration time series features for classification of indoor and outdoor atmospheric particulates. Acta Geophysica 68 (3):945–63. doi:10.1007/s11600-020-00443-y.
- Hussain, L., W. Aziz, S. Saeed, M. Rafique, M. S. A. Nadeem, S.-O. Shim, S. Aftar, and J.-R. Pirzada. 2020b. Extracting mass concentration time series features for classification of indoor and outdoor atmospheric particulates. Acta Geophysica 68 (3):945–63. doi:10.1007/s11600-020-00443-y.
- Hussain, L., K. J. Lone, I. A. Awan, A. A. Abbasi, and J.-R. Pirzada. 2020b. Detecting congestive heart failure by extracting multimodal features with synthetic minority oversampling technique (SMOTE) for imbalanced data using robust machine learning techniques. Waves in Random and Complex Media 1–24. doi:10.1080/17455030.2020.1810364.
- Hussain, L., S. Saeed, I. A. Awan, and A. Idris. 2018. Multiscaled complexity analysis of EEG epileptic seizure using entropy-based techniques. Archives of Neuroscience 5 (1):1–11. doi:10.5812/archneurosci.61161.
- Iqbal, S., G. F. Siddiqui, A. Rehman, L. Hussain, T. Saba, U. Tariq, and A. A. Abbasi. 2021. Prostate cancer detection using deep learning and traditional techniques. IEEE Access 9:27085–100. doi:10.1109/ACCESS.2021.3057654.
- Janzing, D., D. Balduzzi, M. Grosse-Wentrup, and B. Schölkopf. 2013. Quantifying causal influences. Annals of Statistics 41 (5):2324–58. doi:10.1214/13-AOS1145.
- Kado, N. Y., S. D. Colome, M. T. Kleinman, D. P. H. Hsieh, P. Jaques, N. Y. Kado, S. D. Colome, M. T. Kleinman, D. P. H. Hsieh, P. Jaques, et al. 1994. Indoor-outdoor concentrations and correlations of PM10-associated mutagenic activity in nonsmokers’ and asthmatics’ homes. Environmental Science and Technology 28 (6):1073–78. doi:10.1021/es00055a016.
- Kaikkonen, L., T. Parviainen, M. Rahikainen, L. Uusitalo, and A. Lehikoinen. 2021. Bayesian networks in environmental risk assessment: A review. Integrated Environmental Assessment and Management 17 (1):62–78. doi:10.1002/ieam.4332.
- Kanatani, K. T., I. Ito, W. K. Al-Delaimy, Y. Adachi, W. C. Mathews, and J. W. Ramsdell. 2010. Desert dust exposure is associated with increased risk of asthma hospitalization in children. American Journal of Respiratory and Critical Care Medicine 182 (12):1475–81. doi:10.1164/rccm.201002-0296OC.
- Kim, Y., T. H. Kim, and T. Ergün. 2015. The instability of the pearson correlation coefficient in the presence of coincidental outliers. Finance Research Letters 13:243–57. doi:10.1016/j.frl.2014.12.005.
- Kocian, A., D. Massa, S. Cannazzaro, L. Incrocci, S. Di Lonardo, P. Milazzo, and S. Chessa. 2020. Dynamic Bayesian network for crop growth prediction in greenhouses. Computers and Electronics in Agriculture 169:105167. doi:10.1016/j.compag.2019.105167.
- Kottke, D., M. Herde, C. Sandrock, D. Huseljic, G. Krempl, and B. Sick. 2021. Toward optimal probabilistic active learning using a Bayesian approach. Machine Learning 110 (6):1199–231. doi:10.1007/s10994-021-05986-9.
- Kruschke, J. K. 2013. Bayesian estimation supersedes the t test. Journal of Experimental Psychology: General 142 (2):573–603. doi:10.1037/a0029146.
- Kullback, S., and R. A. Leibler. 1951. On information and sufficiency. The Annals of Mathematical Statistics 22 (1):79–86. doi:10.1214/aoms/1177729694.
- Laden, F., L. M. Neas, D. W. Dockery, and J. Schwartz. 2014. Association of fine particulate matter from different sources with daily mortality in six association of fine particulate matter from different sources with daily mortality in six U . S . Cities 108 (10):941–47. doi:10.1289/ehp.00108941.
- Lal, H., M. S. Almaraashi, W. Aziz, N. Habib, and S.-U.-R. Saif Abbasi. 2021. Machine learning-based lungs cancer detection using reconstruction independent component analysis and sparse filter features. Waves in Random and Complex Media 1–26. doi:10.1080/17455030.2021.1905912.
- Laurila-Pant, M., S. Mäntyniemi, R. Venesjärvi, and A. Lehikoinen. 2019. Incorporating stakeholders’ values into environmental decision support: A Bayesian belief network approach. Science of the Total Environment 697:134026. doi:10.1016/j.scitotenv.2019.134026.
- Lee, H., Y. Honda, Y.-H. Lim, Y. L. Guo, M. Hashizume, and H. Kim. 2014. Effect of Asian dust storms on mortality in three Asian cities. Atmospheric Environment 89:309–17. doi:10.1016/j.atmosenv.2014.02.048.
- Lee, H., H. Kim, Y. Honda, Y.-H. Lim, and S. Yi. 2013. Effect of Asian dust storms on daily mortality in seven metropolitan cities of Korea. Atmospheric Environment 79:510–17. doi:10.1016/j.atmosenv.2013.06.046.
- Lee, J.-W., and -K.-K. Lee. 2014. Effects of Asian dust events on daily asthma patients in Seoul, Korea. Meteorological Applications 21 (2):202–09. doi:10.1002/met.1351.
- Lee, C. K., and S. C. Lin. 2008. Chaos in air pollutant concentration (APC) time series. Aerosol and Air Quality Research 8 (4):381–91. doi:10.4209/aaqr.2008.09.0039.
- Lee, J., and W. A. Nicewander. 1988. Thirteen ways to look at the correlation coefficient. The American Statistician 42 (1):59–66.
- Lei, Y.-C., -C.-C. Chan, P.-Y. Wang, C.-T. Lee, and T.-J. Cheng. 2004. Effects of Asian dust event particles on inflammation markers in peripheral blood and bronchoalveolar lavage in pulmonary hypertensive rats. Environmental Research 95 (1):71–76. doi:10.1016/S0013-9351(03)00136-1.
- Li, W., Q. Huang, and G. Srivastava. 2021. Contour feature extraction of medical image based on multi-threshold optimization. Mobile Networks and Applications 26 (1):381–89. doi:10.1007/s11036-020-01674-5.
- Liao, H., Z. Xu, and X. J. Zeng. 2015. Novel correlation coefficients between hesitant fuzzy sets and their application in decision making. Knowledge-Based Systems 82:115–27. doi:10.1016/j.knosys.2015.02.020.
- Lipsett, M., S. Hurley, and B. Ostro. 1997. Air pollution and emergency room visits for asthma in Santa Clara County, California. Environmental Health Perspectives 105 (2):216–22. doi:10.1289/ehp.97105216.
- Lu, W., N. K. Newlands, O. Carisse, D. E. Atkinson, and A. J. Cannon. 2020. Disease risk forecasting with Bayesian learning networks: Application to grape powdery mildew (Erysiphe necator) in Vineyards. Agronomy 10 (5):622. doi:10.3390/agronomy10050622.
- Manners, S., R. Alam, D. A. Schwartz, and M. M. Gorska. 2014. A mouse model links asthma susceptibility to prenatal exposure to diesel exhaust. Journal of Allergy and Clinical Immunology 134 (1):63–72.e7. doi:10.1016/j.jaci.2013.10.047.
- Mar, T. F., K. Ito, J. Q. Koenig, T. V. Larson, D. J. Eatough, R. C. Henry, E. Kim, F. Laden, R. Lall, L. Neas, et al. 2006. PM source apportionment and health effects. 3. Investigation of inter-method variations in associations between estimated source contributions of PM2.5 and daily mortality in Phoenix, AZ. Journal of Exposure Science and Environmental Epidemiology 16 (4):311–20. doi:10.1038/sj.jea.7500465.
- Martínez, L., S. M. Monsalve, K. Yohannessen Vásquez, S. A. Orellana, J. K. Vergara, M. M. Mateo, R. C. Salazar, M. Fuentes Alburquenque, A. M. Alcaíno, R. Torres, et al. 2016. Indoor-outdoor concentrations of fine particulate matter in school building microenvironments near a mine tailing deposit. AIMS Environmental Science 3 (4):752–64. doi:10.3934/environsci.2016.4.752.
- Matti Maricq, M. 2007. Chemical characterization of particulate emissions from diesel engines: A review. Journal of Aerosol Science 38 (11):1079–118. doi:10.1016/j.jaerosci.2007.08.001.
- McGowan, J. A., P. N. Hider, E. Chacko, and G. I. Town. 2002. Particulate air pollution and hospital admissions in Christchurch, New Zealand. Australian and New Zealand Journal of Public Health 26 (1):23–29. doi:10.1111/j.1467-842X.2002.tb00266.x.
- Mengash, H. A., L. Hussain, H. Mahgoub, A. Al-Qarafi, M. K. Nour, R. Marzouk, S. A. Qureshi, and A. M. Hilal. 2022. Smart cities-based improving atmospheric particulate matters prediction using chi-square feature selection methods by employing machine learning techniques. Applied Artificial Intelligence 36 (1). doi: 10.1080/08839514.2022.2067647.
- Molnár, P., and G. Sallsten. 2013. Contribution to PM2.5 from domestic wood burning in a small community in Sweden. Environmental Science: Processes & Impacts 15 (4):833. doi:10.1039/c3em30864b.
- Moreno-Jiménez, E., C. García-Gómez, A. L. Oropesa, E. Esteban, A. Haro, R. Carpena-Ruiz, J. V. Tarazona, J. M. Peñalosa, and M. D. Fernández. 2011. Screening risk assessment tools for assessing the environmental impact in an abandoned pyritic mine in Spain. Science of the Total Environment 409 (4):692–703. doi:10.1016/j.scitotenv.2010.10.056.
- Musango, J. K., and C. Peter. 2007. A Bayesian approach towards facilitating climate change adaptation research on the South African agricultural sector. Agrekon 46 (2):245–59. doi:10.1080/03031853.2007.9523770.
- Naeher, L. P., M. Brauer, M. Lipsett, J. T. Zelikoff, C. D. Simpson, J. Q. Koenig, and K. R. Smith. 2007. Woodsmoke health effects: A review. Inhalation Toxicology 19 (1):67–106. doi:10.1080/08958370600985875.
- Naeher, L. P., K. R. Smith, B. P. Leaderer, L. Neufeld, and D. T. Mage. 2001. Carbon monoxide as a tracer for assessing exposures to particulate matter in wood and gas cookstove households of highland Guatemala. Environmental Science and Technology 35 (3):575–81. doi:10.1021/es991225g.
- Ni, Y.-C., Q.-W. Zhang, and J.-F. Liu. 2022. Dynamic performance investigation of a long-span suspension bridge using a Bayesian approach. Mechanical Systems and Signal Processing 168:108700. doi:10.1016/j.ymssp.2021.108700.
- Noah, T. L., H. Zhou, H. Zhang, K. Horvath, C. Robinette, M. Kesic, M. Meyer, D. Diaz-Sanchez, and I. Jaspers. 2012. Diesel exhaust exposure and nasal response to attenuated influenza in normal and allergic volunteers. American Journal of Respiratory and Critical Care Medicine 185 (2):179–85. doi:10.1164/rccm.201103-0465OC.
- Ostro, B. D., R. Broadwin, and M. J. Lipsett. 2000. Coarse and fine particles and daily mortality in the Coachella Valley, California: A follow-up study. Journal of Exposure Analysis and Environmental Epidemiology 10 (5):412–19. doi:10.1038/sj.jea.7500094.
- PARK, J. W., Y. H. LIM, S. Y. Kyung, C. H. AN, S. P. LEE, S. H. Jeong, and Y.-S. JU. 2005. Effects of ambient particulate matter on peak expiratory flow rates and respiratory symptoms of asthmatics during Asian dust periods in Korea. Respirology 10 (4):470–76. doi:10.1111/j.1440-1843.2005.00728.x.
- Pearl, J. 1986. Fusion, propagation, and structuring in belief networks. Artificial Intelligence 29 (3):241–88. doi:10.1016/0004-3702(86)90072-X.
- Peng, R. D., M. L. Bell, A. S. Geyh, A. McDermott, S. L. Zeger, J. M. Samet, and F. Dominici. 2009. Emergency admissions for cardiovascular and respiratory diseases and the chemical composition of fine particle air pollution. Environmental Health Perspectives 117 (6):957–63. doi:10.1289/ehp.0800185.
- Puth, M. T., M. Neuhäuser, and G. D. Ruxton. 2014. Effective use of pearson’s product-moment correlation coefficient. Animal Behaviour 93:183–89. doi:10.1016/j.anbehav.2014.05.003.
- Rathore, S., M. Hussain, M. Aksam Iftikhar, and A. Jalil. 2014. Ensemble classification of colon biopsy images based on information rich hybrid features. Computers in Biology and Medicine 47 (1):76–92. doi:10.1016/j.compbiomed.2013.12.010.
- Reed, M. D., Gigliotti, A. P., McDonald, J. D., Seagrave, J. C., Seilkop, S. K., & Mauderly, J. L. 2004. Health effects of subchronic exposure to environmental levels of diesel exhaust. Inhalation toxicology, 16(4), 177-193.
- Repace, J., and A. Lowrey. 1980. Indoor air pollution, tobacco smoke, and public health. Science 208 (4443):464–72. doi:10.1126/science.7367873.
- Roffo, G., Melzi, S., Castellani, U., Vinciarelli, A., & Cristani, M. (2020). Infinite feature selection: a graph-based feature filtering approach. IEEE Transactions on Pattern Analysis and Machine Intelligence, 43(12), 4396-4410.
- Sarnat, J. A., A. Marmur, M. Klein, E. Kim, A. G. Russell, S. E. Sarnat, J. A. Mulholland, P. K. Hopke, and P. E. Tolbert. 2008. Fine particle sources and cardiorespiratory morbidity: An application of chemical mass balance and factor analytical source-apportionment methods. Environmental Health Perspectives 116 (4):459–66. doi:10.1289/ehp.10873.
- Seagrave, J., J. D. McDonald, M. D. Reed, S. K. Seilkop, and J. L. Mauderly. 2005. Responses to subchronic inhalation of low concentrations of diesel exhaust and hardwood smoke measured in rat bronchoalveolar lavage fluid. Inhalation Toxicology 17 (12):657–70. doi:10.1080/08958370500189529.
- Shakir, H., Y. Deng, H. Rasheed, and T. M. R. Khan. 2019. Radiomics based likelihood functions for cancer diagnosis. Scientific Reports 9 (1):9501. doi:10.1038/s41598-019-45053-x.
- Shannon, C. E. 1948. A mathematical theory of communication. Bell System Technical Journal 27 (3):379–423. doi:10.1002/j.1538-7305.1948.tb01338.x.
- Silverman, D. T., C. M. Samanic, J. H. Lubin, A. E. Blair, P. A. Stewart, R. Vermeulen, J. B. Coble, N. Rothman, P. L. Schleiff, W. D. Travis, et al. 2012. The diesel exhaust in miners study: A nested case-control study of lung cancer and diesel exhaust. JNCI Journal of the National Cancer Institute 104 (11):855–68. doi:10.1093/jnci/djs034.
- Sperotto, A., J. L. Molina, S. Torresan, A. Critto, M. Pulido-Velazquez, and A. Marcomini. 2019. A Bayesian networks approach for the assessment of climate change impacts on nutrients loading. Environmental Science & Policy 100:21–36. doi:10.1016/j.envsci.2019.06.004.
- Sprigg, W. A., S. Nickovic, J. N. Galgiani, G. Pejanovic, S. Petkovic, M. Vujadinovic, A. Vukovic, M. Dacic, S. DiBiase, A. Prasad, et al. 2014. Regional dust storm modeling for health services: The case of valley fever. Aeolian Research 14:53–73. doi:10.1016/j.aeolia.2014.03.001.
- Takahashi, G., H. Tanaka, K. Wakahara, R. Nasu, M. Hashimoto, K. Miyoshi, H. Takano, H. Yamashita, N. Inagaki, and H. Nagai. 2010. Effect of diesel exhaust particles on house dust mite–induced airway eosinophilic inflammation and remodeling in mice. Journal of Pharmacological Sciences 112 (2):192–202. doi:10.1254/jphs.09276FP.
- TAM, W. W. S., T. W. WONG, A. H. S. WONG, and D. S. C. HUI. 2012. Effect of dust storm events on daily emergency admissions for respiratory diseases. Respirology 17 (1):143–48. doi:10.1111/j.1440-1843.2011.02056.x.
- Tanackov, I., Z. Janković, S. Sremac, M. Miličić, M. Vasiljević, J. Mihaljev-Martinov, and I. Škiljaica. 2018. Risk distribution of dangerous goods in logistics subsystems. Journal of Loss Prevention in the Process Industries 54:373–83. doi:10.1016/j.jlp.2018.03.013.
- Teng, L., Z. Feng, X. Fang, S. Teng, H. Wang, P. Kang, and Y. Zhang. 2019. Unsupervised feature selection with adaptive residual preserving. Neurocomputing 367:259–72. doi:10.1016/j.neucom.2019.05.097.
- Thai, H., D. S. Campo, J. Lara, Z. Dimitrova, S. Ramachandran, G. Xia, L. Ganova-Raeva, C.-G. Teo, A. Lok, and Y. Khudyakov. 2012. Convergence and coevolution of hepatitis B virus drug resistance. Nature Communications 3 (1):789. doi:10.1038/ncomms1794.
- Town, G. I. 2001. The health effects of particulate air pollution – A Christchurch perspective. Biomarkers 6 (1):15–18. doi:10.1080/135475001452742.
- Trompetter, W. J., S. K. Grange, P. K. Davy, and T. Ancelet. 2013. Vertical and temporal variations of black carbon in New Zealand urban areas during winter. Atmospheric Environment 75:179–87. doi:10.1016/j.atmosenv.2013.04.036.
- Tyagi, S. K. 2015. Correlation coefficient of dual hesitant fuzzy sets and its applications. Applied Mathematical Modelling 39 (22):7082–92. doi:10.1016/j.apm.2015.02.046.
- Venkatesh, B., and J. Anuradha. 2019. A review of feature selection and its methods. Cybernetics and Information Technologies 19 (1):3–26. doi:10.2478/cait-2019-0001.
- VII. Mathematical contributions to the theory of evolution.—III. Regression, heredity, and panmixia 1896. Philosophical transactions of the royal society of London. Series A, Containing Papers of a Mathematical or Physical Character 187: 253–318. 10.1098/rsta.1896.0007
- Wang, C.-H., C.-S. Chen, and C.-L. Lin. 2014. The threat of Asian dust storms on asthma patients: A population-based study in Taiwan. Global Public Health 9 (9):1040–52. doi:10.1080/17441692.2014.951871.
- Wang, Y., C. Chen, P. Wang, Y. Wan, Z. Chen, and L. Zhao. 2015. Experimental investigation on indoor/outdoor PM2.5 concentrations of an office building located in Guangzhou. Procedia Engineering 121:333–40. doi:10.1016/j.proeng.2015.08.1076.
- Wang, H., T. M. Khoshgoftaar, and K. Gao (2010). A comparative study of filter-based feature ranking techniques. 2010 IEEE International Conference on Information Reuse & Integration, Las Vegas, NV, USA, 1, 43–48. 10.1109/IRI.2010.5558966
- Weldy, C. S., Y. Liu, H. D. Liggitt, and M. T. Chin. 2014. In utero exposure to diesel exhaust air pollution promotes adverse intrauterine conditions, resulting in weight gain, altered blood pressure, and increased susceptibility to heart failure in adult mice. PLoS ONE 9 (2):e88582. doi:10.1371/journal.pone.0088582.
- Weng, Y.-C., N.-B. Chang, and T. Y. Lee. 2008. Nonlinear time series analysis of ground-level ozone dynamics in Southern Taiwan. Journal of Environmental Management 87 (3):405–14. doi:10.1016/j.jenvman.2007.01.023.
- Wichmann, H.-E. 2007. Diesel exhaust particles. Inhalation Toxicology 19 (sup1):241–44. doi:10.1080/08958370701498075.
- Wilhere, G. F. 2012. Using Bayesian networks to incorporate uncertainty in habitat suitability index models. The Journal of Wildlife Management 76 (6):1298–309. doi:10.1002/jwmg.366.
- Xiao, F., L. Gao, Y. Ye, Y. Hu, and R. He. 2016. Inferring gene regulatory networks using conditional regulation pattern to guide candidate genes. PLoS ONE 11 (5):1–13. doi:10.1371/journal.pone.0154953.
- Xie, W., J. Lei, S. Fang, Y. Li, X. Jia, and M. Li. 2021. Dual feature extraction network for hyperspectral image analysis. Pattern Recognition 118:107992. doi:10.1016/j.patcog.2021.107992.
- Yang, C.-Y. 2006. Effects of Asian dust storm events on daily clinical visits for conjunctivitis in Taipei, Taiwan. Journal of Toxicology and Environmental Health, Part A 69 (18):1673–80. doi:10.1080/15287390600630096.
- Yarnell, C. J., D. Abrams, M. R. Baldwin, D. Brodie, E. Fan, N. D. Ferguson, M. Hua, P. Madahar, D. F. McAuley, L. Munshi, et al. 2021. Clinical trials in critical care: Can a Bayesian approach enhance clinical and scientific decision making? The Lancet Respiratory Medicine 9 (2):207–16. doi:10.1016/S2213-2600(20)30471-9.
- Yoo, Y., J. T. Choung, J. Yu, D. K. Kim, and Y. Y. Koh. 2008. Acute effects of asian dust events on respiratory symptoms and peak expiratory flow in children with mild asthma. Journal of Korean Medical Science 23 (1):66. doi:10.3346/jkms.2008.23.1.66.
- Yu, S., Z. Zhang, X. Liang, J. Wu, E. Zhang, W. Qin, and Y. Xie (2019). A MATLAB toolbox for feature importance ranking. 2019 International Conference on Medical Imaging Physics and Engineering (ICMIPE), Shenzhen, China, 1–6. 10.1109/ICMIPE47306.2019.9098233
- Zauli Sajani, S., R. Miglio, P. Bonasoni, P. Cristofanelli, A. Marinoni, C. Sartini, C. A. Goldoni, G. De Girolamo, and P. Lauriola. 2011. Saharan dust and daily mortality in Emilia-Romagna (Italy). Occupational and Environmental Medicine 68 (6):446–51. doi:10.1136/oem.2010.058156.
- Zelikoff, J. T., L. C. Chen, M. D. Cohen, and R. B. Schlesinger. 2002. The toxicology of inhaled woodsmoke. Journal of Toxicology and Environmental Health, Part B 5 (3):269–82. doi:10.1080/10937400290070062.
- Zhang, L., Q. Pan, Y. Wang, X. Wu, and X. Shi. 2019. Bayesian network construction and genotype-phenotype inference using GWAS statistics. IEEE/ACM Transactions on Computational Biology and Bioinformatics 16 (2):475–89. doi:10.1109/TCBB.2017.2779498.
- Zhiqiang, Q., K. Siegmann, A. Keller, U. Matter, L. Scherrer, and H. C. Siegmann. 2000. Nanoparticle air pollution in major cities and its origin. Atmospheric Environment 34 (3):443–51. doi:10.1016/S1352-2310(99)00252-6.