
Abstract
Vascular calcification is prominent in patients with chronic kidney disease (CKD) and is a strong predictor of cardiovascular mortality in the CKD population. However, the mechanism underlying CKD-associated vascular calcification remains unclear. To identify potential therapeutic targets, a 5/6 nephrectomy rat model was established by feeding of a high-phosphorous diet as the CKD group and compared with sham group rats at 4 and 16 weeks. Sequencing analyses of the rat aorta revealed 643 upregulated and 1023 downregulated genes at 4 weeks, as well as 899 upregulated and 1185 downregulated genes at 16 weeks in the CKD group compared to the sham group. Bioinformatics analyses suggested that SOST (which encodes sclerostin) and Wnt signaling are involved in CKD-associated vascular calcification. Furthermore, protein-protein interactions analysis revealed interactions between SOST, WNT5A, and WNT5B, that involved runt-related transcription factor 2 (RUNX2) and transgelin (TAGLN). SOST was increased in CKD-associated vascular calcification following reduction of the Wnt signaling, including WNT5A and WNT5B, both in vivo and in vitro. TargetScan was used to predict the microRNAs (miRNAs) targeting WNT5A and WNT5B. The expression levels of miR-542-3p, miR-298-3p, miR-376b-5p, and miR-3568 were significantly reduced, whereas that of miR-742-3p was significantly increased in calcified rat aortic vascular smooth muscle cells (VSMCs). In CKD rat aortas, the expression of miR-542-3p, miR-298-3p, miR-376b-5p, miR-3568, miR-742-3p, and miR-22-5p were significantly reduced at both 4 and 16 weeks. Altogether, owing to several assessments, potentially diagnostic and prognostic biomarkers for improving common CKD diagnostic tools were identified in this study.
Abbreviations: BUN: blood urea nitrogen; CKD: chronic kidney disease; CKD-MBD: chronic kidney disease-mineral bone disorder; GAPDH: glyceraldehyde-3-phosphate dehydrogenase; GO: the Gene Ontology; HE: hematoxylin-eosin; HRP: horseradish peroxidase; KEGG: Kyoto Encyclopedia of Genes and Genomes; MiRNAs: microRNAs; PAS: periodic acid-Schiff; RUNX2: runt-related transcription factor 2; SCr: serum creatinine; STRING: the Search Tool for the Retrieval of Interacting Genes/Proteins; TAGLN: transgelin; VSMC: vascular smooth muscle cell.
Introduction
Chronic kidney disease (CKD) is a leading public health problem. According to the Global Burden of Disease CKD Collaboration [Citation1], the global prevalence of CKD was 9.1% until 2017, and the global all-age prevalence of CKD has increased by 29.3% since 1990. Between 1990 and 2017, the global all-age mortality rate from CKD increased by 41.5%. CKD is highly prevalent in developing countries. In China, the largest developing country, the overall prevalence of CKD is 10.8% [Citation2].
Vascular calcification is prevalent in patients with CKD, accounting for more than 50% of patients with CKD [Citation3,Citation4], as an important manifestation of CKD-mineral bone disorder (CKD-MBD). Vascular calcification is a strong predictor of cardiovascular mortality in the CKD population, with a more than three-fold increase in mortality in CKD patients with vascular calcification compared to in those without vascular calcification [Citation5–7]. The Kidney Disease: Improving Global Outcomes guidelines suggest that a lateral abdominal radiograph should be obtained to detect vascular calcification in patients with CKD G3a-G5D [Citation8]. Medial vascular calcification is the major form of vascular calcification in CKD and has shown rapidly developed [Citation4]. In patients with CKD, medial vascular calcification is characterized by diffuse mineral deposition in the media layer of the vessel wall [Citation5], which may be associated with vascular stiffening [Citation9], inflammation [Citation10], aging, senescence [Citation11], oxidative stress [Citation12], different vascular smooth muscle cell (VSMC) phenotypes [Citation13], and signaling pathway regulation [Citation14,Citation15].
Different molecules have been recognized based on their ability to promote or inhibit the process of extraskeletal calcification. Using genome-wide microarray analyses, Lee et al. showed that the protein C receptor, a novel calcineurin/nuclear factor of activated T cells-dependent genes, contributes to VSMC phenotypic modulation [Citation16]. Furmanik et al. also reported that contractile VSMCs are resistant to calcification and that Nox5 is a key regulator of VSMC phenotypic switching [Citation17]. In a translational genomic study, Malhotra et al. found that HDAC9 is a genetic risk locus associated with calcification of the abdominal aorta that affects the VSMC phenotype [Citation18]. However, the mechanism underlying CKD-associated vascular calcification remains unclear, and novel targets need to be elucidated.
According to our previous studies [Citation19,Citation20], some genes are involved in VSMC phenotypic transdifferentiation. In this study, we performed long-read nanopore sequencing directly in the calcified blood vessels from CKD rats to identify potential targets for CKD-associated vascular calcification. The goal of this study was to identify a crucial target for CKD-associated vascular calcification.
Materials and methods
Reagents and antibodies
Rabbit anti-TAGLN polyclonal antibody (10493-1-AP) and horseradish peroxidase (HRP)-conjugated β-actin mouse monoclonal antibody (HRP-60008) were obtained from Proteintech (Rosemont, IL). Rabbit anti-WNT5A polyclonal antibody (abs123879), rabbit anti-WNT5B polyclonal antibody (abs118405), and rabbit anti-sclerostin polyclonal antibody (abs110533) were purchased from ABsin Bioscience (Shanghai, China). HRP-conjugate goat anti-rabbit IgG secondary antibody (511203) and rabbit anti-RUNX2 polyclonal antibody (860139) were procured from ZEN BIO (Chengdu, China). Dulbecco’s modified Eagle’s medium (C11995500BT) and fetal bovine serum (10100147) were purchased from Gibco (Grand Island, NY). Penicillin and streptomycin (SV30010) were purchased from HyClone (Logan, UT) and CaCl2 (C7250) was from Solarbio (Beijing, China). β-Glycerophosphate (50020) was from Sigma-Aldrich (St. Louis, MO). TRIzol reagent (15596026) was purchased from Life Technologies (Carlsbad, CA). Immobilon Western (wbkls0500) was purchased from Merck (Kenilworth, NJ). RIPA lysis buffer (P0013B), phenylmethanesulfonyl fluoride solution (ST507), and SDS-PAGE sample loading buffer (P0015L) were purchased from Beyotime (Shanghai, China). Serum creatinine (SCr) was measured using the sarcosine oxidase method (C011-2-1) and blood urea nitrogen (BUN) was measured using the urease method (C013-2-1) with kits from Nanjing Jiancheng Bioengineering Institute (Nanjing, China). The hematoxylin-eosin (HE) staining kit (G1120), periodic acid-Schiff (PAS) staining kit (G1281), and 2% alizarin red S kit (G3280) were from Solarbio. mRNA capture beads (N401) were from VAHTS (Nanjing, China). Maxima H Minus Reverse Transcriptase (EP0752) and the Qubit dsDNA HS Assay kit (Q32854) were obtained from Thermo Fisher Scientific (Waltham, MA). NEBNext FFPE DNA Repair Mix (M6630S) and NEBNext Ultra II End Repair/dA-Tailing Module (E7546S) were from NEB (Ipswich, MA). The ligation sequencing kit (SQK-LSK109) was obtained from Oxford Nanopore Technologies (Oxford, UK). Citric acid buffer (MVS-0101) was obtained from MXB (Fuzhou, China) and biotin-streptavidin HRP detection systems (SP-9001) were purchased from ZSGB-BIO (Beijing, China). SDS-polyacrylamide gel electrophoresis FuturePAGE 10% (F15010Gel) and FuturePAGE 12% (F15012Gel) were obtained from ACE Biotechnology (Hunan, China). The PrimeScript RT reagent kit (RR047A), TB Green Premix Ex Taq II reagent kit (RR820A), recombinant DNase I (2270 A), and Mir-X miRNA First-Strand Synthesis reagent kit (638313) were obtained from TaKaRa (Shiga, Japan).
Cell culture
Rat aortic smooth muscle cell lines were obtained from the National Collection of Authenticated Cell Cultures (#GNR7, Wuhan, China). The cells (2 × 10⁵ cells per well) were seeded into six-well plates and cultured in Dulbecco’s modified Eagle’s medium containing 10% fetal bovine serum, 100 U/mL penicillin, and 100 U/mL streptomycin in a 37 °C cell culture incubator with 5% CO2. To induce calcification in rat aortic VSMCs, 1.5 mM CaCl2 and 10 mM β-glycerophosphate were added to the vehicle and the cells were cultured for 7 d [Citation20]. Equal amounts of vehicle, without CaCl2 or β-glycerophosphate, were used as controls. The medium was replaced with fresh medium every 2 d.
Experimental animals
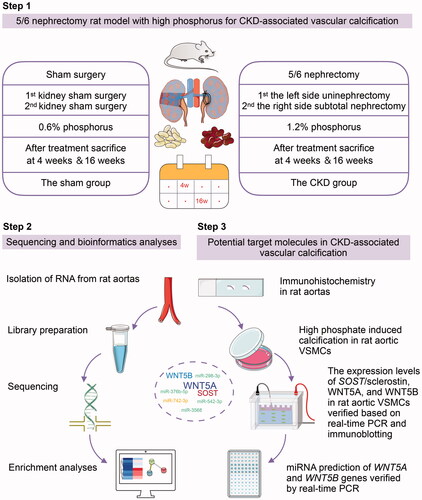
All animal protocols were approved by the Institutional Animal Care and Use Committee of the Sichuan Academy of Medical Sciences, Sichuan Provincial People’s Hospital, School of Medicine, University of Electronic Science and Technology of China. All experiments were performed in accordance with the National Institute of Health Guide for the Care and Use of Laboratory Animals. Eight-week-old male Wistar rats (DOSSY, Zhejiang, China) were housed under standard conditions (20–26 °C, 40–70% humidity, and 12-h light/dark cycle). As shown in , the 5/6 nephrectomy rat model was established via a two-step surgery consisting of left-side uninephrectomy and right-side subtotal nephrectomy. The same procedure was performed in sham rats to expose and separate the kidney capsule and preserve the kidney. Ibuprofen water (1:10 diluted in saline solution) was used for postoperative analgesia; 0.05 mL (500 mg/kg) cefazoline sodium was administered intraperitoneally once per day for 3 d to prevent infection. The 5/6 nephrectomy rats (n ≥ 5) were fed a 1.2% phosphorous diet (XIETONG SHENGWU, Nanjing, China) to induce vascular calcification in the CKD group, and rats subjected to sham surgery were fed a standard rodent 0.6% phosphorous diet. The CKD and sham rats were observed for 4 and 16 weeks, respectively, after treatment. All experiments were approved by the Center of Animal Experiments of the Sichuan Academy of Medical Sciences and Sichuan Provincial People’s Hospital (No. 2017. 36).
Figure 1. Technology roadmap to identify potential targets in chronic kidney disease (CKD)-associated vascular calcification, including the procedure used to establish the animal model, sequencing and bioinformatics analyses, and validation of potential target molecules in vivo and in vitro. SOST: encoding sclerostin; VSMCs: vascular smooth muscle cells.
Biochemical analysis
After 12 h of fasting, the blood samples were collected from the rats after euthanasia. Serum was prepared by centrifugation at 3000 rpm for 15 min at 4 °C and stored at −80 °C until use. SCr levels were measured using the sarcosine oxidase method according to the manufacturer’s instructions. BUN levels were measured using the urease method. The optical densities of SCr and BUN were measured using a microplate reader (Model 680, BIO-RAD, Hercules, CA).
Histochemistry
Rat kidney tissues and arterial tissues were fixed in 4% paraformaldehyde, dehydrated, and then embedded. Kidney tissue sections (3 µm thick) were deparaffinized in xylene, rehydrated in a graded ethanol series, and stained with HE. According to the protocol of the HE staining kit, each sample was incubated with hematoxylin solution for 5 min, washed using ddH2O, and then incubated with the eosin staining solution for 1 min. The sheet was sealed with neutral gum and photographed under a microscope (Pannoramic MIDI, 3DHISTECH, Budapest, Hungary).
To assess the kidney morphology, 3-μm-thick tissue sections of paraffin-embedded kidneys were subjected to PAS staining. According to the manufacturer’s instructions, the sections were incubated with 100 μL of periodic acid solution for 5 min, washed using ddH2O, and then incubated with 100 μL Schiff reagent for 30 min at 37 °C in the dark. Hematoxylin counterstaining was performed for 2 min. The sheet was sealed and photographed as described above.
To visualize calcification, arterial tissue sections were stained with 2% alizarin red S. The slices were incubated with alizarin red S (pH 5.0) for 10 min, McGee-Russell for 15 s, and hematoxylin for 2–5 min, and then washed with ddH2O. The samples were sealed with a neutral gum. Calcified areas were indicated by red staining under a microscope. Alizarin red S staining of rat aortic VSMCs was performed using the same procedure. Image quantification was performed using ImageJ software version 1.8.0 (National Institutes of Health, Bethesda, MD).
Sample preparation and RNA isolation
The rat aortas, including the thoracic and abdominal aortas, were collected in a sterile environment and placed on the ice to prevent RNA degradation. The connective and adipose tissues were removed, and the residual blood was immediately washed with pre-cooled normal saline. The aorta samples were preserved in frozen storage tubes, frozen in liquid nitrogen within 3 min, and stored at −80 °C.
Total RNA was extracted from the rat aortas using TRIzol reagent according to the manufacturer’s instructions. TRIzol (0.02 mL/mg tissue) was added to the sample, which was then homogenized with a homogenizer and incubated for 5 min. The sample was centrifuged at 12,000 × g for 5 min at 4 °C, and the precipitate was discarded. Chloroform (0.2 mL) was added to 1 mL TRIzol and mixed with the samples for 15 min of lysis. The samples were centrifuged at 12,000 × g for 15 min at 4 °C. The colorless upper aqueous phase was transferred to a new tube after centrifugation. Isopropyl alcohol (0.5 mL) was added to 1 mL TRIzol for 5 min. The solution was centrifuged for 10 min, and the aqueous phase was discarded. The sample was incubated with 1 mL of 75% ethanol per 1 mL of TRIzol for 2 min and then centrifuged at 8000 × g for 5 min at 4 °C. The resulting supernatant was discarded, and the tube was dried at room temperature for 10 min. RNA was dissolved in 50 µL H2O at 55–60 °C for 10 min. The concentration and purity of the RNA were determined using a NanoDrop 2000 spectrophotometer (Thermo Fisher Scientific, Waltham, MA). RNA integrity was assessed using a LabChip bioanalyzer system (LabChip GX, Perkin Elmer, Waltham, MA). The RNA samples met the following criteria: total quantity ≥3 μg for three rounds of library construction, concentration ≥40 ng/μL, volume ≥10 μL, OD260/280 of 1.7–2.5, OD260/230 of 0.5-2.5, and RNA integrity number values ≥8.0.
Library preparation and quality inspection
Poly A mRNA was purified from total RNA using mRNA capture beads. Reverse transcription primers were combined with the poly A tail of the mRNA by annealing, and the first strand was synthesized using Maxima H-Minus Reverse Transcriptase. Double-strand cDNA was synthesized by PCR amplification (ProFlex 3 × 32 well, Applied Biosystems, Foster City, CA) with amplification primers. DNA repair was performed using NEBNext FFPE DNA Repair Mix, and A was added to the 3′-end using the NEBNext Ultra II End Repair/dA-Tailing Module to increase the library yield and quality. A sequencing connector supplied with the ligation sequencing kit was attached to the end of the prepared DNA. The Qubit 3.0 fluorescence quantitative instrument and Qubit dsDNA HS Assay kit were used to detect the concentration and the concentration found to be >2 ng/μL.
Sequencing
PromethION Flow Cells (FLO-PRO002, Oxford Nanopore Technologies, Oxford, UK) were used as the sequencing chip, and flow cell priming mix was prepared using a sequencing chip preparation kit (EXP-FLP001 PRO.6, Oxford Nanopore Technologies). Sequencing was performed on a PromethION48 (Oxford Nanopore Technologies) using the MinKNOW version 2.2 software (Oxford Nanopore Technologies) for 72 h with the adapter Y top and bottom ().
Table 1. Primers used for real-time PCR.
Bioinformatics analysis
Differentially expressed genes were annotated in the Gene Ontology (GO) and Kyoto Encyclopedia of Genes and Genomes (KEGG) databases using the BMK Cloud platform (Biomarker Technologies, Beijing, China) (https://international.biocloud.net). The Xiantao platform (Xiantao, Shanghai, China) was used for visual analysis (https://www.xiantao.love). R version 3.6.3 with ggplot2 3.3.3 (Texas, USA) (Log2FC > ± 1, p < 0.05) and R version 4.1.1 with Pheatmap version 1.0.12 (Ontario, Canada) (minimum fold change was ± 2, p < 0.05) were used. To detect protein-protein interactions, the Search Tool for the Retrieval of Interacting Genes/Proteins (STRING) database (https://cn.string-db.org) was used [Citation21]. TargetScan (https://www.targetscan.org/vert_80/) and Human miRNA Tissue Atlas datasets (https://ccb-web.cs.uni-saarland.de/tissueatlas/) were used to predict miRNAs of the target genes that were differentially expressed between the CKD and sham groups.
Immunohistochemistry
Microwave-based antigen retrieval was performed to detect the protein expression levels of sclerostin, WNT5A, and WNT5B. Briefly, 3-μm paraffin sections of the arterial tissue samples were deparaffinized three times in xylene for 5 min and then rehydrated using a 90–70% ethanol series. Antigen retrieval was performed twice in 10 mM citric acid buffer (pH6.0) at 500 W for 8 min. After blocking endogenous peroxidase and sealing, the sections were incubated with sclerostin (1:25), WNT5A (dilution 1:100), and WNT5B (1:100) primary antibodies overnight at 4 °C, and then with goat anti-rabbit IgG for 20 min, according to the instructions of Biotin-Streptavidin HRP Detection Systems. All slides were scanned using a Pannoramic MIDI (P250, 3DHISTECH).
Western blot analysis
Proteins were extracted from arterial tissue and cultured cells using RIPA lysis buffer and phenylmethanesulfonyl fluoride for protease inhibition. The samples were centrifuged at 2500 rpm for 15 min at 4 °C. The proteins were separated by 12.5% or 10% SDS-polyacrylamide gel electrophoresis and then transferred to polyvinylidene fluoride membranes (Millipore, Billerica, MA) in Tris/glycine buffer with 20% methanol using an electrophoresis apparatus PowerPac (1645050, Bio-Rad). To block nonspecific binding sites, the membranes were treated with 5% nonfat milk in Tris buffer saline and 0.1% Tween 20 (TBST) for 2 h. The membranes were incubated overnight at 4 °C with the following primary antibodies anti-RUNX2, anti-TAGLN, anti-sclerostin, anti-WNT5A, and anti-WNT5B at a ratio of 1:1000. Anti-β-actin antibody was diluted at 1:10,000 and incubated with the membranes for 30 min. After washing with TBST, the membranes were incubated with HRP-conjugated goat anti-mouse or anti-rabbit secondary antibodies at a ratio of 1:10,000 for 2 h at room temperature. The signal was detected using a Fusion FX7 system (FX7, VILBER LOURMAT, Collégien, France). Image quantification was performed using ImageJ software.
Real-time PCR
Real-time PCR was performed to quantify the mRNA expression of SOST, WNT5A, and WNT5B in cells and rat aortic tissues using a real-time PCR detection system (CFX96 Touch, Bio-Rad). Rat aortic VSMCs and aortic tissue were collected, and RNA was isolated using TRIzol reagent. Reverse transcription was performed using a GeneAmp PCR System (9700, Applied Biosystems) according to the manufacturer’s instructions for the PrimeScript RT reagent kit. Glyceraldehyde‐3‐phosphate dehydrogenase (GAPDH) was used as an internal control during detection of the mRNA levels of SOST, WNT5A, and WNT5B. The PCR sample was prepared using a TB Green Premix Ex Taq II kit. Real-time PCR was performed to quantify the expression levels of rno-miR-542-3p, rno-miR-298-3p, rno-miR-376b-5p, rno-miR-3568, rno-miR-742-3p, rno-miR-22-5p, and rno-miR-200a-5p. Recombinant DNase I was used to remove large amounts of genomic DNA from the samples to reduce background signals before reverse transcription. The Mir-X miRNA First-Strand Synthesis kit was used for reverse transcription of the cDNA. U6 gene expression was used as an internal control. The mRNA levels in each sample were compared using the ΔΔCt method [Citation22]. The primer sequences are listed in .
Statistical analysis
Statistical analysis was conducted using GraphPad Prism software version 8.0 (GraphPad, San Diego, CA). The significance of differences between the experimental values of the two groups was determined using Student’s unpaired t-test, whereas that among multiple groups was determined using one-way analysis of variance, with p < 0.05.
Results
5/6 Nephrectomy with high-phosphorus diet induces CKD-associated vascular calcification in rats
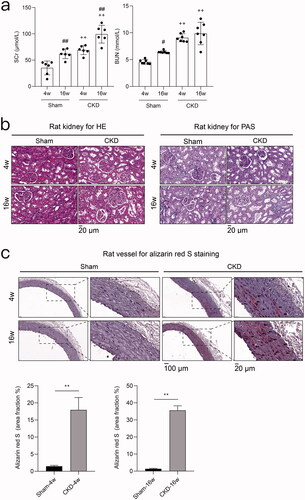
After 5/6 nephrectomy with a high-phosphorus diet intake, the levels of SCr and BUN were significantly increased in the CKD group compared to the sham group (). The results of HE and PAS staining verified the presence of severe kidney injury in CKD rats (). Alizarin red S staining revealed significant arterial medial calcification in rats in the CKD group. The pathological symptoms deteriorated with the duration of CKD ().
Figure 2. 5/6 nephrectomy with high-phosphorus diet induces chronic kidney disease (CKD)-associated vascular calcification in rats. a) Serum biochemical measurements. Serum creatinine (SCr) and blood urea nitrogen (BUN) in the CKD and sham groups at 4 and 16 weeks. #p < 0.05, ## p < 0.01, 4 vs. 16 weeks within the same treatment; + p < 0.05, ++ p < 0.01, CKD vs. Sham at the same time point; n ≥ 6 in each group. b) Hematoxylin-eosin (HE) and periodic acid-Schiff (PAS) staining of rat kidneys from the CKD and sham groups at 4 and 16 weeks. c) Alizarin red S staining of rat aortas and quantification in the CKD and sham groups at 4 and 16 weeks. Arrows indicate the arterial medial calcification areas. The microscopic magnification of rat kidney is 400×, and those of the rat vessel are 200× and 800×. Scale bars = 20 and 100 μm.
Differentially expressed genes in rat aortas between the CKD and sham groups
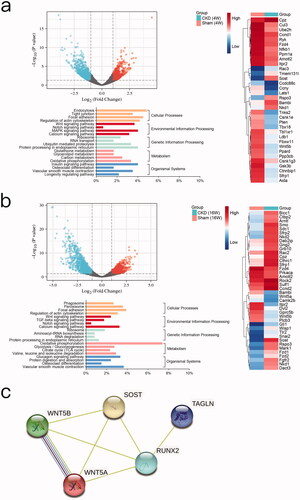
To identify differentially expressed genes in CKD-associated vascular calcification, RNA full-length sequencing analysis was performed between the CKD and sham groups at 4 weeks () and 16 weeks (). We identified 643 genes were upregulated and 1023 genes were downregulated in the CKD group compared to the sham group at 4 weeks (Log2FC > ± 1 and p < 0.05). Compared to the sham group, 899 upregulated genes and 1185 downregulated genes were detected in the CKD group at 16 weeks (Supplementary Table 1). Both the results of KEGG analysis at 4 and 16 weeks showed that the potential key pathways were related to the process of osteogenic transdifferentiation in VSMCs, including the Wnt signaling pathway, calcium signaling pathway, oxidative phosphorylation, osteoclast differentiation, and vascular smooth muscle contraction. Among the genes in these key pathways, the changes in SOST, WNT5A, and WNT5B significantly differed between the CKD and sham groups in the clustering heatmap. In the CKD group, the expression level of SOST was upregulated, whereas those of WNT5A and WNT5B were downregulated. SOST at 4 weeks was Log2FC = 2.5302, p = 0.000, and at 16 weeks was Log2FC = 2.100, p = 0.0196; WNT5A at 4 weeks was Log2FC = −0.8137, p = 0.1550, and at 16 was weeks Log2FC = −1.5960, p = 0.0104; WNT5B at 4 weeks was Log2FC = −1.3499, p = 0.0117, and at 16 weeks was Log2FC = −1.6878, p = 0.0032. Protein–protein interactions analysis using the STRING database showed that SOST and WNT5A are closely linked to RUNX2 through RUNX2 to TAGLN. SOST, WNT5A, and WNT5B are closely linked to each other. These results revealed interactions between SOST, WNT5A, and WNT5B, which involved RUNX2 and TAGLN upon vascular calcification ().
Figure 3. Bioinformatics analyses. a) Between the chronic kidney disease (CKD) and sham groups at 4 weeks, volcano plot analysis of differentially expressed genes, Log2FC > ± 1 and p < 0.05. Clustering analysis of principal significant genes. The experiment was conducted in triplicate and the mean value was determined. The minimum fold change was ± 2 (p < 0.05). Kyoto Encyclopedia of Genes and Genomes (KEGG) pathway analysis. b) Between the CKD and sham groups at 16 weeks, volcano plot analysis, clustering analysis, and KEGG pathway analysis. c) Enrichment analysis of the protein-protein interaction network.
Sclerostin increased and WNT5A and WNT5B decreased in the arterial medial layer of CKD rats
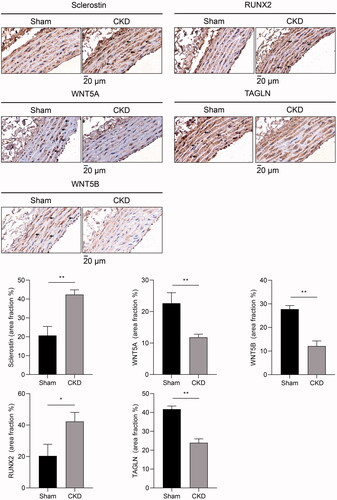
To investigate the role of the Wnt signaling pathway in VSMC phenotype switching in vivo, we evaluated the expression of Wnt signaling proteins, including sclerostin, WNT5A, and WNT5B. Immunohistochemical staining showed that sclerostin expression was increased, whereas WNT5A and WNT5B expression was decreased in the arterial medial layer of CKD rats compared to that of sham rats. Compared to the sham group, RUNX2 expression was increased in the arterial medial layer of CKD rats, whereas TAGLN was reduced in that of CKD rats ().
Figure 4. Representative immunohistochemical staining of sclerostin, WNT5A, WNT5B, RUNX2, and TAGLN in rat aortas between the CKD and sham groups at 16 weeks and quantification. Arrows indicate positive areas. The microscopic magnification of rat vessel is 800×. Scale bar = 20 μm.
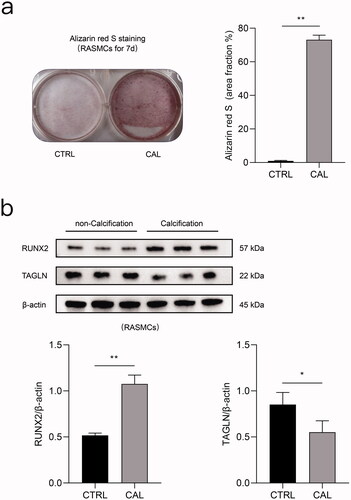
High phosphorus induces calcification in rat aortic VSMCs
Alizarin red S staining revealed obvious calcium deposition in rat aortic VSMCs after stimulation with high phosphorus concentrations for seven days (). Compared to the control group, TAGLN expression was markedly decreased after treatment with high-phosphorus levels. Compared to the control group, RUNX2 expression was significantly increased following high-phosphorus treatment ().
Figure 5. High phosphate induced calcification in rat aortic VSMCs. a) Original images following alizarin red S staining of rat aortic VSMCs treated with high phosphate medium for 7 d and quantification. b) Expression levels of RUNX2 and TAGLN in rat aortic VSMCs between the calcification (CAL) and the non-calcification (CTRL) groups based on immunoblotting. *p < 0.05, **p < 0.01, n = 3 in each group.
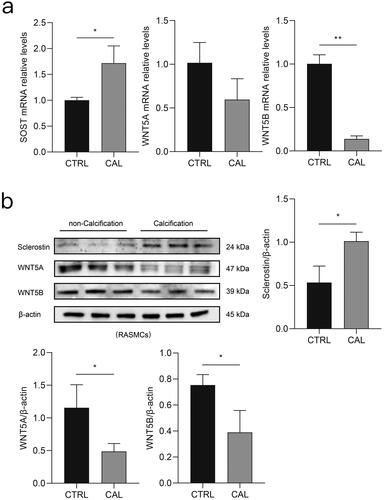
Sclerostin increased and WNT5A and WNT5B decreased in rat aortic VSMCs after high-phosphorus treatment
According to the real-time PCR results, the level of SOST was increased in rat aortic VSMCs following high-phosphorus treatment. However, the levels of WNT5A and WNT5B were decreased in the high-phosphorus-treated rat aortic VSMCs (). Similarly, immunoblotting revealed that the expression level of sclerostin sharply increased, whereas that of WNT5A and WNT5B decreased in rat aortic VSMCs after high-phosphorus induction ().
Figure 6. Differential expression of sclerostin, WNT5A, and WNT5B in vitro between the calcification (CAL) and the non-calcification (CTRL) groups. a) Expression levels of SOST (encoding sclerostin), WNT5A, and WNT5B in rat aortic VSMCs determined using real-time PCR. b) Expression levels of sclerostin, WNT5A, and WNT5B in rat aortic VSMCs determined using immunoblotting. *p < 0.05, ** p < 0.01, n ≥ 3 in each group.
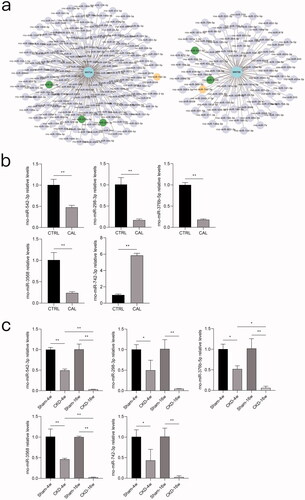
miRNAs associated with WNT5A and WNT5B significantly differed in rat aortic VSMCs after high-phosphorus treatment and in rat aortas between the CKD and sham groups
Based on the importance of WNT5A and WNT5B in the non-canonical Wnt signaling involving osteogenic transdifferentiation of VSMCs and the significant role of miRNAs in vascular calcification, we used the TargetScan dataset to predict miRNAs targeting WNT5A or WNT5B (). Based on analysis of the Human miRNA Tissue Atlas datasets, seven miRNAs were identified as potential regulators of WNT5A and WNT5B. The expression levels of miR-542-3p, miR-298-3p, miR-376b-5p, and miR-3568 were significantly reduced, whereas that of miR-742-3p was significantly increased in rat aortic VSMCs treated with high-phosphorus levels (). The expression levels of miR-22-5p and miR-200a-5p did not significantly differ between the high-phosphorus-treated rat aortic VSMCs and normal controls (Supplementary Figure 1(a)). Compared to the sham group, the expression levels of miR-542-3p, miR-298-3p, miR-376b-5p, miR-3568, miR-742-3p, and miR-22-5p were significantly reduced in the rat aortas in the CKD group at both 4 and 16 weeks. With the progression of CKD, the expression levels of miR-542-3p, miR-376b-5p, miR-3568, and miR-22-5p were greatly decreased in the CKD rat aortas at 16 weeks, compared to those in the rat aortas at 4 weeks ( and Supplementary Figure 1(b)).
Figure 7. miRNA prediction of WNT5A and WNT5B and validation of miRNAs in rat aortic VSMCs and rat aortic tissue. a) TargetScan was used to predict miRNAs targeting WNT5A and WNT5B. Green dots indicate downregulated genes and yellow dots indicate an inconsistent trend. b) Expression levels of miR-542-3p, miR-298-3p, miR-376b-5p, miR-3568, and miR-742-3p between the calcification (CAL) and the non-calcification (CTRL) groups based on real-time PCR. c) Expression levels of miR-542-3p, miR-298-3p, miR-376b-5p, miR-3568, and miR-742-3p in rat aortas between the CKD and sham groups at 4 and 16 weeks based on real-time PCR. *p < 0.05, **p < 0.01, n ≥ 3 in each group.
Discussion
To mimic the physiological state of CKD with medial vascular calcification in humans, we established a 5/6 nephrectomy rat model by feeding of a 1.2% phosphate diet [Citation23–25]. Two-step 5/6 nephrectomy was performed to improve the survival rate of the rats. As expected, a moderate degree of chronic renal failure was induced by the increase of 2–3-fold in SCr and BUN levels. Histochemical analysis revealed severe kidney injury and arterial medial calcification in rats in the CKD group. The use of the 5/6 nephrectomy rat model enabled analysis of the molecular mechanisms and pathways underlying CKD-associated vascular calcification in detail.
The mechanisms underlying CKD-associated vascular calcification remain unclear. Until a recent study reported phenotypic transdifferentiation in VSMCs [Citation26], important molecules were thought to regulate the osteochondrogenic transdifferentiation of VSMC phenotype. This process may involve active transformation of VSMCs into an osteoblastic-like cell phenotype and does not simply result from the passive process of pathobiological calcium deposition [Citation4,Citation27]. We performed RNA full-length sequencing of aorta tissues from CKD and sham rats. SOST, WNT5A, and WNT5B were significantly differentially expressed in the aorta tissues of rats in the CKD group compared to those in the sham group. Interestingly, some molecules implicated in the osteochondrogenic transdifferentiation of VSMC phenotype were reported to be concentrated in the Wnt signaling pathway [Citation28,Citation29].
Using immunohistochemistry, we observed increased expression of sclerostin and decreased expression of WNT5A and WNT5B in the arterial medial layer of CKD rats. Previous study reported that TAGLN was significantly expressed in the contractile phenotype of VSMC, and RUNX2 was significantly expressed in the osteoblastic-like cell phenotype/synthetic phenotype of VSMC [Citation17,Citation30]. In this study, we found that RUNX2 increased and TAGLN decreased in rat aortic VSMCs treated with high phosphorus, suggesting that the cell contractile phenotype switched to the synthetic phenotype. Real-time PCR and immunoblotting showed that the expression level of SOST/sclerostin was increased, whereas those of WNT5A and WNT5B were decreased in rat aortic VSMCs following high-phosphorus treatment. Thus, the regulation of sclerostin, WNT5A, and WNT5B may play a crucial role in the osteochondrogenic transdifferentiation of VSMC phenotype.
WNT5A and WNT5B belong to the non-canonical Wnt signaling pathway, and their roles in CKD-associated vascular calcification have not been widely examined [Citation31,Citation32]. Whether WNT5A and WNT5B have protective or deleterious effects in CKD-associated vascular calcification remains unclear. We hypothesized that the downregulation of WNT5A and WNT5B, which are involved in the process of the non-canonical Wnt signaling pathway inhibiting the canonical Wnt signaling pathway, may facilitate vascular calcification in the CKD rat model. The results of the following experiments support this notion. Xin et al. found that vascular calcification in rat aortic VSMCs can be inhibited by the non-canonical Wnt signaling pathway members WNT5A/Ror2 [Citation33]. WNT5A can activate and repress Wnt/β-catenin signaling according to the expression time, site, and the expressed receptors of the receiving cells [Citation34]. Studies of WNT5B have focused on cardiovascular calcification and not on CKD-associated vascular calcification. Notably, WNT5B has been observed in inflammatory cells, activated myofibroblasts, and fibrosis in calcified areas of the human aortic valve [Citation32]. Some prior results are inconsistent with those of this study. WNT5A was not significantly associated with vascular calcification, but β-catenin and WNT3A, as canonical Wnt pathway factors, were significantly different according to immunohistochemistry of the aortas from CKD rats [Citation35]. Another previous study showed that WNT5A is an independent risk factor for vascular calcification in patients with end-stage renal disease but is positively correlated with the incidence of vascular calcification [Citation36].
Sclerostin, which is secreted mainly by osteocytes, inhibits Wnt signaling, and its role in inhibiting or facilitating ectopic calcification remains controversial [Citation37–39]. Recently, Morena et al. suggested that increased levels of osteopontin and sclerostin are associated with a decline in renal function and may be potential partners in coronary artery calcifications with potential additive effects in patients with non-dialysis CKD [Citation40]. De Maré et al. demonstrated the protective role of sclerostin in vascular calcification development in the aorta, kidney, and heart of Sost−/− mice using von Kossa-staining [Citation41]. These clinical and experimental data suggest that sclerostin antibodies influence multiple interactions in renal osteodystrophy, vascular calcification, and hyperparathyroidism; however, the clinical sequelae remain unclear [Citation42–45]. Our sequencing data showed that SOST at 4 weeks was Log2FC = 2.5302, p = 0.000, and at 16 weeks was Log2FC = 2.100, p = 0.0196. We prioritized differentially expressed genes at 4 weeks as targets of early prevention and treatment. The fold change of SOST ranked nine at 4 weeks, and the trend was consistent at 4 and 16 weeks. Sclerostin was increased, whereas WNT5A and WNT5B were decreased in vivo and in vitro. Our data support that sclerostin and non-canonical Wnt signaling in WNT5A/WNT5B are involved in CKD-associated vascular calcification.
Aberrant miRNA expression is thought to be an important regulator of kidney diseases [Citation46]. Here, we found that miR-542-3p, miR-298-3p, miR-376b-5p, miR-3568, and miR-742-3p are involved in osteogenic transdifferentiation of VSMCs in CKD. The role of miR-542-3p in inflammation [Citation47], mitochondrial dysfunction [Citation48], renal fibrosis [Citation49], and cancer [Citation50,Citation51] has been explored but has not been widely evaluated in CKD-associated vascular calcification. He et al. showed that miR-542-3p exerts anti-angiogenic effects by directly targeting the angiogenesis-promoting protein angiopoietin-2 in breast cancer models [Citation51]. Zhang et al. suggested that miR-542-3p induces osteoblast differentiation by targeting SFRP1 in rats with ovariectomy-induced osteoporosis [Citation52]. Another study revealed that miR-542-3p inhibits the proliferation of VSMCs by inhibiting splenic tyrosine kinase activation in aging rats [Citation53]. Liu et al. demonstrated that miR-542-3p was downregulated in VSMCs from old rats compared to those from young rats. Overexpression of miR-542-3p in VSMCs from young rats suppresses osteogenic differentiation induced by β-glycerophosphate. Our results are consistent with those reported by Liu et al. [Citation54]. In our study, the expression levels of miR-542-3p were significantly reduced after treatment with high-phosphorus levels in rat aortic VSMCs and rat aortas in the CKD group. Thus, miR-542-3p may be involved in CKD-associated vascular calcification. There are few reports on the remaining miRNAs in patients with CKD [Citation55–58]. After high-phosphorous treatment of the rat aortic VSMCs, miR-542-3p, miR-298-3p, miR-376b-5p, and miR-3568 were downregulated, and miR-742-3p was upregulated. In the CKD rat aortas, the expression levels of miR-542-3p, miR-298-3p, miR-376b-5p, miR-3568, miR-742-3p, and miR-22-5p were significantly reduced at both 4 and 16 weeks. These findings demonstrate the potential of miRNAs as biomarkers for the diagnosis and prognosis of CKD-associated vascular calcification [Citation46].
In the early stages of CKD-associated vascular calcification, upregulation of sclerostin in the vascular wall may act as a warning to exert a protective effect by inhibiting vascular calcification [Citation59]; however, continuous increases in sclerostin may lead to adverse clinical outcomes. Sclerostin, which is produced in the vascular wall, may enter the circulation, leading to negative effects on the bone. However, the role of sclerostin in CKD should be further investigated in clinical and experimental data. Considering the differences between humans and rats, studies are needed in patients with CKD-associated vascular calcification.
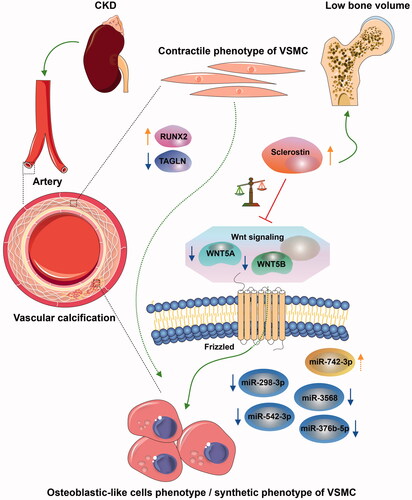
In summary, sclerostin was increased in CKD-associated vascular calcification following reduction of the non-canonical Wnt signaling, including WNT5A and WNT5B, which involved miR-542-3p, miR-298-3p, miR-376b-5p, miR-3568, and miR-742-3p (). The potential diagnostic and prognostic biomarkers have been identified to improve common CKD diagnostic tools.
Figure 8. Interaction between sclerostin and WNT5A/WNT5B may be involved in CKD-associated vascular calcification via miR-542-3p, miR-298-3p, miR-376b-5p, miR-3568, and miR-742-3p. The osteochondrogenic transdifferentiation of VSMC phenotype is depicted by switching of the contractile phenotype of VSMC into the osteoblastic-like cell phenotype/synthetic phenotype in CKD. The arrow colors indicate the following: orange, upregulated; blue, downregulated; green, promoted; and red, prevented.
Supplemental Material
Download PDF (1.1 MB)Acknowledgments
The authors thank Prof. Zhenglin Yang and Prof. Shaoping Deng at the University of Electronic Science and Technology, Sichuan Academy of Medical Sciences, and Sichuan Provincial People’s Hospital for generously providing research platforms and technical support. The authors thank Weishen Wu in the Aksomics (Shanghai) for assistance with the bioinformatics analysis.
Disclosure statement
No potential conflict of interest was reported by the author(s).
Additional information
Funding
References
- Global, regional, and national burden of chronic kidney disease, 1990–2017: a systematic analysis for the global burden of disease study 2017. Lancet. 2020;395(10225):709–733.
- Zhang L, Wang F, Wang L, et al. Prevalence of chronic kidney disease in China: a cross-sectional survey. Lancet. 2012;379(9818):815–822.
- Liu ZH, Yu XQ, Yang JW, et al. Prevalence and risk factors for vascular calcification in Chinese patients receiving dialysis: baseline results from a prospective cohort study. Curr Med Res Opin. 2018;34(8):1491–1500.
- Vervloet M, Cozzolino M. Vascular calcification in chronic kidney disease: different bricks in the wall? Kidney Int. 2017;91(4):808–817.
- Chen W, Melamed ML. Vascular calcification in predialysis CKD: common and deadly. Clin J Am Soc Nephrol. 2015;10(4):551–553.
- Okuno S, Ishimura E, Kitatani K, et al. Presence of abdominal aortic calcification is significantly associated with all-cause and cardiovascular mortality in maintenance hemodialysis patients. Am J Kidney Dis. 2007;49(3):417–425.
- Wang XR, Yuan L, Shi R, et al. Predictors of coronary artery calcification and its association with cardiovascular events in patients with chronic kidney disease. Ren Fail. 2021;43(1):1172–1179.
- (KDIGO 2017 clinical practice guideline update for the diagnosis, evaluation, prevention, and treatment of chronic kidney Disease-Mineral and bone disorder (CKD-MBD). Kidney Int Suppl. 2017;7(1):1–59.
- Lacolley P, Regnault V, Segers P, et al. Vascular smooth muscle cells and arterial stiffening: relevance in development, aging, and disease. Physiol Rev. 2017;97(4):1555–1617.
- Dai L, Schurgers LJ, Shiels PG, et al. Early vascular ageing in chronic kidney disease: impact of inflammation, vitamin K, senescence and genomic damage. Nephrol Dial Transplant. 2020;35(2):ii31–ii37.
- Sanchis P, Ho CY, Liu Y, et al. Arterial "inflammaging" drives vascular calcification in children on dialysis. Kidney Int. 2019;95(4):958–972.
- Düsing P, Zietzer A, Goody PR, et al. Vascular pathologies in chronic kidney disease: pathophysiological mechanisms and novel therapeutic approaches. J Mol Med (Berl). 2021;99(3):335–348.
- Kudryavtseva O, Aalkjaer C, Matchkov VV. Vascular smooth muscle cell phenotype is defined by Ca2+-dependent transcription factors. FEBS J. 2013;280(21):5488–5499.
- Schunk SJ, Floege J, Fliser D, et al. WNT-β-catenin signalling - a versatile player in kidney injury and repair. Nat Rev Nephrol. 2021;17(3):172–184.
- Voelkl J, Lang F, Eckardt KU, et al. Signaling pathways involved in vascular smooth muscle cell calcification during hyperphosphatemia. Cell Mol Life Sci. 2019;76(11):2077–2091.
- Lee MY, Garvey SM, Ripley ML, et al. Genome-wide microarray analyses identify the protein C receptor as a novel calcineurin/nuclear factor of activated T cells-dependent gene in vascular smooth muscle cell phenotypic modulation. Arterioscler Thromb Vasc Biol. 2011;31(11):2665–2675.
- Furmanik M, Chatrou M, van Gorp R, et al. Reactive Oxygen-Forming Nox5 links vascular smooth muscle cell phenotypic switching and extracellular Vesicle-Mediated vascular calcification. Circ Res. 2020;127(7):911–927.
- Malhotra R, Mauer AC, Lino Cardenas CL, et al. HDAC9 is implicated in atherosclerotic aortic calcification and affects vascular smooth muscle cell phenotype. Nat Genet. 2019;51(11):1580–1587.
- Wang C, Tang Y, Wang Y, et al. Label-free quantitative proteomics identifies Smarca4 is involved in vascular calcification. Ren Fail. 2019;41(1):220–228.
- Xiao Q, Tang Y, Xia J, et al. Ubiquitin-specific protease 47 is associated with vascular calcification in chronic kidney disease by regulating osteogenic transdifferentiation of vascular smooth muscle cells. Ren Fail. 2022;44(1):752–766.
- Szklarczyk D, Gable AL, Lyon D, et al. STRING v11: protein-protein association networks with increased coverage, supporting functional discovery in genome-wide experimental datasets. Nucleic Acids Res. 2019;47(D1):D607–d613.
- Livak KJ, Schmittgen TD. Analysis of relative gene expression data using real-time quantitative PCR and the 2(-Delta Delta C(T)) method. Methods. 2001;25(4):402–408.
- Bao YW, Yuan Y, Chen JH, et al. Kidney disease models: tools to identify mechanisms and potential therapeutic targets. Zool Res. 2018;39(2):72–86.
- Ferrari GO, Ferreira JC, Cavallari RT, et al. Mineral bone disorder in chronic kidney disease: head-to-head comparison of the 5/6 nephrectomy and adenine models. BMC Nephrol. 2014;15:69.
- Neven E, D’Haese PC. Vascular calcification in chronic renal failure: what have we learned from animal studies? Circ Res. 2011;108(2):249–264.
- Ciceri P, Volpi E, Brenna I, et al. Combined effects of ascorbic acid and phosphate on rat VSMC osteoblastic differentiation. Nephrol Dial Transplant. 2012;27(1):122–127.
- Bao S, Guo Y, Diao Z, et al. Genome-wide identification of lncRNAs and mRNAs differentially expressed in human vascular smooth muscle cells stimulated by high phosphorus. Ren Fail. 2020;42(1):437–446.
- Voelkl J, Luong TT, Tuffaha R, et al. SGK1 induces vascular smooth muscle cell calcification through NF-κB signaling. J Clin Invest. 2018;128(7):3024–3040.
- Chen B, Zhao Y, Han D, et al. Wnt1 inhibits vascular smooth muscle cell calcification by promoting ANKH expression. J Mol Cell Cardiol. 2019;135:10–21.
- Proudfoot D. Calcium signaling and tissue calcification. Cold Spring Harb Perspect Biol. 2019;11(10):a035303.
- Ishitani T, Kishida S, Hyodo-Miura J, et al. The TAK1-NLK mitogen-activated protein kinase Cascade functions in the Wnt-5a/Ca(2+) pathway to antagonize Wnt/beta-catenin signaling. Mol Cell Biol. 2003;23(1):131–139.
- Albanese I, Yu B, Al-Kindi H, et al. Role of noncanonical Wnt signaling pathway in human aortic valve calcification. Arterioscler Thromb Vasc Biol. 2017;37(3):543–552.
- Xin H, Xin F, Zhou S, et al. The Wnt5a/Ror2 pathway is associated with determination of the differentiation fate of bone marrow mesenchymal stem cells in vascular calcification. Int J Mol Med. 2013;31(3):583–588.
- van Amerongen R, Fuerer C, Mizutani M, et al. Wnt5a can both activate and repress Wnt/β-catenin signaling during mouse embryonic development. Dev Biol. 2012;369(1):101–114.
- Liao R, Wang L, Li J, et al. Vascular calcification is associated with Wnt-signaling pathway and blood pressure variability in chronic kidney disease rats. Nephrology (Carlton). 2020;25(3):264–272.
- Liu J, Zhang L, Zhou Y, et al. Aberrant activation of Wnt pathways in arteries associates with vascular calcification in chronic kidney disease. Int Urol Nephrol. 2016;48(8):1313–1319.
- De Maré A, D’Haese PC, Verhulst A. The role of sclerostin in bone and ectopic calcification. Int J Mol Sci. 2020;21(9):3199.
- Zeng C, Guo C, Cai J, et al. Serum sclerostin in vascular calcification and clinical outcome in chronic kidney disease. Diab Vasc Dis Res. 2018;15(2):99–105.
- Araújo M, Bacelar Marques ID, Graciolli FG, et al. Comparison of serum levels with bone content and gene expression indicate a contradictory effect of kidney transplantation on sclerostin. Kidney Int. 2019;96(5):1100–1104.
- Morena M, Jaussent I, Dupuy AM, et al. Osteoprotegerin and sclerostin in chronic kidney disease prior to dialysis: potential partners in vascular calcifications. Nephrol Dial Transplant. 2015;30(8):1345–1356.
- De Maré A, Opdebeeck B, Neven E, et al. Sclerostin protects against vascular calcification development in mice. J Bone Miner Res. 2022;37(4):687–699.
- Claes KJ, Viaene L, Heye S, et al. Sclerostin: another vascular calcification inhibitor? J Clin Endocrinol Metab. 2013;98(8):3221–3228.
- Brandenburg VM, Verhulst A, Babler A, et al. Sclerostin in chronic kidney disease-mineral bone disorder think first before you block it!. Nephrol Dial Transplant. 2019;34(3):408–414.
- Evenepoel P, D'Haese P, Brandenburg V. Sclerostin and DKK1: new players in renal bone and vascular disease. Kidney Int. 2015;88(2):235–240.
- Bruzzese A, Lacquaniti A, Cernaro V, et al. Sclerostin levels in uremic patients: a link between bone and vascular disease. Ren Fail. 2016;38(5):759–764.
- Trionfini P, Benigni A, Remuzzi G. MicroRNAs in kidney physiology and disease. Nat Rev Nephrol. 2015;11(1):23–33.
- Cai G, Cai G, Zhou H, et al. Mesenchymal stem cell-derived exosome miR-542-3p suppresses inflammation and prevents cerebral infarction. Stem Cell Res Ther. 2021;12(1):2.
- Garros RF, Paul R, Connolly M, et al. MicroRNA-542 promotes mitochondrial dysfunction and SMAD activity and is elevated in intensive care unit-acquired weakness. Am J Respir Crit Care Med. 2017;196(11):1422–1433.
- Li J, Bao H, Zhang K, et al. MiR-542-3p drives renal fibrosis by targeting AGO1 in vivo and in vitro. Life Sci. 2020;255:117845.
- Li Q, Song S, Ni G, et al. Serum miR-542-3p as a prognostic biomarker in osteosarcoma. CBM. 2018;21(3):521–526.
- He T, Qi F, Jia L, et al. Tumor cell-secreted angiogenin induces angiogenic activity of endothelial cells by suppressing miR-542-3p. Cancer Lett. 2015;368(1):115–125.
- Zhang X, Zhu Y, Zhang C, et al. miR-542-3p prevents ovariectomy-induced osteoporosis in rats via targeting SFRP1. J Cell Physiol. 2018;233(9):6798–6806.
- Qian DH, Gao P, Feng H, et al. Down-regulation of mir-542-3p promotes neointimal formation in the aging rat. Vascul Pharmacol. 2015;72:118–129.
- Liu H, Wang H, Yang S, et al. Downregulation of miR-542-3p promotes osteogenic transition of vascular smooth muscle cells in the aging rat by targeting BMP7. Hum Genomics. 2019;13(1):67.
- Li LJ, Huang Q, Zhang N, et al. miR-376b-5p regulates angiogenesis in cerebral ischemia. Mol Med Rep. 2014;10(1):527–535.
- Chen Y, Xu Y, Deng Z, et al. MicroRNA expression profiling involved in doxorubicin-induced cardiotoxicity using high-throughput deep-sequencing analysis. Oncol Lett. 2021;22(1):560.
- Li X, Wang X, Liu YS, et al. Downregulation of miR-3568 protects against ischemia/Reperfusion-Induced cardiac dysfunction in rats and apoptosis in H9C2 cardiomyocytes through targeting TRIM62. Front Pharmacol. 2020;11:17.
- Ma M, Duan R, Shen L, et al. The lncRNA Gm15622 stimulates SREBP-1c expression and hepatic lipid accumulation by sponging the miR-742-3p in mice. J Lipid Res. 2020;61(7):1052–1064.
- Nguyen-Yamamoto L, Tanaka KI, St-Arnaud R, et al. Vitamin D-regulated osteocytic sclerostin and BMP2 modulate uremic extraskeletal calcification. JCI Insight. 2019;4(13):e126467.