
Abstract
Objective: The study sought to synthesize research on the relationship between time spent engaged in sedentary behaviours (SB) and self-efficacy. Analyses investigated whether such associations are moderated by age, conceptualization of self-efficacy, conceptualization of SB, and/or SB measurement.
Design and Main Outcome Measures: The review was registered with PROSPERO (no. CRD42018086899). Studies including associations between self-efficacy and SB were identified through a systematic search of six databases. Inclusion criteria were met by k = 26 original studies.
Results: A random effect meta-analysis showed that higher levels of self-efficacy were associated with lower levels of SB (r = −.158, 95% CI [−.220, −.094]). Moderator analyses indicated that associations between self-efficacy and SB may be similar in strength across age groups, the conceptualizations of self-efficacy or SB and SB measurements.
Conclusion: The findings provide preliminary guidance for future interventions targeting reduction of SB, although more longitudinal research is needed to draw causal inferences.
Introduction
Sedentary behaviour (SB) can be defined as any waking activities characterised by an energy expenditure ≤1.5 metabolic equivalents (METs) while in a sitting, lying or reclining posture (Tremblay et al., Citation2017). On average, we spend between 150 and 620 min per day engaged in SB (Loyen et al., Citation2016; Matthews et al., Citation2008). In other words, this is what most of us are doing most of our waking time. Greater time spent engaged in SB is associated with increased risk of all-cause mortality, type 2 diabetes, fatal and non-fatal cardiovascular diseases, metabolic syndrome and some types of cancer in adults (Rezende et al., Citation2014). Among children and adolescents, SB is associated with obesity, increased blood pressure, total cholesterol, poorer physical fitness, social behaviour problems, poorer self-esteem and lower academic achievement (Rezende et al., Citation2014).
Importantly, SB and physical activity (PA) may be weakly related: people meeting PA guidelines may still spend considerable time engaged in SB (Pearson et al., Citation2014). Identifying modifiable determinants of SB, such as individual’s beliefs about SB and their perceived ability to reduce SB, would provide helpful targets for interventions designed to reduce time spent engaged in SB (Salmon et al., Citation2011).
Self-efficacy is considered as one of the most powerful proximal predictors of health behaviour change (Williams & Rhodes, Citation2016). Individual’s beliefs about one’s own efficacy constitute the primary explanatory construct in social cognitive theory (SCT; Bandura, Citation1997), transtheoretical model (Prochaska & DiClemente, Citation1983), health action process approach (HAPA; Luszczynska & Schwarzer, Citation2015), health belief model (Rosenstock et al., Citation1988) and protection motivation theory (Rogers, Citation1983). Self-efficacy is defined as individuals’ beliefs about an ability to engage in actions required to reach a desired goal (Bandura, Citation1997; Luszczynska & Schwarzer, Citation2015). People with high levels of self-efficacy perceive difficult tasks as challenges to be mastered, set themselves more ambitious goals, maintain strong goal motivation, have higher sense of control over threatening situations, recover more quickly following setbacks and are more flexible in adopting new goal-pursuit strategies (Bandura, Citation1997; Luszczynska & Schwarzer, Citation2015). Usually, self-efficacy is conceptualized as situation- or domain-specific (Luszczynska & Schwarzer, Citation2015). For example, in relation to reducing SB, specific self-efficacy may refer to confidence about the ability to stand up every 30 minutes, breaking up periods of SB, regardless of feeling tired.
The original SCT (Bandura, Citation1997) emphasizes the use of situation-specific self-efficacy measures as an operationalization strategy, adopted to increase predictive power by taking the context into account (Cervone, Citation2000; Luszczynska & Schwarzer, Citation2015). Although SCT suggests measuring specific beliefs, self-efficacy beliefs may become generalized and such general beliefs may operate across different behavioural contexts (Cervone, Citation2000). In particular, individuals may develop underlying self-knowledge about their enduring personal characteristics, including self-efficacy, based on their self-evaluations and actions undertaken in a specific context. These aspects of self-knowledge may come to mind and shape self-efficacy beliefs in any other contexts. In line with these assumptions, several studies have shown that general self-efficacy is significantly associated with behaviour-specific self-efficacy, including exercise self-efficacy, as well as with different types of health behaviours, such as SB (see for Chang & Sok, Citation2015; Leganger et al., Citation2000; Luszczynska et al., Citation2004; Luszczynska et al., Citation2005).
Many sedentary activities may be habitual (Conroy et al., Citation2013) and hence regulated by automatic processes with little or no consciously reconsideration. However, conscious regulation can be exerted to reduce and/or change such automatically-regulated behaviours (Borland, Citation2014; Hagger, Citation2017). Reflective consideration of sedentary activities may involve goal setting and bolstering self-efficacy beliefs to support disruption of habitual SB with active breaks. Clarification of the role of habit and the importance of self-efficacy beliefs in SB disruption could enhance effective development of SB-reducing interventions (Conroy et al., Citation2013).
To date, one systematic review of 12 studies assessing self-efficacy—SB associations has suggested that higher self-efficacy (including general self-efficacy, SB reduction self-efficacy and PA self-efficacy) may be associated with lower SB (Rollo et al., Citation2016). Other existing meta-analyses of energy expenditure behaviours addressed only self-efficacy—PA relationships (Hagger et al., Citation2002; Zhang et al., Citation2019). Therefore, our study aimed to synthesise existing empirical evidence for associations between self-efficacy and SB. Besides the estimation of the associations between self-efficacy and SB, the study would investigate if the association is moderated by the conceptualization of self-efficacy and SB, the assessment of SB and the age of the target population.
There is an ongoing discussion within the scientific community on how SB is related to physical activity (PA) (van der Ploeg & Hillsdon, Citation2017) and whether SB is determined by variables different than those that predict PA (Katzmarzyk, Citation2010; Owen et al., Citation2010). If SB and PA constitute two distinct patterns of behaviour, they should be explained by distinct predictors. For example, the associations between PA-specific predictors (PA self-efficacy) and SB should be weaker than the associations between SB-specific predictors (SB reduction self-efficacy) and SB.
SB takes different forms and may include different types of behaviour (Compernolle et al., Citation2018; Tremblay et al., Citation2017). A conceptual model presented by Biddle, Pearson and Salmon (Citation2018; see also Biddle, Citation2018) suggests that at least two types of SB should be distinguished, namely total sitting time and total screen time. In childhood and adolescence screen time is one of the most frequently performed after-school activities (Arundell et al., Citation2016).
Failure to quantify the impact of different measures on effect size calculation is an important limitation of meta-analyses, including those addressing SB (Rezende et al., Citation2014). The method of SB measurement may have a significant impact on recorded levels of activity (Prince et al., Citation2008; Saunders et al., Citation2011). Accelerometry typically does not match with subjective measurement with self-reports underestimating SB time (for review see Adamo et al., Citation2009). Given the discrepancies between direct measures and self-report measures of energy expenditure behaviours it is prudent to explore if the SB measurement method may moderate self-efficacy—SB association.
Frameworks explaining the links between SB and their psychosocial correlates, such as systems of sedentary behaviours framework (Chastin et al., Citation2016), suggest that these links may be also moderated by age. Stronger effects are expected in older populations (Chastin et al., 2016). Unfortunately, the moderating role of age has been rarely considered because research often focuses on children/adolescents or on adults only (e.g., Chastin et al., Citation2015; Stierlin et al., Citation2015). Therefore, there are no direct comparisons of the effects of age group on the associations between psychosocial predictors, such as self-efficacy and SB.
Thus current research highlights four potential moderators of self-efficacy—SB associations, namely, (1) the conceptualization of self-efficacy (SB reduction self-efficacy vs. PA self-efficacy), (2) the conceptualization of SB (total sitting time vs. screen time), (3) the effect of the SB measurement (objective vs. self-report) and (4) the age group (children/adolescents vs. adults).
Materials and methods
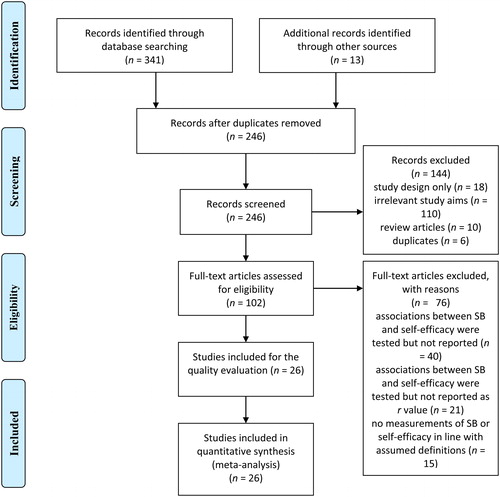
This study was conducted in line with the Preferred Reporting Items for Systematic Reviews and Meta-Analyses (PRISMA) guidelines (Moher et al., Citation2009) and was registered with PROSPERO (#CRD42018086899). A systematic database search of original studies was conducted. The following electronic databases were searched up to January 2019 to identify relevant studies: PsycINFO, PsycARTICLES, Academic Search Complete, Health Source: Nursing/Academic Edition, Scopus and MEDLINE. The searched terms included: ‘sedentar* behav*’ OR ‘sedentar* time’ OR ‘sitting behav*’ OR ‘physical inactivity’ OR ‘watch* television’ OR ‘watch* time’ OR ‘screen time’ OR ‘computer behav*’ OR ‘sedent* lifestyle’ AND ‘self-efficac*’. These terms were based on keywords used in previous systematic reviews and meta-analyses addressing self-efficacy and SB (Allen et al., Citation2017; Banik et al., Citation2018; Boberska et al., Citation2018). The electronic database search identified 246 articles which included the keywords at the title and abstract level. Full-text articles were obtained and read in full to determine their eligibility. A manual search through references of screened papers was conducted and resulted in identifying 13 additional studies. The selection process resulted in 26 studies which met the inclusion criteria. A flow chart of study selection process is reported in .
Figure 1. The flow chart of selection process.
Inclusion/exclusion criteria and data extraction
The following inclusion criteria were applied: (1) the study should measure self-efficacy and SB; (2) it should report associations between self-efficacy and SB (Pearson’s r or statistics that could be converted into correlation coefficients, e.g., odds ratios); (3) it should report quantitative results of original findings; (4) the study should be published in English language in a peer-reviewed journal. Research using objective and subjective measures of SB were included. There were no restrictions on participants’ age and health status. If data allowing for the estimate of the associations between self-efficacy and SB were not reported, authors of the original studies were contacted via e-mail inquiry and asked to provide respective coefficients. A total of 60 inquiries were sent and 13 responses with respective coefficients were obtained.
Following data were extracted: number of participants (with % of women), mean age (or age range, if mean age was not provided), the country of study origin, study design, self-efficacy measures, SB measures, main findings considering self-efficacy—SB associations and any data needed for conducting the quality evaluation. Supplementary material (Appendix B) presents the summary of included studies.
At least two members of the research team were involved at every stage of study selection and data extraction (ZS, AB). Any disagreements in the process of study selection and data extraction were resolved by a consensus method, including a discussion followed by a third researcher (AL) (Higgins & Green, Citation2011).
Quality assessment
To account for the risk of bias in individual studies, the methodological quality of the included studies was determined by the Standard Quality Assessment Criteria (Kmet et al., Citation2004). Each study was scored independently by two researchers (ZS, AB) in terms of meeting 11 criteria (2 points for ‘yes’, 1 for ‘partial’, 0 for ‘no’). Criteria relevant to intervention studies only were not applied to cross-sectional or longitudinal studies and marked ‘n/a’ (not applicable). Summary scores for each study were calculated in line with guidelines provided by Kmet et al. (Citation2004). Each study could score between 0 and 100%. All studies which met the 65% threshold were included in further analysis. The moderate cut-off point of 65% was chosen from five possible liberal-to-conservative cut-off points (55, 60, 65, 70 and 75%); 65% threshold indicates moderate quality. To evaluate the level of agreement between the two researchers we calculated interclass correlation coefficients (ICC) using a mean measurement, absolute-agreement, 2-way mixed effects model (Koo & Li, Citation2016). The ICC was .672, 95% CI [.270, .853], indicating a moderate level of agreement (Koo & Li, Citation2016).
Definitions of variables and coding
The variables for which data were sought were defined as follows: SB was defined as any waking behaviour characterised by an energy expenditure ≤ 1.5 METs while in a sitting, lying or reclining posture, such as occupational sitting, transport sitting, sitting during social meetings, leisure sitting including any type of screen activities (Tremblay et al., Citation2017). Self-efficacy was defined as individual’s ability to engage in actions required to reach a desired goal; general self-efficacy was defined as referring to a wide and stable sense of ability to deal with different demanding situations, whereas specific self-efficacy was defined as relating to the ability to accomplish specific goals referring to particular situations, such as increasing PA or reducing SB (Bandura, Citation1997; Luszczynska & Schwarzer, Citation2015).
For the purpose of the meta-analysis, potential moderators were coded to examine their effects on the self-efficacy—SB relationship. The following moderators were coded: (1) the type of SB conceptualization (total screen time vs. total sitting time); (2) the type of self-efficacy conceptualization (SB reduction self-efficacy vs. PA self-efficacy); (3) the type of SB measurement (objective vs. self-report measures); (4) the age group of participants (studies which enrolled children/adolescents vs. adults vs. older adults).
The conceptualization of SB referred to the total SB time and total screen time. Coding was based on the information about SB measurement provided by included studies and on the conceptual model proposed by Biddle et al. (Citation2018), distinguishing two main SB categories: total sitting time and total screen time. SB was coded as ‘total sitting time’ if studies used measures of the total amount of time spent sitting/reclining during daily or leisure activities including engagement in TV viewing, computer use, sitting during motorised transport, occupation activities, at desk, reading books, talking on the phone, playing a musical instrument, eating, completing hobbies, listening to the music/screen and small screen recreation, education, travelling, cultural activities or social activities. Also, if the studies used objective measurement of total SB (e.g., with accelerometers) respective data were coded as ‘total sitting time’. SB was coded as ‘total screen time’ if studies measured the amount of time spent on TV/DVD/videos viewing, computer using, playing computer/other electronic games, working on the computer, leisure time internet use, or assessed screen time viewing in general (without providing types of screen time activities).
Several original studies provided multiple coefficients for the associations between SE and SB, assessed with distinct measures, differing in validity, reliability and sensitivity. In line with the standard approach used in meta-analysis multiple coefficients obtained within one sample were combined to obtain one coefficient, adjusted for the problem of non-independence and calculated assuming the correlation among the outcomes (Borenstein et al., Citation2011). This strategy was used to obtain a single coefficient per original study representing the association between SE and SB, required to calculate the overall effect. Furthermore, the coefficients obtained within one original study were combined to obtain the one coefficient representing associations referring to e.g., ‘total sitting time’, ‘total screen time’, ‘self-reported SB’, ‘SB reduction self-efficacy’, required to conduct the moderation analyses.
If a study provided several coefficients for different types of screen time (e.g., separate coefficients for TV watching and computer using), the coefficients were combined and the mean was used in the analysis as one indicator of ‘total screen time’ (two studies: Alert et al., Citation2019; Verloigne et al., Citation2015). In case a study provided coefficients for total screen time and for different types of screen time separately, only the coefficient for the total screen time was used in the analysis (one study: Huang et al., Citation2013).
Next, the coefficients from original studies, representing the associations for the ‘total sitting time’ and self-efficacy were extracted. In cases there were several coefficients for this association in one study, the coefficients were combined to obtain one indicator of ‘total sitting time’. If a study provided several coefficients of the association between SB and self-efficacy and they were referring to different domains of sitting (such as TV watching, computer using, sitting during transport, occupational sitting) the coefficients were combined and the mean was used in the analysis as one indicator of ‘total sitting time’ (two studies: Busschaert et al., Citation2016; Huang et al., Citation2013). In case of two studies (Jago et al., Citation2007; Maher & Conroy, Citation2016) that reported two types of SB measurement, namely self-report and an objective method (accelerometry) and provided two correlation coefficients separately, the mean of the two coefficients was used and coded as ‘total sitting time’. The combination of accelerometer-based and self-report- based coefficients was conducted assuming that both types of assessments have some limitations. For example, assessment conducted with hip-worn accelerometer (applied in a study conducted by Jago et al., Citation2007) has a limited validity in terms of differentiating between sitting and standing still (Byrom et al., Citation2016), whereas self-reports of sitting time may underestimate the time spent sitting as some activities, such as food intake (Chastin et al., Citation2014). In cases when studies provided two coefficients of the self-efficacy—SB association, one referring to weekend and another to weekdays the coefficients were combined and the mean was used in the analysis (two studies: Hankonen et al., Citation2017; Whittemore et al., Citation2013).
Further, to test the moderating effects of objective vs subjective measurement of SB, coefficients for self-reported assessment of SB and objective assessment of SB were retrieved. In studies that assessed SB with objective methods, such as accelerometers, the coefficients representing the objective measurement were extracted. If a study reported separate coefficients for self-report and for objective measurement, only the coefficients obtained with objective measurement were entered to the moderator analysis (two studies: Jago et al., Citation2007; Maher & Conroy, Citation2016). This decision was taken because only four studies used objective measures alone, whereas 18 studies used self-report. Therefore, the coefficients obtained in two studies (Jago et al., Citation2007; Maher & Conroy, Citation2016) were coded twice, first for the moderator analysis testing the effect of the type of SB, second for the moderator analysis testing the moderating effect of objective vs. self-report measurement.
Finally, studies were coded as involving ‘children and adolescents’ if the mean age of participants fell below 18 years old; ‘adults’ when age fell between 18 and 65 years old; and for ‘older adults’, with mean age ≥ 70 years old. There were no age groups with the mean age ranging between 65 and 70 years old.
If a study provided several self-efficacy—SB cross-sectional coefficients for separate measurement points (e.g., the coefficient for the baseline, the coefficient for the follow-up), the baseline coefficient was used in the analyses (seven studies: Alert et al., Citation2019; Busschaert et al., Citation2016; De Cocker et al., Citation2017; Gebremariam et al., Citation2012; Hadgraft et al., Citation2017; Maher et al., Citation2010; Whittemore et al., Citation2013). The summary of coding for each original study is reported in the supplementary material (Appendix A).
Data analysis
Data obtained from 26 studies including k = 28 samples (two studies used two separate samples for men and women; Alert et al., Citation2019; Garcia et al., Citation2017) were analysed using the Comprehensive Meta-Analysis software (version 2.2; Biostat, Citation2005) in order to calculate the estimates of the average effects, heterogeneity and the effects of the moderators. The measure of effect size was weighted r. Each study included into the analyses provided r-Pearson’s correlation between an indicator of self-efficacy and SB, assessed cross-sectionally. The correlation coefficients were converted to Fisher’s Z scale and all analyses were performed using the transformed values (Borenstein et al., Citation2011). Summary effects and respective confidence intervals were then converted back to correlation units.
A random-effects model was employed (Borenstein et al., Citation2010). To test the heterogeneity the Q-test was used. The Q-statistic provides a test of the null hypothesis that all studies in the analysis share a common effect size. To test the effects of moderators, the estimate of the effect size was calculated for each subgroup established on a basis of the respective level of a moderator. The subgroup mean effect sizes were then compared using QB-statistic, which is used as an omnibus test for detecting between-group differences (Hedges & Pigott, Citation2004). To investigate asymmetry caused by publication bias, a funnel plot (see supplementary material, Appendix C) was screened and the Egger test was conducted. Raw data and outputs of all analyses are available at https://osf.io/jtv6b/.
Results
A meta-analytic synthesis of findings
Appendix B displays detailed information about 26 studies included in the meta-analysis (Alert et al., Citation2019; Bagherniya et al., Citation2015; Busschaert et al., Citation2016; Chang & Sok, Citation2015; de Cocker et al., Citation2017; de Cocker et al., Citation2014; Garcia et al., Citation2017; Gebremariam et al., Citation2012; Gillison et al., Citation2017; Hadgraft et al., Citation2017; Hankonen et al., Citation2017; Huang et al., Citation2013; Huffman et al., Citation2015; Jago et al., Citation2007; Langguth et al., Citation2015; Lawman & Wilson, Citation2014; Lee et al., Citation2016; Lines et al., Citation2018; Maher & Conroy, Citation2016; Maher et al., Citation2010; Norman et al., Citation2005; Suchert et al., Citation2015; Van Dyck et al., Citation2011; Verloigne et al., Citation2015; Whittemore et al., Citation2013; Wilkerson et al., Citation2018). To calculate the estimate of the average effects and the effects of the moderators, data from 11,432 participants were included (see ) from the total of 12,537 who were enrolled across 26 studies (see Appendix B). The difference between number of participants in analyses vs. the original study samples occurred since in several cases the coefficients provided by authors in response to our inquiry were based on a smaller n than N reported in the publication (seven cases: Bagherniya et al., Citation2015, Busschaert et al., Citation2016; De Cocker et al., Citation2017; De Cocker et al., Citation2014; Lee et al., Citation2016; Norman et al., Citation2005; Verloigne et al., Citation2015). Original studies’ samples ranged from 41 to 2,022 participants. Sixteen studies were conducted among children and adolescents (mean age = 13.47, SD = 2.17; one study did not provide the mean age of participants, only the age range of 15–17; Alert et al., Citation2019), eight studies enrolled adults (mean age = 43.39, SD = 10.04) and two studies were conducted among older adults (mean age = 72.53, SD = 2.36). Eighteen studies (70%) had a cross-sectional design, four (15%) were of correlational-longitudinal design and four (15%) were randomised controlled trials. Eight studies were conducted in the United States, four in Australia, three in Belgium, two in Germany, Great Britain and South Korea and one each in: China, Finland, Iran and Norway. One study was conducted in five European countries (Belgium, Germany, Greece, Hungary and Norway).
Table 1. Results of meta-analysis and moderation analysis of the association between self-efficacy and sedentary behaviour.
Publication bias and quality of included studies
An inspection of the funnel plot (see Appendix C) and the values of the Egger test (intercept: 1.08, p = .234, 95% CI [−1.92, 4.09], t = 0.633, df = 26), suggested an absence of a publication bias. The mean quality scores for the included original studies are presented in the supplementary material (Appendix B). Overall, 26 studies were evaluated and the quality scores ranged from 65% to 100% (M = 89, SD = 7.98).
Results of meta-analysis
The results of the meta-analysis, including the estimates of the average effect and moderator analyses, are presented in . The estimate of the overall average effect for the association between measures of self-efficacy and SB was significant and small. The weighted r was -.158 (95% CI [−.220, −.094]). The Z-value testing the null hypothesis that the mean correlation is zero was −4.841, with a corresponding p < .001. Thus, higher levels of self-efficacy were associated with lower levels of SB.
Heterogeneity of the effect size
The Q-value was 304.98 (df = 27), p < .001, indicating that observed correlations varied from study to study. The I2, reflecting what proportion of the observed variance reflects differences in true effect sizes (rather than sampling error), was 91%. The variance of true effect sizes was τ2 = .025, the standard deviation was τ = .159 (both in Fisher’s Z units). Using an approach described by Borenstein et al. (Citation2017) it was estimated that the 95% prediction interval was between −.455 to .171.1
Results of the moderation analysis
Next, we tested the moderating effects for self-efficacy—SB relationship. The effects of four moderators were tested: (1) the type of conceptualization of SB (studies which were coded as investigating total screen time, k = 12 samples vs. total sitting time, k = 16 samples); (2) the type of conceptualization of self-efficacy (studies which assessed SB reduction self-efficacy, k = 12 vs. PA self-efficacy, k = 14). Due to a limited number of studies investigating general self-efficacy (k = 2; Lines et al., Citation2018; Suchert et al., Citation2015) the moderator role of such a conceptualization of self-efficacy was not tested; consequently, the two general self-efficacy studies were excluded from this analysis; (3) the type of SB measurement (studies which incorporated objective, k = 6 vs. self-report measures, k = 22); and (4) the age group of participants (studies which enrolled children/adolescents, k = 18 vs. adults, k = 8 vs. older adults, k = 2). The findings () showed no statistically significant effects of the four moderators on the self-efficacy—SB relationship.
Discussion
This study provides a synthesis of existing evidence for the associations between self-efficacy and SB. The estimate of the average effect (weighted r = −.158) indicates that there is a significant (but weak) relationship between individual’s confidence in their ability to reduce SB and lower levels of SB. To our knowledge, this is the first study that systematically tested the strength of associations between self-efficacy and SB, across types of self-efficacy, types of SB and populations varying in terms of age.
A relative weakness of the association may be due to the fact that SB is often habitually managed by automatic or reflexive processes, rather than consciously-monitored, reflective processes (Conroy et al., Citation2013). Nonetheless, the significant correlation across studies suggests that accounting for reflective processes and designed to promote self-efficacy in relation to breaking SB habits may be a useful component of SB-reduction interventions.
Our findings correspond to SCT (Bandura, Citation1997; Luszczynska & Schwarzer, Citation2015) predictions, supporting the idea that self-efficacy beliefs are important proximal determinants of behaviours. On the other hand, findings did not confirm some assumptions of SCT (Bandura, Citation1997; Cervone, Citation2000) indicating that the specificity of self-efficacy beliefs should determine the strength of the self-efficacy—health behaviour association. In particular, we found that associations between self-efficacy to reduce SB and SB were of similar strength, compared to the associations between PA self-efficacy and SB. Previous meta-analyses testing the moderating effect of conceptualization of self-efficacy yielded similar findings: Outcome-specific self-efficacy beliefs and other types of self-efficacy (e.g., general self-efficacy) formed associations of similar strength with health outcomes (Banik et al., Citation2018).
There are several reasons for a lack of the moderating effect of the behaviour-specific operationalization of self-efficacy beliefs (SB reduction self-efficacy vs. PA self-efficacy). It is possible that participants perceive SB and PA as a unidimensional construct (SB is low PA and PA is low SB). Consequently, this may result developing one, coherent set of perceptions of self-efficacy, referring to both SB reduction and PA increase. However, the observation that PA and SB self-efficacy perform consistently does not necessary mean that they constitute one construct (either theoretically, or from participant’s perspective). It just means that the associations are of similar strength. It is possible, for example, that although PA self-efficacy does not refer to SB directly, it refers to SB by proxy because time devoted to PA could replace time spent on SB, and that PA (together with standing) are the key alternatives to engaging in SB. It may be that PA self-efficacy represents a specific (albeit more general) construct that may operate as a generalised cognitive resource for both increasing PA and decreasing SB time. Finally, it may be hypothesised that SB reduction self-efficacy may also operate in a similar manner, that is it may form significant relationships with both SB and PA. Evidence for cross-behaviour cognitions (Rhodes & Blanchard, Citation2008) indicated that SB-related cognitions explain PA intention (and indirectly, PA), after controlling for PA-related cognitions. Future longitudinal research should clarify if self-efficacy for reducing SB and self-efficacy for increasing PA may operate interchangeably in ‘real life’ settings, why the effects of the two cognitions are similar, or, if these two cognitions form one construct.
Future research is needed to test the strength of associations of both PA and SB reduction self-efficacy beliefs with both PA and SB. Such research would provide more solid arguments for the discussion referring to the distinct character of SB and PA (van der Ploeg & Hillsdon, Citation2017). If SB and PA are distinct behaviours, reflective processes which are related to SB should be also distinct, compared to reflective processes related to PA. Our findings do not allow us to be clear about how PA and SB self-efficacy are related to SB levels and SB reduction success.
We found that self-efficacy—SB relationship was not moderated by the age group, the conceptualization of SB or the measurement of SB. Therefore, it may be hypothesised that self-efficacy enhancing interventions have the potential to contribute to SB reduction across populations of children/adolescents, adults and older adults. Self-efficacy enhancing interventions may be a good choice for individuals engaging predominantly in screen use behaviour and those who report a high level of the total SB time, involving various SB activities.
The majority of included studies employed correlational, cross-sectional designs. Therefore, the order in which self-efficacy and SB are chained cannot be determined. In line with SCT, the way individual experienced the behaviour and its mastery in the past would determine self-efficacy beliefs in future (Bandura, Citation1997; Luszczynska & Schwarzer, Citation2015). It is plausible to assume that higher levels of SB would predict lower self-efficacy beliefs. Unfortunately, existing data does not allow to provide a response to the query about the order in which self-efficacy and SB operate. Longitudinal experimental studies are needed to clarify theses causal sequences.
Last but not least, the present study raises several conceptual issues, referring to defining, operationalizing, and interpreting findings referring to SB. SB is an umbrella term coined to represent any behaviours characterized by energy expenditure < 1.5 MET (Tremblay et al., Citation2017). People are sedentary while engaging in various leisure time and work/school activities. These activities may be perceived by individuals as completely distinct, differing in terms of habit formation, environmental constrains, etc. In other words, sedentary behaviour is always accompanying another behaviour that may have a distinct meaning and relevance to participants of respective studies (Gardner et al., Citation2019). Following the definitions of Sedentary Behavior Research Network (Tremblay et al., Citation2017) researchers may decide to disregard these actions accompanying SB and collect self-reports of ‘total SB time’ or ‘total screen time’ (often combining work/school and leisure-time activities). Fortunately, the majority of research included in this meta-analysis did not ask participants to merely report ‘time spent sitting’ but assessed specific actions performed when sitting, e.g., asking participants to report hours spent on watching TV while sitting, using a computer at work while sitting, sitting in public transportation when commuting to work, etc. (e.g., Alert et al., Citation2019; Busschaert et al., Citation2016; Chang & Sok, Citation2015; Garcia et al., Citation2017; Hankonen et al., Citation2017; Huang et al., Citation2013; Jago et al., Citation2007; Lee et al., Citation2016; Maher & Conroy, Citation2016; Verloigne et al., Citation2015; Wilkerson et al., Citation2018). Unfortunately, although many studies investigated specific actions performed when sitting, they usually combined the time spent on various actions spent when sitting into one index (e.g., of total sitting leisure time or of total screen time, respectively). Therefore, it was impossible to test if the self-efficacy—SB associations differ across specific actions undertaken when sitting (e.g., using a computer at work when sitting vs. using a computer at leisure time when sitting). Future research should investigate the sizes of associations between specific actions performed when sitting and their respective cognitive determinants. Such research could help develop behaviour-specific SB-reduction interventions.
The present study has several limitations. As mentioned earlier, the major limitations deal with the cross-sectional character of analysed data and a lack of the measurement of both PA and SB behaviours and respective PA self-efficacy or SB reduction self-efficacy beliefs in the original trials (except for Hankonen et al., Citation2017). Limitations of analysed data prevented us from forming conclusions regarding the order in which these constructs operate. Our meta-analysis focused on distinguishing two types of SB only, as proposed by Biddle et al. (Citation2018), yet other types of SB have been discriminated, such as non-screen-based SB (Tremblay et al., Citation2017). The lack of a moderating effect of SB measurement may be due to a limited number of ‘objective’ assessments applying the optimal method of SB measurement, namely a thigh-worn ActivPal accelerometer (Byrom et al., Citation2016). Future research may investigate the moderating effects of different types of self-report and different types of objective assessment. In addition, the high heterogeneity of effects calls for further caution when interpreting our results.
These limitations, notwithstanding, the study provides a novel insight into the associations between self-efficacy and SB. The evidence collected to date suggests that stronger beliefs about one’s own competence are associated with less time spent on SB. The association is similar, regardless of the conceptualization of self-efficacy, conceptualization and measurement of SB, or the age of the enrolled population. The findings recommend targeting self-efficacy beliefs in interventions designed to reduce time spent on sedentary activities.
Supplemental Material
Download MS Word (72.9 KB)Acknowledgments
Not applicable.
Disclosure statement
The authors declare no competing interests.
Data availability statement
Raw data and outputs of all analyses are available at https://osf.io/jtv6b/.
Additional information
Funding
Notes
1 The prediction interval, reported in the manuscript, is an index of dispersion, not precision (such as CI). The prediction intervals are calculated with M ± 2 SD. In contrast, CI for the effect size is calculated based on M ± 2 SE. Importantly, the prediction intervals are calculated to assess the heterogeneity of the mean effect, that is how much does the effect may vary across studies. In line with the procedure proposed by Borenstein et al. (Citation2017) the mean effect may be adjusted using the prediction interval. In the present meta-analysis, the Q-statistic showed that the mean effect significantly varied from study to study (p < .001), with the 95% prediction interval indicating that the so-called ‘true’ correlation between self-efficacy and SB varies from one population to the next and is likely to falls in this range (−.45 to .17).
In contrast to the prediction interval, effect sizes are calculated, with the corresponding confidence interval to assess if self-efficacy is associated with SB (cf. Borenstein et al., 2017). CI for the effect size indicates that the mean association between the two constructs could fall anywhere in this range. If this range does not include zero, it means that that the mean effect is different from zero.
References
- Adamo, K. B., Prince, S. A., Tricco, A. C., Connor-Gorber, S., & Tremblay, M. (2009). A comparison of indirect versus direct measures for assessing physical activity in the pediatric population: A systematic review. International Journal of Pediatric Obesity, 4(1), 2–27. https://doi.org/10.1080/17477160802315010
- *Alert, M. D., Saab, P. G., Llabre, M. M., & McCalla, J. R. (2019). Are self-efficacy and weight perception associated with physical activity and sedentary behavior in Hispanic adolescents? Health Education & Behavior, 46(1), 53–62. https://doi.org/10.1177/1090198118788599
- Allen, M. S., Walter, E. E., & McDermott, M. S. (2017). Personality and sedentary behavior: A systematic review and meta-analysis. Health Psychology: Official Journal of the Division of Health Psychology, American Psychological Association, 36(3), 255–263. https://doi.org/10.1037/hea0000429.supp https://doi.org/10.1037/hea0000429
- Arundell, L., Fletcher, E., Salmon, J., Veitch, J., & Hinkley, T. (2016). A systematic review of the prevalence of sedentary behavior during the after-school period among children aged 5-18 years. International Journal of Behavioral Nutrition and Physical Activity, 13(1), 9. https://doi.org/10.1186/s12966-016-0419-1
- *Bagherniya, M., Sharma, M., Mostafavi, F., & Keshavarz, S. A. (2015). Application of social cognitive theory in predicting childhood obesity prevention behaviors in overweight and obese Iranian adolescents. International Quarterly of Community Health Education, 35(2), 133–147. https://doi.org/10.1177/0272684X15569487
- Bandura, A. (1997). Self-efficacy: The exercise of control. Freeman/Times Books/Henry Holt & Co.
- Banik, A., Schwarzer, R., Knoll, N., Czekierda, K., & Luszczynska, A. (2018). Self-efficacy and quality of life among people with cardiovascular diseases: A meta-analysis. Rehabilitation Psychology, 63(2), 295–312. https://doi.org/10.1037/rep0000199
- Biddle, S. J. H. (2018). Sedentary behaviour at the individual level: Correlates, theories, and interventions. In: M. Leitzmann, C. Jochem, & D. Schmid (eds.), Sedentary behaviour epidemiology. Springer.
- Biddle, S. J. H., Pearson, N., & Salmon, J. (2018). Sedentary behaviors and adiposity in young people: Causality and conceptual model. Exercise and Sport Sciences Reviews, 46(1), 18–25. https://doi.org/10.1249/JES.0000000000000135
- Biostat. (2005). Comprehensive meta-analysis version 2. Biostat 104.
- Boberska, M., Szczuka, Z., Kruk, M., Knoll, N., Keller, J., Hohl, D. H., & Luszczynska, A. (2018). Sedentary behaviours and health-related quality of life. A systematic review and meta-analysis. Health Psychology Review, 12(2), 195–210. https://doi.org/10.1080/17437199.2017.1396191
- Borenstein, M., Hedges, L. V., Higgins, J. P. T., & Rothstein, H. R. (2010). A basic introduction to fixed-effect and random-effects models for meta-analysis. Research Synthesis Methods, 1(2), 97–111. https://doi.org/10.1002/jrsm.12
- Borenstein, M., Hedges, L. V., Higgins, J. P., & Rothstein, H. R. (2011). Introduction to meta-analysis. Wiley. https://doi.org/10.1002/9780470743386
- Borenstein, M., Higgins, J. P., Hedges, L. V., & Rothstein, H. R. (2017). Basics of meta-analysis: I2 is not an absolute measure of heterogeneity. Research Synthesis Methods, 8(1), 5–18. https://doi.org/10.1002/jrsm.1230
- Borland, R. (2014). Understanding hard to maintain behaviour change: A dual process approach. Wiley-Blackwell. Addiction Press.
- *Busschaert, C., De Bourdeaudhuij, I., Van Cauwenberg, J., Cardon, G., & De Cocker, K. (2016). Intrapersonal, social-cognitive and physical environmental variables related to context-specific sitting time in adults: A one-year follow-up study. The International Journal of Behavioral Nutrition and Physical Activity, 13, 28. https://doi.org/10.1186/s12966-016-0354-1
- Byrom, B., Stratton, G., Mc Carthy, M., & Muehlhausen, W. (2016). Objective measurement of sedentary behaviour using accelerometers. International Journal of Obesity, 40(11), 1809–1812. https://doi.org/10.1038/ijo.2016.136
- Cervone, D. (2000). Thinking about self-efficacy. Behavior Modification, 24(1), 30–56. https://doi.org/10.1177/0145445500241002
- *Chang, A. K., & Sok, S. R. (2015). Predictors of sedentary behavior in elderly Koreans with hypertension. The Journal of Nursing Research : Jnr, 23(4), 262–270. https://doi.org/10.1097/JNR.0000000000000094
- Chastin, S. F. M., Buck, C., Freiberger, E., Murphy, M., Brug, J., Cardon, G., O'Donoghue, G., Pigeot, I., & Oppert, J.-M. (2015). Systematic literature review of determinants of sedentary behaviour in older adults: A DEDIPAC study. The International Journal of Behavioral Nutrition and Physical Activity, 12, 127. https://doi.org/10.1186/s12966-015-0292-3
- Chastin, S. F. M., De Craemer, M., Lien, N., Bernaards, C., Buck, C., Oppert, J.-M., Nazare, J.-A., Lakerveld, J., O'Donoghue, G., Holdsworth, M., Owen, N., Brug, J., & Cardon, G. (2016). The SOS-framework (Systems of Sedentary Behaviours): An international transdisciplinary consensus framework for the study of determinants, research priorities and policy on sedentary behaviour across the life course: A DEDIPAC-study. International Journal of Behavioral Nutrition and Physical Activity, 13, 83. https://doi.org/10.1186/s12966-016-0409-3
- Chastin, S. F. M., Fitzpatrick, N., Andrews, M., & DiCroce, N. (2014). Determinants of sedentary behavior, motivation, barriers and strategies to reduce sitting time in older women: A qualitative investigation. International Journal of Environmental Research and Public Health, 11(1), 773–791. https://doi.org/10.3390/ijerph110100773
- Compernolle, S., Van Dyck, D., De Cocker, K., Palarea-Albaladejo, J., De Bourdeaudhuij, I., Cardon, G., & Chastin, S. F. M. (2018). Differences in context-specific sedentary behaviors according to weight status in adolescents, adults and seniors: A compositional data analysis. International Journal of Environmental Research and Public Health, 15(9), 1916. https://doi.org/10.3390/ijerph15091916
- Conroy, D. E., Maher, J. P., Elavsky, S., Hyde, A. L., & Doerksen, S. E. (2013). Sedentary behavior as a daily process regulated by habits and intentions. Health Psychology: Official Journal of the Division of Health Psychology, American Psychological Association, 32(11), 1149–1157. https://doi.org/10.1037/a0031629
- *De Cocker, K., De Bourdeaudhuij, I., Cardon, G., & Vandelanotte, C. (2017). What are the working mechanisms of a web-based workplace sitting intervention targeting psychosocial factors and action planning? BMC Public Health, 17(1), 382. https://doi.org/10.1186/s12889-017-4325-5
- *De Cocker, K., Duncan, M. J., Short, C., van Uffelen, J. G. Z., & Vandelanotte, C. (2014). Understanding occupational sitting: Prevalence, correlates and moderating effects in Australian employees. Preventive Medicine, 67, 288–294. https://doi.org/10.1016/j.ypmed.2014.07.031
- *Garcia, J. M., Agaronov, A., Sirard, J. R., Whaley, D., Rice, D. J., & Weltman, A. (2017). Psychosocial and friend influences on objective sedentary behavior and screen time: A mixed methods analysis. Journal of Physical Activity and Health, 14(3), 213–221. https://doi.org/10.1123/jpah.2016-0035
- Gardner, B., Flint, S., Rebar, A. L., Dewitt, S., Quail, S. K., Whall, H., & Smith, L. (2019). Is sitting invisible? Exploring how people mentally represent sitting. The International Journal of Behavioral Nutrition and Physical Activity, 16(1), 85. https://doi.org/10.1186/s12966-019-0851-0
- *Gebremariam, M. K., Totland, T. H., Andersen, L. F., Bergh, I. H., Bjelland, M., Grydeland, M., Ommundsen, Y., & Lien, N. (2012). Stability and change in screen-based sedentary behaviours and associated factors among Norwegian children in the transition between childhood and adolescence. BMC Public Health, 12(1), 104. https://doi.org/10.1186/1471-2458-12-104
- *Gillison, F. B., Standage, M., Cumming, S. P., Zakrzewski-Fruer, J., Rouse, P. C., & Katzmarzyk, P. T. (2017). Does parental support moderate the effect of children’s motivation and self-efficacy on physical activity and sedentary behaviour?. Psychology of Sport and Exercise, 32(5), 153–161. https://doi.org/10.1016/j.psychsport.2017.07.004
- *Hadgraft, N. T., Winkler, E. A. H., Healy, G. N., Lynch, B. M., Neuhaus, M., Eakin, E. G., Dunstan, D. W., Owen, N., & Fjeldsoe, B. S. (2017). Intervening to reduce workplace sitting: Mediating role of social-cognitive constructs during a cluster randomised controlled trial. International Journal of Behavioral Nutrition and Physical Activity, 14(1), 27https://doi.org/10.1186/s12966-017-0483-1
- Hagger, M. S. (2017). Health behavior and the reflective-impulsive model. In: R. Deutsch, B. Gawronski, & W. Hofmann (eds.), Reflective and impulsive determinants of human behavior (pp. 157–172). Routledge/Taylor & Francis Group.
- Hagger, M. S., Chatzisarantis, N. L. D., & Biddle, S. J. H. (2002). A meta-analytic review of the theories of reasoned action and planned behavior in physical activity: Predictive validity and the contribution of additional variables. Journal of Sport and Exercise Psychology, 24(1), 3–32. https://doi.org/10.1123/jsep.24.1.3
- *Hankonen, N., Heino, M. T. J., Kujala, E., Hynynen, S.-T., Absetz, P., Araújo-Soares, V., Borodulin, K., & Haukkala, A. (2017). What explains the socioeconomic status gap in activity? Educational differences in determinants of physical activity and screentime. BMC Public Health, 17(1), 144. https://doi.org/10.1186/s12889-016-3880-5
- Hedges, L. V., & Pigott, T. D. (2004). The power of statistical tests for moderators in meta-analysis. Psychological Methods, 9(4), 426–445. https://doi.org/10.1037/1082-989X.9.4.426
- Higgins, J., & Green, S. (2011). Cochrane handbook for systematic reviews of interventions. John Wiley. https://doi.org/10.1002/9780470712184
- *Huang, W. Y., Wong, S. H., & Salmon, J. (2013). Correlates of physical activity and screen-based behaviors in Chinese children. Journal of Science and Medicine in Sport , 16(6), 509–514. https://doi.org/10.1016/j.jsams.2012.12.011
- *Huffman, K. M., Pieper, C. F., Hall, K. S., St Clair, E. W., & Kraus, W. E. (2015). Self-efficacy for exercise, more than disease-related factors, is associated with objectively assessed exercise time and sedentary behaviour in rheumatoid arthritis. Scandinavian Journal of Rheumatology, 44(2), 106–110. https://doi.org/10.3109/03009742.2014.931456
- *Jago, R., Baranowski, T., Baranowski, J. C., Cullen, K. W., & Thompson, D. I. (2007). Social desirability is associated with some physical activity, psychosocial variables and sedentary behavior but not self-reported physical activity among adolescent males. Health Education Research, 22(3), 438–449. https://doi.org/10.1093/her/cyl107
- Katzmarzyk, P. T. (2010). Physical activity, sedentary behavior, and health: paradigm paralysis or paradigm shift? Diabetes, 59(11), 2717–2725. https://doi.org/10.2337/db10-0822
- Kmet, L. M., Lee, R. C., & Cook, L. S. (2004). Standard quality assessment criteria for evaluating primary research papers from a variety of fields. Alberta Heritage Foundation.
- Koo, T. K., & Li, M. Y. (2016). A guideline of selecting and reporting intraclass correlation coefficients for reliability research. Journal of Chiropractic Medicine, 15(2), 155–163. https://doi.org/10.1016/j.jcm.2016.02.012
- *Langguth, N., Könen, T., Matulis, S., Steil, R., Gawrilow, C., & Stadler, G. (2015). Barriers to physical activity in adolescents: A multidimensional approach. Zeitschrift Für Gesundheitspsychologie, 23(2), 47–59. https://doi.org/10.1026/0943-8149/a000136
- *Lawman, H. G., & Wilson, D. K. (2014). Associations of social and environmental supports with sedentary behavior, light and moderate-to-vigorous physical activity in obese underserved adolescents. The International Journal of Behavioral Nutrition and Physical Activity, 11, 92https://doi.org/10.1186/s12966-014-0092-1
- *Lee, E. Y., An, K., Jeon, J. Y., Rodgers, W. M., Harber, V. J., & Spence, J. C. (2016). Biological maturation and physical activity in South Korean adolescent girls. Medicine & Science in Sports & Exercise, 48(12), 2454–2461. https://doi.org/10.1249/MSS.0000000000001031
- Leganger, A., Kraft, P., & R⊘Ysamb, E. (2000). Perceived self-efficacy in health behaviour research: Conceptualisation, measurement and correlates. Psychology & Health, 15(1), 51–69. https://doi.org/10.1080/08870440008400288
- *Lines, R. L. J., Ducker, K. J., Ntoumanis, N., Thøgersen-Ntoumani, C., Fletcher, D., McGarry, S., & Gucciardi, D. F. (2018). Stress, physical activity, and resilience resources: Tests of direct and moderation effects in young adults. Sport, Exercise, and Performance Psychology. https://doi.org/10.1037/spy0000152.supp https://doi.org/10.1037/spy0000152
- Loyen, A., Van Hecke, L., Verloigne, M., Hendriksen, I., Lakerveld, J., Steene-Johannessen, J., Vuillemin, A., Koster, A., Donnelly, A., Ekelund, U., Deforche, B., De Bourdeaudhuij, I., Brug, J., & van der Ploeg, H. P. (2016). Variation in population levels of physical activity in European adults according to cross-European studies: A systematic literature review within DEDIPAC. International Journal of Behavioral Nutrition and Physical Activity, 13, 72. https://doi.org/10.1186/s12966-016-0398-2
- Luszczynska, A., Gibbons, F. X., Piko, B. F., & Tekozel, M. (2004). Self-regulatory cognitions, social comparison, and perceived peers’ behaviors as predictors of nutrition and physical activity: A comparison among adolescents in Hungary, Poland, Turkey, and USA. Psychology & Health, 19(5), 577–593. https://doi.org/10.1080/0887044042000205844
- Luszczynska, A., Scholz, U., & Schwarzer, R. (2005). The general self-efficacy scale: Multicultural validation studies. The Journal of Psychology, 139(5), 439–457. https://doi.org/10.3200/JRLP.139.5.439-457
- Luszczynska, A., & Schwarzer, R. (2015). Social cognitive theory. In: M. Conner & P. Norman (Eds.), Predicting and changing health behaviour: Research and practice with social cognition models (pp. 225–251). Open University Press.
- *Maher, J. P., & Conroy, D. E. (2016). A dual-process model of older adults’ sedentary behavior. Health Psychology, 35(3), 262–272. https://doi.org/10.1037/hea0000300.supp https://doi.org/10.1037/hea0000300
- *Maher, C. A., Williams, M. T., Olds, T., & Lane, A. E. (2010). An internet-based physical activity intervention for adolescents with cerebral palsy: A randomized controlled trial. Developmental Medicine & Child Neurology, 52(5), 448–455. https://doi.org/10.1111/j.1469-8749.2009.03609.x
- Matthews, C. E., Chen, K. Y., Freedson, P. S., Buchowski, M. S., Beech, B. M., Pate, R. R., & Troiano, R. P. (2008). Amount of time spent in sedentary behaviors in the United States, 2003-2004. American Journal of Epidemiology, 167(7), 875–881. https://doi.org/10.1093/aje/kwm390
- Moher, D., Liberati, A., Tetzlaff, J., & Altman, D. G. (2009). Preferred reporting items for systematic reviews and meta-analyses: The PRISMA statement. PLoS Medicine, 6(7), e1000097. https://doi.org/10.1371/journal.pmed.1000097
- *Norman, G. J., Schmid, B. A., Sallis, J. F., Calfas, K. J., & Patrick, K. (2005). Psychosocial and environmental correlates of adolescent sedentary behaviors. Pediatrics, 116(4), 908–916. https://doi.org/10.1542/peds.2004-1814
- Owen, N., Healy, G. N., Matthews, C. E., & Dunstan, D. W. (2010). Too much sitting: The population health science of sedentary behavior . Exercise and Sport Sciences Reviews, 38(3), 105–113. https://doi.org/10.1097/JES.0b013e3181e373a2
- Pearson, N., Braithwaite, R. E., Biddle, S. J. H., van Sluijs, E. M. F., & Atkin, A. J. (2014). Associations between sedentary behaviour and physical activity in children and adolescents: A meta-analysis. Obesity Reviews, 15(8), 666–675. https://doi.org/10.1111/obr.12188
- Prince, S. A., Adamo, K. B., Hamel, M. E., Hardt, J., Gorber, S., & Tremblay, M. (2008). A comparison of direct versus self-report measures for assessing physical activity in adults: A systematic review. The International Journal of Behavioral Nutrition and Physical Activity, 5, 56https://doi.org/10.1186/1479-5868-5-56
- Prochaska, J. O., & DiClemente, C. C. (1983). Stages and processes of self-change of smoking: Toward an integrative model of change. Journal of Consulting and Clinical Psychology, 51(3), 390–395. https://doi.org/10.1037/0022-006X.51.3.390
- Rezende, L. M., Rodrigues Lopes, M., Rey-López, J. P., Matsudo, V. R., & Luiz, O. C. (2014). Sedentary behavior and health outcomes: An overview of systematic reviews. PLoS One, 9(8), e105620. https://doi.org/10.1371/journal.pone.0105620
- Rhodes, R. E., & Blanchard, C. M. (2008). Do sedentary motives adversely affect physical activity? Adding cross-behavioural cognitions to the theory of planned behaviour. Psychology & Health, 23(7), 789–805. https://doi.org/10.1080/08870440701421578
- Rogers, R. W. (1983). Cognitive and physiological processes in fear appeals and attitude change: A revised theory of protection motivation. In: J. Cacioppo & R. Petty (Eds.), Social psychophysiology. (pp. 153–177). Guilford Press.
- Rollo, S., Gaston, A., & Prapavessis, H. (2016). Cognitive and motivational factors associated with sedentary behavior: A Systematic Review. AIMS Public Health, 3(4), 956–984. https://doi.org/10.3934/publichealth.2016.4.956
- Rosenstock, I. M., Strecher, V. J., & Becker, M. H. (1988). Social Learning Theory and the Health Belief Model. Health Education Quarterly, 15(2), 175–183. https://doi.org/10.1177/109019818801500203
- Salmon, J., Tremblay, M. S., Marshall, S. J., & Hume, C. (2011). Health risks, correlates, and interventions to reduce sedentary behavior in young people. American Journal of Preventive Medicine, 41(2), 197–206. https://doi.org/10.1016/j.amepre.2011.05.001
- Saunders, T. J., Prince, S. A., & Tremblay, M. S. (2011). Clustering of children’s activity behaviour: The use of self-report versus direct measures. International Journal of Behavioral Nutrition and Physical Activity, 8(1), 48. https://doi.org/10.1186/1479-5868-8-48
- Stierlin, A. S., De Lepeleere, S., Cardon, G., Dargent-Molina, P., Hoffmann, B., Murphy, M. H., Kennedy, A., O'Donoghue, G., Chastin, S. F. M., & De Craemer, M. (2015). A systematic review of determinants of sedentary behaviour in youth: A DEDIPAC-study. The International Journal of Behavioral Nutrition and Physical Activity, 12, 133. https://doi.org/10.1186/s12966-015-0291-4
- *Suchert, V., Hanewinkel, R., & Isensee, B. (2015). Sedentary behavior, depressed affect, and indicators of mental well-being in adolescence: Does the screen only matter for girls? Journal of Adolescence, 42, 50–58. https://doi.org/10.1016/j.adolescence.2015.03.014
- Tremblay, M. S., Aubert, S., Barnes, J. D., Saunders, T. J., Carson, V., Latimer-Cheung, A. E., Chastin, S. F. M., Altenburg, T. M., & Chinapaw, M. J. M. (2017). Sedentary Behavior Research Network (SBRN) - Terminology Consensus Project process and outcome. International Journal of Behavioral Nutrition and Physical Activity, 14(1), 75. https://doi.org/10.1186/s12966-017-0525-8
- van der Ploeg, H. P., & Hillsdon, M. (2017). Is sedentary behaviour just physical inactivity by another name? International Journal of Behavioral Nutrition and Physical Activity, 14(1), 142. https://doi.org/10.1186/s12966-017-0601-0
- *Van Dyck, D., Cardon, G., Deforche, B., Owen, N., De Cocker, K., Wijndaele, K., & De Bourdeaudhuij, I. (2011). Socio-demographic, psychosocial and home-environmental attributes associated with adults' domestic screen time. BMC Public Health, 11(1), 668. https://doi.org/10.1186/1471-2458-11-668
- *Verloigne, M., Van Lippevelde, W., Bere, E., Manios, Y., Kovács, É., Grillenberger, M., Maes, L., Brug, J., & De Bourdeaudhuij, I. (2015). Individual and family environmental correlates of television and computer time in 10- to 12-year-old European children: The ENERGY-project. BMC Public Health, 15, 912. https://doi.org/10.1186/s12889-015-2276-2
- *Whittemore, R., Jeon, S., & Grey, M. (2013). An internet obesity prevention program for adolescents. Journal of Adolescent Health, 52(4), 439–447. https://doi.org/10.1016/j.jadohealth.2012.07.014
- *Wilkerson, A. H., Usdan, S. L., Knowlden, A. P., Leeper, J. L., Birch, D. A., & Hibberd, E. E. (2018). Ecological influences on employees' workplace sedentary behavior: A cross-sectional study. American Journal of Health Promotion : AJHP, 32(8), 1688–1696. https://doi.org/10.1177/0890117118767717
- Williams, D. M., & Rhodes, R. E. (2016). The confounded self-efficacy construct: conceptual analysis and recommendations for future research. Health Psychology Review, 10(2), 113–128. https://doi.org/10.1080/17437199.2014.941998
- Zhang, C. Q., Zhang, R., Schwarzer, R., & Hagger, M. S. (2019). A meta-analysis of the health action process approach. Health Psychology: Official Journal of the Division of Health Psychology, American Psychological Association, 38(7), 623–637. https://doi.org/10.1037/hea0000728