
Abstract
Objective
Many adolescents report a lack of physical activity (PA) and excess screen time (ST). Psychological theories aiming to understand these behaviours typically focus on predictors of only one behaviour. Yet, behaviour enactment is often a choice between options. This study sought to examine predictors of PA and ST in a single model. Variables were drawn from dual process models, which portray behaviour as the outcome of deliberative and automatic processes.
Design
411 Finnish vocational school students (age 17–19) completed a survey, comprising variables from the Reasoned Action Approach (RAA) and automaticity pertaining to PA and ST, and self-reported PA and ST four weeks later.
Main outcome measures
Self-reported time spent on PA and ST and their predictors.
Results
PA and ST correlated negatively (r = −.17, p = .03). Structural equation modelling revealed that intentions and habit for PA predicted PA while ST was predicted by intentions and habit for ST and negatively by PA intentions. RAA-cognitions predicted intentions.
Conclusion
PA and ST and their psychological predictors seem to be weakly interlinked. Future studies should assess more behaviours and related psychological influences to get a better picture of connections between different behaviours.
Physical activity and screen time are largely mutually exclusive classes of behaviours and might therefore be related in terms of their psychological predictors.
411 adolescent vocational school students self-reported variables from the Reasoned Action Approach and behavioural automaticity related to physical activity and leisure time screen time behaviours as well as those behaviours.
Structural equation modelling revealed expected within-behaviour predictions but, against expectations, no strong connections between the two behaviour classes in terms of their predictors. Only intentions to engage in physical activity negatively predicted screen time.
Future research should aim to measure a wider range of mutually exclusive classes of behaviours that cover a large share of the day to uncover relations between behaviours and their respective predictors.
Highlights
Introduction
Lack of physical activity (PA) and excess sedentary behaviour (i.e. low energy-expending behaviour performed while sitting or lying down; Tremblay et al., Citation2017) are major public health concerns as they are associated with a range of undesirable health outcomes, including type 2 diabetes, some cancers, and depressive symptoms (Lee et al., Citation2012; Liu et al., Citation2016; Thorp et al., Citation2011). Engaging in PA, on the other hand, has a wide range of positive effects on adolescents’ mental and physical health (Janssen & LeBlanc, Citation2010). Importantly, the detrimental health effects of a lack of PA on the one hand and excess sedentary behaviours are at least partly independent (Costigan et al., Citation2013; Sugiyama et al., Citation2008). Four-fifths of adolescents do not reach public health guidelines of recommended levels of PA globally (Guthold et al., Citation2020; Hallal et al., Citation2012; Tremblay, Barnes, et al., 2016). Screen-based entertainment such as TV viewing, using computer and playing inactive video and computer games contribute significantly to cumulative sedentary behaviour (Biddle et al., Citation2004; Pate et al., Citation2008): one study reported that about 40% of total sedentary time was spent with screens (Olds et al., Citation2010) and this contribution tends to grow during the transition from childhood to adolescence (Pearson et al., Citation2017). 75% of Finnish adolescents report exceeding the recommended screen time of two hours daily (Kämppi et al., Citation2018; Strasburger & Hogan, Citation2010; Tremblay, Carson, et al., 2016). Developing interventions to decrease screen time and promote physical activity requires understanding the determinants of these behaviours.
Several health behaviour theories portray behaviour as a result of reflective, intentional processes. According to the Reasoned Action Approach (RAA; Fishbein & Ajzen, Citation2010) the most immediate predictor of behaviour is intention. Intention in turn is predicted by: beliefs about the expected positive or negative consequences of the behaviour (outcome expectancies), which determine attitudes towards the behaviour; beliefs about the extent to which significant others approve or disapprove of the behaviour (injunctive norms), and perform the behaviour themselves (descriptive norms); and beliefs about one’s capability to act, which comprises perceived abilities to perform a behaviour (perceived behavioural control) and to overcome external obstacles ( self-efficacy; Ajzen, Citation2020; Fishbein & Ajzen, Citation2010 ). Recent reviews indicate that self-efficacy (Craggs et al., Citation2011; Lubans et al., Citation2008; Van Der Horst et al., Citation2007), perceived behavioural control (Bauman et al., Citation2012; Craggs et al., Citation2011) and intention (van Stralen et al., Citation2011) best predict adolescent PA. The predecessor of the RAA, the Theory of Planned Behaviour (TPB) has been tested widely in the context of health-related behaviours, prospectively predicting almost a quarter of variance in physical activity, according to a meta-analysis (McEachan et al., Citation2011). By comparison, psychological predictors of screen time are less well understood (Downs & Hausenblas, Citation2005; Keadle et al., Citation2017).
In addition to the reflective, intentional processes postulated by the RAA, automatic processes play a key role in generating many behaviours (Conroy et al., Citation2013; Hagger et al., Citation2018; Sheeran et al., Citation2016; Sniehotta et al., Citation2014). One of the most commonly used concepts when studying behavioural automaticity is habit, which has been defined as ‘a process by which a stimulus automatically generates an impulse towards action, based on learned stimulus-response associations’ (Gardner, Citation2015, p. 280). The relationship between habit, intentions, and behaviour is complex (Gardner et al., Citation2020). While most habits presumably form through repeated execution of intended behaviour and thus support the execution of intentions, habit and intentions may come to conflict when intentions shift away from a persistent habitual response. These temporal dynamics present enormous challenges to studying the relations between habit, intention, and behaviour (Gardner et al., Citation2020).
The prediction of future behaviour is further complicated by the fact that no behaviour occurs in isolation but rather reflects a choice between different alternatives: time spent watching TV is time not spent engaging in alternative actions, such as running outdoors. Some studies have found that increases in PA correspond with reductions in sedentary behaviour (Conroy et al., Citation2013; LeBlanc et al., Citation2015, Citation2017; Quartiroli & Maeda, Citation2014). However, PA and sedentary behaviour constitute separate constructs (Taveras et al., Citation2007) and participants who adhere to PA guidelines might still show excess sedentary behaviour (Sugiyama et al., Citation2008). While the relation between screen time, as a sub-type of sedentary behaviour, and PA may be complex (Iannotti et al., Citation2009; Iannotti & Wang, Citation2013; Koezuka et al., Citation2006), sedentary behaviour and PA are generally negatively correlated (Leech et al., Citation2014; Rollo et al., Citation2016). Studies using the isotemporal substitution model (Mekary et al., Citation2009) aim to model how replacing one behaviour (e.g. sedentary screen time) by another (e.g. PA) affects different outcomes, such as weight (Mekary et al., Citation2013) and therefore shed some light on the relationship between different behaviours. Both PA and sedentary behaviours have been measured with questionnaires (Bouchard et al., Citation1983; Vizcaino et al., Citation2019) and accelerometers (Burchartz et al., Citation2020; Hart et al., Citation2011) with the results of the two approaches not always converging due to a range of technical and measurement issues (Hart et al., Citation2011).
While the issue of choice between behavioural options has been noted by the authors of the RAA and others (Ajzen, Citation2020; Ajzen & Kruglanski, Citation2019; Sheppard et al., Citation1988), relatively few studies have measured and modelled the influence of social cognitions towards behaviours other than the target behaviour (Ajzen & Sheikh, Citation2013; Gardner & Abraham, Citation2010). This focus on only one target behaviour and its cognitive antecedents oversimplifies the problem of behaviour choice and can lead to overestimates of the causal role of RAA variables in determining behaviour (Abraham & Sheeran, Citation2003). For example, when PA correlates strongly with the intention to engage in screen-based behaviours but controlling for intentions to engage in screen-based behaviours diminishes that correlation substantially. Accounting for potentially conflicting goals and corresponding behaviours therefore should increase the accuracy of the prediction of target behaviours (Abraham & Sheeran, Citation2003). Gardner and Abraham (Citation2010), for example, improved the prediction of car use by including cognitions towards using non-car alternatives. Studies of multiple behaviour change research (Prochaska et al., Citation2008) have demonstrated how intervening on more than one behaviour at a time can enhance effects (Ash et al., Citation2017; Maisano et al., Citation2020). For such interventions, knowing how predictors for the different behaviours relate to each other is crucial (Maisano et al., Citation2020).
In the current study, we sought to understand and contextualise physical activity and screen time, as a credible competing behaviour, by simultaneously investigating predictors of both behaviours and modelling the relations between them. Specifically, we focussed on RAA-postulated predictors and habit for engaging in physical activity and screen time in Finnish adolescents. Our aim was to provide a more comprehensive picture of the deliberate and habitual processes involved in making choices between behavioural alternatives.
Our research questions were:
How well do the variables from the RAA predict physical activity and screen time, respectively?
Does a measure of habit contribute to the predictive power of the model for the target behaviour?
Do the measured predictors for screen time add to the predictive power of the model for physical activity and vice versa?
We consider these questions exploratory as we have no specific hypotheses about the size of the effects.
Methods
Participants, design and procedures
Data were collected in 2013 via an electronic survey (The Active Life as Adolescent Survey, ALiAS) amongst Finnish vocational and high school students aged 17–19 years. 18 vocational schools and high-schools were invited to participate of which ten agreed and eight provided data at both timepoints. We included data from students from those schools that participated at both timepoints. Data collection took place during the physical or health education lessons, at schools, under teacher supervision. Participants answered all questions about cognitive variables at baseline and self-reported physical activity and screen time within approximately four weeks of the first survey. The study protocol was reviewed by the ethics committee of the Hospital District of Helsinki and Uusimaa. Altogether 411 adolescents (42% boys, 58% girls; mean age 17.8 years) gave informed consent and voluntarily provided responses at baseline. 190 students provided responses at follow-up with drop-out mainly caused by difficulties to reach students who were doing out of school training periods at follow-up.
Belief elicitation study
As a part of the questionnaire development, a belief elicitation study (Fishbein & Ajzen, Citation2010) was conducted in one vocational school with N = 51 students to identify relevant beliefs for the cognitive variables postulated by the RAA and to develop a questionnaire. Salient beliefs were elicited through a questionnaire with open-ended questions. For outcome expectancies, the participants were asked: ‘What would be the consequences if you engaged in more than 2 hours of screen time a day?’ and ‘What would be the consequences if you engaged in leisure time physical activity at least three times a week?’; for normative beliefs ‘Are there people who would approve of your engagement in leisure time physical activity at least three times a week/more than two hours of daily screen time?’, ‘Are there people who would not approve of your engagement in leisure time physical activity at least three times a week/more than two hours of daily screen time?’ and ‘Are there people who engage in leisure time physical activity at least three times a week/more than two hours of daily screen time?’; for control beliefs ‘What could make it easier to you to engage in leisure time physical activity at least three times a week/more than two hours of daily screen time?’ and ‘What could make it more difficult to you to engage in leisure time physical activity/more than two hours of daily screen time?’. Answers to the open-ended questions were content analysed following the procedure recommended in the literature (Fishbein & Ajzen, Citation2010; Francis et al., Citation2004; Sutton et al., Citation2003) and the most common outcome expectations were selected to be developed into questionnaire items. No further quantitative preliminary study was done on these items, i.e. measurement properties were not tested in a separate study, but there was a small think-aloud study of the entire questionnaire, including these items.
Objective measurement of PA
To assess the validity of the self-report measure of PA, objective measurement was obtained in a subsample (N = 44), using a waist-worn validated 3-axial accelerometer (Hookie Meter v2.0, Hookie Technologies Ltd, Espoo, Finland). The activity data was registered as raw data using a 100 Hz sample rate with 2GB internal flash memory. Accelerometers were worn to monitor PA for seven consecutive days but not at night and when in contact with water. A diary indicating non-wear time was completed.
Questionnaire measures
Outcome expectancies, injunctive and descriptive norms, perceived behavioural control and self-efficacy and intention, were measured according to recommendations (Fishbein & Ajzen, Citation2010; Francis et al., Citation2004) on 7-point Likert scales ranging from ‘totally disagree’ to ‘totally agree’ unless stated otherwise. The number of items represents the balance between ensuring reliable measurement and reducing participant burden. Apart from PA (see below), there was no additional validation of the used measures.
The items for each variable were summed and averaged for the analyses. This approach was chosen over latent variable modelling as our sample size did not allow for a very complex model. Cronbach’s alphas ranged from .63 to .95 (see ), indicating sufficient internal consistency and reliability. In the questionnaire, physical activity was defined as follows: By exercise we mean leisure time physical activity which makes your heart beat faster and gets you out of breath. This kind of exercise can be, amongst other things, cycling to school, ball games, running, brisk walking, roller skating, skating, snowboarding, downhill skiing, gym, aerobics, dancing or corresponding group sports. Similarly, leisure screen time was defined as including sitting down in front of a screen in participants’ free time.
Table 1. Means, standard deviations, and bivariate correlations for all variables.
Outcome expectancies
Outcome expectancies for PA were measured with a stem ‘What would be the consequences if you exercised briskly or efficiently three times a week for at least 30 minutes each time?’ followed by nine items, informed by the belief elicitation study (see the Supplementary Table for the items, formed based on the results of the elicitation study). Outcome expectancies for screen time were measured in the same way, with a stem ‘What would be the consequences if you engaged in more than 2 hours of screen time a day?’ followed by nine items. For both PA and screen time, two variables were formed on the basis of factor analysis: positive and negative outcome expectancies.
Subjective norms
Based on previous reviews showing the importance of parental and peer influence on physical activity in adolescents (Edwardson & Gorely, Citation2010; Van Der Horst et al., Citation2007), these two groups were used in the items to measure normative influences. Respondents indicated their agreement to three items measuring descriptive norms (e.g. ‘Most of my friends exercise regularly’) and two items measuring injunctive norms (e.g. ‘My parents would like me to exercise regularly’) towards PA.
Subjective norms for screen time were measured with two items for descriptive norms (e.g. ‘Most of my friends engage in screen time more than two hours per day in their free time’) and two items for injunctive norms (e.g. ‘My parents would approve of me engaging in screen time more than two hours per day in my free time’). The items were formulated based on recommendations by Ajzen (Citation2002).
Self-efficacy (SE) and perceived behavioural control (PBC)
SE for PA was measured with two items (e.g. ‘If I wanted to, I could do active sports and/or vigorous exercise three times per week’) and PBC for PA was measured with one item (‘I feel in complete control over whether I will do active sports and/or vigorous exercise three times a week’). SE to engage in more than two hours a day with a screen was measured with one item ‘If I wanted to, I could watch TV, play console games and spend time on computer more than two hours per day in my free time’ reflecting the common definition at the time of data collection and PBC for screen time with one item (‘I feel in complete control over whether I will watch TV, play console games or spend time on computer more than two hours per day in my free time’). For both PA and screen time, SE and PBC items were summed and treated in the analyses as a unitary construct since these two constructs are both theoretically similar (Fishbein & Ajzen, Citation2010) and perceived as very similar by participants as evidenced by the high Cronbach’s alpha scores for the combined scales (.88 for PA, .80 for screen time). For ease of reading, we refer to this variable as perceived control from hereon.
Intentions
We measured participants’ intention for PA with their agreement with the statement ‘I intend to do active sports and/or vigorous exercise, for at least 30 minutes, 3 days per week during my free time, over the next 4 weeks’ on two 7-point scale ranging from ‘unlikely’ to ‘very likely’ and ‘definitely not’ to ‘definitely yes’. Intention for screen time was measured separately for weekdays and weekends with one item ‘I intend to watch TV, play console games or spend my time on computer more than two hours a day on weekdays over the next four weeks/on weekends over the next 4 weeks’.
Behavioural automaticity as an index of habit
The Self-Report Behavioural Automaticity Index (Gardner et al., Citation2012; Verplanken & Orbell, Citation2003) was used to measure automaticity, including statements such as ‘Exercise/watching TV, playing console games or spending free time on a computer is something I do automatically’ with a response scale ranging from 1 to 7.
Physical activity
PA was assessed with the question ‘How many hours in a normal week are you physically active in your leisure time so that you get out of breath and sweaty?’, with response alternatives: ‘not at all’, ‘about 0.5 hours’, ‘about 1 hour’, ‘about 2–3 hours’, ‘about 4–6 hours’, and about ‘7 hours or more’. While this is an ordinal rather than a continuous variable, there is evidence that ML estimators produce relatively unbiased fit indices, parameter estimates, and standard errors, if ordinal variables have many categories (at least five) and are approximately normal (Finney & DiStefano, Citation2006). We thus used it as a continuous variable in the structural equation model.
Screen time
Screen time was assessed separately for different behaviours (watching TV, playing computer or console games) and for weekdays and weekend: ‘How many hours a day during the last four weeks have you watched TV on a normal weekday/weekend?’ and ‘How many hours a day during the last four weeks have you played console games or used a computer for your free time activities on a normal weekday/weekend?’. The response alternatives were: ‘not at all’, ‘0.5 hours per day’, ‘one hour per day’, ‘2 hours per day’, ‘2.5 hours per day’, ‘3 hours per day’, ‘3.5 hours per day’, and ‘4 hours or more per day’. Replies about the different screen time activities were coded into hours and combined to indicate the total weekly hours of screen time for use in all models. We selected these activities as those were the main sources of leisure screen time at the time of data collection. Asking respondents separately for different kinds of leisure screen time activities was implemented to improve the accuracy of the time estimates.
Statistical analyses
All analyses were conducted with R software (R Core Team, Citation2017), using the following packages: lavaan (Rosseel, Citation2012), semPlot (Epskamp, Citation2019), tidySEM (Lissa, Citation2020), semTable (Johnson & Kite, Citation2020), apaTables (Stanley, Citation2018), corrplot (Wei & Simko, Citation2017), ggplot2 (Wickham, Citation2016), foreign (R Core Team, Citation2018), stargazer (Hlavac, Citation2018), dplyr (Wickham et al., Citation2020), and tidyr (Wickham & Henry, Citation2020).
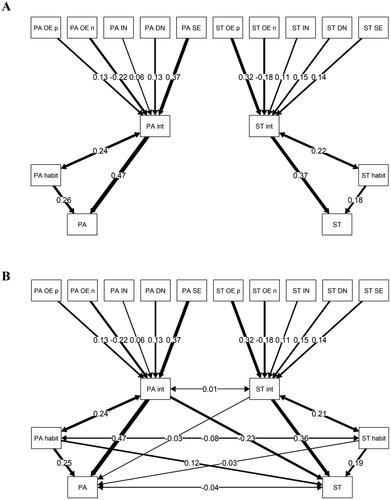
To examine our research questions we constructed one structural equation model (SEM) in which intentions for one behaviour were predicted by outcome expectancies (positive and negative), subjective norms (descriptive and injunctive), and perceived control for that behaviour. Intention, together with automaticity predicted behaviour with their correlation freely estimated. In a second step, intention and habit for PA was allowed to correlate with intention and habit for screen time, respectively, and intention and habit for PA predicted screen time and vice versa (‘cross-over’ effects). Panel A of depicts the first and panel B the final model.
Figure 1. Structural equation models without (panel A) and with (panel B) ‘cross-over’ effects. NB: correlations between exogenous variables (positive/negative outcome expectancies; injunctive norms; descriptive norms; perceived control; habit; all for both PA and screen time) are omitted from the graph for clarity but were estimated in the model. Correlation coefficients are shown on the double-arrow lines and standardized regression coefficients are shown on the single arrow lines. Thickness of the lines corresponds to the strength of the estimated path. P-values for all paths depicted in the figure can be found in .
Variable labels: OE p/n: positive/negative outcome expectancies; IN: injunctive norms; DN: descriptive norms; SE: perceived control; int: intention; PA: physical activity; ST: screen time.
Full Information Maximum Likelihood (FIML) estimation was used to handle missing values in the SEM. FIML uses all available information efficiently and produces less biased and more reliable results compared to conventional missing data techniques (e.g. listwise deletion or unconditional/conditional mean imputation) under MCAR (missing completely at random) and MAR (missing at random) (Allison, Citation2003; Roderick et al., Citation2002). The overall model fit was evaluated with several fit indexes, including the chi-square test statistic, the Standardized Root Mean Square Residual (SRMR), the Tucker-Lewis Index (TLI), the Comparative Fit Index (CFI), and the Root Mean Square Error of Approximation (RMSEA). TLI and CFI values as ≥ 0.95, the SRMR values as ≤ 0.08, and the RMSEA values as ≤ 0.06 were interpreted as good fit for the data, as suggested by Hu and Bentler (Citation1999).
Results
Belief elicitation study
The results of the content analysis of the responses to the belief elicitation study of the behavioural beliefs which informed the items in the outcome expectancies questionnaire are shown in the supplementary file.
Descriptive statistics and correlations
shows descriptive statistics for all included variables and the bivariate correlation coefficients between them. It is noteworthy that both intention variables were highly skewed such that many participants indicated strong intentions to be physically active and there were peaks in the distribution of ST intentions at low, medium, and high values. All variables pertaining to the same behaviour correlated in the predicted direction. ‘Cross-over’ correlations, (i.e. correlations between variables related to PA on variables related to screen time) on the other hand, were negligible.
The subsample accelerometer data enabled analysing the correlations between the objective and self-report measures of PA: the moderate correlation between the two (r = .30-.50) is similar to what is typically reported in the literature (Skender et al., Citation2016).
Participants who dropped out from baseline to follow-up significantly differed from retained participants in terms of average baseline age (m = 17.7 and sd = 0.69 for participants who provided data at both timepoints and m = 17.9 and sd = 0.68 for those dropping out, t (368.27) = −2.80, p = .005) and with boys being slightly more likely to drop-out than girls (χ2 = 3.57, p = .06). They did not significantly differ in terms of baseline PA or ST (ps > .55).
Structural equation models
The model without ‘cross-over’ effects showed good fit, χ2 (df = 39) = 46.80, p = .18, SRMR = .048, TLI = .985, CFI = .995, RMSEA =.022; CI90[.000-.043]. R2 was .41 for PA intentions, .42 for PA, .34 for screen time intentions, and .23 for screen time. (see , panel A).
Panel B of shows the second, ‘cross-over’ model with all modelled pathways and contains statistics for all pathways. Overall model fit was very similar to the first model with χ2 (df = 32) = 36.08, p = .28, SRMR = .033, TLI = .991, CFI = .998, RMSEA = .018; CI90[.000-.042]. R2 was .40 for PA intentions, .42 for PA, .34 for screen time intentions, and .26 for screen time.
Table 2. Unstandardised parameter estimates including ‘cross-over’ effects (the model depicted in Panel B of ).
The strongest predictor for intentions to engage in PA was perceived control (β = .37, p < .001) whereas intention to engage in screen time behaviour was best predicted by positive outcome expectations (β = .32, p < .001). Both intentions and habit for PA predicted self-reported PA reasonably well (β = .47, p < .001; β = .25, p < .001, respectively). For screen time, the parameter estimates for intentions and habits were β = .36, p < .001, and β = .19, p = .016, respectively. With regard to research question 3 (‘cross-over’ effects), only the parameter linking PA intentions with screen time reached statistical significance (β = −.23, p = .007; other β between −0.08 and .12, p-values between .12 and .64, see and ). This indicates that intending to engage in PA is weakly related to lower amounts of screen time and that having a habit to engage in PA had no significant effect on screen time and vice versa.
To determine whether either model fit the data better than the other, we conducted a chi-square difference test which turned out non-significant (χ2difference = 10.73; df difference= 7; p = .15), indicating that the fit of the models did not significantly differ from one another. Considering that more parsimonious models are generally preferable, the first model, without ‘cross-over’ effects, may be interpreted as optimal.
Discussion
The current study aimed to investigate the role of predictive variables from the Reasoned Action Approach (outcome expectancies, self-efficacy and perceived behavioural control, descriptive and injunctive norms, and intentions) and a measure of behavioural automaticity in the prediction of physical activity and screen time in adolescents. Crucially, it examined the role of the predictors for one behaviour in predicting the other behaviour while modelling the predictors for the target behaviour. Results suggest that behavioural intentions had a stronger influence on both target behaviours than habits for the behaviour. Intentions, in turn, were most strongly predicted by perceived control (for PA) and outcome expectancies (for screen time). Variables relating to one behaviour barely predicted the respective other behaviour: while intentions to engage in PA had a small negative effect on screen time, habit to engage in PA was not predictive of screen time and vice versa and intending to engage in screen-based behaviours did not predict PA.
The main novelty of this study was the concurrent modelling of two behaviours that are reasonable alternatives to each other: physical activity and screen-based activities such as watching television or playing computer games. Against our expectations, we did not find strong negative associations between the time spent on the two behaviours. Furthermore, there was also no association between their respective predictors such that participants with strong intentions to engage in PA would have weaker intentions to engage in screen-based activities (and vice versa) and that strong habits to engage in screen-based behaviours would be associated with weaker habits to be physically active (and vice versa). Additionally, we assumed that intentions to or a habit of engaging in one behaviour would be associated with less time spent on the other behaviour as the two behaviours are largely incompatible (Epstein et al., Citation1995, Citation1997). However, only one of the parameters representing these connections turned out to be significant (intentions for PA predicting slightly lower screen time), indicating that the behaviours and their respective predictors were not strongly interlinked in this sample. The sample thus consisted of individuals with different combinations of PA and screen time activities and the corresponding intentions and habits. The significant link between PA intentions and screen time, however, warrants further research. When considering these results we want to emphasize that all measures were based on self-reported data and effects on the target behaviours should therefore be interpreted with caution.
One reason for a lack of strong ‘cross-over’ effects might be that the behaviours in the current study are only two of a wide range of options how to spend spare time. In contrast with the current findings, earlier research had found effects of cognitions towards behavioural alternatives (Gardner & Abraham, Citation2010). In that study, participants’ cognitions towards using non-car travel modes predicted car use over and above cognitions towards car use. However, this set of alternatives is different from the one in the current study as it presented mutually exclusive behaviours which together describe all possible options: car or non-car. Future studies should therefore aim to identify and measure a wider range of behaviours that present credible alternatives to PA and screen time including light PA and other sedentary behaviours like reading and school work and their antecedents to give a more complete picture of how people choose between behavioural options. Isotemporal substitution studies which model the effects of replacing one activity with another activity seem a promising avenue in this regard (Mekary et al., Citation2013).
Our finding that intentions to engage in PA or screen time predicted the amount of time spent on PA and screen time, respectively, is in line with a large literature around the RAA underlining the importance of intentions for the prediction of behaviour (McEachan et al., Citation2016). The fact that the effect found here is somewhat smaller than recent meta-analytical estimates of RAA-based predictors was partly due to the fact that we included habit as an additional predictor which is not part of the RAA. This influence of habit on behaviour has also been reported widely in the literature (Gardner et al., Citation2011, Citation2020). Positive correlations between habits and intentions for each behaviour indicated that habits likely formed from originally intended behaviours, and that both PA and screen time intentions remained in line with the habits (Gardner et al., Citation2020). It should be noted that screen time is, of course, a function not only of intentions and habit but influenced by a wide variety of social, structural, and psychological variables, including age, sex, parental education, and life satisfaction (Abdel Magid et al., Citation2021; Ngantcha et al., Citation2018).
Limitations
The current study measured only two behaviours out of the countless activities that participants could choose to engage in and thus delivers only a partial picture of leisure time. Modelling more behaviours could better reveal the complex interactions between different types of behaviours and their antecedents by making choices between behaviours a ‘zero-sum game’ in which choosing to spend time on one behaviour automatically reduces time spent on other behaviours (Caspersen et al., Citation1985).
Relatedly, the analyses rely on self-reported behaviour. Such data is subject to several biases, including participants giving responses that seem socially desirable, or genuine difficulties to accurately report time spent on different activities. Especially in the case of screen time and PA, adolescents might be motivated to make a ‘good impression’ by over-reporting PA and under-reporting screen time as well as to distort intention ratings (Adams et al., Citation2005). While more elaborate measures of screen time have been developed these might still suffer from typical problems of self-reported data (Vizcaino et al., Citation2019). Furthermore, although most of the social cognitive construct items adhere to the TACT principle (i.e. describing behaviour in terms of its target, the action itself, the context of performance, and the time of performance, Francis et al., Citation2004), intentions were measured with more specific items than the other variables with regard to the time of intention (‘within the next four weeks’). Ideally, the same wording with regard to target, action, context and time should be used for all questions if feasible (Ajzen & Fishbein, Citation1977; Francis et al., Citation2004). However, a strength of the study is that it attempted to ensure that participants reply to questionnaires with a similar conception of physical activity (target behaviour). Different people may have different representations of what physical activity means, thus the repeated definition/specification of what this questionnaire means with the target behaviour, with illustrative and relevant examples, is likely to enhance comparability of responses across participants.
It must be noted that not all variables were normally distributed in our sample. Especially both intention variables deviated quite clearly from a normal distribution such that intentions for PA were generally rather high and intentions for screen-based activities peaked at low, medium, and high levels. While this should not have any influence on the parameter estimates it can influence model fit statistics (Finney & DiStefano, Citation2006). It is also interesting in terms of understanding the current sample: apparently there were relatively many participants with very low and very high intentions to engage in screen time and many participants had strong intentions to engage in PA. This might partly be due to the question framing which asked about the intention to engage in a specified amount of time spent on PA per week rather asking about participants’ intended amount of PA.
Some console games require physical activity (‘exergames’) and some participants might have worked out while watching TV. We want to emphasize that we accounted for this by delivering a definition of screen time that ruled out being active in front of the TV.
Lastly, by the time of writing, the used operationalisation of screen time as watching television or playing video or computer games is rather outdated as most Finnish adolescents now own smartphones and other digital devices which they use to replace computers and console games (Official Statistics of Finland, Citation2020). Future studies need to take this into account when researching issues that are changing as rapidly as the use of screen-based devices. This issue might be particularly pronounced in the current sample of adolescents and future research should aim to examine potential differences between different populations.
Conclusion
This paper investigated the role of predictors from the Reasoned Action Approach as well as habit in the prediction of leisure time physical activity and screen time behaviours in Finnish adolescents and investigated to what degree intentions and habits to engage in those behaviours are intertwined. While the model replicated past findings on the importance of intentions and (for physical activity) habits in the prediction of the target behaviour, only weak ‘cross-over’ predictive effects emerged. Future research should aim to assess data on a wider range of leisure time behaviours to obtain a more complete picture of what predicts how participants choose options how to spend their leisure time.
Supplemental Material
Download MS Word (12.3 KB)Disclosure statement
The authors declare no conflict of interest. None of the authors has any financial interest or benefit from the direct applications of this research.
Data availability statement
Data will be available publically via the Finnish Social Science Data Archive later this year.
Additional information
Funding
References
- Abdel Magid, H. S., Milliren, C. E., Pettee Gabriel, K., & Nagata, J. M. (2021). Disentangling individual, school, and neighborhood effects on screen time among adolescents and young adults in the United States. Preventive Medicine, 142, 106357. https://doi.org/10.1016/j.ypmed.2020.106357
- Abraham, C., & Sheeran, P. (2003). Implications of goal theories for the theories of reasoned action and planned behaviour. Current Psychology, 22(3), 264–280. https://doi.org/10.1007/s12144-003-1021-7
- Adams, S. A., Matthews, C. E., Ebbeling, C. B., Moore, C. G., Cunningham, J. E., Fulton, J., & Hebert, J. R. (2005). The effect of social desirability and social approval on self-reports of physical activity. American Journal of Epidemiology, 161(4), 389–398. https://doi.org/10.1093/aje/kwi054
- Ajzen, I. (2002). Constructing a TPB questionnaire: Conceptual and methodological considerations. http://www-unix.oit.umass.edu/∼aizen/pdf/tpb.measurement.pdf
- Ajzen, I. (2020). The theory of planned behavior: Frequently asked questions. Human Behavior and Emerging Technologies, 2(4), 314–311. https://doi.org/10.1002/hbe2.195
- Ajzen, I., & Fishbein, M. (1977). Attitude-behavior relations: A theoretical analysis and review of empirical research. Psychological Bulletin, 84(5), 888–918. https://doi.org/10.1037/0033-2909.84.5.888
- Ajzen, I., & Kruglanski, A. W. (2019). Reasoned action in the service of goal pursuit. Psychological Review, 126(5), 774–786. https://doi.org/10.1037/rev0000155
- Ajzen, I., & Sheikh, S. (2013). Action versus inaction: Anticipated affect in the theory of planned behavior. Journal of Applied Social Psychology, 43(1), 155–162. https://doi.org/10.1111/j.1559-1816.2012.00989.x
- Allison, P. D. (2003). Missing data techniques for structural equation modeling. Journal of abnormal psychology, 112(4), 545–557. https://doi.org/10.1037/0021-843X.112.4.545
- Ash, T., Agaronov, A., Young, T., Aftosmes-Tobio, A., & Davison, K. K. (2017). Family-based childhood obesity prevention interventions: A systematic review and quantitative content analysis. International Journal of Behavioral Nutrition and Physical Activity, 14(1), 113. https://doi.org/10.1186/s12966-017-0571-2
- Bauman, A. E., Reis, R. S., Sallis, J. F., Wells, J. C., Loos, R. J. F., Martin, B. W., & Lancet Physical Activity Series Working Group. (2012). Correlates of physical activity: Why are some people physically active and others not? The Lancet, 380(9838), 258–271. https://doi.org/10.1016/S0140-6736(12)60735-1
- Biddle, S. J., Gorely, T., Marshall, S. J., Murdey, I., & Cameron, N. (2004). Physical activity and sedentary behaviours in youth: Issues and controversies. The Journal of the Royal Society for the Promotion of Health, 124(1), 29–33. https://doi.org/10.1177/146642400312400110
- Bouchard, C., Tremblay, A., Leblanc, C., Lortie, G., Savard, R., & Thériault, G. (1983). A method to assess energy expenditure in children and adults. The American Journal of Clinical Nutrition, 37(3), 461–467. https://doi.org/10.1093/ajcn/37.3.461
- Burchartz, A., Anedda, B., Auerswald, T., Giurgiu, M., Hill, H., Ketelhut, S., Kolb, S., Mall, C., Manz, K., Nigg, C. R., Reichert, M., Sprengeler, O., Wunsch, K., & Matthews, C. E. (2020). Assessing physical behavior through accelerometry – State of the science, best practices and future directions. Psychology of Sport and Exercise, 49, 101703. https://doi.org/10.1016/j.psychsport.2020.101703
- Caspersen, C. J., Powell, K. E., Christenson, G. M., &., others. (1985). Physical activity, exercise, and physical fitness: Definitions and distinctions for health-related research. Public Health Reports (Washington, D.C.: 1974), 100(2), 126–131.
- Conroy, D. E., Maher, J. P., Elavsky, S., Hyde, A. L., & Doerksen, S. E. (2013). Sedentary behavior as a daily process regulated by habits and intentions. Health Psychology: Official Journal of the Division of Health Psychology, American Psychological Association, 32(11), 1149–1157. https://doi.org/10.1037/a0031629
- Costigan, S. A., Barnett, L., Plotnikoff, R. C., & Lubans, D. R. (2013). The health indicators associated with screen-based sedentary behavior among adolescent girls: A systematic review. The Journal of Adolescent Health: Official Publication of the Society for Adolescent Medicine, 52(4), 382–392. https://doi.org/10.1016/j.jadohealth.2012.07.018
- Craggs, C., Corder, K., van Sluijs, E. M. F., & Griffin, S. J. (2011). Determinants of change in physical activity in children and adolescents: A systematic review. American Journal of Preventive Medicine, 40(6), 645–658. https://doi.org/10.1016/j.amepre.2011.02.025
- Downs, D. S., & Hausenblas, H. A. (2005). Elicitation studies and the theory of planned behavior: A systematic review of exercise beliefs. Psychology of Sport and Exercise, 6(1), 1–31. https://doi.org/10.1016/j.psychsport.2003.08.001
- Edwardson, C. L., & Gorely, T. (2010). Parental influences on different types and intensities of physical activity in youth: A systematic review. Psychology of Sport and Exercise, 11(6), 522–535. https://doi.org/10.1016/j.psychsport.2010.05.001
- Epskamp, S. (2019). semPlot: Path diagrams and visual analysis of various SEM packages’ output. https://CRAN.R-project.org/package=semPlot
- Epstein, L. H., Saelens, B. E., & O’Brien, J. G. (1995). Effects of reinforcing increases in active behavior versus decreases in sedentary behavior for obese children. International Journal of behavioral medicine, 2(1), 41–50. https://doi.org/10.1207/s15327558ijbm0201_4
- Epstein, L. H., Saelens, B. E., Myers, M. D., & Vito, D. (1997). Effects of decreasing sedentary behaviors on activity choice in obese children. Health Psychology : official Journal of the Division of Health Psychology, American Psychological Association, 16(2), 107–113.
- Finney, S. J., & DiStefano, C. (2006). Non-normal and categorical data in structural equation modeling. Structural Equation Modeling: A Second Course, 10(6), 269–314.
- Fishbein, M., & Ajzen, I. (2010). Predicting and changing behavior: The reasoned action approach. Taylor & Francis. https://doi.org/10.4324/9780203937082
- Francis, J., Eccles, M. P., Johnston, M., Walker, A., Grimshaw, J. M., Foy, R., Kaner, E. F., Smith, L., & Bonetti, D. (2004). Constructing questionnaires based on the theory of planned behaviour: A manual for health services researchers. Centre for Health Services Research, University of Newcastle upon Tyne.
- Gardner, B. (2015). A review and analysis of the use of ‘habit’ in understanding, predicting and influencing health-related behaviour. Health Psychology Review, 9(3), 277–295. https://doi.org/10.1080/17437199.2013.876238
- Gardner, B., & Abraham, C. (2010). Going green? Modeling the impact of environmental concerns and perceptions of transportation alternatives on decisions to drive. Journal of Applied Social Psychology, 40(4), 831–849. https://doi.org/10.1111/j.1559-1816.2010.00600.x
- Gardner, B., Abraham, C., Lally, P., & de Bruijn, G. J. (2012). Towards parsimony in habit measurement: Testing the convergent and predictive validity of an automaticity subscale of the Self-Report Habit Index. International Journal of Behavioral Nutrition and Physical Activity, 9(1), 102. https://doi.org/10.1186/1479-5868-9-102
- Gardner, B., de Bruijn, G.-J., & Lally, P. (2011). A systematic review and meta-analysis of applications of the self-report habit index to nutrition and physical activity behaviours. Annals of behavioral medicine: A Publication of the Society of Behavioral Medicine, 42(2), 174–187. https://doi.org/10.1007/s12160-011-9282-0
- Gardner, B., Lally, P., & Rebar, A. L. (2020). Does habit weaken the relationship between intention and behaviour? Revisiting the habit-intention interaction hypothesis. Social and Personality Psychology Compass, 14(8), e12553. https://doi.org/10.1111/spc3.12553
- Guthold, R., Stevens, G. A., Riley, L. M., & Bull, F. C. (2020). Global trends in insufficient physical activity among adolescents: A pooled analysis of 298 population-based surveys with 1·6 million participants. The Lancet Child & Adolescent Health, 4(1), 23–35. https://doi.org/10.1016/S2352-4642(19)30323-2
- Hagger, M. S., Polet, J., & Lintunen, T. (2018). The reasoned action approach applied to health behavior: Role of past behavior and tests of some key moderators using meta-analytic structural equation modeling. Social Science & Medicine (1982), 213, 85–94. https://doi.org/10.1016/j.socscimed.2018.07.038
- Hallal, P. C., Andersen, L. B., Bull, F. C., Guthold, R., Haskell, W., & Ekelund, U. (2012). Global physical activity levels: Surveillance progress, pitfalls, and prospects. The Lancet, 380(9838), 247–257. https://doi.org/10.1016/S0140-6736(12)60646-1
- Hart, T. L., Ainsworth, B. E., & Tudor-Locke, C. (2011). Objective and subjective measures of sedentary behavior and physical activity. Medicine and Science in Sports and Exercise, 43(3), 449–456. https://doi.org/10.1249/MSS.0b013e3181ef5a93
- Hlavac, M. (2018). stargazer: Well-formatted regression and summary statistics tables. Central European Labour Studies Institute (CELSI). https://CRAN.R-project.org/package=stargazer
- Hu, L., & Bentler, P. M. (1999). Cutoff criteria for fit indexes in covariance structure analysis: Conventional criteria versus new alternatives. Structural Equation Modeling: A Multidisciplinary Journal, 6(1), 1–55. https://doi.org/10.1080/10705519909540118
- Iannotti, R. J., & Wang, J. (2013). Patterns of physical activity, sedentary behavior, and diet in U.S. adolescents. The Journal of adolescent health: Official Publication of the Society for Adolescent Medicine, 53(2), 280–286. https://doi.org/10.1016/j.jadohealth.2013.03.007
- Iannotti, R. J., Kogan, M. D., Janssen, I., & Boyce, W. F. (2009). Patterns of adolescent physical activity, screen-based media use, and positive and negative health indicators in the U.S. and Canada. The Journal of adolescent health: Official Publication of the Society for Adolescent Medicine, 44(5), 493–499. https://doi.org/10.1016/j.jadohealth.2008.10.142
- Janssen, I., & LeBlanc, A. G. (2010). Systematic review of the health benefits of physical activity and fitness in school-aged children and youth. International Journal of Behavioral Nutrition and Physical Activity, 7(1), 40. https://doi.org/10.1186/1479-5868-7-40
- Johnson, P., & Kite, B. (2020). semTable: Structural equation modeling tables. https://CRAN.R-project.org/package=semTable
- Kämppi, K., Aira, A., Halme, N., Husu, P., Inkinen, V., Joensuu, L., Kokko, S., Laine, K., Mononen, K., Palomäki, S., Ståhl, T., Sääkslahti, A., & Tammelin, T. (2018). Results from Finland’s 2018 report card on physical activity for children and youth. Journal of physical activity & health, 15(s2), S355–S356. https://doi.org/10.1123/jpah.2018-0510
- Keadle, S. K., Conroy, D. E., Buman, M. P., Dunstan, D. W., & Matthews, C. E. (2017). Targeting reductions in sitting time to increase physical activity and improve health. Medicine and Science in Sports and Exercise, 49(8), 1572–1582. https://doi.org/10.1249/MSS.0000000000001257
- Koezuka, N., Koo, M., Allison, K. R., Adlaf, E. M., Dwyer, J. J. M., Faulkner, G., & Goodman, J. (2006). The relationship between sedentary activities and physical inactivity among adolescents: Results from the Canadian community health survey. The Journal of adolescent health: Official Publication of the Society for Adolescent Medicine, 39(4), 515–522. https://doi.org/10.1016/j.jadohealth.2006.02.005
- LeBlanc, A. G., Gunnell, K. E., Prince, S. A., Saunders, T. J., Barnes, J. D., & Chaput, J.-P. (2017). The ubiquity of the screen: An overview of the risks and benefits of screen time in our modern world. Translational Journal of the American College of Sports Medicine, 2(17), 104–113. https://doi.org/10.1249/TJX.0000000000000039
- LeBlanc, A. G., Katzmarzyk, P. T., Barreira, T. V., Broyles, S. T., Chaput, J.-P., Church, T. S., Fogelholm, M., Harrington, D. M., Hu, G., Kuriyan, R., Kurpad, A., Lambert, E. V., Maher, C., Maia, J., Matsudo, V., Olds, T., Onywera, V., Sarmiento, O. L., Standage, M., … Tremblay, M. S. (2015). Correlates of total sedentary time and screen time in 9–11 year-old children around the world: The international study of childhood obesity, lifestyle and the environment. PLoS One, 10(6), e0129622. https://doi.org/10.1371/journal.pone.0129622
- Lee, I.-M., Shiroma, E. J., Lobelo, F., Puska, P., Blair, S. N., & Katzmarzyk, P. T. (2012). Effect of physical inactivity on major non-communicable diseases worldwide: An analysis of burden of disease and life expectancy. The Lancet, 380(9838), 219–229. https://doi.org/10.1016/S0140-6736(12)61031-9
- Leech, R. M., McNaughton, S. A., & Timperio, A. (2014). The clustering of diet, physical activity and sedentary behavior in children and adolescents: A review. International Journal of Behavioral Nutrition and Physical Activity, 11(1), 4. https://doi.org/10.1186/1479-5868-11-4
- Lissa, C. J. V. (2020). TidySEM: Tidy structural equation modeling. https://CRAN.R-project.org/package=tidySEM
- Liu, M., Wu, L., & Yao, S. (2016). Dose–response association of screen time-based sedentary behaviour in children and adolescents and depression: A meta-analysis of observational studies. British Journal of Sports Medicine, 50(20), 1252–1258. https://doi.org/10.1136/bjsports-2015-095084
- Lubans, D. R., Foster, C., & Biddle, S. J. H. (2008). A review of mediators of behavior in interventions to promote physical activity among children and adolescents. Preventive Medicine, 47(5), 463–470. https://doi.org/10.1016/j.ypmed.2008.07.011
- Maisano, M. S., Shonkoff, E. T., & Folta, S. C. (2020). Multiple health behavior change for weight loss: A scoping review. American Journal of Health Behavior, 44(5), 559–571. https://doi.org/10.5993/AJHB.44.5.2
- McEachan, R. R. C., Conner, M., Taylor, N. J., & Lawton, R. J. (2011). Prospective prediction of health-related behaviours with the theory of planned behaviour: A meta-analysis. Health Psychology Review, 5(2), 97–144. https://doi.org/10.1080/17437199.2010.521684
- McEachan, R. R. C., Taylor, N., Harrison, R., Lawton, R., Gardner, P., & Conner, M. (2016). Meta-analysis of the Reasoned Action Approach (RAA) to understanding health behaviors. Annals of behavioral medicine: A Publication of the Society of Behavioral Medicine, 50(4), 592–612. https://doi.org/10.1007/s12160-016-9798-4
- Mekary, R. A., Lucas, M., Pan, A., Okereke, O. I., Willett, W. C., Hu, F. B., & Ding, E. L. (2013). Isotemporal substitution analysis for physical activity, television watching, and risk of depression. American Journal of Epidemiology, 178(3), 474–483. https://doi.org/10.1093/aje/kws590
- Mekary, R. A., Willett, W. C., Hu, F. B., & Ding, E. L. (2009). Isotemporal substitution paradigm for physical activity epidemiology and weight change. American Journal of Epidemiology, 170(4), 519–527. https://doi.org/10.1093/aje/kwp163
- Ngantcha, M., Janssen, E., Godeau, E., Ehlinger, V., Le-Nezet, O., Beck, F., & Spilka, S. (2018). Revisiting factors associated with screen time media use: A structural study among school-aged adolescents. Journal of Physical Activity & Health, 15(6), 448–456. https://doi.org/10.1123/jpah.2017-0272
- Official Statistics of Finland. (2020). Use of information communications technology by individuals. http://www.stat.fi/meta/til/sutivi_en.html
- Olds, T. S., Maher, C. A., Ridley, K., & Kittel, D. M. (2010). Descriptive epidemiology of screen and non-screen sedentary time in adolescents: A cross sectional study. International Journal of Behavioral Nutrition and Physical Activity, 7(1), 92. https://doi.org/10.1186/1479-5868-7-92
- Pate, R. R., O’Neill, J. R., & Lobelo, F. (2008). The evolving definition of “sedentary”. Exercise and Sport Sciences Reviews, 36(4), 173–178. https://doi.org/10.1097/JES.0b013e3181877d1a
- Pearson, N., Haycraft, E., P. Johnston, J., & Atkin, A. J. (2017). Sedentary behaviour across the primary-secondary school transition: A systematic review. Preventive Medicine, 94, 40–47. https://doi.org/10.1016/j.ypmed.2016.11.010
- Prochaska, J. J., Spring, B., & Nigg, C. R. (2008). Multiple health behavior change research: An introduction and overview. Preventive Medicine, 46(3), 181–188. https://doi.org/10.1016/j.ypmed.2008.02.001
- Quartiroli, A., & Maeda, H. (2014). Self-determined engagement in physical activity and sedentary behaviors of US college students. International Journal of Exercise Science, 7(1), 87.
- R Core Team. (2017). R: A language and environment for statistical computing. R Foundation for Statistical Computing. https://www.r-project.org/
- R Core Team. (2018). foreign: Read data stored by “Minitab”, “S”, “SAS”, “SPSS”, “Stata”, “Systat”, “Weka”, “dBase”, … https://CRAN.R-project.org/package=foreign
- Roderick, J., Little, A., & Rubin, D. B. (2002). Statistical analysis with missing data. Wiley.
- Rollo, S., Gaston, A., & Prapavessis, H. (2016). Cognitive and motivational factors associated with sedentary behavior: A systematic review. AIMS Public Health, 3(4), 956–984. https://doi.org/10.3934/publichealth.2016.4.956
- Rosseel, Y. (2012). lavaan: An R package for structural equation modeling. Journal of Statistical Software, 48(2), 1–36. http://www.jstatsoft.org/v48/i02/ https://doi.org/10.18637/jss.v048.i02
- Sheeran, P., Bosch, J. A., Crombez, G., Hall, P. A., Harris, J. L., Papies, E. K., & Wiers, R. W. (2016). Implicit processes in health psychology: Diversity and promise. Health Psychology: Official Journal of the Division of Health Psychology, American Psychological Association, 35(8), 761–766. https://doi.org/10.1037/hea0000409
- Sheppard, B. H., Hartwick, J., & Warshaw, P. R. (1988). The theory of reasoned action: A meta-analysis of past research with recommendations for modifications and future research. Journal of Consumer Research, 15(3), 325–343. http://www.jstor.org/stable/2489467 https://doi.org/10.1086/209170
- Skender, S., Ose, J., Chang-Claude, J., Paskow, M., Brühmann, B., Siegel, E. M., Steindorf, K., & Ulrich, C. M. (2016). Accelerometry and physical activity questionnaires – A systematic review. BMC Public Health, 16(1), 515. https://doi.org/10.1186/s12889-016-3172-0
- Sniehotta, F. F., Presseau, J., & Araújo-Soares, V. (2014). Time to retire the theory of planned behaviour. Health Psychology Review, 8(1), 1–7. https://doi.org/10.1080/17437199.2013.869710
- Stanley, D. (2018). apaTables: Create American Psychological Association (APA) style tables. https://CRAN.R-project.org/package=apaTables
- Strasburger, V., & Hogan, M. (2010). Policy statement: Children, adolescents and the media. Pediatrics, 126(4), 791–799.
- Sugiyama, T., Healy, G. N., Dunstan, D. W., Salmon, J., & Owen, N. (2008). Joint associations of multiple leisure-time sedentary behaviours and physical activity with obesity in Australian adults. International Journal of Behavioral Nutrition and Physical Activity, 5(1), 35. https://doi.org/10.1186/1479-5868-5-35
- Sutton, S., French, D. P., Hennings, S. J., Mitchell, J., Wareham, N. J., Griffin, S., Hardeman, W., & Kinmonth, A. L. (2003). Eliciting salient beliefs in research on the theory of planned behaviour: The effect of question wording. Current Psychology, 22(3), 234–251. https://doi.org/10.1007/s12144-003-1019-1
- Taveras, E. M., Field, A. E., Berkey, C. S., Rifas-Shiman, S. L., Frazier, A. L., Colditz, G. A., & Gillman, M. W. (2007). Longitudinal relationship between television viewing and leisure-time physical activity during adolescence. Pediatrics, 119(2), e314–e319.https://doi.org/10.1542/peds.2005-2974
- Thorp, A. A., Owen, N., Neuhaus, M., & Dunstan, D. W. (2011). Sedentary behaviors and subsequent health outcomes in adults a systematic review of longitudinal studies, 1996–2011. American Journal of Preventive Medicine, 41(2), 207–215. https://doi.org/10.1016/j.amepre.2011.05.004
- Tremblay, M. S., Aubert, S., Barnes, J. D., Saunders, T. J., Carson, V., Latimer-Cheung, A. E., Chastin, S. F. M., Altenburg, T. M., Chinapaw, M. J. M., Altenburg, T. M., Aminian, S., Arundell, L., Atkin, A. J., Aubert, S., Barnes, J., Barone Gibbs, B., Bassett-Gunter, R., Belanger, K., Biddle, S., … on behalf of SBRN Terminology Consensus Project Participants. (2017). Sedentary Behavior Research Network (SBRN) - Terminology consensus project process and outcome. The International Journal of Behavioral Nutrition and Physical Activity, 14(1), 75. https://doi.org/10.1186/s12966-017-0525-8
- Tremblay, M. S., Barnes, J. D., González, S. A., Katzmarzyk, P. T., Onywera, V. O., Reilly, J. J., Tomkinson, G. R., & Global Matrix 2.0 Research Team. (2016). Global Matrix 2.0: Report card grades on the physical activity of children and youth comparing 38 countries. Journal of Physical Activity & Health, 13(11 Suppl 2), S343–S366. https://doi.org/10.1123/jpah.2016-0594
- Tremblay, M. S., Carson, V., Chaput, J.-P., Connor Gorber, S., Dinh, T., Duggan, M., Faulkner, G., Gray, C. E., Gruber, R., Janson, K., Janssen, I., Katzmarzyk, P. T., Kho, M. E., Latimer-Cheung, A. E., LeBlanc, C., Okely, A. D., Olds, T., Pate, R. R., Phillips, A., … Zehr, L. (2016). Canadian 24-hour movement guidelines for children and youth: An integration of physical activity, sedentary behaviour, and sleep. Applied Physiology, Nutrition, and Metabolism, 41(6 Suppl 3), S311–S327. https://doi.org/10.1139/apnm-2016-0151
- Van Der Horst, K., Paw, M. J. C. A., Twisk, J. W. R., & Van Mechelen, W. (2007). A brief review on correlates of physical activity and sedentariness in youth. Medicine and Science in Sports and Exercise, 39(8), 1241–1250. https://doi.org/10.1249/mss.0b013e318059bf35
- van Stralen, M. M., Yildirim, M., Velde, S. t., Brug, J., van Mechelen, W., Chinapaw, M. J. M., & ENERGY-Consortium. (2011). What works in school-based energy balance behaviour interventions and what does not? A systematic review of mediating mechanisms. International Journal of Obesity (2005), 35(10), 1251–1265. https://doi.org/10.1038/ijo.2011.68
- Verplanken, B., & Orbell, S. (2003). Reflections on past behavior: A self-report index of habit strength1. Journal of Applied Social Psychology, 33(6), 1313–1330. https://doi.org/10.1111/j.1559-1816.2003.tb01951.x
- Vizcaino, M., Buman, M., DesRoches, C. T., & Wharton, C. (2019). Reliability of a new measure to assess modern screen time in adults. BMC Public Health, 19(1), 1386. https://doi.org/10.1186/s12889-019-7745-6
- Wei, T., & Simko, V. (2017). R package “corrplot”: Visualization of a correlation matrix. https://github.com/taiyun/corrplot
- Wickham, H. (2016). ggplot2: Elegant graphics for data analysis. Springer-Verlag. https://ggplot2.tidyverse.org
- Wickham, H., & Henry, L. (2020). tidyr: Tidy messy data. https://CRAN.R-project.org/package=tidyr
- Wickham, H., François, R., Henry, L., & Müller, K. (2020). dplyr: A grammar of data manipulation. https://CRAN.R-project.org/package=dplyr