
Abstract
The heterogeneity of the T cell receptor (TCR) repertoire critically influences the autoimmune response in obstetric antiphospholipid syndrome (OAPS) and is intimately associated with the prophylaxis of autoimmune disorders. Investigating the TCR diversity patterns in patients with OAPS is thus of paramount clinical importance. This investigation procured peripheral blood specimens from 31 individuals with OAPS, 21 patients diagnosed with systemic lupus erythematosus (SLE), and 22 healthy controls (HC), proceeding with TCR repertoire sequencing. Concurrently, adverse pregnancy outcomes in the OAPS cohort were monitored and documented over an 18-month timeframe. We paid particular attention to disparities in V/J gene utilisation and the prevalence of shared clonotypes amongst OAPS patients and the comparative groups. When juxtaposed with observations from healthy controls and SLE patients, immune repertoire sequencing disclosed irregular T- and B-cell profiles and a contraction of diversity within the OAPS group. Marked variances were found in the genomic rearrangements of the V gene, J gene, and V/J combinations. Utilising a specialised TCRβ repertoire, we crafted a predictive model for OAPS classification with robust discriminative capability (AUC = 0.852). Our research unveils alterations in the TCR repertoire among OAPS patients for the first time, positing potential covert autoimmune underpinnings. These findings nominate the TCR repertoire as a prospective peripheral blood biomarker for the clinical diagnosis of OAPS and may offer valuable insights for advancing the understanding of OAPS immunologic mechanisms and prognostic outcomes.
Introduction
Antiphospholipid syndrome (APS) is an autoimmune condition that affects multiple organ systems [Citation1]. In pregnancy, APS predisposes women to a hypercoagulable state due to hemodynamic shifts, increasing the propensity for placental thrombosis [Citation2–3]. Concurrently, anti-phospholipid antibodies (aPLs) can lead to preeclampsia, foetal growth restriction, intrauterine death, and other detrimental outcomes by impairing trophoblastic function through various mechanisms [Citation4–6]. The occurrence of obstetric comorbidities in APS patients is referred to as obstetric APS (OAPS) [Citation7–8]. The most prevalent complication in OAPS is recurrent miscarriage and preterm birth, resulting from placental insufficiency or severe preeclampsia, posing a threat to female reproductive health [Citation9]. However, the accurate identification of APS patients remains a clinical challenge owing to the heterogeneity of clinical symptoms [Citation10], the non-specific nature of aPLs, and the necessity for time-sensitive titration [Citation11]. The pivotal role of β2GPI-autoreactive CD4+ T cells in the development of APS, as established in human and experimental mouse models [Citation12], and the subsequent disruption of Th1/Th2 cytokine balance [Citation13,Citation14], underscores the substantial co ntribution of autoreactive T cells to the disease pathogenesis. Such autoreactive T cells, active in peripheral blood (PB) and several organs, have been detected in patients with systemic lupus erythematosus (SLE) and rheumatoid arthritis (RA), where they instigate the release of inflammatory cytokines and bolster B cell responses [Citation15–17].
T cells, as the pillars of adaptive immunity, perform critical functions in infection immunity, autoimmunity, tumour resistance, and immune modulation [Citation18]. The adaptive immune system plays a pivotal role in protection against diverse diseases, encompassing infections and cancer [Citation19–21]. The quest for a straightforward method to evaluate the robustness of adaptive immunity has been persistent. The extensive array of T cell receptors (TCR) underpins adaptive immunity. This TCR diversity offers a window into the immune competency, reflecting the host’s exposure to endogenous and exogenous antigens, the readiness to confront novel challenges, and the specificity, breadth, and memory of the immune response [Citation22,Citation23]. High-throughput TCR sequencing permits the study of an individual’s TCR landscape, providing direct insights into their immune status. In the past decades, alterations in TCR repertoires and specific TCR clones have been linked to various immune-mediated conditions, including RA, ankylosing spondylitis, and ulcerative colitis [Citation18,Citation24,Citation25]. However, an immune group database for OAPS patients is notably absent, leaving the comprehensive immune profile of OAPS uncharted. It remains to be explored whether OAPS is characterised by clonal amplification of select TCR clonotypes.
In this study, we discerned distinctions in the TCRβ repertoire between OAPS patients, SLE patients, and healthy controls, and correlated these findings with common clinical parameters. Most importantly, we tried to establish a combination of indicators that can identify OAPS patients based on the differential TCRβ repertoire, hoping to provide references for the discovery of novel markers in OAPS patients.
Material and methods
Subjects
This study commenced enrolment at Peking University Third Hospital, China, from January 2022 to December 2023, comprising 31 female OAPS patients, 21 female SLE patients, and 22 healthy female controls. All OAPS participants satisfied the revised 2023 ACR/EULAR OAPS diagnostic criteria [Citation26]. Patients initially diagnosed with OAPS per the 2006 Sydney criteria underwent a reassessment to ensure compliance with the updated ACR/EULAR guidelines. Additionally, the SLE patient cohort met the EULAR/ACR 2019 classification criteria for SLE [Citation27]. Healthy controls, sourced from the hospital’s medical examination centre, were women aged 25 to 45, devoid of any autoimmune disorders, malignancies, adverse pregnancy histories, or infectious diseases, and presented with normal laboratory findings, inclusive of routine tests and aPLs. Detailed participant data were meticulously recorded for traceability.
The institutional Ethics Committee approved this research (approval number: IRB00006761-M2021063). All participants’ clinical data were collected, and prospective tracking of adverse obstetric outcomes was implemented. Post-clinical examination, residual whole blood and serum samples were preserved at 4 °C, not exceeding 8 h.
Serum specimen testing
Silica clotting time (SCT) and dilute Russell viper venom time (dRVVT) were measured using the ACLTOP 700 instrument (Werfen), serum levels of aCL IgG/IgM/IgA, aβ2GPI IgG/IgM/IgA and aPS/PT IgG/IgM were tested using CIA (QUANTA Flash assays, Inova Diagnostics). The QUANTA Flash assays were performed on the BIO-FLASH instrument (Biokit). The cut-off values were set based on the recommendations of the manufacturer.
Cell isolation and DNA extraction
Peripheral blood mononuclear cells (PBMC) were isolated from 2 ml of total peripheral venous blood using density gradient centrifugation on FicOL-Paque (GE Healthcare). In short, 2 ml of whole blood diluted with phosphate buffered saline (PBS) was superimposed on Ficoll-Paque. After 500 × g centrifugation for 30 min, the intermediate layer was aspirated, and PBMC were obtained after PBS washing. DNA was extracted from PBMCs by TIANamp blood kit (TIANGEN) and followed the manufacturer’s instructions. The concentration of total DNA was measured by NanoDrop ND-2000 spectrophotometer, and the DNA samples were reserved at −20 °C.
High-throughput sequencing of T-cell receptor β genes
Multiplex PCR amplification of CDR3 of the TCR β chain (TRB) was conducted including PCR1 and PCR2, inclusively and semi-quantitatively in TCR sequencing. To amplify all possible V(D)J combinations, a set of 32 V forward and 13 J reverse primers was used to perform multiplex PCR1 assays as follows: 1 cycle at 95° C for 15 min, 10 cycles of denaturation at 94° C for 30 s, and 10 cycles of annealing at 60° C for 90 s and extension at 72° C for 30 s. In the second round, PCR2 was performed using universal primers. Sequencing libraries were loaded onto the Illumina XTen System, and reads of 100-bp fragments were obtained.
TCR sequencing was defined as the amino acids between the second cysteine of the V region and the conserved phenylalanine of the J region, according to the ImMunoGeneTics (IMGT) V, D, and J gene references. The CDR3 sequences were identified and assigned using the MiXCR software package. Reads containing adapter sequences were removed; reads containing more than 5% base content were removed (N meant that base information could not be determined). The number of low-quality bases (Q15) accounted for more than 40% of the entire read length of single-ended reads.
TCRβ repertoire analysis
The immune repertoire was assessed using Immunarch v0.9.0 (https://cloud.r-project.org/package=immunarch). For each sample, the number of unique clonotypes was determined based on the specific CDR3 amino acid sequence, V and J genes (D gene included for TCRβ), excluding ambiguous gene assignments. TCR diversity was estimated by Shannon’s index and Simpson index. The relative abundance of clonotypes was assessed at 10-fold intervals. Mean CDR3 sequence length was calculated and compared. The overlap in clonotypes among individuals was determined by generating a string consisting of the CDR3 amino acid sequence, V/J gene (D gene included for TCRβ).
Statistics
SPSS Statistics 21.0 and R Studio 4.2.0 were used for statistical analysis of the data. For data conforming to normal distribution, continuous variables were described as mean ± standard deviation (X ± S), T-test was used for comparison between two groups, ANOVA was used for comparison between three groups, LSD test was used for comparison between groups, and Chi-square test was used for categorical variables. Skew distribution data, continuous variables are represented by median (minimum, maximum) (M[Q1, Q3]), and categorical variables are described by number of cases (n) and percentage (%). Mann-Whitney U test was used for continuous variables, Kruskal-Wallis test was used for inter-group comparison, and Wilcoxon rank sum test was used for categorical variables. logistic regression was used to make ROC, and p < 0.05 indicated that the difference was statistically significant.
Results
Patient characteristics/comparisons
A total of 31 OAPS female patients, 21 female SLE patients and 22 healthy women were included in this study. The median age of patients with OAPS was 36 years. The demographic characteristics of the cohort are shown in . Compared with the healthy control group, OAPS patients had higher Hb and longer APTT, and different aPLs distributions, including aCL-IgG, aβ2GPI-IgG, LA, aβ2GPI-IgA and aPS/PT-IgM. In addition, compared with SLE patients, there were no differences in routine tests in OAPS patients, but there were also some differences in aPS/PT-IgM antibodies. It can be observed that OAPS patients are mainly single antibody positive, and double or triple positive is more rare ().
Table 1. Demographic and clinical characteristics of the study groups.
Table 2. The distribution of aPLs tests in the study groups.
Decreased diversity of TCR β repertoires in patients with OAPS
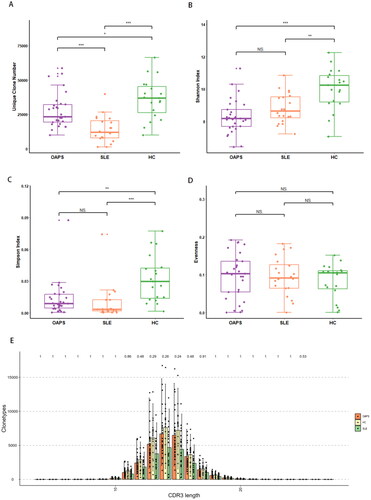
Following the high-throughput TCRβ repertoire sequencing, we obtained an average of 48.88 Mb reads per sample. Some sample quality control data were insufficient to meet the requirements of data analysis (Table S1), such as too few reads detected by sequencing and substandard proportion of cloned reads. ClonalRatio refers to the ratio of clone reads to clean reads, and CleanReads is the number of clean reads after filtering. According to the overall situation of the samples, samples with ClonalRatio(%) < 80% or CleanReads < 10 M were excluded in order to ensure the accuracy of statistical analysis, that is, 6 samples (01_OAPS, 10_OAPS, 52_SLE, 62_HC, 70_HC and 71_HC) were excluded. Then the immune group database data were analysed. In order to ensure the accuracy of statistical analysis, the ClonalRatio (%) < 80% or CleanReads < 10 M of samples were excluded, that is, 6 samples (01_OAPS, 10_OAPS, 52_SLE, 62_HC, 70_HC and 71_HC) were excluded, and then the data of immune group database was analysed. However, due to sample heterogeneity and the presence of numerous low-abundance clones, capturing the full range of clonotypes in a single sample was challenging. Even when sequencing the maximum number of samples, most samples approached saturation (Figure S1A). It can be seen that compared with healthy controls, the number of unique clonotypes decreased in OAPS patients and SLE patients, and there was a significant difference in Shannon index and Simpson index, but there was no difference in evenness among the three groups (), suggesting that the TCRβ repertoire diversity in the OAPS group showed an overall decline. In healthy people, the length of the CDR3 amino acid is normally distributed, but in patients with disease, some of these specific CDR3 amino acid sequences are highly expressed, resulting in significant differences in the length of the CDR3 amino acid. But after the statistical test, no statistical difference was found in CDR3 length among the three group (). We further performed principal component analysis and observed that the samples of OAPS patients were significantly clustered in specific areas of the picture, with differences from the sample plots of healthy donors (Figure S1B). These findings confirmed that impaired TCR diversity and clonality in patients with OAPS. The proportion of clonotypes with specific frequencies measuring the relative abundance ranges in OAPS patients, SLE patients and controls (Figure S1C–E). Small clonotype groups occupied a large proportion of the healthy repertoire. In contrast, the TCR repertoires of OAPS patients primarily consisted of medium and large clonotype groups. These findings support that OAPS patients display expanded repertoire clonality and narrowing diversity compared to the healthy controls.
Figure 1. TVRβ repertoire diversity and clonal expansion in OAPS patients.
(A) Unique clone number. (B) Shannon’s diversity index. (C) Simpson index. (D) Evenness. (E) CDR3 length and quantity distribution among groups. ***P ≤ 0.001, **P ≤ 0.01, *P ≤ 0.05 and ns P > 0.05.
Abnormal gene usage and CDR3 length in OAPS
To evaluate the differences in V-and J-gene usage, we counted the usage of all the V genes (Table S2) and J genes (Table S3) then performed a cluster analysis of V/J gene use in the three groups of samples (Figure S2). We then examined the distribution of TRBV and TRBJ segments of OAPS patients, which are presented in . The frequency of V- and J- gene usage that changed significantly among the three groups was summarised in Table S4. Compared with the HCs, OAPS group shows increased usage of TRBV11-1, TRBV11-2, TRBV12-3, TRBV12-4, TRBV14, TRBV20-1, TRBV28, TRBV6-1, TRBV6-2, TRBV6-3, TRBV6-5, TRBV6-6, TRBV7-3, TRBV7-9, TRBV9 and decreased usage of TRBV5-6, TRBV6-7, TRBV6-8, TRBV7-7 and TRBJ2-7. Compared with SLE group, OAPS group shows increased usage of TRBV12-5, TRBV27, TRBV6-5, TRBV6-6, TRBV9, TRBJ2-5, TRBJ2-6 and decreased usage of TRBV6-8 and TRBJ2-7.
Figure 2. Gene usage analysis of the TCRβ repertoires. Frequency of V gene (A) and J gene (B) usage in three groups. (C)The CDR3 amino acid sequence was different between OAPS patients and healthy controls. (D)Corresponding V/J gene combination of different CDR3 amino acid sequences between the two groups.
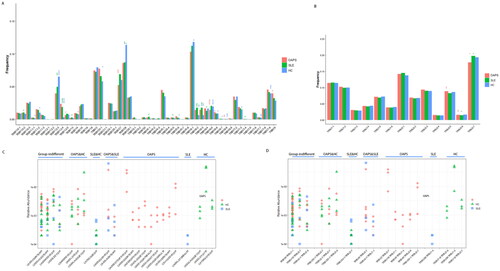
We next wondered whether a specific TCR repertoire exists among OAPS patients with a shared trigger. We examined differences in TCR repertoires among three groups. To assess specificity among TCRs, We identified clonotypes present in at least three samples with the same V-J-CDR3 combination (at least 0.001% of the total), and the same clone in the same group was present in at least two samples. We found multiple V-J-CDR3 combinations that were unique to OAPS disease in TCRβ (). The three CDR3 amino acid sequences CASSVGGNTEAFF, CASSVGGGTEAFF, CASSVGSNTEAFF shared by the three groups represented the TRBV9/TRBJ1-1 gene combination, the two CDR3 amino acid sequences CASSIRSSYEQYF, CASSISGPSYEQYF represented the TRBV9/TRBJ2-7 gene combination, the two CDR3 amino acid sequences CASSLEETQYF, CASSLGGGETQYF represented the TRBV5-1/TRBJ2-5 gene combination. And between the OAPS group and SLE group, the two CDR3 amino acid sequences CASSGQGAYEQYF, CASSVGGGTYEQYF represented the TRBV9/TRBJ2-7 gene combination.
Association between TCRβ repertoire and level of clinical markers and incidence of adverse pregnancy events in OAPS patients
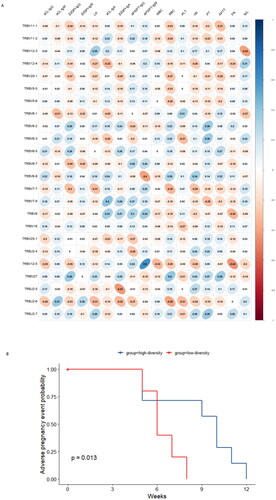
We analysed the relationship between the V/J differential gene of the overall TCR CDR3 immune repertoire and clinical features in OAPS patients (). According to the statistical test results, TRBV7-9 and aCL-IgA (p = 0.031, r = 0.402), TRBV12-5 and aPS/PT-IgM (p < 0.001, r = 0.602), TRBV6-8 and aPS/PT-IgM (p = 0.031, r = 0.401), TRBV12-5 and Fib (p = 0.017, r = 0.440), TRBV12-3 and N/L (p = 0.023, r = 0.419), TRBJ2-5 and β2GPI-IgA (p = 0.019, r = 0.434), TRBJ2-6 were significantly correlated with RBC (p = 0.035, r = 0.392). In order to explore whether changes in the immune repertoire can cause clinical adverse pregnancy events, we plotted the cumulative probability curve of adverse pregnancy events (). The median Shannon diversity of all OAPS patients was 0.0088. Those with TCRβ repertoire diversity greater than this median were divided into a high diversity group, and those with TCRβ repertoire diversity less than or equal to this median were divided into a low diversity group. A significant difference was found in the number of weeks of adverse pregnancy events between the two groups (p = 0.013).
Figure 3. Association between TCRβ repertoire and clinical markers in patients with OAPS. (A)The correlation between V/J genes and clinical indices. (B)Cumulative probability curve of adverse pregnancy events grouped by high or low diversity.
OAPS patients were classified using specific TCRβ repertoire
Based on the observation of differences in the use of V/J genes, we evaluated their effectiveness in identifying patients with OAPS (Figure S3, S4).
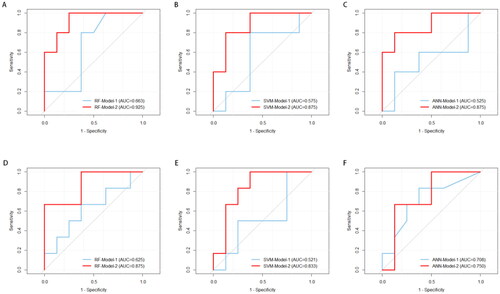
Figure 4. Receiver operating characteristic (ROC) analysis for OAPS classification by three laboratory indicators model (Model-1) and specific TCRβ repertoire model (Model-2). (A-C) Discriminate OAPS from health controls; (D-F) Discriminate OAPS from SLE patients.
We split the data into training sets and validation sets in a 7:3 ratio. To further develop a classification model for OAPS patients using unique TCRβ repertoire, multivariate-logistic regression analyses were performed for all markers (). We could see that after multivariate logistic regression analysis, the expressions of TRBV12-3, TRBV6-3 and TRBV6-5 were still significant (p < 0.05), which could be used as characteristic variables for the establishment of OAPS disease model.
Table 3. Logistic regression analysis of variables in predicting the OAPS.
We used three common algorithms (support vector machine, random forest and artificial neural network) to build an OAPS classification model based on OAPS patient-specific TCRβ repertoire, and compared the validation efficiency of the three models. In order to show the effectiveness of the model more intuitively, we first established a model based on the three laboratory indicators involved in the OAPS diagnostic criteria (Model-1), and compared it with the model based on the specific TCRβ repertoire (Model-2).
In general, compared with the the three laboratory indicators model (Model-1), the OAPS-specific TCRβ repertoire model (Model-2) performed well in the recognition and classification of OAPS patients (). Between the OAPS and HC groups, the random forest model (RF-Model-2) increased the AUC to 0.925. In OAPS group and SLE group, the same random forest model had the highest classification performance (AUC = 0.875).
For one-step identification of patients with OAPS, we reconstructed the OAPS disease model by combining SLE patients and healthy controls into a full control group (All-Controls). Similarly, we used three algorithms to build a TCRβ repertoire model (Model-2′) to classify OAPS patients and compared it with three laboratory indicators model (Model-1′) (). At this time, it was found that the OAPS diagnostic classification model established by artificial neural network method had the best performance (ANN-Model-2′), AUC = 0.852 (95%CI:0.654 ∼ 1.000), sensitivity 100.0%, specificity 62.5%.
Table 4. Validation and comparison of OAPS binary prediction models.
Discussion
In an initial exploration using high-throughput sequencing, our research has unveiled a narrowed diversity accompanied by elevated clonality within TCR repertoire in patients with OAPS. Notably, a general diminution in TCR repertoire heterogeneity has been observed among these patients. The TCR signatures we have identified, associated with OAPS, may significantly enhance the accuracy of discriminating OAPS patients from others and healthy counterparts.
The clinical epidemiology of OAPS is marked by a high prevalence and an intricate pathogenesis, involving mechanisms such as aPL-induced cell activation, modulation of coagulant and fibrinolytic systems, inflammation, complement system engagement, and oxidative stress [Citation28–30].
We embarked on an assessment of the TCR repertoire’s diversity by computing the α-diversity index, which includes metrics such as unique clonotypes, the Shannon and Simpson indexs. A salient observation from our study marked by a constriction in clone variety and TCR heterogeneity. This diminished diversity suggests a narrowing of the T cell response in OAPS patients, potentially due to targeted antigen specificity. Similarly, low TCR repertoire diversity has been documented in a variety of autoimmune conditions, including SLE, alopecia areata, and Stevens-Johnson syndrome [Citation31–33], which are attributable to the expansion of TCR clones activated by particular antigens.
Understanding chronic autoimmune responses through the identification of TCR sequences could contribute to our comprehension of the autoimmune aetiology of OAPS and pinpoint potential peptides driving the disease [Citation34]. We also investigated the presence of public TCR clones among OAPS patients. Contrary to our anticipation of prevalent shared clonotypes, our findings suggest that most TCR clones are private, reflecting a considerable heterogeneity in the TCR landscape of OAPS patients. This diversity could mirror disease severity and may thus serve as a valuable tool. Moreover, we identified public amino acid sequences in the CDR3 region of the TCRβ chain, representing TRBV9/TRBJ1-1, TRBV19/TRBJ2-7, and TRBV5-1/TRBJ2-5 gene combinations, respectively.
Specificity within the TCR is garnering attention as a prognostic biomarker for cancer, infectious diseases, and immune disorders [Citation35,Citation36]. Disease-associated T cell responses in OAPS patients may be represented by unique clonotypes and V-J pairings. Moreover, we have probed the distribution of V and J gene segments and their pairings in OAPS patients, identifying differential expression in 26 TRBV and 3 TRBJ genes, implicating their involvement in immune responsiveness to the condition. Correlations were also noted between different V/J genes and clinical indices, suggesting mutual influences.
Due to the significant correlations among various indicators, we used logistic analyses for feature selection and ultimately constructed an OAPS classification model incorporating TRBV12-3, TRBV6-3, and TRBV6-5. Employing support vector machine, random forest, and artificial neural network models, we ascertained that the model based on the TCRβ repertoire yielded impressive classification accuracy. Specifically, when comparing OAPS patients to healthy and disease controls, the artificial neural network model demonstrated superior discrimination (AUC = 0.852, p < 0.01). These findings underscore the potential of TCR profile analysis via high-throughput sequencing as a diagnostic methodology, accentuating the specificity of TCR profiles in OAPS patients—a technique that has seen application in other autoimmune diseases as well [Citation37,Citation38].
Furthermore, our prospective documentation of adverse pregnancy events in OAPS patients revealed a correlation with TCRβ repertoire diversity; lower diversity was associated with premature onset of adverse events during gestation. This observation implies that reduced overall diversity in the TCRβ repertoire may precipitate such events. Admittedly, this study is not without limitations. The distribution of obstetric complications among OAPS patients is heterogeneous, with the possibility that the pathophysiological trajectories for early and late-stage complications differ. However, due to limited cases of late obstetric complications, results may contain an element of bias.
In conclusion, with high-throughput sequencing technology, this study advances our understanding of the TCRβ repertoire’s detailed characteristics in OAPS diseases. Our work underscores the significant yet complex role of T cell immunity in OAPS. With T cells playing an integral part in OAPS pathogenesis, our findings elucidate distinct TCRβ chain repertoire profiles and specific TCR clonotypes that facilitate OAPS classification through V/J gene combinations. More samples and further studies are needed in the future to confirm our results, which will help explore new immune biomarkers and potential therapeutic targets.
Disclosure statement
No potential conflict of interest was reported by the authors.
Data availability statement
The data that support the findings of this study are available on request from the corresponding author, LY Cui, upon reasonable request.
Additional information
Funding
References
- Ünlü O, Zuily S, Erkan D. The clinical significance of antiphospholipid antibodies in systemic lupus erythematosus. Eur J Rheumatol. 2016;3(2):75–84.
- Schreiber K, Hunt BJ. Managing antiphospholipid syndrome in pregnancy. Thromb Res. 2019;181 Suppl 1(Suppl 1):S41–S46.
- Garcia D, Erkan D. Diagnosis and management of the antiphospholipid syndrome. N Engl J Med. 2018;378(21):2010–2021.
- Di Simone N, Di Nicuolo F, D'Ippolito S, et al. Antiphospholipid antibodies affect human endometrial angiogenesis. Biol Reprod. 2010;83(2):212–219. Epub 2010 Apr 14. PMID: 20393166.
- D'Ippolito S, Di Simone N, Di Nicuolo F, et al. Antiphospholipid antibodies: effects on trophoblast and endothelial cells. Am J Reprod Immunol. 2007;58(2):150–158. PMID: 17631008.
- Di Simone N, D'Ippolito S, Marana R, et al. Antiphospholipid antibodies affect human endometrial angiogenesis: protective effect of a synthetic peptide (TIFI) mimicking the phospholipid binding site of β(2) glycoprotein I. Am J Reprod Immunol. 2013; Oct70(4):299–308. Epub 2013 May 7. PMID: 23650919.
- D'Ippolito S, Meroni PL, Koike T, et al. Obstetric antiphospholipid syndrome: a recent classification for an old defined disorder. Autoimmun Rev. 2014;13(9):901–908. Epub 2014 May 10. PMID: 24820522.
- Meroni PL, Borghi MO, Grossi C, et al. Obstetric and vascular antiphospholipid syndrome: same antibodies but different diseases? Nat Rev Rheumatol. 2018; Jul14(7):433–440. PMID: 29891914.
- D'Ippolito S, Barbaro G, Paciullo C, et al. Antiphospholipid syndrome in pregnancy: new and old pathogenetic mechanisms. Int J Mol Sci. 2023;24(4):3195. PMID: 36834614; PMCID: PMC9966557.
- Knight JS, Branch DW, Ortel TL. Antiphospholipid syndrome: advances in diagnosis, pathogenesis, and management. BMJ. 2023;380:e069717.
- Miyakis S, Lockshin MD, Atsumi T, et al. International consensus statement on an update of the classification criteria for definite antiphospholipid syndrome (APS). J Thromb Haemost. 2006;4(2):295–306.
- Hattori N, Kuwana M, Kaburaki J, et al. T cells that are autoreactive to beta2-glycoprotein I in patients with antiphospholipid syndrome and healthy individuals. Arthritis Rheum. 2000;43(1):65–75.
- Krause I, Blank M, Levi Y, et al. Anti-idiotype immunomodulation of experimental anti-phospholipid syndrome via effect on Th1/Th2 expression. Clin Exp Immunol. 1999;117(1):190–197.
- Yan H, Li B, Su R, et al. Preliminary study on the imbalance between Th17 and regulatory T cells in antiphospholipid syndrome. Front Immunol. 2022;13:873644.
- Long Y, Li W, Feng J, et al. Follicular helper and follicular regulatory T cell subset imbalance is associated with higher activated B cells and abnormal autoantibody production in primary anti-phospholipid syndrome patients. Clin Exp Immunol. 2021;206(2):141–152.
- Zhang Y, Lin M, Hao X, et al. Imbalance of circulating CTLA4+ follicular helper and follicular regulatory T cells in obstetric antiphospholipid syndrome. Clin Exp Med. 2022;22(1):27–36.
- Glanville J, Huang H, Nau A, et al. Identifying specificity groups in the T cell receptor repertoire. Nature. 2017;547(7661):94–98.
- Liu X, Zhang W, Zhao M, et al. T cell receptor β repertoires as novel diagnostic markers for systemic lupus erythematosus and rheumatoid arthritis. Ann Rheum Dis. 2019;78(8):1070–1078.
- Rajewsky K. Immunology. The power of clonal selection. Nature. 1993;363(6426):208–208.
- Hakim FT, Flomerfelt FA, Boyiadzis M, et al. Aging, immunity and cancer. Curr Opin Immunol. 2004;16(2):151–156.
- Bonilla FA, Oettgen HC. Adaptive immunity. J Allergy Clin Immunol. 2010;125(2 Suppl 2):S33–S40.
- Nielsen SCA, Boyd SD. Human adaptive immune receptor repertoire analysis-Past, present, and future. Immunol Rev. 2018;284(1):9–23.
- Woodsworth DJ, Castellarin M, Holt RA. Sequence analysis of T-cell repertoires in health and disease. Genome Med. 2013;5(10):98. Published 2013 Oct 30.
- Wu J, Pendegraft AH, Byrne-Steele M, et al. Expanded TCRβ CDR3 clonotypes distinguish crohn’s disease and ulcerative colitis patients. Mucosal Immunol. 2018;11(5):1487–1495.
- Hanson AL, Nel HJ, Bradbury L, et al. Altered repertoire diversity and disease-associated clonal expansions revealed by T cell receptor immunosequencing in ankylosing spondylitis patients. Arthritis Rheumatol. 2020;72(8):1289–1302.
- Barbhaiya M, Zuily S, Naden R, et al. 2023 ACR/EULAR antiphospholipid syndrome classification criteria. Ann Rheum Dis. 2023;82(10):1258–1270.
- Aringer M, Costenbader K, Daikh D, et al. 2019 European league against rheumatism/American college of rheumatology classification criteria for systemic lupus erythematosus. Ann Rheum Dis. 2019;78(9):1151–1159.
- Ruiz-Irastorza G, Crowther M, Branch W, et al. Antiphospholipid syndrome. Lancet. 2010;376(9751):1498–1509.
- Gandhi AA, Estes SK, Rysenga CE, et al. Understanding the pathophysiology of thrombotic APS through animal models. Int J Mol Sci. 2021;22(5):2588. Published 2021 Mar 4.
- Green D. Pathophysiology of antiphospholipid syndrome. Thromb Haemost. 2022;122(7):1085–1095.
- de Jong A, Jabbari A, Dai Z, et al. High-throughput T cell receptor sequencing identifies clonally expanded CD8+ T cell populations in alopecia areata. JCI Insight. 2018;3(19):e121949. Published 2018 Oct 4.
- Xiong H, Wang L, Jiang M, et al. Comprehensive assessment of T cell receptor β repertoire in Stevens-Johnson syndrome/toxic epidermal necrolysis patients using high-throughput sequencing. Mol Immunol. 2019;106:170–177.
- Ye X, Wang Z, Ye Q, et al. High-Throughput sequencing-based analysis of T cell repertoire in lupus nephritis. Front Immunol. 2020;11:1618. Published 2020 Aug 6.
- Pacholczyk R, Ignatowicz H, Kraj P, et al. Origin and T cell receptor diversity of Foxp3 + CD4 + CD25+ T cells. Immunity. 2006;25(2):249–259.
- Aran A, Garrigós L, Curigliano G, et al. Evaluation of the TCR repertoire as a predictive and prognostic biomarker in cancer: diversity or clonality? Cancers (Basel). 2022;14(7):1771. Published 2022 Mar 31.
- Schultheiß C, Paschold L, Simnica D, et al. Next-Generation sequencing of T and B cell receptor repertoires from COVID-19 patients showed signatures associated with severity of disease. Immunity. 2020;53(2):442–455.e4.
- Zou J, Li B, Li D, et al. Comprehensive analysis of T-cell receptor repertoires reveals antigen-driven T-cell clusters in patients with behçet’s syndrome. Eur J Immunol. 2023;53(4):e2250181.
- Xiong H, Ji L, Yang J, et al. Analysis of CD8+ TCRβ chain repertoire in peripheral blood of vitiligo via high-throughput sequencing. Mol Immunol. 2023;160:112–120.