
 ?Mathematical formulae have been encoded as MathML and are displayed in this HTML version using MathJax in order to improve their display. Uncheck the box to turn MathJax off. This feature requires Javascript. Click on a formula to zoom.
Abstract
Lupus, a systemic autoimmune disease shaped by gene-environment interplay, often progresses to endstage renal failure. While subchronic systemic exposure to bacterial lipopolysaccharide (LPS) triggers autoimmunity and glomerulonephritis in lupus-prone mice, it is unknown if inhaling LPS, which is common in certain occupations, can similarly trigger lupus. Here we determined how subchronic intranasal (IN) LPS instillation influences autoimmunity and glomerulonephritis development in lupusprone NZBWF1 female mice. Briefly, mice were IN-instilled with vehicle or E. coli LPS (0.8 μg/g) twice weekly for 5 wk, followed by necropsy. For systemic comparison, additional cohorts of mice were injected with LPS intraperitoneally (IP) using identical doses/timing. Lungs were assessed for inflammatory and autoimmune responses and then related to systemic autoimmunity and glomerulonephritis. IN/LPS exposure induced in the lung: i) leukocyte infiltration, ii)mRNA signatures for cytokines, chemokines, IFN-regulated, and cell death-related genes, iii) ectopic lymphoid tissue formation, and iv)diverse IgM and IgG autoantibodies (AAbs). Pulmonary effects coincided with enlarged spleens, elevated plasma IgG AAbs, and inflamed IgG-containing kidney glomeruli. In contrast, IP/LPS treatment induced systemic autoimmunity and glomerulonephritis without pulmonary manifestations. Taken together, these preclinical findings suggest the lung could serve as a critical nexus for triggering autoimmunity by respirable LPS in genetically predisposed individuals.
Introduction
Systemic lupus erythematosus (lupus) is a chronic autoimmune disease that affects multiple organ systems. It predominantly afflicts women of childbearing age. Lupus is characterized by unresolved inflammation and a breakdown of self-recognition by autoreactive lymphoid cells (e.g. B- and T-cells), leading to robust production of autoantibodies (AAbs) [Citation1]. Patients diagnosed with lupus typically experience recurrent cycles of flaring and remission, which, over time, can result in cumulative damage to vital organs such as the kidney, lung, heart, skin, and brain [Citation2]. Notably, the binding of resultant AAbs to associated autoantigens (AAgs) and subsequent deposition in the kidney frequently leads to glomerulonephritis and, eventually, renal failure.
Genetic predilection and environmental exposures play critical roles in the onset and progression of lupus. In support of this premise, several epidemiological investigations suggest the etiological association between exposure to respirable crystalline silica and lupus, as well as other autoimmune diseases in humans [Citation3–5]. Consistent with these human studies, autoimmune disease onset and progression are greatly accelerated in lupus-prone mouse models following the instillation of silica into their airways [Citation6–12]. Notably, when female NZBWF1 mice are subjected to subchronic intranasal (IN) instillations silica weekly over 4 wk, they develop glomerulonephritis 12 wk earlier than the spontaneous model [Citation9,Citation11]. Before glomerulonephritis onset, silica-treated mice exhibited severe pulmonary pathology characterized by the continual accumulation of particle-laden alveolar macrophages (AMs), cell death, nuclear and cytoplasmic debris, and neutrophilic inflammation. Additionally, there is a pronounced recruitment of T and B cells to the lung, along with IgG-secreting plasma cells, suggesting the development of ectopic lymphoid tissue (ELT). Consistent with ELT neogenesis, lung fluid and blood of silica-instilled mice exhibit elevated levels of proinflammatory cytokines, chemokines, and autoantibodies. Collectively, these observations in the NZBWF1 mouse support the premise that the lung is the epicenter for silica-induced autoimmunity onset/progression, ultimately leading to glomerulonephritis and early death.
Human and animal studies linking respirable crystalline silica to autoimmunity raise the possibility that other airborne toxicants that cause inflammation and cell death in the lung may also accelerate the onset and progression of autoimmune disease in genetically susceptible individuals. Another common respirable toxicant that could potentially be an autoimmune trigger is Gram-negative bacterial lipopolysaccharide (LPS) [Citation1,Citation13–15]. Exposure to respirable LPS frequently occurs in individuals engaging in occupations involving agriculture, textiles, and waste management [Citation14,Citation16–18]. In addition to inhaling respirable LPS, humans encounter LPS in the lungs during Gram-negative bacterial pulmonary infections [Citation19,Citation20]. It has been shown in lupus-prone mice that, when systemically delivered, subchronic low dose LPS exposure elicits polyclonal B-cell activation, decreased immune complex uptake by macrophages, impaired clearance of circulating immune complexes, elevated renal immune complex deposition, and glomerulonephritis [Citation21–30].
There are several mechanisms by which inhaled LPS can accelerate the breach of immunological tolerance. LPS stimulates innate immune cell populations through toll-like receptor 4 (TLR4), activating NF-κB and IFN regulatory factors (IRFs) that promote gene expression of proinflammatory cytokine/chemokine and IFN-related gene expression, respectively. LPS can also exacerbate autoimmunity by triggering immunogenic cell death with consequent stimulation of autoreactive B- and T-cells. Airborne LPS-containing organic dust mixtures have been shown to cause inflammation with long-term exposure, leading to diminished lung function. Experimental animal studies have likewise reported that inhalation exposure to LPS-containing organic dust mixtures leads to increased pulmonary pathology and proinflammatory and Type-I Interferon (IFN) gene responses in lung tissue [Citation31,Citation32].
Preclinical studies of LPS effects in lupus-prone mice have exclusively used systemic delivery via the IP route and focused on assessing endpoints in the serum and kidney [Citation23,Citation24,Citation29,Citation30,Citation33–36]. However, it is unknown how respirable LPS might influence the onset and progression of lupus in genetically susceptible mice. To address these limitations, we tested here the hypothesis that subchronic airway exposure of female NZBWF1 mice to LPS via IN instillation will trigger inflammation and breach of immunological tolerance in the lung that accelerate local/systemic autoantibody production and glomerulonephritis.
Materials and methods
Animals
Mouse experiments were approved by the Michigan State University (MSU) Institutional Animal Care and Use Committee (IACUC) (AUF# 201800113). Six-wk-old female NZBWF1 mice (Jackson Laboratories, Bar Harbor, ME) were randomized into experimental groups following their arrival. Mice were housed three per cage and maintained at a constant temperature (21-24 °C) and humidity (40-55%) with a 12-hr light/dark cycle throughout the study. For the entirety of the study, mice were fed a modified American Institute of Nutrition (AIN)-93G diet [Citation37] containing 70 g/kg of fat, 10 g/kg from food-grade corn oil, and 60 g/kg from high-oleic safflower oil (LouAna, Brea, CA), which provided basal essential fatty acids. Diet was prepared biweekly, and mice were provided fresh food daily. Food reserves were stored at −20 °C when not in use. Mice had access to food and water throughout the study.
Experimental design
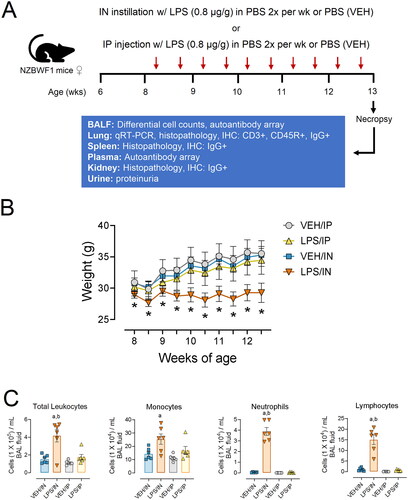
The experimental design for this study is depicted in . Beginning at age 8 wk, groups of mice (n = 6) were IN instilled twice weekly for 5 wk with LPS (0.8 µg/g) sterile PBS in 25 µL (LPS/IN) or with 25 µL of sterile PBS vehicle (VEH/IN) as untreated control. This time and dose regimen was selected based on a well-established accelerated severe lupus nephritis (ASLN) model employing IP LPS delivery following systemic delivery via the IP route [Citation23,Citation24,Citation29,Citation30,Citation33–36]. As a positive control for comparative purposes, corresponding cohorts were injected IP twice weekly for 5 wk with LPS (0.8 µg) in 25 µL sterile PBS (LPS/IP) or with 25 µL of sterile PBS vehicle (VEH/IN). Before instillations/injections, mice were anesthetized using 4% isoflurane. During LPS treatments, urine was collected weekly and tested for proteinuria (≥300 mg/dL protein) using reagent dipsticks (Cortez Diagnostics, Calabasas, CA) to assess nephritis progression.
Figure 1. (A) Experimental design. (B) Subchronic LPS/IN treatment impairs body weight increase in female NZBWF1 mice. The asterisk indicates a significant difference (p < 0.05) for VEH/IN vs LPS/IN. (C) in LPS, instillation increases total leukocyte, monocyte, neutrophil, and lymphocyte counts in the BALF. Letters: a, significantly different from VEH control within the same route of exposure (p < 0.05); b, significantly different from LPS/IP group (p < 0.05).
Necropsy
All experimental groups were terminated 1 wk after the final exposure at 14 wk of age. Mice were first anesthetized with sodium pentobarbital (50 mg/kg) administered via IP injection. Blood was collected from the inferior vena cava and placed in heparinized tubes before secondary euthanasia by exsanguination. Plasma was isolated from blood samples spun down at 2550 x g for 15 min at 4 °C. Plasma was stored at −80 °C for AAb microarray analysis. Bronchoalveolar lavage fluid (BALF) was collected from the whole lung as described previously. After completing inflammatory cell quantification in the BALF, samples were spun down at 465 x g for 15 min at 4 °C, and the cell fraction was used to perform differential cell counts. The remaining supernatant was stored at −80 °C for AAb microarray analysis. Left lung lobes were fixed in 10% neutral buffered formalin (NBF) (Fischer Scientific, Pittsburgh, PA) for 1 hr at a constant pressure of 30 cm H2O. Spleens were weighed before sectioning. The head of the spleen was fixed in 10% NBF, along with one whole kidney. The caudal lung lobe was stored in RNAlater at (Thermo Fisher Scientific, Wilmington, DE) at 4 °C for 16 hr, then moved to −80 °C. All tissues fixed in NBF remained in fixative for 72 hr prior to being processed for histology. The remaining right lung lobes and half a kidney were snap-frozen and stored at −80 °C.
BALF cell quantitation and identification
Total leukocyte cell counts in BALF were performed using a hemocytometer. In preparation for differential cell counts, BALF cells were immobilized on glass slides using centrifugal forces (Shandon Cytospin 3) and spun down at 40 x g for 10 min. Cytological slides were air-dried and then stained using Diff-Quick (Fisher Scientific). Differential cell counts were performed by counting 200 cells total per cytological slide, and morphological criteria were used to identify the number of macrophages/monocytes, neutrophils, and lymphocytes.
Lung histopathology
Left lung lobes were intratracheally fixed in formalin for 48 hr at a constant gravimetric fluid pressure of 30 cm. Using random start, the lobe was sectioned into four transverse lung blocks (∼2 mm each). Tissue blocks were embedded in paraffin, and tissues were cut at 5 µm thickness, deparaffinized, and stained with hematoxylin and eosin (H&E). Light microscopic examination was performed by a board-certified veterinary pathologist (JRH) without knowledge of individual animal exposure.
Quantitative PCR for lung tissue
Total RNA was extracted from the caudal lung lobes using TissueLyser II and an RNeasy Mini Kit (Qiagen, cat. #74104) per the manufacturer’s instructions. RNA was eluted using RNase-free water provided by the RNeasy kit and quantified using the Nanodrop ND-1000 spectrophotometer (Thermo Fisher Scientific, Waltham, MA). High-Capacity cDNA Reverse Transcriptase Kit (Thermo Fisher Scientific, cat. #4368814) RNA was used to prepare cDNA. Taqman assays were run in technical triplicate using the Takara Bio SmartChip real-time PCR system at the MSU Genomics Core to assess gene expression. Exposure-dependent mRNA expression was assessed for representative cytokine (Tnfa, Il1b, Il6, Ifng), chemokine (Ccl3, Ccl4, Ccl8, Cxcl1, Cxcl3, Cxcl9, Cxcl10, Cxcl13), IFN-regulated (Oas1a, Oasl1, Irg1), cell death-associated (Nlrp3, Casp1, Casp4, Zbp1, Bax, Bcl), and housekeeping genes (Actb, Gapd). ΔCt values were calculated by subtracting the average raw Ct value of the housekeeping genes from the raw Ct value for each gene of interest. ΔΔCt values were calculated by subtracting the average ΔCt value of the respective VEH group from the average ΔCt value of the corresponding route of exposure LPS group. ΔΔCt values are shown in units of fold increase relative to VEH control mice for each gene of interest.
Lung immunohistochemistry and morphometric analysis
Formalin-fixed, paraffin-embedded lung tissues were immunohistochemically stained at the MSU Investigative Histopathology Laboratory as described previously [Citation38]. In brief, sections were subjected to staining with polyclonal rabbit anti-mouse CD3 antibody (cat. #ab5690; Abcam, Cambridge, MA), monoclonal rat anti-mouse CD45R antibody (cat. #550286, Becton Dickinson, Franklin Lakes, NJ), and polyclonal goat anti-mouse IgG antibody (cat. #A-90-100A, Bethyl Labs, Montgomery, TX) to detect CD3+ T lymphocytes, CD45R+ B lymphocytes, and IgG+ cells/deposits, respectively. Slides were scanned using the VS200 virtual slide system (Olympus, Hicksville, NY). Using NewCast software (Visiopharm, Hoersholm, Denmark), each whole glass slide was randomly subsampled to obtain at least 100 digital microscopic images from lung tissue sections captured at 20X magnification. Morphometric analysis used to quantify CD45R+ B-cells, CD3+ T-cells, and IgG+ plasma cells in the lung was performed using the STEPanizer 1.8 stereology tool [Citation39]. Briefly, lymphoid cell densities were quantified by overlaying a point grid on randomly subsampled images. The number of grid points overlayed with positively stained cells was divided by reference tissue area to obtain a percentage of the total lung area showing positive IHC staining.
Spleen and kidney histopathology and immunohistochemistry
Spleen heads fixed in formalin were placed into individual tissue blocks, embedded with paraffin, and cut at a 5 µm thickness. Deparaffinized splenic tissue was immunohistochemically stained for IgG and counterstained with hematoxylin as described above. A light microscopic examination of germinal center formation and extracellular proteinaceous IgG deposition was assessed (JRH).
Kidney tissue sections (5 µm) were histochemically stained with H&E, and a light microscopic examination was performed by a board-certified veterinary pathologist (JRH) without knowledge of individual animal exposure. Glomerulonephritis severity scores were based on a modified Society of Nephrology/Renal Pathology Lupus Nephritis Classification system [Citation40]: (0) no tubular proteinosis, normal glomeruli; (1) mild tubular proteinosis with multifocal segmental proliferative glomerulonephritis and occasional early glomerular sclerosis and crescent formation; (2) moderate tubular proteinosis with diffuse segmental proliferative glomerulonephritis, early glomerular sclerosis, and crescent formation; (3) marked tubular proteinosis with diffuse global proliferative and sclerosing glomerulonephritis. Kidney tissue sections were also immunohistochemically stained for IgG and counterstained with H&E, and semi-quantitative scoring of renal IgG deposition was performed.
Autoantibody microarray
IgG and IgM AAb profiling was performed using a high-throughput autoantigen (AAg) microarray at the Microarray and Immune Phenotyping Core Facility at the University of Texas Southwestern Medical Center, as described previously for BALF and plasma samples. Briefly, BALF and plasma samples were pretreated with DNAse I to remove free DNA and then diluted at 1:25 or 1:50, respectively. Samples were added and incubated on protein array plates containing 122 different antigens and 6 controls. Antibody-antigen binding occurring on the plate was detected using Cy3-conjugated anti-mouse IgG (1:2000, Jackson ImmunoResearch Laboratories, PA). Fluorescent images were captured using a Genepix 4200 A scanner (Molecular Devices, CA) and were transformed to signal intensity values using GenePix 7.0 software. Signal intensity values for each AAb were first normalized by subtracting the background and normalizing to IgG internal controls, then reported as an antibody score (Ab-score). This Ab-score was calculated based on the normalized signal intensity (NSI) and signal-to-noise ratio (SNR) using the formula:
Normalized and unit variance-scaled Ab-score values were visualized using ClustVis software (36). For heat maps, data were clustered using unsupervised hierarchical co-clustering (HCC), and rows were clustered using Euclidean distance and Ward linkage. Imputation was applied for missing value estimation. ClustVis was also used for Principal Component Analysis (PCA) to calculate and illustrate similarities between exposure groups. Prism 9 (GraphPad Prism v 9.2, San Diego, CA) was used to graph select classes of IgG and IgM AAbs [Citation41].
Statistical analysis
The data obtained from the experiment were analyzed using GraphPad Prism v9.2 software (San Diego, CA). Outliers were identified using Grubb’s test with a significance level of 1%, while the normality of the data was assessed using the Shapiro-Wilk test (p < 0.01). To determine significant differences due to LPS treatment compared to the vehicle (VEH) control, as well as between different routes of exposure (intraperitoneal, IP, vs. intranasal, IN), a One-Way ANOVA was employed. In cases where the data did not meet the assumption of normality or were semi-quantitative, the Kruskal-Wallis non-parametric test was utilized. Results are expressed as mean ± standard error of the mean (SEM), with statistical significance set at p ≤ 0.05.
Results
IN LPS instillation induced the recruitment of inflammatory leukocytes into the lung
Mice in the four experimental groups did not exhibit evident signs of deteriorating health, such as lethargy, rough coat, dyspnea, or decreased ambulation. Impaired weight gain, an indicator of LPS-induced sickness behavior, was observed in the LPS/IN group but not in the LPS/IP group (). IN LPS exposure induced significant increases in total leukocytes, macrophages/monocytes, neutrophils, and lymphocytes in the BALF compared to VEH controls ().
Consistent with induction of BALF cellularity, histopathologic analysis revealed that mice in the LPS/IN group predominantly had a mononuclear cell bronchopneumonia, consisting mainly of lymphocytes, plasma cells, and macrophages/monocytes, with lesser numbers of neutrophils (). Lung lesions were most severe in the hilar region of the lung lobe. LPS-induced bronchiolitis/alveolitis consisted of conspicuous accumulations of lymphoid cells in the interstitial tissue surrounding bronchioles and blood vessels (ELT) and alveolar accumulations of enlarged and often vacuolated macrophages. Hyperplasia of type 2 alveolar epithelial cells was occasionally present in the inflamed alveolar parenchyma, as well as bronchiolar epithelial hypertrophy/hyperplasia in small diameter pre-terminal and terminal bronchioles. Lung lesions were not present in VEH/IN mice, except for occasional small inflammatory foci randomly scattered in the alveolar parenchyma and composed of a mixed inflammatory cell infiltrate (neutrophils, monocytes, and macrophages). These small foci were often associated with a minute foreign body (e.g. inhaled bedding or food material).
Figure 2. Light photomicrographs of hematoxylin and eosin-stained lung tissue sections from intranasally with instilled saline vehicle-alone mouse (VEH/IN) at (A) low and (B) high magnification; intranasally instilled LPS mouse (LPS/IN) at (C) low and (D) high magnification; intraperitoneally instilled saline vehicle-alone mouse (VEH/IP) at (E) low and (F) high magnification; and intraperitoneally instilled LPS mouse (LPS/IP) at (G) low and (H) high magnification. Abbreviations: a, alveolar parenchyma; ba, bronchiolar airway. Arrows: stippled arrow in (B), foreign body circumscribed by macrophage/monocytes; solid arrows in (C), perivascular/peribronchiolar lymphoid cells; open-faced arrows in (D), hyperplasia of type 2 alveolar epithelial cells. Numbers: 1 in (D), macrophages/monocytes in alveolar lumen; 2 in (D), neutrophils in alveolar lumen; 3 in (D), plasma cells in perivascular interstitial tissue; 4 in (D), lymphoid cells in perivascular interstitial tissue.
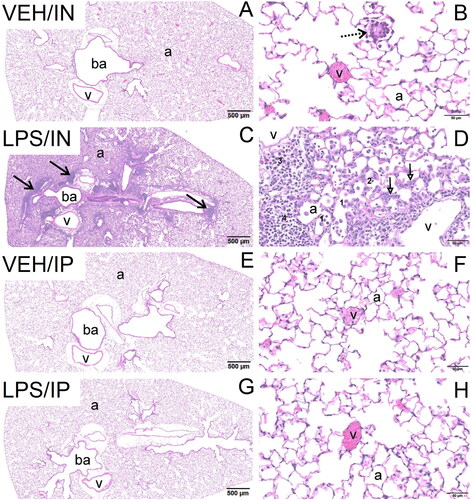
IP delivery of LPS did not affect BALF cellularity (). No exposure-related histopathology was microscopically evident in the lungs of mice exposed IP to LPS or VEH ().
In LPS administration elicits expression of cytokine, chemokine, IFN-regulated, and death-associated genes in the lung
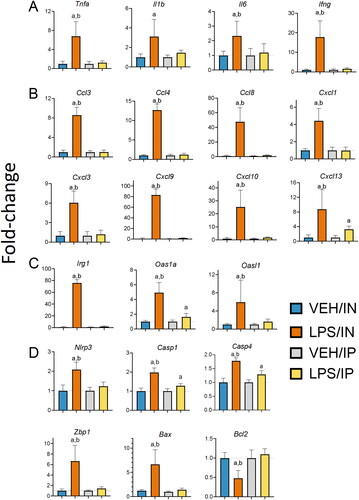
Consistent with the recruitment of inflammatory cells to the lung, IN LPS delivery upregulated expression of genes in the lung related to cytokines (Tnfa, Il1b, Il6, Ifng) (), chemokines (Ccl3, Ccl4, Ccl8, Cxcl1, Cxcl3, Cxcl9, Cxcl10, Cxcl13) (), and IFN response (Oas1a, Oasl1, Irg1) (). IN LPS exposure also induced (Nlrp3, Casp1, Casp4, Zbp1, Bax) genes associated with upregulation of cell death and suppressed Bcl2, a negative regulator of cell death (). Of these genes, only Cxcl13, Oas1a, Casp1, and Casp4 were modestly induced by IP exposure to LPS ().
Figure 3. Intranasal (IN) but not intraperitoneal (IP) LPS exposure induces expression of (A) cytokine, (B) chemokine, (C) IFN-regulated, and (D) cell death-related genes in the lung. Quantitative RT-PCR was used to assess exposure-dependent changes in gene expression within the lung tissue. Letters: a, differs from VEH control within the same route of exposure (p < 0.05); b, differs from LPS/IP group (p < 0.05).
IN LPS treatment triggers ELT neogenesis in the lung
Based on the observed increased leukocyte infiltration and inflammatory gene expression in the lungs of LPS/IN mice, IHC and morphometric analysis were used to quantify B and T lymphocyte populations in ELT exposed via the IN route. LPS/IN mice exhibited significant infiltration of CD45R+ B cells () and CD3+ T cells () around the perivascular and peribronchiolar regions of the lung compared to VEH/IN mice. Correspondingly, mice subjected to LPS/IN exhibited increased numbers of IgG+ plasma cells located in ELT (). While LPS/IP mice exposed did not show ELT development or have an increased presence of IgG+ plasma cells, there was still noticeable extracellular IgG+ proteinaceous material deposition in the lung compared to VEH/IP mice ().
Figure 4. Intranasal (IN) LPS exposure increases lung infiltration of perivascular B-cells and T-cells. Representative light photomicrographs of perivenous ectopic lymphoid tissue (ELT) immunohistochemically stained for (A) CD45R+ B lymphoid cells and (C) CD3+ T cells in lungs from VEH/IN and LPS/IN mice. Abbreviations: pv, pulmonary vein; ba, bronchiolar airway; i, peribronchiolar and perivascular interstitium; a, alveolar parenchyma. Arrows: low power (left), peri-vascular/bronchiolar ectopic lymphoid tissue; high power (right), positively stained lymphoid cells. IN LPS exposure triggered significant interstitial infiltration of (A) CD45R+ B-cells and (C) CD3+ T-cells compared to VEH/IN mice. Graphical representation of morphometrically determined density of CD45R+ B-cells (B) and CD3+ T-cells (D) in lung tissue from VEH/IN and LPS/IN mice. Asterisks: *** p < 0.001, **** p < 0.0001 for VEH/IN vs LPS/IN.
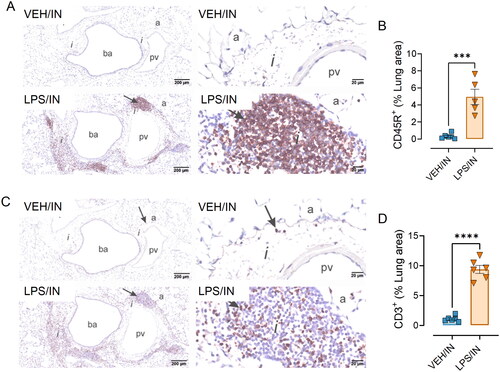
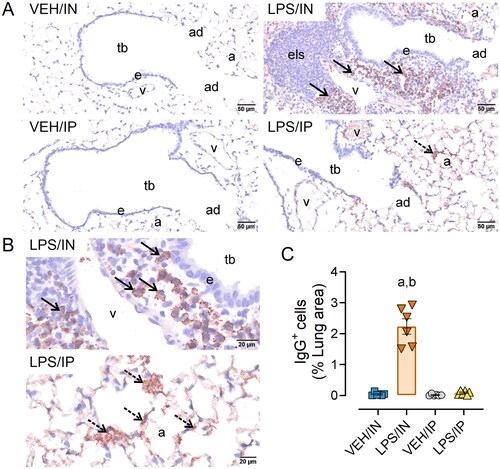
Figure 5. Intranasal (IN) LPS exposure induces increased numbers of pulmonary IgG+ plasma cells in the lung. (A) Representative light photomicrographs of perivenous ectopic lymphoid tissue (ELT) immunohistochemically stained for IgG+ plasma cells (solid arrows) and alveolar parenchyma immunohistochemically stained for extracellular IgG+ proteinaceous material (stippled arrows) in alveolar airspace. (B) Zoomed in photomicrographs IgG+ stained tissue around pulmonary vessel in LPS exposed mice. Abbreviations: tb, terminal bronchiole; e, epithelium; v, pulmonary vein; a; alveolar parenchyma; els, ectopic lymphoid structure/tissue. (C) Graphical representation of morphometrically determined lung density of IgG+ plasma cells. LPS/IP treatment did not lead to increased IgG+ plasma cell infiltration, but extracellular IgG deposition in lung tissue was still present. Tissues counterstained with hematoxylin; letters: a, significantly different from VEH control within the same route of exposure (p < 0.05); b, significantly different from LPS/IP group (p < 0.05).
IN and IP LPS delivery induce splenomegaly and splenic IgG-producing cells
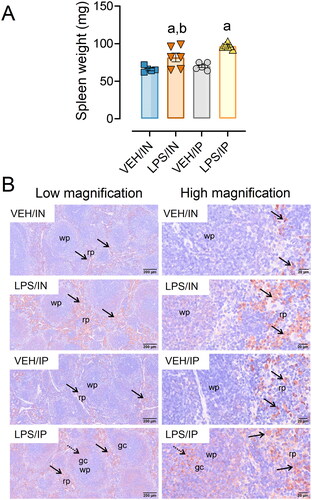
Both the LPS/IN and LPS/IP groups exhibited significant increases in spleen weights compared to their respective VEH controls, with spleen weights being greater in LPS/IP mice compared to LPS/IN mice (). LPS-exposed mice from both IP and IN groups had marked increases in IgG deposition in the spleen compared to their respective controls (). LPS/IP mice had extensive formation of germinal centers, which were absent or less evident in VEH/IP, LPS/IN, and VEH IN mice.
Figure 6. Intranasal (IN) and intraperitoneal (IP) LPS exposure induce splenomegaly and splenic IgG deposition. (A) Spleen weights from LPS/IP and LPS/IN mice were significantly greater compared to VEH/IP and VEH/IN mice, respectively. Letters: a, significantly different from VEH control within the exact route of exposure (p < 0.05); b, significantly different from LPS/IP group (p < 0.05). (B) Increased IgG deposition was evident in the IN/LPS and IP/LPS groups. Light photomicrographs of splenic tissue immunohistochemically stained for extracellular IgG+ proteinaceous material and counterstained with hematoxylin. Solid arrows indicate IgG+ stained tissue. Abbreviations: wp, white pulp; rp, red pulp; gc, germinal center. Splenic white pulp increased (lymphoid cell hyperplasia) in mice exposed to LPS IP and IN. Germinal center formation (stippled arrows) present in LPS/IP mice.
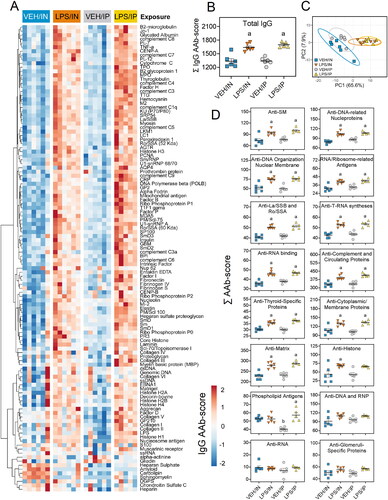
IN LPS administration induces diverse IgG and IgM AAbs in BALF
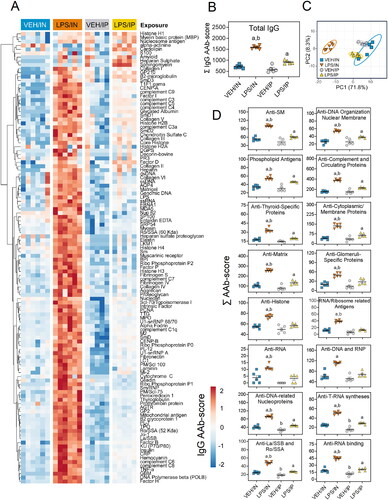
LPS/IN mice exhibited robust increases of both BALF IgM AAbs () and IgG AAbs () relative to their respective VEH-treated controls. In comparison, IgM and IgG AAbs in BALF were only minimally elevated in LPS/IP mice. PCA analysis revealed distinct clustering of VEH/IN samples from LPS/IN, VEH/IP, and LPS/IP groups for IgM AAb () and IgG AAb () responses in the BALF. Specificities for IgM and IgG AAbs in LPS/IN mice, and IgG AAbs in LPS/IP mice, were highly diverse and extended over a wide range of AAgs, including DNA-related nucleoproteins, anti-DNA organization and nuclear membrane, phospholipid antigens, and complement and circulating proteins ( and ). A markedly lower range of specificities of IgM and IgG AAbs was evident in the LPS/IP mouse cohort.
Figure 7. Intranasal (IN) LPS exposure elicits broad IgM AAb response in BALF. AAb production was measured in BALF samples collected at the time of necropsy. (A) Heat map illustrates unsupervised clustering (euclidian distance method) of 122 AAbs shown as AAb-score values for IgM expression in BALF. Scale bar values reflect the range of variance-stabilized AAb scores, which were centered across rows. (B) IN LPS exposure increased total IgM levels in the BALF. (C) PCA of differentially expressed IgM AAbs in the BALF of VEH and LPS-exposed mice for both routes of exposure. Ellipses illustrate 95% confidence intervals. (D) in LPS exposure led to increases in various classes of IgM AAbs compared to their respective VEH control mice. Letters: a, significantly different from VEH control within the same route of exposure (p < 0.05); b, significantly different from LPS/IP group (p < 0.05).
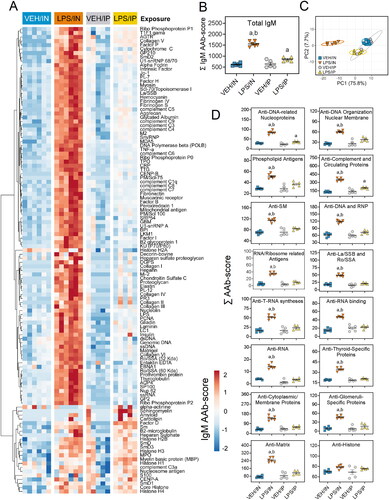
Figure 8. Intranasal (IN) LPS exposure diverse IgG AAb response in the BALF. (A) AAb heat maps were constructed as described in legend. (B) IN LPS exposure increased total IgG levels in the BALF. (C) PCA of differentially expressed IgG AAbs in the BALF of VEH and LPS-exposed mice for both routes of exposure. Ellipses illustrate 95% confidence intervals. (D) Both IP and in LPS exposure led to increases in various classes of AAbs in the BALF compared to their respective VEH control mice. Letters: a, significantly different from VEH control within the same route of exposure (p < 0.05); b, significantly different from LPS/IP group (p < 0.05).
IP LPS and IN LPS differentially induce plasma IgM and IgG AAbs
In the plasma, LPS/IP mice exhibited marked increases in IgM AAbs, while these responses were muted in the LPS/IN mice (). IgM AAbs in LPS/IP mice reacted with most AAgs on the microarray, whereas IgM AAbs in LPS/IN mice moderately reacted with a smaller subset of AAgs (). Both the LPS/IP and LPS/IN groups exhibited modest increases in IgG AAbs for many microarray AAgs ().
Figure 9. Intraperitoneal (IP) LPS exposure triggers more robust IgM AAb responses in plasma than intranasal (IN) LPS treatment. (A) AAb heat maps constructed as detailed in legend. (B) IP and in LPS exposure increased total IgM levels in the plasma. (C) PCA of differentially expressed IgM AAbs in the plasma of VEH and LPS-exposed mice for both routes of exposure. Ellipses illustrate 95% confidence intervals. (D) Both IP and in LPS exposure led to increases in various classes of AAbs in the plasma compared to their respective VEH control mice. Letters: a, significantly different from VEH control within the same route of exposure (p < 0.05); b, significantly different from LPS/IP group (p < 0.05).
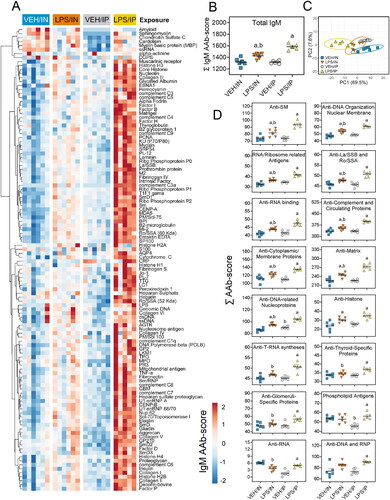
Figure 10. Both intranasal (IN) and intraperitoneal (IP) LPS exposures elicit diverse IgG AAbs in the plasma. (A) AAb heat maps constructed as detailed in legend. (B) IP and in LPS exposure increased total IgG AAb levels in the plasma. (C) PCA of differentially expressed IgG AAbs in the plasma of VEH and LPS-exposed mice for both routes of exposure. Ellipses illustrate 95% confidence intervals. (D) Both IP and in LPS exposure led to increases in various classes of AAbs in the plasma compared to their respective VEH control mice. Letters: a, significantly different from VEH control within the same route of exposure (p < 0.05); b, significantly different from LPS/IP group (p < 0.05).
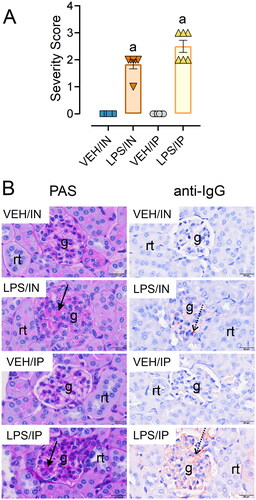
LPS administration by IN and IP routes induces glomerulonephritis
Both routes of LPS exposure elicited glomerulonephritis compared to their respective VEH controls (). Mice exposed to IN LPS exhibited minimal to mild glomerular hypertrophy compared to VEH/IN mice with limited IgG deposition (). Comparatively, mice exposed to LPS via IP injection had marked glomerular hypertrophy/hypercellularity and mild IgG deposition compared to their VEH controls. Proteinuria was not detected in the urine of any experimental groups throughout the study. Altogether, these findings suggest the glomerulonephritides induced by IN LPS and IP LPS were both at a relatively early stages.
Figure 11. Intranasal (IN) and intraperitoneal (IP) LPS delivery induce glomerulonephritis. (A) Individual kidney sections were semi-quantitatively scored based on the modified international society of nephrology/renal pathology lupus nephritis classification system as described in materials and methods. Mice in both the IN and IP LPS cohorts exhibited elevated glomerulonephritis scores compared to respective VEH controls. The letter a indicates significantly different from VEH control within the same route of exposure (p < 0.05). (B) Light photomicrographs of kidney sections stained with periodic acid schiff (PAS) stain (left panel, arrows indicate moderately hypertrophic and hypercellular glomeruli) or immunohistochemically stained with IgG (right panel, arrows indicate red-brown chromogen) and counterstained with hematoxylin. Abbreviations: g, glomerulus; rt, renal tubule. LPS/IN mice exhibited mild glomerular hypertrophy (solid arrows) and little IgG deposition (stippled arrows) compared to VEH/IN mice, and LPS/IP mice had marked glomerular hypertrophy (solid arrows) and mild IgG deposition (stippled arrows) compared to VEH/IP mice.
Discussion
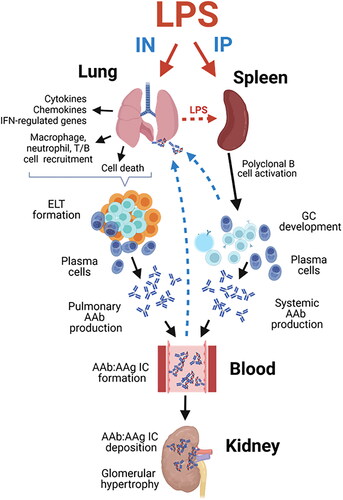
This investigation is novel because it is the first to explore in a lupus-prone mouse model how subchronic airway exposure to LPS influences inflammation and autoimmunity in the lung and relate these pulmonary effects to systemic autoimmunity and glomerulonephritis. Results were further related to positive control mice treated with LPS IP using identical dose and timing. First, we found that IN exposure to LPS induced i) robust BALF leukocyte cellularity, ii) cytokine, chemokine, IFN-regulated, cell-death associated gene expression in the lung, and iii) pulmonary ELT formation comprised of infiltrating CD45R+ B-, CD3+ T-lymphocytes, and IgG+ plasma cells; these changes were not evident in LPS/IP or VEH-instilled mice. Second, while both routes of LPS exposure triggered splenomegaly and splenic IgG deposition, splenic germinal center formation was more evident in LPS/IP mice. Third, robust induction of diverse IgM and IgG AAbs was evident in the BALF after IN LPS exposure, whereas vigorous IgM AAb responses in the plasma were more prominent after IP LPS exposure. Finally, glomerulonephritis with IgG deposition was observed in both LPS/IN and LPS/IP mice cohorts. Key results of this study and postulated mechanisms are summarized in . Altogether, the robust effects of IN LPS exposure on inflammatory cell recruitment, gene expression, ELT development, and AAb production in the pulmonary compartment suggest that the lung can serve as a nexus for LPS-accelerated autoimmunity that collectively contribute to glomerulonephritis.
Figure 12. Putative mechanisms for differential effects of intranasal (IN) and intraperitoneal (IP) LPS exposure on pulmonary inflammation, tissue-specific AAb production, AAb-AAg immune complex formation/deposition, and renal inflammation in NZBWF1 mice. Glomerulonephritis in LPS/IN mice likely primarily resulted from ELT formation, germinal center development, and elevated immunoglobulin (Ig)-producing plasma cells in the lung. In LPS/IP mice, systemic AAb responses and glomerulonephritis likely stemmed from polyclonal B-cell activation and Ig-secreting plasma cells located in the spleen. Illustration created with BioRenderTM .
The observations that subchronic LPS delivery by IN but not IP routes elicited pronounced inflammation, gene expression, and ELT development in the lung are consistent with those observed following subchronic IN exposure to crystalline silica in NZBWF1 mice [Citation9,Citation38]. Pulmonary ELTs likely served as a source for robust IgM and IgG responses in the BALF of mice IN exposed to LPS. Elevated levels of IgM and IgG AAbs detected in the BALF suggested that isotype switching occurred during the study. Conversely, IP but not IN LPS exposure triggered plasma AAb responses that were primarily of the IgM isotype. These might reflected systemic AAb production that driven by polyclonal B-cell activation and the development of splenic germinal centers. Germinal centers in the spleen contain large numbers of proliferating B-cells, which, in this experimental model, could have been activated by either LPS or, in the context of T cell help, self-antigens [Citation33,Citation34].
LPS predominantly initiates innate immune cell activation through its binding to the CD14 receptor that facilitates the formation of the CD14/TLR4/MD2 receptor complex, which is expressed on various immune cell types [Citation42]. Activation of this complex triggers a series of responses in monocytes and macrophages, leading to the production of inflammatory cytokines such as TNF and IL-1. Furthermore, LPS stimulation of B cells via TLR4 induces polyclonal IgM antibody production in vitro and in vivo [Citation43]. Studies conducted in lupus-prone mice have demonstrated that systemic administration of LPS induces polyclonal B-cell activation that ultimately results in increased deposition of immune complexes in the kidneys, and the development of glomerulonephritis [Citation21–30]. Our AAg microarray findings here suggest that IP LPS delivery induced primarily IgM AAbs are consistent with polyclonal B cell activation via TLR4.
It should be noted that in addition to LPS-mediated effects in the lung, spleen, and plasma, IN and IP LPS treatments elicited modest but significant renal pathology compared to VEH control mice. While the findings support the idea that subchronic LPS exposure, regardless of route of administration, was indeed capable of initiating pathology in the kidneys of NZBWF1 mice, neither was severe enough to cause proteinuria. Further studies are therefore needed to determine if LPS-induced glomerulonephritis progresses with additional exposures or time post-exposure in this preclinical lupus model.
This study employed LPS derived from E.coli. In prior studies employing female NZBWF1 mice exposed to Salmonella-derived LPS via IP injection using the same dose as in the present model, much more severe glomerulonephritis and renal immune complex deposition then were observed here [Citation33–36]. Glomerulonephritis severity is highly dependent on whether the LPS used was of the mutant rough or wild-type smooth chemotype. Repeated IP injections with smooth Salmonella LPS elicited mild renal pathology, whereas repeated IP injections with rough Salmonella LPS induced advanced glomerulonephritis in NZBWF1 mice, [Citation33]. Interestingly, although the E. coli LPS strain used in the present study is a smooth serotype, it elicited qualitatively more robust renal pathology compared to mice injected with smooth Salmonella LPS. Thus, the severity of LPS-accelerated autoimmune nephritis in NZBWF1 mice may not only be chemotype-dependent but also influenced by the type of Gram-negative bacterium from which the LPS was derived.
The LPS dose and schedule used were chosen for comparative purposes to replicate the IP dosing regimens used in prior studies to trigger lupus nephritis in NZBWF1 mice [Citation33]. When delivered by the IN route, this LPS dose is sufficient to cause pulmonary inflammation in C57BL6 mice [Citation44]. The translational relevance of this dose is difficult to gauge because humans are much more sensitive to LPS than rodents [Citation45,Citation46]. Furthermore, environmental and occupational exposures to endotoxin can vary tremendously due to a vast array of factors (e.g. urban vs rural settings, occupational type, and pets in the household) [Citation47]. In future research, it will therefore be insightful to investigate the dose-dependent effects of IN LPS exposure in lupus-prone mice.
It was notable that there was a significant impairment in body weight gain among mice along with pulmonary inflammation following subchronic IN LPS instillation that is consistent with LPS-induced sickness behavior mediated by proinflammatory cytokines [Citation48]. However, subchronic IP injection of LPS at the same doses did not result in weight effects or pulmonary inflammation. These different responses could reflect inherent tissue-specific differences in the clearance and sensing of LPS [Citation49]. In support of this notion, comparisons conducted 24 hr post-LPS exposure revealed a significant elevation in pulmonary damage following IN instillation, while intravenous injection exhibited a baseline effect even at 10 times the dose [Citation50]. Thus, IN administration of LPS specifically induces pulmonary damage, whereas alternative routes, such as intravenous and intraperitoneal LPS administration, may not result in a tissue-specific or comparable degree of pulmonary injury.
This investigation had limitations. In accordance with our stated hypothesis, we necropsied mice at 5 wk PI to determine how subchronic IN LPS instillation influences autoimmunity and glomerulonephritis development in NZBWF1 mice. This time interval was chosen based on a well-established accelerated lupus nephritis model employing subchronic IP LPS exposure [Citation35,Citation51–53]. However, a constraint of using this single timepoint is that it does not provide insight into whether IN LPS promoted early death from glomerulonephritis. Granholm and Cavallo [Citation54] previously showed that the pathologic effects, including glomerulonephritis, of subchronic LPS exposure via the IP route effects in NZBWF1 mice were persistent and detectable up till 6 wk after LPS was discontinued. It might therefore be speculated that subchronic LPS exposure via the IN route would similarly elicit persistent glomerulonephritis that potentially leads to early mortality; however, additional studies would be needed to confirm this hypothesis.
Another limitation is that while this investigation provides important new insights into LPS-mediated autoimmune responses in lupus-prone NZBWF1 mice, it is unknown how these treatments would impact mice without genetic predisposition for autoimmunity. In female NZBWF1 lupus-prone mice, multiple genetic mutations facilitate the production of pathogenic AAbs originating from spontaneously generated germinal centers (GCs), exhibiting features such as class switching to IgG and an elevation in the number of somatic mutations [Citation54]. The development of these spontaneous GCs in lupus-prone mice involves the activation of several B cell signaling pathways triggered by signaling through the B cell receptor (BCR) and coreceptors, as well as pathways activated through assistance from specialized CD4 T cells. The increased disease penetrance in NZBWF1 and other lupus-prone mice might heighten their sensitivity to environmental triggers such as LPS, making them appropriate surrogates for humans with a genetic predilection to lupus [Citation55]. Nevertheless, additional studies in non-lupus-prone mouse strains (e.g. female C57BL/6 or BALB/c) exposed to LPS will be necessary to better clarify the relationship between genetics and LPS-induced breakdown of immunological tolerance.
Conclusion
The results presented herein suggest that subchronic airway exposure of female NZBWF1 mice to LPS via the IN route triggers and innate and adaptive immune response sufficient to breach immunological tolerance in the lung, ultimately leading to robust local and systemic AAb production and mild glomerulonephritis (). These preclinical findings support the contention that airborne LPS could potentially trigger autoimmunity in individuals genetically predisposed to lupus, with the lung serving as a critical nexus.
Authors’ contributions
LH: study design, coordination, animal handling, necropsy, data curation, data analysis/interpretation, figure preparation, manuscript preparation and submission; LR: data curation and visualization; JW: study design, necropsy, lab analysis; RL: instillations/injections, necropsy, lab analysis; QZL: AAb microarray; AR: animal handling, urinalysis; AT and JS: morphometric analysis; JH: study design, oversight, lung/kidney histopathology, morphometry, data analysis, manuscript preparation; JP: study design, oversight, funding acquisition, data analysis, manuscript preparation and submission.
Acknowledgments
The authors thank Amy Porter of the Michigan State University Laboratory for Investigative Histopathology for her assistance with histotechnology.
Disclosure statement
Following the completion of these experiments, AstraZeneca employed Author Lichchavi D. Rajasinghe, and GeneCopoeia employed Author Quanzhen Li. The remaining authors declare that the research was conducted in the absence of any commercial or financial relationships that could be construed as a potential conflict of interest.
Data availability statement
Original IgM and IgG AAb scores for BALF and plasma are available in a publicly accessible repository: https://doi.org/10.5061/dryad.m905qfv6h.
Additional information
Funding
References
- Tsokos GC, Lo MS, Reis PC, et al. New insights into the immunopathogenesis of systemic lupus erythematosus. Nat Rev Rheumatol. 2016;12(12):1–18.
- Moulton VR, Suarez-Fueyo A, Meidan E, et al. Pathogenesis of human systemic lupus erythematosus: a cellular perspective. Trends Mol Med. 2017;23(7):615–635.
- Parks CG, Cooper GS, Nylander-French LA, et al. Occupational exposure to crystalline silica and risk of systemic lupus erythematosus: a population-based, case-control study in the southeastern United States. Arthritis Rheum. 2002;46(7):1840–1850.
- Pollard KM. Silica, silicosis, and autoimmunity. Front Immunol. 2016;7:97.
- Morotti A, Sollaku I, Catalani S, et al. Systematic review and meta-analysis of epidemiological studies on the association of occupational exposure to free crystalline silica and systemic lupus erythematosus. Rheumatology (Oxford). 2021;60(1):81–91.
- Brown J, Archer A, Pfau J, et al. Silica accelerated systemic autoimmune disease in lupus-prone New Zealand mixed mice. Clin Exp Immunol. 2003;131(3):415–421.
- Brown JM, Pfau JC, Holian A. Immunoglobulin and lymphocyte responses following silica exposure in New Zealand mixed mice. Inhal Toxicol. 2004;16(3):133–139.
- Brown JM, Pfau JC, Pershouse MA, et al. Silica, apoptosis, and autoimmunity. J Immunotoxicol. 2005;1(3):177–187.
- Bates MA, Brandenberger C, Langohr I, et al. Silica triggers inflammation and ectopic lymphoid neogenesis in the lungs in parallel with accelerated onset of systemic autoimmunity and glomerulonephritis in the lupus-prone NZBWF1 mouse. PLoS One. 2015;10(5):e0125481.
- Clark A, Zhao EJ, Birukova A, et al. Inhaled silica induces autoimmunity in a strain-dependent manner. J Immunol. 2017;198(1_Supplement):58.13–58.13.
- Bates M, Akbari P, Gilley K, et al. Dietary docosahexaenoic acid prevents silica-induced development of pulmonary ectopic germinal centers and glomerulonephritis in the lupus-prone NZBWF1 mouse. Front Immunol. 2018;9:2002.
- Foster MH, Ord JR, Zhao EJ, et al. Silica exposure differentially modulates autoimmunity in lupus strains and autoantibody transgenic mice. Front Immunol. 2019;10:2336.
- Mu Q, Zhang H, Luo XM. SLE: another autoimmune disorder influenced by microbes and diet? Front Immunol. 2015;6:608–608.
- Farokhi A, Heederik D, Smit LAM. Respiratory health effects of exposure to low levels of airborne endotoxin - A systematic review. Environ Health. 2018;17(1):14.
- He S, Liang Y, Shao F, et al. Toll-like receptors activate programmed necrosis in macrophages through a receptor-interacting kinase-3-mediated pathway. Proc Natl Acad Sci U S A. 2011;108(50):20054–20059.
- Sigsgaard T, Bonefeld-Jørgensen EC, Hoffmann HJ, et al. Microbial cell wall agents as an occupational hazard. Toxicol Appl Pharmacol. 2005;207(2 Suppl):310–319.
- Wunschel J, Poole JA. Occupational agriculture organic dust exposure and its relationship to asthma and airway inflammation in adults. J Asthma. 2016;53(5):471–477.
- Illescas-Montes R, Corona-Castro CC, Melguizo-Rodríguez L, et al. Infectious processes and systemic lupus erythematosus. Immunol. 2019;158(3):153–160.
- Liebers V, Brüning T, Raulf M. Occupational endotoxin exposure and health effects. Arch Toxicol. 2020;94(11):3629–3644.
- Ebbensgaard A, Mordhorst H, Aarestrup F, et al. The role of outer membrane proteins and lipopolysaccharides for the sensitivity of Escherichia coli to antimicrobial peptides. Front Microbiol. 2018;9:2153.
- Cavallo T, Goldman M, Graves K, et al. Altered glomerular permeability in the early phase of immune complex nephritis. Kidney Int. 1983;24(5):632–637.
- Cavallo T, Goldman M, Lambert PH. Animal model of human disease. Proliferative glomerulonephritis associated with polyclonal B-cell activation. Am J Pathol. 1984;114(2):346–348.
- Cavallo T, Granholm NA. Bacterial lipopolysaccharide transforms mesangial into proliferative lupus nephritis without interfering with processing of pathogenic immune complexes in NZB/W Mice. Am J Pathol. 1990;137(4):971–978.
- Cavallo T, Granholm NA. Lipopolysaccharide from gram-negative bacteria enhances polyclonal B cell activation and exacerbates nephritis in MRL/lpr mice. Clin Exp Immunol. 1990;82(3):515–521.
- Cavallo T, Granholm NA. Repeated exposure to bacterial lipopolysaccharide interferes with disposal of pathogenic immune complexes in mice [Article. Clin Exp Immunol. 1990;79(2):253–259.
- Cavallo T, Granholm NA. Accelerated (proliferative) lupus nephritis. Am J Pathol. 1990;137(6):1549–1551.
- Ramos-Niembro F, Fournie G, Lambert PH. Induction of circulating immune-complexes and their renal localization after acute or chronic polyclonal B-cell activation in mice. Kidney Int. 1982;21:s 29–S38.
- Fournie GJ, Minh MG, Mignon-Conte MA, et al. Acceleration of glomerulonephritis in NZB x NZW mice by early immunization with DNA and injection of bacterial lipopolysaccharide. Experimental approach to the treatment of lupus nephritis by use of the accelerated model of NZB x NZW mouse disease. J Clin Lab Immunol. 1980;4(2):103–106.
- Granholm NA, Cavallo T. Bacterial lipopolysaccharide enhances deposition of immune complexes and exacerbates nephritis in BXSB lupus-prone mice. Clin Exp Immunol. 1991;85(2):270–277.
- Granholm NA, Cavallo T. Bacterial lipopolysaccharide causes variable deposits of diverse immunoglobulin isotypes in kidneys of lupus-prone mice. Lupus. 1992;1(4):255–261.
- Gaurav R, Mikuls TR, Thiele GM, et al. High-throughput analysis of lung immune cells in a combined murine model of agriculture dust-triggered airway inflammation with rheumatoid arthritis. PLoS One. 2021;16(2):e0240707.
- Poole JA, Thiele GM, Janike K, et al. Combined collagen-induced arthritis and organic dust-induced airway inflammation to model inflammatory lung disease in rheumatoid arthritis. J Bone Miner Res. 2019;34(9):1733–1743.
- Favor OK, Chauhan PS, Pourmand E, et al. Lipidome modulation by dietary omega-3 polyunsaturated fatty acid supplementation or selective soluble epoxide hydrolase inhibition suppresses rough LPS-accelerated glomerulonephritis in lupus-prone mice. Front Immunol. 2023;14:1124910.
- Ka SM, Lin JC, Lin TJ, et al. Citral alleviates an accelerated and severe lupus nephritis model by inhibiting the activation signal of NLRP3 inflammasome and enhancing Nrf2 activation. Arthr Res Ther. 2015;17(1):331–331.
- Lin T-J, Wu C-Y, Tsai P-Y, et al. Accelerated and severe lupus nephritis benefits from M1, an active metabolite of ginsenoside, by regulating NLRP3 inflammasome and T cell functions in mice. Front Immunol. 2019;10:1951–1951.
- Wu C-Y, Hua K-F, Chu C-L, et al. Tris DBA ameliorates accelerated and severe lupus nephritis in mice by activating regulatory T cells and autophagy and inhibiting the NLRP3 Inflammasome. J Immunol. 2020;204(6):1448–1461.
- Reeves PG, Nielsen FH, Fahey GC.Jr. AIN-93 purified diets for laboratory rodents: final report of the American Institute of Nutrition ad hoc writing committee on the reformulation of the AIN-76A rodent diet. J Nutr. 1993;123(11):1939–1951.
- Pestka JJ, Akbari P, Wierenga KA, et al. Omega-3 polyunsaturated fatty acid intervention against established autoimmunity in a murine model of toxicant-triggered lupus. Front Immunol. 2021;12:653464.
- Tschanz SA, Burri PH, Weibel ER. A simple tool for stereological assessment of digital images: the STEPanizer. J Microsc. 2011;243(1):47–59.
- Bajema IM, Wilhelmus S, Alpers CE, et al. Revision of the International Society of Nephrology/Renal Pathology Society classification for lupus nephritis: clarification of definitions, and modified National Institutes of Health activity and chronicity indices. Kidney Int. 2018;93(4):789–796.
- Rajasinghe LD, Li QZ, Zhu C, et al. Omega-3 fatty acid intake suppresses induction of diverse autoantibody repertoire by crystalline silica in lupus-prone mice. Autoimmunity. 2020;53(7):415–433.
- Rosadini CV, Kagan JC. Early innate immune responses to bacterial LPS. Curr Opin Immunol. 201744:14–19.
- Lu M, Munford R. LPS stimulates IgM production in vivo without help from non-B cells. Innate Immun. 2016;22(5):307–315.
- Tsikis ST, Fligor SC, Hirsch TI, et al. Lipopolysaccharide-induced murine lung injury results in long-term pulmonary changes and downregulation of angiogenic pathways. Sci Rep. 2022;12(1):10245.
- Hernandez ML, Wagner JG, Kala A, et al. Vitamin E, γ-tocopherol, reduces airway neutrophil recruitment after inhaled endotoxin challenge in rats and in healthy volunteers. Free Radic Biol Med. 2013;60:56–62.
- Copeland S, Warren HS, Lowry SF, et al. Acute inflammatory response to endotoxin in mice and humans. Clin Diagn Lab Immunol. 2005;12(1):60–67.
- Thorne PS. Environmental endotoxin exposure and asthma. J Allergy Clin Immunol. 2021;148(1):61–63.
- Langhans W. Signals generating anorexia during acute illness. Proc Nutr Soc. 2007;66(3):321–330.
- Munford RS. Detoxifying endotoxin: time, place and person. J Endotoxin Res. 2005;11(2):69–84.
- Szarka RJ, Wang N, Gordon L, et al. A murine model of pulmonary damage induced by lipopolysaccharide via intranasal instillation. J Immunol Methods. 1997;202(1):49–57.
- Yang SR, Hsu WH, Wu CY, et al. Accelerated, severe lupus nephritis benefits from treatment with honokiol by immunoregulation and differentially regulating NF-κB/NLRP3 inflammasome and sirtuin 1/autophagy axis. Faseb J. 2020;34(10):13284–13299.
- Ka SM, Lin JC, Lin TJ, et al. Citral alleviates an accelerated and severe lupus nephritis model by inhibiting the activation signal of NLRP3 inflammasome and enhancing Nrf2 activation. Arthritis Res Ther. 2015;17(1):331.
- Tsai PY, Ka SM, Chang JM, et al. Epigallocatechin-3-gallate prevents lupus nephritis development in mice via enhancing the Nrf2 antioxidant pathway and inhibiting NLRP3 inflammasome activation. Free Radic Biol Med. 2011;51(3):744–754.
- Raparia C, Quach TD, Zeumer-Spataro L, et al. Combination CTLA4Ig and Anti–CD40 ligand treatment modifies T and B Cell metabolic profiles and promotes B Cell receptor remodeling in a mouse model of systemic lupus erythematosus. J Immunol. 2023;210(5):558–567.
- Rudofsky UH, Lawrence DA. New Zealand mixed mice: a genetic systemic lupus erythematosus model for assessing environmental effects. Environ Health Perspect. 1999;107(Suppl 5):713–21.