
 ?Mathematical formulae have been encoded as MathML and are displayed in this HTML version using MathJax in order to improve their display. Uncheck the box to turn MathJax off. This feature requires Javascript. Click on a formula to zoom.
Abstract
Pathogenic bacteria in drinking-water pose a health risk to consumers, as they compromise the quality of portable water. Chemical disinfection of water containing dissolved organic matter (DOM) causes harmful disinfection by-products. In this work, 4-hydroxybenzoic acid (4-HBA) blended polyethersulfone membranes were fabricated and characterised using microscopic and spectroscopic techniques. The membranes were evaluated for the removal of bacteria and DOM from synthetic and environmental water. Permeate flux increased from 287.30 to 374.60 l m−2 h−1 at 3 bars when 4-HBA increased from 0 to 1.5 wt.%, suggesting that 4-HBA influenced the membrane’s affinity for water. Furthermore, 4-HBA demonstrated antimicrobial properties by inhibiting bacterial growth. The membrane with 1 wt.% 4-HBA recorded 99.4 and 100% bacteria removal in synthetic and environmental water, respectively. Additionally, DOM removal of 55–73% was achieved. A flux recovery ratio (FRR) of 94.6% was obtained when a mixture of bacteria and humic acid was filtered, implying better fouling layer reversibility during cleaning. Furthermore, 100% FRR was achieved when a multimedia granular filtration step was installed prior to membrane filtration. The results illustrated that the membranes had a high permeate flux with low irreversible fouling. This indicated the potential of the membranes in treating complex feed streams using simple cleaning protocols.
Introduction
Bacterial contamination has been one of the causes of the deterioration of surface water quality (Kokkinos et al. Citation2020). Activities occurring in the vicinity of freshwater sources contribute to water contamination with pathogenic bacteria (Shao et al. Citation2022). Pathogenic bacteria found in water contribute significantly to water-borne diseases such as diarrhoea, typhoid and cholera (Fahimirad et al. Citation2020). The most common types of bacteria found in water include Escherichia coli (E. coli) and faecal coliforms (Syngouna and Vantarakis Citation2021). Their presence in water indicates contamination with human and animal faecal matter (Barzin et al. Citation2018).
Drinking-water disinfection is one of the crucial steps in water treatment, which is specifically intended to remove pathogenic bacteria. However, disinfection residues (chlorine residues) may combine with dissolved organic matter (DOM) present in water to form harmful disinfection by-products (DBPs) such as halo-acetic acids, trihalomethanes and bromate-associated DBPs (Marais et al. Citation2019; Petronijević et al. Citation2019; Sambo et al. Citation2020; Medgyesi et al. Citation2022). In addition, DOM causes undesirable bacterial re-growth in drinking-water supply pipelines because it serves as a food source for pathogens (Abhijith et al. Citation2021). The re-growth of bacteria causes the buildup of biofilms on the walls of distribution pipelines and eventually compromises the final water quality (Chan et al. Citation2019; Ghernaout Citation2020). All these challenges require solutions that are realistic and sustainable.
Membranes are amongst the most efficient separation processes that can be used as a complementary step to conventional water treatment. This is due to high solute retention (Du et al. Citation2020). However, biofouling that results from the accumulation of bacteria on the membrane surface remains a critical problem in membrane application (Chan et al. Citation2019). Therefore, efforts in biofouling control have been studied by various researchers to understand its occurrence and mitigation strategies. The interaction between extracellular polymeric substance (EPS) and membrane surface in the formation of biofilm on nanofiltration membranes was investigated by Cabrera et al. (Citation2022), using various carbon sources. Biofouling was mostly observed in the inlet zone owing to the high concentration of biodegradable organic matter, which enhanced microbial growth (Cabrera et al. Citation2022). It was also found that when acetate was used as the sole carbon source, it promoted faster biofilm formation on the membranes (Cabrera et al. Citation2022). However, high EPS was produced, resulting in a faster pressure drop than when a mixture of the carbon sources was used (Cabrera et al. Citation2022). EPS has both hydrophilic and hydrophobic properties, enabling it to adhere to hydrophilic and hydrophobic surfaces (Bachosz et al. Citation2022). Also, polysaccharides of EPS have been reported to have a stronger adsorbing affinity to high-pressure-driven membranes, such as nanofiltration (NF) and reverse osmosis (RO), than other proteins (Cabrera et al. Citation2022). In addition to using EPS, a quorum sensing system can also be utilized, where by interactions between bacterial communities with low and high fouling properties have proven to mitigate biofouling through cell-to-cell interactions (Maddela and Torres Citation2021).
Biofouling is difficult to reverse, so controlling it in the early stages is of paramount importance (Takimoto et al. Citation2023). Membrane biofouling can be reversed by physical cleaning through backwash or chemical cleaning using reagents such as sodium hypochlorite (NaOCl), which easily detaches bacterial cells from the membrane surface (Wang et al. Citation2020; Gao et al. Citation2022). Sodium hydroxide (NaOH) and air-backwash were successful in the removal of biofouling in membrane distillation (Harimawan et al. Citation2022); however, frequent air-backwash resulted in rapid membrane disruption, reducing the membrane’s life span and increasing the maintenance or replacement costs (Harimawan et al. Citation2022). In another study where chlorinated water was used to backwash ultrafiltration (UF) membranes fouled with EPS, whereby its concentration on the surface decreased by 7.7% and the soluble organic matter decreased by 12.0% (Shao et al. Citation2018).
Improved membrane hydrophilicity can also enhance anti-fouling properties while improving membrane permeability (Karimipour et al. Citation2021). Nanocellulose, which is a cost-effective and renewable organic polymer, can improve the hydrophilic properties of polymeric membranes owing to the plentiful presence of hydroxyl groups in its structure (Balcik-Canbolat and Van der Bruggen Citation2020; Pöhler et al. Citation2022). Apart from nanocellulose, 4-hydroxybenzoic acid (4-HBA) has also been reported to improve membrane permeability (Mamba et al. 2022). Other than membrane-hydrophilicity enhancement, 4-HBA has also been reported to possess antimicrobial activity, inhibiting the growth of most bacteria and yeast owing to the presence of peroxyl radical-scavenging substances (Kumar and Chandra Citation2020).
To date, there have been several studies on biofouling of RO, NF and UF membranes during the treatment of seawater, municipal wastewater and industrial wastewater (Barzin et al. Citation2018; Li et al. Citation2020; Banti et al. Citation2021; Hoek et al. Citation2022; Rho et al. Citation2022; Karamad Yazdanabad et al. Citation2023). To advance on the already generated insights, there is a need to evaluate the interaction between pathogenic bacteria with organic matter in surface water and the biofilm formation mechanisms during low-pressure processes such as microfiltration (MF). Furthermore, it is highly important to investigate the fundamental processes of biofilm reversibility. Microfiltration may not be efficient in the removal of organics and other pollutants from water but sufficient in bacterial removal (Barzin et al. Citation2018).
Therefore, this study reports on the interaction between pathogenic bacteria and DOM in biofilm formation and the performance of blended MF membranes in treating real water from a recreational lake in Johannesburg, South Africa. In addition, the study aimed to determine the membrane’s fouling behaviour and propensity after chemical cleaning (0.1% NaOCl) and ultrasonication. Furthermore, the antimicrobial properties of 4-HBA were evaluated by monitoring the growth of bacteria in nutrient agar.
Materials and methods
Chemicals and water samples
All chemicals and reagents used in this study were of analytical grade and used without further purification. Nanocellulose (NC), N,N-dimethylacetamide (DMAc), polyethylene glycol (PEG), polyether sulfone (PES), 4-hydroxybenzoic acid (4-HBA), hydrochloric acid (HCL), sodium hydroxide (NaOH,), sodium hypochlorous (NaOCl), sodium chloride (NaCl) and biolab nutrient agar were supplied by Merck, (Johannesburg, South Africa). Water samples were collected from Florida Lake (26.1739° S, 27.8971° E) in sterile Duran sampling bottles.
Dope solution preparation and membrane casting
The membrane preparation procedure was adopted from our previous work (Mamba et al. Citation2022), and various membranes were prepared via the phase-inversion method by blending PES and nanocellulose. The dope composition comprised 17 wt.% PES, 20 wt.% PEG, 63 wt.% DMAc and varying the content of nanocellulose from 0 to 3 wt.%. The best-performing membrane containing 2.5 wt.% nanocellulose was selected and further investigated in this study for the preparation of 4-HBA-based membranes. The additive (4-HBA) was incorporated to further improve membrane hydrophilicity and as an antimicrobial agent. presents the different compositions of the membranes prepared in this study. The membrane composition was designed using the plus method as previously reported by Zhang et al. (Citation2017). The polymer was dried in a heating drying oven (DHG-9030A series drying oven, Ningbo, China) at 60 °C overnight to remove moisture before use, and a desired portion of PES, nanocellulose, PEG (pore-former) and 4-HBA was homogenously mixed for a minimum of 12 h in DMAc. The homogenous dope solution was kept overnight to degas followed by casting on a glass plate using a casting knife with a 0.15 µm thickness. The cast solution was then immediately immersed in a coagulation bath containing deionised water for about 10 s until phase separation occurred. The prepared membranes were kept in deionised water to remove any residual solvent from the membrane matrix before their characterisation and evaluation.
Table 1. Compositions of the membranes prepared in this study.
Membrane characterisation
Membrane surface wettability
The surface hydrophilicity of the prepared membranes was determined by measuring the water contact angle using a sessile drop method in a DSA30 drop shape analyser (Kruss GmbH, Hamburg, Germany) (Tshindane et al. Citation2023). The membrane samples were dried at 40 °C for 24 h prior to analysis. The membranes were then mounted on a glass slide using a double-sided tape, a minimum of 10 droplets were taken, and the average angles were recorded.
Scanning electron microscope (SEM) characterisation
The surface and cross-sectional structural changes in prepared membranes were examined under an SEM (JSM-IT300 Joel, Tokyo, Japan) (Urducea et al. Citation2020). The membranes were dried at 40 °C before use and then fractured using liquid nitrogen for cross-sectional examination. All samples were coated with a 5 nm gold layer before examination with SEM.
Pure water flux (PWF) measurements
The performance of the membranes in terms of permeation flux was determined by measuring PWF in duplicates using a dead-end filtration system with an effective membrane area of 0.00126 m2. Circular membrane samples were cut according to the cell surface area and compacted for 30 min using deionised water at a pressure of 1.5 bar using nitrogen gas to obtain a stable water flux. The PWF was calculated using EquationEquation (1)(1)
(1) .
(1)
(1)
Where Jw is the PWF (l m−2 h−1), V is the volume of permeate (litres), A is the effective membrane area (m2), and t is the permeation time (hours) (Mamba et al. Citation2022).
Water sampling and physicochemical analysis
The water samples were collected in 1-litre Duran sterile (autoclaved) glass bottles from Florida Lake, Gauteng province, South Africa (26.1739° S, 27.8971° E). The samples were transported back to the iNanoWS laboratory and kept at 4 °C for microbiological assay contamination and physicochemical characterisation before filtration. The water pH, electrical conductivity and turbidity were analysed using the Lovibond water testing tintometer group, Eutech instruments Cond 700 conductivity meter and Extech instruments turbidity meter TB400, respectively. The samples were stored at 4 °C when not in use.
Filtration tests for bacterial removal
Evaluation with synthetic water
The prepared membranes were also evaluated for the removal of bacteria using synthetic water samples prepared by spiking sterile deionised water with a prepared bacterial suspension following the protocol described elsewhere by Barzin et al. (Citation2018). Environmental water samples (25 ml) with bacteria were inoculated into 250 ml of sterile nutrient broth and incubated in a shaking incubator (353 orbital shaking incubator, Scientific Instruments, Johannesburg, South Africa) for 24 h at 37 °C and at a shaking speed of 150 rpm. The growth of bacterial cells was visually observed by the changes in the turbidity of the nutrient broth (Rehman et al. Citation2020). Thereafter, 50 ml (10% dilution) of the bacterial enriched culture was inoculated into 500 ml of sterile deionised water, and 0.9% sodium chloride was added. Prior to filtration, the stability of the membrane’s permeation was confirmed by pressurising deionised water through the membranes at 1.5 bar and then passing a volume of the prepared bacterial suspension solution through the membranes using a sterile dead-end filtration unit at 1 bar for 30-, 60- and 90-min filtration times. This was performed to evaluate the membrane-removal efficiency over 90 min.
The estimated concentration of bacteria in the suspension was calculated using EquationEquation (2)(2)
(2) , according to the 0.5 McFarland turbidity scale in which a 0.1 optical absorbance at 600 nm equates to a concentration of 108 CFU/ml (Syngouna and Vantarakis Citation2021). Thereafter, the reduction rate of bacterial cell culture in CFU (%) was calculated using EquationEquation (3)
(3)
(3) , by measuring the absorbance at 600 nm wavelength using an ultraviolet visible spectrophotometer (Lambda 650S PerkinElmer, Waltham, Massachusetts, USA) in a 1 cm quartz cuvette.
(2)
(2)
(3)
(3)
whereby CFU is the bacterial colony-forming unit, and B and A are the bacterial cell culture absorbances at 600 nm before and after filtration (Syngouna and Vantarakis Citation2021).
Filtration of environmental water samples
The removal efficiency of bacteria by the prepared membranes was also evaluated by passing a desired volume of lake water sample through a sterile dead-end filtration unit at 0.5 bar for 15 min (Zhang et al. Citation2018). The water sample had the following physicochemical properties: pH 7.49 ± 0.02; turbidity 12.28 ± 0.36 NTU; and electrical conductivity 0.58 mS/m ± 0.03. The high turbidity denotes a high concentration of organic matter present in the water sample. Before filtration with environmental water samples, the membranes were compacted with deionised water to stabilise permeation (Ahmad and Mohamad Citation2017). The filtration test was carried out at room temperature in duplicates. Firstly, nutrient agar (Merck, Johannesburg, South Africa) was prepared by dissolving 31 g into 1 L deionised water and sterilised by autoclaving at 121 °C for 15 min at 1.5 bar. The nutrient agar was then cooled and poured into sterile petri plates for solidification before use. Thereafter, a volume of 100 μl of the feed and permeate solution was transferred into nutrient agar plates and distributed evenly over the surface by the spread plate technique using a sterile spreader. The inoculated plates were prepared in triplicates and placed in an incubator (Memmert IN55 incubator, Lasec, Johannesburg, South Africa) at 37 °C for 24 h to grow bacterial colonies. After incubation, the plates were taken out, and bacterial colonies were counted using a Stuart colony counter SC6+ (Lasec), and the colony-forming units (CFUs) were calculated using EquationEquation (4)(4)
(4) :
(4)
(4)
Filtration tests for organic matter removal
Filtration tests for organic matter were conducted using a dead-end filtration system at 0.5 bar. The concentration of dissolved organic carbon (DOC) was quantified using a Fusion UV/persulfate TOC analyser (Teledyne Tekmar, Mason, OH), and the absorbance before and after filtration was measured using a UV-Vis spectrophotometer (Lambda 650S Perkin Elmer, Shelton, CT) in a 1 cm quartz cuvette at wavelengths of 214, 254. 272 and 280 nm. Rejection for organic matter by the membranes was calculated using EquationEquation (5)(5)
(5) . The structural composition of DOM based on the excitation and emission wavelengths of the fluorophores within DOM was determined using a fluorescence excitation-emission matrix (FEEM) spectrometer (Aqualog®, HORIBA Scientific, Edison, NJ).
(5)
(5)
where R (%) is the solute rejection, Cf is the absorbance of the feed, and Cp is the absorbance of the permeate.
Determination of antimicrobial activity
The antimicrobial activity of 4-HBA in environmental samples was investigated using a standard plate count method described by Travnickova et al. (Citation2019). A volume of 100 μl environmental sample was pipetted into nutrient agar plates (in triplicates) prepared as described earlier; weighed amounts of 5, 10 and 15 mg of 4-HBA in powdered form were also transferred, and a blank without treatment was used as a control. A spread technique was used to distribute the water sample and 4-HBA powder evenly on nutrient agar using a sterile glass spreader. All plates were then incubated as described earlier, and the CFUs were calculated using EquationEquation (4)(4)
(4) .
Membrane fouling and cleaning experiments
The membrane resistance to fouling was assessed in terms of flux recovery ratio (FRR), which denotes the ability of a membrane to retain its original flux upon filtering a solution with foulants; the reversible fouling ratio (Rr), which results from a weak deposition of foulants on the membrane surface and can be easily removed by physical cleaning, and the irreversible fouling ratio (Rir), which is caused by pore clogging and adsorption of foulants on the membrane surface, in most cases can be overcome by chemical cleaning (Dadari et al. Citation2022). Four fouling experiments were conducted for 270 min at 1 bar: (1) The initial bacterial inoculum had an estimated 5.5 × 10⁶ CFU/ml and was used as a bacterial synthetic solution to evaluate the membrane’s ability to reduce the content of bacteria in bacterial suspension solution; (2) a mixture of bacterial synthetic water and 30 mg l–1 humic acid (DOM surrogate) adjusted to neutral pH using HCl and NaOH was used to understand the interaction between bacteria and DOM in membrane biofouling; (3) unfiltered environmental water samples that comprised particulate, suspended, colloidal and organic matter were used to determine the extent of colloidal and organic fouling on the membrane surface; (4) a multimedia granular filtered environmental water sample was used as feed to evaluate the influence of a multimedia granular filter in membrane flux recovery enhancement.
Before the filtration experiments, the membrane (M-1HBA) that recorded high bacterial removal was selected and compacted with deionised water for 30 min at 1.5 bar using a dead-end filtration system. This was followed by PWF measurements, cleaning cycles and, thereafter, fouling experiments. Permeate flux was collected every 30 min (synthetic water samples) and 10 min (environmental water samples) of filtration. The fouled membrane’s performance in terms of flux recovery was evaluated by cleaning the membranes using chemical (0.1% NaOCl) and ultrasonic vibration methods (Aghapour et al. Citation2020; Wang et al. Citation2020). The membranes were cleaned after 90 and 180 min of filtration by incubation in 30 ml of 0.1% NaOCl for 20 min and an ultrasonic bath in 30 ml of deionised water using the sweeping method for 20 min at room temperature. The permeate fluxes before and after cleaning were calculated using EquationEquation (1)(1)
(1) , and the membrane fouling potential was investigated by calculating FRR (%), Rr (%) and Rir (%) using EquationEquations (6)
(6)
(6) , Equation(7)
(7)
(7) and Equation(8)
(8)
(8) , respectively.
(6)
(6)
(7)
(7)
(8)
(8)
where
is the permeate flux after 30 min,
is the permeate flux after 120 min, and
is the permeate flux after 270 min of filtration.
Statistical comparison
Some of the data obtained in this study were statistically compared with analysis of variance (ANOVA), one-way ANOVA with a significance level at p < 0.05 using Origin Pro graphing and analysis 2021 version (Fattahi et al. Citation2021).
Results and discussion
Membrane surface wettability
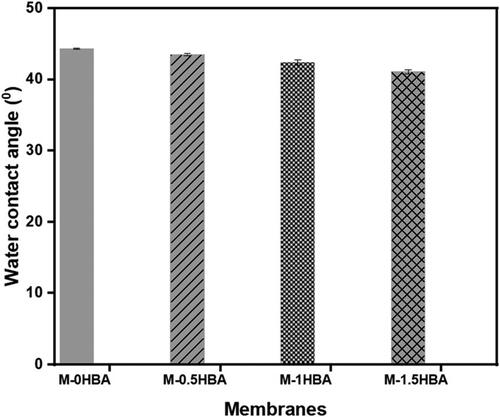
The measured water contact angle for all the membranes is presented in . Generally, the membranes exhibited a hydrophilic surface with measured water contact angles less than 50°. This means that nanocellulose had an influence on improving the surface hydrophilicity of PES owing to the presence of carboxyl and hydroxyl groups in its structure (Wang et al. Citation2018). It was observed that the water contact angles slightly decreased with the increase in 4-HBA content. The water contact angle decreased from 45° to 41° for M-0HBA and M-1.5HBA (p > 0.05), respectively. The further decrease in contact angles indicates an improvement in the surface hydrophilicity of the membranes owing to the presence of 4-HBA. This further confirms the availability of hydroxyl groups that are also present in 4-HBA that improved the membrane surface’s affinity towards water. Studies by Nady et al. (Citation2012) and Mamba et al. (Citation2022) also reported an increase in PES surface hydrophilicity when 4-HBA was used as an additive to enhance covalent bonding between PES membrane and enzyme laccase. The increased surface hydrophilicity suggests that the membrane will have a high affinity for water resulting in a hydration boundary layer that will lower the adhesion of hydrophobic solutes and subsequently reduce membrane fouling (Jaffar et al. Citation2022; Pöhler et al. Citation2022). Also, this makes the membrane ideal for its intended purpose of rejecting microbes in water.
Figure 1. Measured water contact angles on the membrane surface as a function of 4-HBA content.
Membrane morphological studies
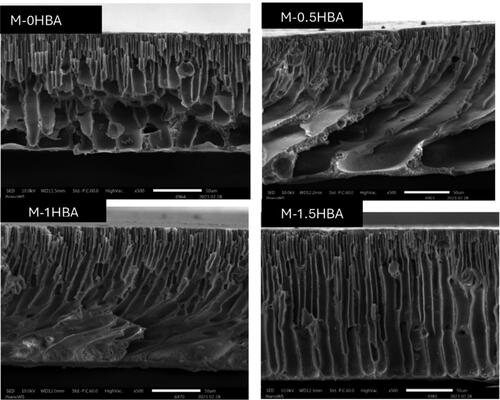
The membranes were examined under an SEM to understand their cross-sectional structure and potentially predict water transfer across it. The cross-section SEM images displayed in showed a finger-like macrovoid structure displaying longer and larger macrovoids from the top to the bottom layer, suggesting that the membrane has less resistance to water percolation. The addition of 4-HBA did not have an excessive influence on the structure of the membranes. It was, however, noted that 4-HBA influenced the surface roughness of the membranes. The increased content of 4-HBA from 0 to 1.5 wt.% in the dope solution increased the membrane surface roughness from 25.68 nm to 43.41 nm, as displayed in the 3D images in Figure S1 in the supplementary section. This is due to the high topological polar surface area (57.53 Å2) in 4-HBA, which promoted the increase in surface roughness of the membranes (Singh and Kumawat Citation2012).
Figure 2. Cross-sectional SEM images of 4-HBA incorporated membranes.
Membrane-permeability measurements
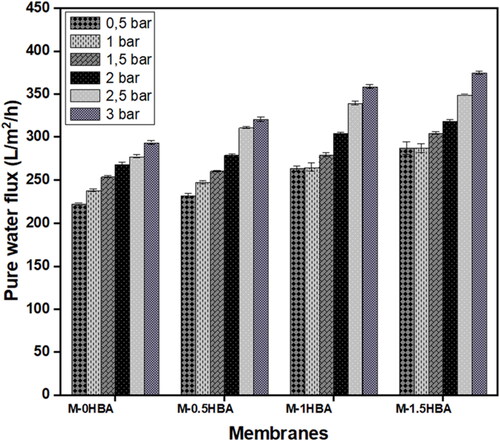
PWF measurements were used to determine the permeation rates of the prepared membrane variants. The PWF for all investigated membranes at different applied pressures is depicted in . The results showed an increase in PWF as the 4-HBA content increased from 0 wt.% to 1.5 wt.% in the dope solution. The high PWF revealed in this work may be because the fabricated membranes are highly porous owing to the presence of large macrovoids as indicated by SEM images in , demonstrating free passage of water through the membrane pores (Tshindane et al. Citation2023). The base membrane M-0HBA showed the lowest PWF 222.22 l m−2 h−1 at 0.5 bar and 287.30 l m−2 h−1 at 3 bars. The highest PWF was obtained from M-1.5HBA membrane 293.65 l m−2 h−1 at 0.5 bar and 374.60 l m−2 h−1 at 3 bars (p < 0.05), which indicated significant differences between the membranes when the transmembrane pressure increased. The enhancement in the PWF of the membranes was also induced by the presence of hydroxyl groups in 4-HBA. The permeability results are in agreement with the contact angle results in because the PWF increased with a reduction in the contact angles, which further confirms the high surface hydrophilicity.
Figure 3. Pure water flux at different transmembrane pressures for all the membranes studied.
Evaluation of membrane performance using synthetic water
The membranes were also evaluated for bacterial removal efficiency in synthetic water at different time intervals. Synthetic water was spiked with an environmental water sample that contained different types of bacteria. In , the concentration of bacteria in terms of absorbance at 600 nm decreased with increasing filtration time. Membrane M-1HBA performed better than the other membranes in removing bacteria from synthetic solution as the absorbance declined by 6.1% after 90 min of filtration. The reported decrease in bacterial concentration after membrane filtration could probably be attributed to the deposition of the bacterial cake layer forming a biofilm on the surface of the membranes, resulting in a high degree of removal. The performance of the membranes in terms of removal efficiency and permeate flux is presented in . The highest removal percentage of 99.4% was obtained from M-1HBA, and the lowest 97.4% from M-0HBA (). The base membrane M-0HBA had a low removal percentage and permeation compared to 4-HBA incorporated membranes. This confirmed that size exclusion was not the only mechanism, since 4-HBA blended membranes had a high degree of bacterial removal and high permeation flux. However, increasing the filtration time further reduced permeation while improving bacterial removal, which corresponds to the reduction in bacterial concentration in terms of absorbance over time, as shown in . This resulted from the deposition of bacterial cells on the surface of the membranes blocking the pores, as shown in the SEM images in , and forming a secondary selective layer.
Figure 4. Reduction in bacterial concentration in terms of absorbance at 600 nm before and after membrane filtration over 90 min.
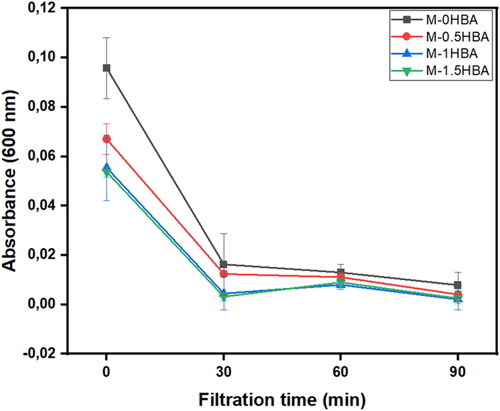
Figure 5. (a) Membrane efficiency in removing bacteria over time, (b) bacterial synthetic water permeate flux, (c) membrane M-1HBA before filtration, (d) M-1HBA after filtration and (e) M-1HBA after cleaning.
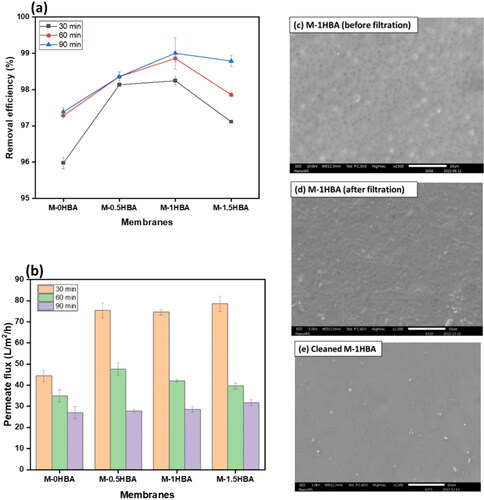
Before filtration, the membrane surface was clear with visible pores (), and after physical cleaning by ultrasonication for 20 min, few bacterial cells were observed (), indicating the effectiveness of the cleaning method in removing the biofilm on the membrane surface. Overall, the addition of 4-HBA in the dope solution contributed to the membrane-removal efficiency.
Evaluation of membrane performance with environmental water samples
Bacterial removal efficiency
The performance of the membranes in removing bacteria from real water samples is reported in . In these results, membrane M-1.5HBA recorded the highest permeate flux of 153.97 l m−2 h−1, which correlates with the results obtained in , as this membrane had the highest PWF. However, the permeate flux obtained was 50% lower than those reported in . The reduction in permeate flux indicates rapid blocking of the membrane pores caused by the presence of suspended matter, algae and microbiological contaminants in the real water samples (Alsawaftah et al. Citation2021), as shown by the fouled membranes SEM images in Figure S2 in the supplementary section. Approximately 2,327.5 ± 1.208 CFU ml−1 in the feed water and 0 CFU ml−1 were observed from the filtrates. The results indicate 100% bacterial removal performance by all the membranes, as shown by 0 colonies on the agar plates after filtration and as indicated in . The fouled membrane SEM and bacterial images before and after filtration are presented in the supplementary section in Figure S2. Generally, bacteria are too large to pass through membrane pores (Maddela and Torres Citation2021); however, the filtration experiments in the previous section revealed that a synthetic solution of the same bacteria extensively accumulated on the membrane surface and eventually permeated through the membrane. This can be attributed to the fact that the bacterial cells were accumulated, and few cells were able to pass through. In this current experiment, complete removal of the bacteria was achieved owing to the presence of other organic macromolecules that led to a dense biofilm.
Table 2. Membrane performance removal of bacteria from environmental water samples in nutrient agar.
DOM removal from environmental water samples
The membranes were also evaluated for the removal of DOM in real water samples analysed using ultraviolet absorbance. It is reported that the wavelength range at 214 nm denotes the presence of nitrites and nitrates, 254 nm represents the aromaticity of DOM, 272 nm indicates the presence of DBPs, and 280 nm implies the presence of protein-like substances in water (Chaukura et al. Citation2021; Setareh et al. Citation2021). UV absorbances of the feed water and the membrane filtrates were measured at wavelengths of 200–300 nm to accommodate all the DOM fragments present in the water. The results in indicate that the levels of nitrites and nitrates are relatively high in lake water compared to the other fractions. Also, a reduction in all UV absorbances after filtration was observed, which means that the membranes were efficient in removing some fractions of DOM from the feed water sample. shows the removal efficiency of DOM in terms of UV absorbance at 214, 254, 272 and 280 nm as a representation of DOM found in water. The removal efficiency of DOM present was calculated using EquationEquation (5)(5)
(5) . The results showed a high removal efficiency of 73% in removing nitrites and nitrates, followed by 60% removal of the aromatic portion of DOM present in the water using membrane M-0.5HBA, and the 10% lowest removal was found to be the protein-like substances from the same membrane. It can also be noted that the aromaticity of DOM removal was constant, ranging from 55% to 60% in some of the membranes except M-1.5HBA, which reported 48%. The results obtained in this study showed that the addition of 4-HBA in the PES/NC dope solution had no impact on the removal of DOM from lake water. This means that size exclusion played a more major role in removing DOM than another removal mechanism. This is evident from the low removal efficiencies of DOM in membrane M-1.5HBA, since this particular membrane reported a high surface hydrophilicity and permeation flux as presented in when environmental water samples were filtered.
Figure 6. Removal efficiency of DOM in terms of UV absorbance nm using all the membranes investigated.
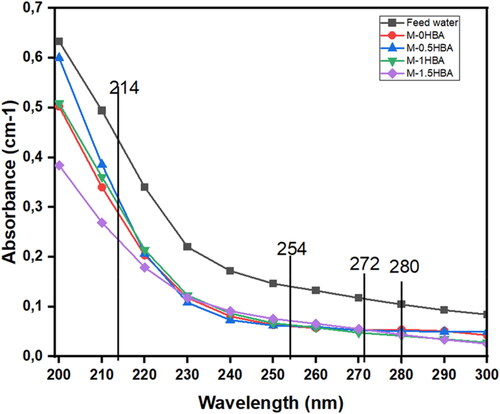
Table 3. Removal efficiency of DOM in terms of UV absorbance in feed water and membrane filtrates.
Fluorescence excitation-emission (FEEM) characterisation of DOM
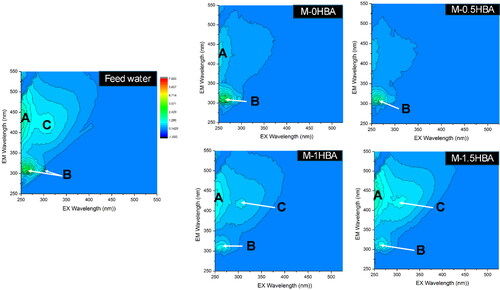
The feed water sample and filtrates were also characterised by excitation (Ex)/emission (Em) to analyse the characteristics of the membranes investigated in separating different types of DOM. The water samples were filtered through a 0.45 μm Whatman glass microfibre filter before measurement. The FEEM chromophores are shown in , and the environmental water sample had four categories of DOM, namely: tyrosine (peak B, Ex/Em = 275 nm/305 nm); tryptophan and protein-like (peak B, Ex/Em = 275 nm/340 nm); humic-like (peak C, Ex/Em = 320–360 nm/420–460 nm); and humic-like (peak A, Ex/Em = 260 nm/400–460 nm) (Coble et al. Citation2014)(Coble et al. Citation2014). After filtration, the results showed that various intensities of the fluorescence peaks changed, demonstrating that the content of several types of DOM had decreased. The content of humic-like fraction had the highest reduction of 76%, as shown by the decrease in peak intensities compared to the other fractions of DOM detected in the water sample. The results indicated that membrane M-0HBA was able to remove the tryptophan-like (peak B) and the humic-like (peak C) fraction of DOM. Membrane M-0.5HBA was efficient in removing all the fractions present in the water sample except for the tryptophan-like fraction. Membrane M-1HBA and M-1.5HBA were only efficient in removing the tryptophan-like fraction of DOM. This shows that the membranes had a high retention rate for the humic-like fraction of DOM as compared to the other fractions present in the water. In a similar study, a humic-like fraction of DOM was also removed better than other DOM fractions from surface water using ceramic membranes in a study by Moyo et al. (Citation2021). These results correlate well with the UV254 nm removal percentage in , which also means that DOM removal was due to size exclusion, since the microvoids of the membranes were large, as shown in .
Figure 7. FEEM chromophores detected before and after filtration using the prepared membranes.
Investigating the antimicrobial activity of 4-hydroxybenzoic acid (4-HBA)
Analysis of bacterial growth on nutrient agar to determine the antimicrobial activity of 4-HBA was carried out using a standard plate count method (Zhang et al. Citation2018). presents images of bacterial colony growth in 4-HBA treated and untreated agar plates after 24 h of incubation at 37 °C. The results in show a high degree of bacterial growth of about 2050 CFU/ml on the untreated agar plate, as compared to the 4-HBA-treated agar plates. As shown in , the bacterial count of the treated water sample was lower than that of untreated water, and the loading of 5 mg 4-HBA resulted in 1905 CFU ml−1, a 7% reduction, whereas when 10 mg and 15 mg were added, 1280 and 235 CFU ml−1 were obtained, respectively, indicating a 38% and 89% reduction. The results demonstrated that 4-HBA showed antibacterial activity, as it was efficient in bacterial growth inhibition at high amounts, which is in agreement with the findings by Cho et al. (Citation1998). The results revealed that membranes incorporated with 4-HBA can be used in water treatment because it has the potential to reduce biofilm formation in membrane filtration by inhibiting the growth of bacteria on the membrane surface.
Figure 8. Bacterial colony growth on 4-HBA treated and untreated water samples; (a) untreated, (b) 5 mg, (c) 10 mg and (d) 15 mg 4-HBA treated water samples.
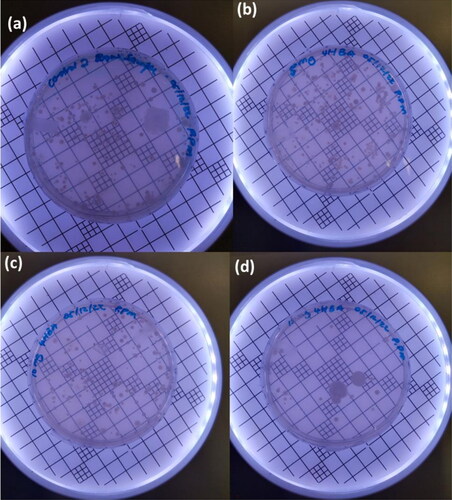
Table 4. Bacterial count and reduction percentage for 4-HBA antimicrobial efficiency determination.
Effect of membrane cleaning methods and permeate flux recovery using synthetic water
The membranes were fouled in three cycles, and each fouling run was followed by cleaning to determine the anti-fouling properties and effect of cleaning strategies (chemical cleaning with 0.1% NaOCl and physical cleaning using ultrasonication). The observed flux decline and recovery trends are presented in using different feed streams, one with (a) a bacterial suspension containing an estimated 5.5 × 10⁶ CFU ml−1 bacterial concentration, and the other (b) with a mixture of a bacterial suspension and 30 mg l−1 humic acid (HA). The results showed a flux decline that followed the same pattern for both feed streams, which is reasonable because the same membrane was used. Even though the flux-decline pattern was similar, the recovery rate was different. The exact FRR and fouling mechanisms are further illustrated in , which shows 80.3% and 81.1% flux recovery after chemical and physical cleaning, respectively, from the first cleaning cycle (p > 0.05). The FRR then decreased to 77.7% and 79.7% for chemical and physical cleaning, respectively, in the second cleaning cycle (p > 0.05), which means the results were not significantly different. Overall, the cleaning methods were unable to recover the initial flux owing to fouling caused by the accumulation of bacterial cells on the surface and within the pores of the membranes. The high initial fouling rate of the membranes can also be correlated to the high surface roughness presented in Figure S1 in the supplementary section because rougher surfaces tend to attract foulants on the cavities, causing a reduction in permeate flux (Horseman et al. Citation2021). The major fouling ratio observed was reversible fouling in both cleaning cycles, which increased from 55.4% in the first cleaning cycle to 57.4% in the second cleaning cycle (p > 0.05). This indicates that the membrane had better anti-fouling performance, and the bacterial layer was loose and could be easily removed by both cleaning methods.
Figure 9. Normalised flux for chemical and ultrasonic cleaning methods over 270 min of filtration: (a) bacterial suspension and (b) a mixture of bacteria cells and HA.
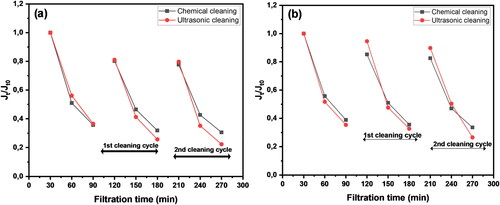
Table 5. Effect of membrane cleaning on flux recovery and reversible and irreversible fouling ratios.
A similar flux decline pattern was also observed when a mixture of bacteria and HA was used as foulants. The results are shown in , demonstrating a flux reduction for both cleaning cycles. However, better recovery ratios were observed with 85.2% and 94.6% in chemical and physical cleaning, respectively, than when bacterial suspension was used (p > 0.05). This was also observed in the second cycle, as after chemical cleaning, 82.6% was achieved, and 89.8% after physical cleaning was observed. This is because there is no interaction between the mixture of the foulants, which makes it easier to dislodge the fouling layer from the surface of the membranes than when bacteria were used as a single foulant. Moreover, DOM has a low molecular weight compared to bacteria, and so DOM will deposit on the membrane surface first, followed by bacterial adherence, and will eventually form a microbial bio-layer on the membrane surface (Zhang et al. Citation2022). This makes it easy to dislodge the biofilm layer because it is not attached to the membrane surface; hence higher recovery ratios were observed. This is interesting because the membrane will perform well in real-water filtration owing to the complexity of the matrix in surface water, making it easy to remove complex fouling layers.
Based on the obtained results, the physical cleaning method performed better than the chemical cleaning method. This was further validated by the SEM analysis of the fouled and cleaned membranes, and it was confirmed that the fouling mechanism of the membrane was cake formation on the surface and pore blocking, as illustrated in Figure S3 in the supplementary section. Moreover, the attained performance and characterisation results illustrated that the membrane retained its structural integrity after two cleaning cycles, which was a good indication of the membrane’s stability. Most researchers opt for both chemical and physical cleaning strategies for the complete removal of foulants; for instance, Gomes et al. (Citation2018) used a combination of 175 mg l–1 NaOCl and mechanical shear force to achieve 93% biofilm removal. However, in membrane filtration for water treatment, the physical cleaning method is most suitable, since no chemicals are used, as the addition of chemicals can influence the membrane material and reduce the membrane’s lifespan. Since the permeate flux could be recovered to this degree in such a short cleaning time, it could perform better at elongated times. However, this would not be ideal for operational costs, as a high operational pressure would be required.
Effect of cleaning methods on unfiltered and sand-filtered environmental water samples
Permeate flux recovery
A multimedia granular filtration step was installed before the membrane to determine its impact on membrane fouling behaviour using real water samples. The permeate flux results are illustrated in , (a) unfiltered water samples and (b) sand-filtered water samples. Before sand filtration, the permeate flux slightly decreased by 51% after 60 min of raw water filtration, which followed a similar trend in the second cleaning cycle. This was due to the deposition of suspended solids, colloidal and organic matter forming a cake layer on the membrane surface. However, a flux recovery of 98% for both cleaning methods was achieved from the first cleaning cycle, which slightly declined to 96% in the second cleaning cycle, as presented in . The FRR between the first and second cleaning cycles showed no significant differences (p > 0.05). This suggests that the membrane has excellent anti-fouling behaviour and shows the effectiveness of the cleaning methods in removing the fouling layer from the membrane surface.
Figure 10. Normalised flux for chemical and ultrasonic cleaning methods over 270 min of filtration: (a) unfiltered real water sample and (b) sand-filtered real water sample.
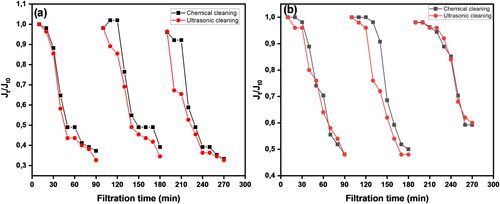
Table 6. Effect of membrane cleaning on flux recovery and reversible and irreversible fouling ratios using environmental water samples.
In the second experiment when a multimedia granular filter was used as a pre-treatment step before membrane filtration, a flux decline of 35% was observed after 60 min of filtration (), and 100% permeate flux recovery was achieved from both cleaning methods in addition to 98% flux recovery from the second cleaning cycle, as shown in . This signifies the effectiveness of the multimedia granular filter as the pre-treatment step in removing suspended solids and colloidal matter from water samples before membrane filtration. Similar findings were reported in a study by Xu et al. (Citation2020) when surface water was filtered through an ultrafiltration membrane. The obtained results in this work suggest that a multimedia granular filter can be used as a pre-treatment step prior to membrane filtration, which will not only enhance anti-fouling performance but also improve the membrane lifespan.
DOC removal from environmental water
The impact of the multimedia granular filter was also investigated for organic matter removal in terms of DOC, and the concentrations for the raw unfiltered and sand-filtered water were found to be 4.31 and 3.45 mg l−1, respectively. This implies that the multimedia granular filter only removed 20% of the organic carbon and mostly removed the suspended and colloidal particles present in the water. The membrane M-1HBA was then evaluated for the removal of DOC in sand-filtered water while determining the efficiency of chemical and ultrasonication cleaning strategies.
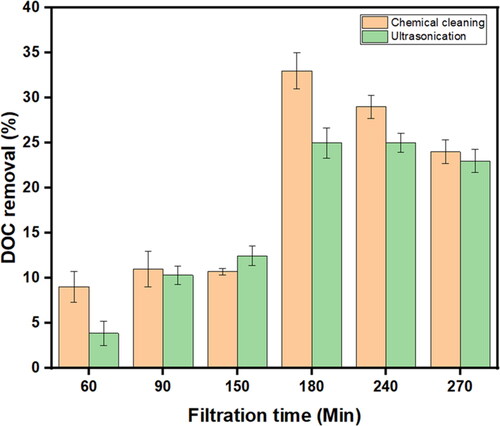
To determine the influence of membrane cleaning on DOC removal efficiency, 0.1% NaOCl and ultrasonication were used by incubating the fouled membranes for 20 min and the DOC rejection after membrane cleaning, as shown in . The results demonstrated poor DOC removal efficiency, as less than 50% was achieved. The highest DOC removal efficiency was 33% achieved after chemical cleaning with a filtration run of 180 min, and the lowest was 3.9% obtained after ultrasonication with a filtration run for 60 min (). Furthermore, there were no significant differences noted after chemical and ultrasonication cleaning on the membranes (p > 0.05). The low DOC rejection was expected, owing to the presence of larger membrane pores, as shown in the SEM cross-section images in . This means that DOM was able to pass through the larger pores of the membrane via size exclusion. However, DOC removal improved from 9.03% to 33% after chemical cleaning, and from 3.85% to 25% after ultrasonication. This suggests that possibly as a result of intermediate pore blocking, organic fouling occurred, reducing the pore sizes of the membrane even further, hence the improved removal efficiency over time. This means that the membrane-cleaning methods were not that efficient in removing the organic fouling layer from the membrane pores, which contradicts the results obtained in .
Figure 11. DOC removal efficiency from sand-filtered water after chemical cleaning and ultrasonication.
Similar results were obtained when ultrafiltration membranes were applied to remove turbidity and DOC in raw surface water and coagulated water in a study by Huang et al. (Citation2020). The membrane was efficient in removing approximately 98.9% turbidity but inefficient in removing DOC, as the highest removal was 8.4% in coagulated water (Huang et al. Citation2020). Huang et al. concluded that suspended particles were the main membrane foulants rather than organic matter. Also, in a recent study by Lee et al. (Citation2023), 8.3% DOC was removed from surface water using hollow-fibre ultrafiltration membranes, owing to size exclusion because the pore size of the fibres was 0.1 µm, which is larger than the molecular weight of DOM (Lee et al. Citation2023). Although the membranes were efficient in removing bacteria from water in the current study, DOM was not efficiently removed. However, the investigated membrane performed better in removing organics from surface water than the above-mentioned previous studies. To further enhance DOC removal, modification of the membrane surface with biocatalytic agents such as ligninolytic enzymes is recommended to extend the degradation of DOM into simpler portions before filtration.
Conclusion
The major findings from this study were the successful preparation of an ideal membrane that can be used to remove bacteria and organic matter from surface water.
The incorporation of nanocellulose into PES polymer improved the surface hydrophilicity of the membranes, and the addition of 4-HBA further enhanced the surface hydrophilicity and water permeation. The addition of 4-HBA not only improved water permeation but showed bacterial growth inhibition in nutrient agar inoculated with environmental water samples. The studied membrane makes it ideal for application in water treatment because the major requirement for water filtration in membranes is the complete reduction of bacteria from water.
The membranes investigated were able to remove the humic-like fraction of DOM, which suggests that the removal mechanism was due to size exclusion, as the membranes were inefficient in removing the smaller fractions of DOM. Therefore, future work on membrane modification with catalytic agents is recommended to degrade the DOM into smaller metabolites before filtration. This will further improve the removal efficiency of DOM from water.
The membrane-fouling propensity and reversibility showed that fouling occurred because the membranes could not retain the initial PWF after cleaning; however, because of the low degree of irreversible fouling, the fouling layer was easily dislodged from the membrane surface, resulting in high flux recovery ratios. The pre-treatment step using a multimedia granular filter improved the anti-fouling performance of the membrane, as 100% initial water flux was recovered. This suggests that the multimedia granular filter can be installed before membrane filtration in water treatment to remove major foulants in raw water before membrane filtration.
Overall, it can be concluded that lake water is contaminated with pathogenic bacteria, and the membranes investigated were efficient in the removal of bacteria and the hydrophobic fraction of DOM from real water samples. Moreover, this study confirmed that 4-HBA-incorporated membranes can be used as an alternative to current disinfection methods limiting the use of chemical-based disinfectants in water treatment.
Author credit statement
Mamba PP conceptualised the study, performed experiments and wrote the first draft; Msagati TAM was responsible for supervision and review of the manuscript; Nkambule TTI was responsible for supervision, resources and review of the manuscript; Mamba BB was responsible for supervision and reviewed the manuscript; and Motsa MM conceptualised the study, reviewed manuscript drafts and was responsible for supervision and data generation.
Supplemental Material
Download PDF (648.1 KB)Acknowledgements
The authors would like to acknowledge the Institute for Nanotechnology and Water Sustainability (iNanoWS), the University of South Africa (Florida, Science campus), the Institute for the Development of Energy for African Sustainability and the College of Agriculture and Environmental Science for laboratory facilities and technical assistance in conducting the experimental work.
Disclosure statement
The authors have no conflicting interest to declare.
Additional information
Funding
References
- Abhijith GR, Kadinski L, Ostfeld A. 2021. Modeling bacterial regrowth and trihalomethane formation in water distribution systems. Water. 13:463. doi: 10.3390/w13040463.
- Aghapour A, Taghipour SA, Rahimpour A, Mollahosseini A, Tiraferri A. 2020. A Critical review on ultrasonic-assisted fouling control and cleaning of fouled membranes. Ultrasonics. 108:106228. doi: 10.1016/j.ultras.2020.106228.
- Ahmad AL, Mohamad ZHM. 2017. Effect of air gap distance on PES/PVA hollow fibre membrane's morphology and performance. J. Phys. Sci. 28:185–99. doi: 10.21315/jps2017.28.s1.12.
- Alsawaftah N, Abuwatfa W, Darwish N, Husseini G. 2021. A comprehensive review on membrane fouling: mathematical, modelling, prediction, diagnosis, and mitigation. Water. 13:1327. doi: 10.3390/w13091327.
- Bachosz K, Minh TV, Long DN, Jakub Z, Luong NN, Teofil J. 2022. Enzyme-based control of membrane biofouling for water and wastewater purification: a comprehensive review. Environ Technol Innov. 25:102106. doi: 10.1016/j.eti.2021.102106.
- Balcik-Canbolat C, Van der Bruggen B. 2020. Efficient removal of dyes from aqueous solution: the potential of cellulose nanocrystals to enhance PES nanocomposite membranes. Cellulose. 27:5255–5266. doi: 10.1007/s10570-020-03157-y.
- Banti DC, Mitrakas M, Samaras P. 2021. Membrane fouling controlled by adjustment of biological treatment parameters in step-aerating MBR. Membranes (Basel). 11:553. doi: 10.3390/membranes11080553.
- Barzin J, Safarpour M, Kordkatooli Z, Vahedi M. 2018. Improved microfiltration and bacteria removal performance of polyethersulfone membranes prepared by modified vapor-induced phase separation. Polym Adv Technol. 29:2420–2439. doi: 10.1002/pat.4352.
- Cabrera J, Guo H, Yao J, Wang X. 2022. The effect of different carbon sources on biofouling in membrane fouling simulators: microbial community and implications. Biofouling. 38:747–763. doi: 10.1080/08927014.2022.2129017.
- Chan S, Pullerits K, Keucken A, Persson KM, Paul CJ, Rådström P. 2019. Bacterial release from pipe biofilm in a full-scale drinking water distribution system. NPJ Biofilms Microbiomes. 5:9. doi: 10.1038/s41522-019-0082-9.
- Chaukura N, Moyo W, Ingwani T, Ndiweni SK, Gwenzi W, Nkambule TI. 2021. Comparative removal efficiencies of natural organic matter by conventional drinking water treatment plants in Zimbabwe and South Africa. Water Environ Res. 93:570–581. doi: 10.1002/wer.1459.
- Cho JY, Moon JH, Seong KY, Park KH. 1998. Antimicrobial activity of 4-hydroxybenzoic acid and trans-4-hydroxycinnamic acid isolated and identified from rice hull. Biosci Biotechnol Biochem. 62:2273–2276. doi: 10.1271/bbb.62.2273.
- Coble PG, Spencer RGM, Baker A, Reynolds DM. 2014. Aquatic organic matter fluorescence. UK: Cambridge University Press; p. 75–122. doi: 10.1017/cbo9781139045452.006.
- Dadari S, Rahimi M, Zinadini S. 2022. Novel antibacterial and antifouling PES nanofiltration membrane incorporated with green synthesized nickel-bentonite nanoparticles for heavy metal ions removal. Chem Eng J. 431:134116. doi: 10.1016/j.cej.2021.134116.
- Du X, Shi Y, Jegatheesan V, Haq I. 2020. A Review on the mechanism, impacts and control methods of membrane fouling in MBR system. Membranes (Basel). 10:24. doi: 10.3390/membranes10020024.
- Fahimirad S, Fahimirad Z, Sillanpää M. 2020. Efficient removal of water bacteria and viruses using electrospun nanofiber. Sci Total Environ. 751:141673. doi: 10.1016/j.scitotenv.2020.141673.
- Fattahi A, Arlos MJ, Bragg LM, Kowalczyk S, Liang R, Schneider OM, Zhou N, Servos MR. 2021. Photodecomposition of pharmaceuticals and personal care products using P25 modified with Ag nanoparticles in the presence of natural organic matter. Sci Total Environ. 752:142000. doi: 10.1016/j.scitotenv.2020.142000.
- Gao Z, Chen Q, Song X, Wang J, Cai W. 2022. Microbial responses to various types of chemical regents during on-line cleaning of UF membranes. Membranes (Basel). 12:920. doi: 10.3390/membranes12100920.
- Ghernaout D. 2020. Natural organic matter removal in the context of the performance of drinking water treatment processes-technical notes. OALib. 07:1–40. doi: 10.4236/oalib.1106751.
- Gomes IB, Lemos M, Mathieu L, Simões M, Simões LC. 2018. The action of chemical and mechanical stresses on single and dual species biofilm removal of drinking water bacteria. Sci Total Environ. 631-632:987–993. doi: 10.1016/j.scitotenv.2018.03.042.
- Harimawan, Ardiyan, Wonoputri, Vita, Ariel, Jonathan, Julian, Helen, Michell. 2022. Biofouling control of membrane distillation for seawater desalination: effect of air-backwash and chemical cleaning on biofouling formation. Biofouling. 38:889–902. doi: 10.1080/08927014.2022.2146496.
- Hoek EMV, Weigand TM, Edalat A. 2022. Reverse osmosis membrane biofouling: causes, consequences, and countermeasures. Npj Clean Water. 5:1–16. doi: 10.1038/s41545-022-00183-0.
- Horseman T, Wang Z, Lin S. 2021. Colloidal interactions between model foulants and engineered surfaces: interplay between roughness and surface energy. Chem Eng J Adv. 8:100138. doi: 10.1016/j.ceja.2021.100138.
- Huang B, Gu H, Xiao K, Qu F, Yu H, Wei C. 2020. Fouling mechanisms analysis via combined fouling models for surface water ultrafiltration process. Membranes (Basel). 10:149. doi: 10.3390/membranes10070149.
- Jaffar SS, Saallah S, Misson M, Siddiquee S, Roslan J, Saalah S, Lenggoro W. 2022. Recent development and environmental applications of nanocellulose-based membranes. Membranes (Basel). 12:287. doi: 10.3390/membranes12030287.
- Karamad Yazdanabad S, Soriano Jerez Y, Samimi A, Shokrollahzadeh S, Mohebbi-Kalhori D, Ibáñez González MJ, Mazzuca Sobczuk T, Molina Grima E. 2023. Microalgal biofouling formation on tubular cellulose-ester membranes during dewatering by forward osmosis. Biofouling. 39:371–384. doi: 10.1080/08927014.2023.2218282.
- Karimipour H, Shahbazi A, Vatanpour V. 2021. Fouling decline and retention increase of polyethersulfone membrane by incorporating melamine-based dendrimer amine functionalized graphene oxide nanosheets (GO/MDA). J Environ Chem Eng. 9:104849. doi: 10.1016/j.jece.2020.104849.
- Khraisheh M, Elhenawy S, Almomani F, Al-Ghouti M, Hassan MK, Hameed BH. 2021. Recent progress on nanomaterial-based membranes for water treatment. Membranes (Basel). 11:995. doi: 10.3390/membranes11120995.
- Kokkinos P, Mantzavinos D, Venieri D. 2020. Current trends in the application of nanomaterials for the removal of emerging micropollutants and pathogens from water. Molecules. 25:2016. doi: 10.3390/molecules25092016.
- Kumar A, Chandra R. 2020. Ligninolytic enzymes and its mechanisms for degradation of lignocellulosic waste in environment. Heliyon. 6:e03170. doi: 10.1016/j.heliyon.2020.e03170.
- Lee Y-G, Shin J, Kim SJ, Cho KH, Westerhoff P, Rho H, Chon K. 2023. An autopsy study of hollow fiber and m ultibore ultrafiltration membranes from a pilot-scale ultra-high-recovery filtration system for surface water treatment. Sci Total Environ. 866:161311. doi: 10.1016/j.scitotenv.2022.161311.
- Li Y, Luo J, Wan Y. 2020. Biofouling in sugarcane juice refining by nanofiltration membrane: fouling mechanism and cleaning. J Membr Sci. 612:118432. doi: 10.1016/j.memsci.2020.118432.
- Maddela NR, Torres RO. 2021. The presence of low fouling-causing bacteria can lead to decreased membrane fouling potentials of mixed cultures. J Environ Chem Eng. 9:105131. doi: 10.1016/j.jece.2021.105131.
- Mamba PP, Motsa MM, Ogola HJ, Msagati TA, Mamba BB, Nkambule TI. 2022. Laccase-coated polyethersulfone membranes for organic matter degradation and removal. J Membr Sci Res. 8:1–10. doi: 10.22079/JMSR.2021.139576.1418.
- Marais SS, Ncube EJ, Msagati TA, Mamba BB, Nkambule TI. 2019. Assessment of trihalomethane (THM) precursors using specific ultraviolet absorbance (SUVA) and molecular size distribution (MSD). J Water Process Eng. 27:143–151. doi: 10.1016/j.jwpe.2018.11.019.
- Medgyesi DN, Trabert B, Sampson J, Weyer PJ, Prizment A, Fisher JA, Freeman LE, Ward MH, Jones RR. 2022. Drinking water disinfection byproducts, ingested nitrate, and risk of endometrial cancer in postmenopausal women. Environ Health Perspect. 130:57012. doi: 10.1289/EHP10207.
- Moyo W, Chaukura N, Motsa MM, Mthombeni NH, Msagati TA, Mamba BB, Heijman SG, Nkambule TI. 2021. The Synergistic fouling of ceramic membranes by particles and natural organic matter fractions using different surface waters in South Africa. J Membr Sci Res. 7:125–137. doi: 10.22079/JMSR.2020.127635.1384.
- Nady N, Schroën K, Franssen MC, Fokkink R, Eldin MSM, Zuilhof H, Boom RM. 2012. Enzyme-catalyzed modification of PES surfaces: Reduction in adsorption of BSA, dextrin and tannin. J. Colloid Interface Sci. 378: doi: 10.1016/j.jcis.2012.04.019.
- Petronijević MJ, Agbaba S, Ražić J, Jazić M, Tubić A, Watson M, Dalmacija B. 2019. Fate of bromine-containing disinfection by-products precursors during ozone and ultraviolet-based advanced oxidation processes. Int J Environ Sci Technol. 16:171–180. doi: 10.1007/s13762-018-1652-8.
- Pöhler T, Mautner A, Aguilar-Sanchez A, Hansmann B, Kunnari V, Grönroos A, Rissanen V, Siqueira G, Aji PM, Tammelin T. 2022. Pilot-scale modification of polyethersulfone membrane with a size and charge selective nanocellulose layer. Sep and Purif Technol. 285:120341. doi: 10.1016/j.seppur.2021.120341.
- Rehman ZU, Khojah B, Leiknes T, Alsogair S, Alsomali M. 2020. Removal of bacteria and organic carbon by an integrated ultrafiltration—nanofiltration desalination pilot plant. Membranes (Basel). 10:223. doi: 10.3390/membranes10090223.
- Rho H, Yu P, Zhao Z, Lee C, Chon K, Perreault F, Alvarez PJ, Amy G, Westerhoff P. 2022. Inhibition of biofouling on reverse osmosis membrane surfaces by germicidal ultraviolet light side-emitting optical fibers. Water Res. 224:119094. doi: 10.1016/j.watres.2022.119094.
- Sambo SP, Marais SS, Msagati TA, Mamba BB, Nkambule TI. 2020. Quantification of biodegradable natural organic matter (NOM) fractions and its impact on bacterial regrowth in a South African water treatment plant. J Water Process Eng. 36:101332. doi: 10.1016/j.jwpe.2020.101332.
- Setareh P, Pirsaheb M, Khezri SM, Hossaini H. 2021. Improving natural organic matter and turbidity removal from surface water by pre-coagulation combined with ozone/ultrasound. Water Supply. 21:1410–1422. doi: 10.2166/WS.2020.323.
- Shao S, Wang Y, Shi D, Zhang X, Tang CY, Liu Z, Li J. 2018. Biofouling in ultrafiltration process for drinking water treatment and its control by chlorinated-water and pure water backwashing. Sci Total Environ. 644:306–314. doi: 10.1016/j.scitotenv.2018.06.220.
- Shao M, Ye C, Li T, Gan J, Yu X, Wang L. 2022. Intensified inactivation of model and environmental bacteria by an atmospheric-pressure air-liquid discharge plasma compared with chlorination. J Environ Sci (China). 117:80–90. doi: 10.1016/j.jes.2022.01.038.
- Singh AV, Kumawat IK. 2012. Preparation and characterisation of tamarind 4-hydroxybenzoic acid (THBA) resin and its use in extraction of heavy metal ions from industrial wastewater. WSA. 38:529–536. doi: 10.4314/wsa.v38i4.7.
- Syngouna VI, Vantarakis A. 2021. Removal performance of faecal indicators by natural and silver-modified zeolites of various particle sizes under dynamic batch experiments: preliminary results. Water. 13:2938. doi: 10.3390/w13202938.
- Takimoto Y, Miwa T, Hatamoto M. 2023. Initiation and progression of early-stage microbial-driven membrane fouling in membrane bioreactors: a review. Biofouling. 39:459–472. doi: 10.1080/08927014.2023.2226064.
- Travnickova E, Mikula P, Oprsal J, Bohacova M, Kubac L, Kimmer D, Soukupova J, Bittner M. 2019. Resazurin assay for assessment of antimicrobial properties of electrospun nanofiber filtration membranes. AMB Express. 9:183. doi: 10.1186/s13568-019-0909-z.
- Tshindane P, Mamba BB, Motsa MM, Nkambule TI. 2023. Delayed solvent–nonsolvent demixing preparation and performance of a highly permeable polyether sulfone ultrafiltration membrane. Membranes (Basel). 13:2–15. doi: 10.3390/membranes13010039.
- Urducea CB, Nechifor AC, Dimulescu IA, Oprea O, Nechifor G, Totu EE, Isildak I, Albu PC, Bungău SG. 2020. Control of nanostructured polysulfone membrane preparation by phase inversion method. Nanomaterials (Basel). 10:1–21. doi: 10.3390/nano10122349.
- Wang X, Ma J, Wu Z, Wang Z. 2020. Stimulatory effects on bacteria induced by chemical cleaning cause severe biofouling of membranes. J Water Reuse Desalin. 10:82–94. doi: 10.2166/wrd.2020.062.
- Wang S, Xiaoming S, Fushan C. 2018. Compatibility study on nanocellulose and polyethersulfone based blends. Cellul Chem Technol. 52:265–270.
- Xu H, Xiao K, Wang X, Liang S, Wei C, Wen X, Huang X. 2020. Outlining the roles of membrane-foulant and foulant-foulant interactions in organic fouling during microfiltration and ultrafiltration: A mini-review. Front Chem. 8:417. doi: 10.3389/fchem.2020.00417.
- Zhang L, Cui Z, Hu M, Mo Y, Li S, He B, Li J. 2017. Preparation of PES/SPSf blend ultrafiltration membranes with high performance via H2O-induced gelation phase separation. J Membr Sci. 540:136–145. doi: 10.1016/j.memsci.2017.06.044.
- Zhang D, Karkooti A, Liu L, Sadrzadeh M, Thundat T, Liu Y, Narain R. 2018. Fabrication of antifouling and antibacterial polyethersulfone (PES)/Cellulose nanocrystals (CNC) nanocomposite membranes. J Membr Sci. 549:350–356. doi: 10.1016/j.memsci.2017.12.034.
- Zhang H, Zhu S, Yang J, Ma A. 2022. Advancing strategies of biofouling control in water-treated polymeric membranes. Polymers (Basel). 14:1–23. doi: 10.3390/polym14061167.