Abstract
Monte Carlo (MC) represents a powerful simulation tool that can be usefully applied to calculating thermodynamic data. However, such codes are normally bespoke for a particular problem and not widely applicable. In this paper, we report a new flexible and versatile MC code called DL_MONTE, which builds on the highly successful DL_POLY molecular dynamics code to allow the treatment of polymers, minerals, semiconductors and metals in a range of applications on both workstations and highly parallel supercomputers. In addition, to describe its features, we used a recent work to model the phase diagrams of mixed metal oxide nanoparticles using MgO/MnO as an illustration, adsorption of water at the MgO surface and, finally, the adsorption isotherms of CO2 in different microporous zeolites. The results demonstrate the flexibility of the methodology and how semi-grand and grand canonical MC can be readily applied.
Introduction
The academic community covers a diverse range of disciplines, and as new scientific challenges emerge, novel processes, devices and materials need to be developed thus stimulating new software functionality. For example, climate change has influenced research into clean energy materials and carbon dioxide (CO2) sequestration. Hence, a feature of any computer code is that they should be developed to be flexible and sufficiently generalised that they can be used to tackle problems from different areas. In addition, the growth in computer power has largely been due to vendors increasing the number of cores within a processor and/or the number of processors within a computer. Thus, many of today's supercomputers contain approximately 100,000 cores, while research groups often have access to computers containing several thousand cores.
Monte Carlo (MC) and molecular dynamics (MD) are techniques for sampling configurational space. Both techniques have strengths and weaknesses. The MC method is far more suitable for calculating the thermodynamic properties (e.g. orderings, adsorption, partition coefficients, solvation, self-assembly, agglomeration, melting and crystallisation, and free energy differences). Meanwhile, MD allows the calculation of time-dependent quantities such as atomic/molecular vibrations and transport coefficients. MD algorithms have been developed such that multimillion particle simulations can be executed on parallel computers containing many thousands of cores and a number of open-source packages exist (e.g. LAMMPS [Citation1] and DL_POLY [Citation2]). These MD packages support a wide range of potential models or force fields and include efficient algorithms for calculating long-range electrostatic interactions and, in order to carry out calculations on very large simulation cells, data (memory) are distributed over a large number of computer nodes. The distributed data strategy has been applied to a number of MC simulations. However, the stochastic nature of MC moves inhibits the inclusion of long-range electrostatic interactions and, currently, there is a lack of flexible MC software that can be used to study large complex systems.
The philosophy behind DL_MONTE is to develop a versatile MC package to address these limitations and accelerate simulations on a range of platforms from high-end PCs through to large computer clusters. To date, it has been assumed that both stochastic moves of individual particles and long-range interactions provided by the Ewald sum [Citation3] are essential and this restricts parallelisation schemes.
Program structure
DL_MONTE is designed to be complementary to DL_POLY [Citation4] and the force field set (the functions needed to define the interactions in a molecular system) are almost identical. Consequently, the program can be used to study a wide range of compounds (e.g. molecular systems, ionic materials and minerals, metals and semiconductors). As a huge variety of potential forms are available and DL_MONTE is designed to be adaptable, the program is not supplied with its own force field parameters. However, it contains many of the functions contained in other packages GROMOS,[Citation5] DREIDING [Citation6] and AMBER.[Citation7]
Force fields available include the following:
Ewald summation
Two-body (non-bonded and bonded)
Three-body (non-bonded and bonded)
Bonded four-body interactions (dihedral and inversion interactions)
The last term in Equation (1) accounts for the long-range electrostatic interactions between the ions. The Ewald sum [Citation3] is an accurate way of summing long-ranged potentials, such as the Coulomb potential, in periodic systems. It is generally regarded as the most appropriate method for simulations containing a few thousand ions (i.e. the size typically used in MC simulations). Nevertheless, the Ewald sum is the most computationally intensive part of the calculation and often takes approximately 75% of the simulation CPU time.
The basic model for a neutral periodic system is a system of charged point ions mutually interacting via the Coulomb potential. Ewald's method replaces a potentially infinite sum in real space by two finite sums: one in real space and one in reciprocal space (in addition, a self-energy correction is also required).[Citation13] Thus, the Ewald method can be evaluated via two steps. First, each ion is effectively neutralised (at long range) by the superposition of a spherical Gaussian cloud of opposite charge centred on the ion. The combined assembly of point ions and Gaussian charges becomes the real space part of the Ewald sum, which is now short ranged and can be evaluated with the non-bonded interactions. The second step is to superimpose a second set of Gaussian charges, this time with the same charges as the original point ions and again centred on the point ions (so nullifying the effect of the first set of Gaussians). The potential due to these Gaussians is obtained from Poisson's equation and is solved as a Fourier series in reciprocal space. The complete Ewald sum requires an additional correction, known as the self-energy correction, which arises from a Gaussian acting on its own site.
For molecular systems, as opposed to systems comprised simply of point ions, additional modifications are necessary to correct for the excluded Coulombic interactions. These are intra-molecular bonded interactions and it is possible to specify these interactions for any given molecular type on input. In the real-space sum, these are simply omitted. In reciprocal space however, the effects of individual Gaussian charges cannot easily be extracted, and the correction is made in real space. It amounts to removing terms corresponding to the potential energy of an ion due to the Gaussian charge on a neighbouring charge m (or vice versa). This correction appears as the final term in the full Ewald formula below.
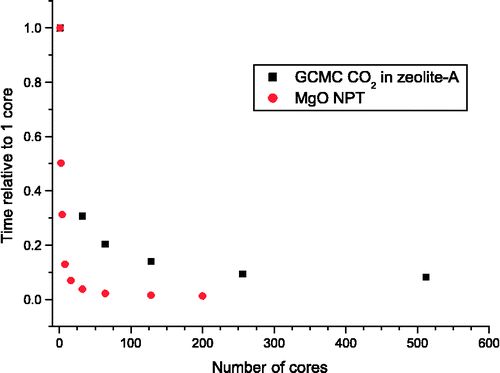
The DL_MONTE program was used throughout this study, and the calculations were undertaken on either the SCARF cluster or the UK national supercomputer (HECToR). The computational demand for these calculations and especially including the effects of long-range interactions are demanding and, therefore, required a parallel computational strategy to be developed. This may include running several similar calculations on different nodes (i.e. task farming). However, this was found not to be the most beneficial strategy due to the long start-up (equilibration) times. The calculations presented in this paper were performed using between 4 and 128 cores (depending on the number of atoms/molecules in the simulation cell) and used the message passing interface (MPI) interface. In Figure , the time taken for two example simulations (these are typical calculations rather than artificial simulations chosen to demonstrate beneficial parallel scaling) as a function of the number of cores has been plotted. From these plots, one can observe that, for even simple calculations such as MgO (512 ions in total and within the canonical ensemble), it is beneficial to use approximately 128 cores. For a larger, more complex example, such as the grand canonical Monte Carlo (GCMC) simulation of CO2 in zeolite, good scaling is achieved up to approximately 256 cores. The difference in scaling between these two examples is largely due to the size of the simulation (both the number of atoms and the number of reciprocal lattice vectors). Thus, our strategy for parallelisation for MC simulations on Beouwolf style clusters can be applied to a diverse range of simulations (i.e. NVT, NPT, grand canonical, semi-grand canonical and Gibbs ensembles).
Scientific applications
Nanoparticles
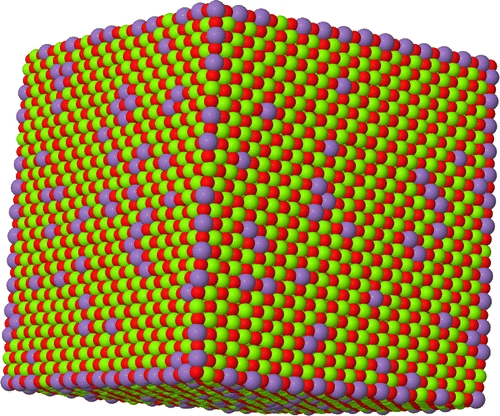
We have investigated the thermodynamic properties of ternary nanoparticle mixtures using DL_MONTE. The objective here is to identify the distribution of cations within the nanoparticle and how this effects the thermodynamic properties. In our pilot study, we examined the MgO–MnO system as we have used this previously in studies of bulk MnO–MgO solid solutions and the resulting phase diagram, calculated using exchange MC, is in good agreement with experiment with a consolute temperature of approximately 1150 K.[Citation15] In addition, we have successfully used this model to calculate segregation energies in thin films.[Citation16] The surface of a crystal always provides a different elastic and electrostatic environment from that of the bulk, and so there is a free energy difference between the energy associated with any defect, including an impurity, in the bulk and at the surface of a nanoparticle. Impurities are thus driven to or from the surface. The basis for all our calculations is the well-known MC method modified for nanoparticles of variable composition as described below. All nanoparticles were cubic and constructed from 8 atom units identical to the cubic unit cell (u.c.) of the bulk material (i.e. face centered cubic (FCC)). Calculations were undertaken on MnO–MgO mixtures comprising 1728 ions (6 × 6 × 6), 2744 ions (7 × 7 × 7), 4096 ions (8 × 8 × 8), 5832 ions (9 × 9 × 9), 8000 ions (10 × 10 × 10), 13,824 ions (12 × 12,12) and 21,952 ions (14 × 14 × 14). The Coulombic interactions were calculated directly and the simulation carried out within the NVT ensemble. We have considered only the {1 0 0} termination of the nanoparticle as the {1 0 0} surfaces of both MgO and MnO are considerably more stable than other terminations. The role of both point defects (e.g. vacancies and interstitials) and linear defects (e.g. steps and dislocations) on the thermodynamics properties of the nanoparticles are neglected. We do not report results for smaller nanoparticles as the estimated consolute temperature is less than that at which the exchange of ions in the simulations is very inefficient (approximately 500 K).
In simulations of non-stoichiometric ionic materials and solid solutions using ‘standard’ MC, kinetic barriers prevent sampling the whole of the configurational space as almost always only one cation arrangement – the initial configuration – is sampled. We have described elsewhere MC exchange simulations in which both the atomic configuration and the atomic coordinates of all the atoms are changed.[Citation17] A single cycle allows for one of three possible moves to be chosen at random with equal probability:
Random displacement of an ion. Allowing random moves of randomly selected atoms takes account of relaxation throughout the nanoparticle and vibrational effects. To determine whether the change is accepted or rejected, the usual Metropolis algorithm is applied. The maximum change in the atomic displacement for each ionic species has a variable
, and its magnitude is adjusted automatically during the simulation to maintain an acceptance/rejection ratio of approximately 0.37.
An exchange of ionic configuration. Changes in ionic configuration are attempted by exchanging the position of a Mn2+ ion and a Mg2+ ion, both chosen at random. Again, the Metropolis algorithm is used to accept or reject any attempted exchange.
A test change in identity of a cation. We evaluate the potential energy change
Thus for MgO–MnO, we evaluate the energy associated with the conversion of a randomly chosen Mg ion to a Mn ion, and the reverse transformation. We emphasise that the change of Mg into Mn, and vice versa, is only a temporary substitution to determine the free energy difference for a given
and
; after Mg/Mn is calculated, the MC simulation of the nanoparticle continues with the initial composition. The test-identity change method is used in preference to the grand canonical ensemble as good statistics on
can easily be achieved. To calculate the phase diagram, the calculated values of
are fitted to the equation:
By integrating Equation (4) with respect to composition, we obtain the variation in free energy with respect to x (x is the mole fraction of a component, in this instance the mole fraction of Mg2+) at each temperature.
Each calculation consisted of an initial equilibration of 5 × 10⁸ cycles followed subsequently by 5 × 10⁸ production cycles. The larger clusters (>4096 ions) pose a significant computational challenge, and for this reason, the calculations were performed using 8–128 cores in the parallel replicated data strategy described above.
One of the principle thermodynamic quantities is the enthalpy required to create a mixed nanoparticle from the stoichiometric binary nanoparticles. We call this the enthalpy of forming, which is measured from the simulation energies, and define the quantity by the following reaction:
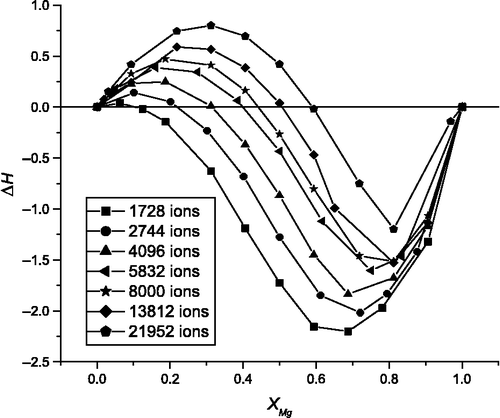
The enthalpy of forming for nanoparticles ranging in size between 1728 and 21,952 ions is presented in Figure and can be interpreted from the change in bond lengths of the component oxides on the formation of a mixed oxide. The Mg–O bond length in the bulk oxide is approximately 2.10 Å compared with the longer Mn–O bond length of 2.17 Å. The strain of the ‘bonds’ gives rise to a positive enthalpy. However, in the nanoparticles starting with a MgO nanoparticle, when Mn2+ ions are initially added the enthalpy of forming is negative because the larger Mn ions progressively replace Mg ions at corners, edges and faces (Figure ). This is energetically favourable as the Mn ions have weaker bonds and thus lower interface energies. The opposite is true for Mg ions replacing Mn ions in the MnO nanoparticle. The relative importance of the strain energy increases with the size of the nanoparticle (Figure ).
The phase diagram of the ternary nanoparticles relative to those of the binary nanoparticles can be determined using free energy differences given by Equations (4) and (5) (a detailed description of the methodology is given in [Citation15]). Calculated phase diagrams are presented in Figure . As anticipated from the enthalpy of forming, the Mn2+ ions are much more soluble in the binary MgO nanoparticle than vice versa.
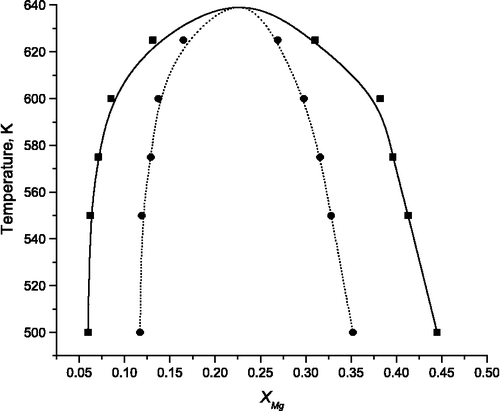
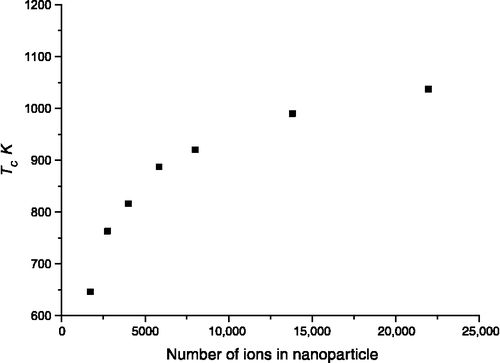
DL_MONTE was used to calculate the miscibility of the binary components for a range of temperatures and nanoparticle size. From this information, the consolute temperature (the critical temperature above which the components of a mixture are miscible, Tc) can be determined as a function of nanoparticle size. The variation with the total number of ions is nonlinear (Figure ). Limitations in the efficiency of the MC method and the range in the nanoparticle size have prevented us from determining whether the curve is sigmoidal as observed in previous studies.
Water on MgO{100} surface
The interaction of water with surfaces has received sustained interest from both experimental and theoretical scientists for a considerable period of time due to its importance in biology, geosciences and chemistry. Consequently, there have been numerous experimental studies (e.g. [Citation18,Citation19]) and theoretical studies (e.g. Citation20Citation21Citation22Citation23Citation24).
GCMC is a standard simulation technique for computing the adsorption isotherms of molecules on surfaces. As it is rather well known (see e.g. [Citation13,Citation25]), we give here only a brief summary of GCMC. GCMC provides a way of sampling configurations with a weighting corresponding to the grand canonical ensemble, in which the number of molecules is allowed to fluctuate. Naturally, in the present situation, only the number of H2O molecules varies. Four kinds of MC moves are used: translations, rotations, insertions and deletions. At each step, a random decision is made as to which of these moves will be attempted, the probabilities of each being fixed. The probability of acceptance or rejection of each trial move is given by the usual Metropolis rule, based on the change of total energy caused by the move. A similar procedure is used for rigid rotations. There are specified probabilities of deciding to attempt insertion or deletion, these two probabilities being equal. The average number of water molecules, , is controlled over a number of simulations by adjusting the B parameter of Adams [Citation26]. In the case of insertion, a single attempt is made to insert an H2O molecule, and the probability of accepting the insertion is given by the usual formula:
Likewise for deletion, a single attempt is made to delete an H2O molecule chosen at random, the probability of this move being given by
The parameter B is related to the chemical potential, , by the equation:
In the present work, we treat the MgO lattice as rigid, with ions on their bulk positions, the lattice parameter (twice the Mg–O nearest-neighbour distance) being a0 = 4.27 Å at all temperatures. The interaction potential between each H2O molecule and the ions of the lattice is a sum of atom–atom potentials having the Buckingham form:
We have performed GCMC simulations on the H2O/MgO system at a series of temperatures T = 500, 400, 350, 300, 275, 250 and 225 K. These temperatures were chosen because it became clear from exploratory simulations that the critical temperature was somewhere between 200 and 300 K. At each temperature, we performed simulations at a rather closely spaced set of values chosen so that the resulting mean values of coverage spanned the range from 0 to approximately − 80 kJ mol− 1. As an example of the number of steps required, we note that, to achieve this statistical error at 350 K, runs of 1 × 10⁸ steps were needed. However, the required length of the runs needed increases strongly as T is reduced, and at 225 K, up to 5 × 10⁸ steps were needed.
The first result presented is the entire isotherm calculated for 350 K in Figure . At low values of (approximately − 72.0 kJ mol− 1), very few water molecules adsorb to the surface.
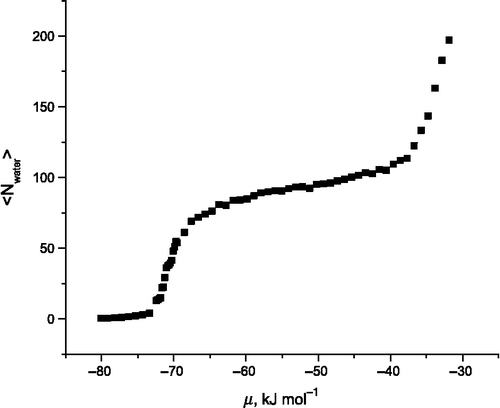
As the chemical potential is increased, there is a rapid increase in the average number of water molecules until a plateau is reached at kJ mol− 1. This point corresponds to identical numbers of adsorption sites, as defined above, and water molecules. The water coverage increases slightly with further increases in the chemical potential until
kJ mol− 1. When the chemical potential is set above this value, water molecules are observed both on the surface and in the vacuum. We present in Figure the energy distribution of water molecules at two points along the isotherm (
and
kJ mol–1), i.e. the step and plateau regions.
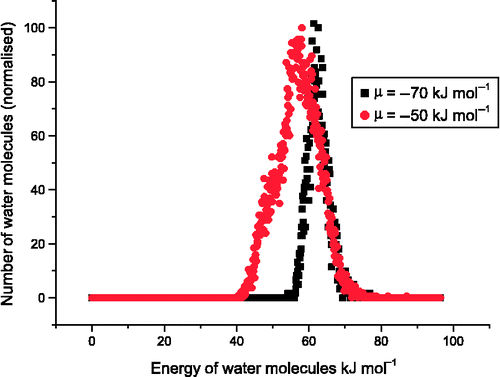
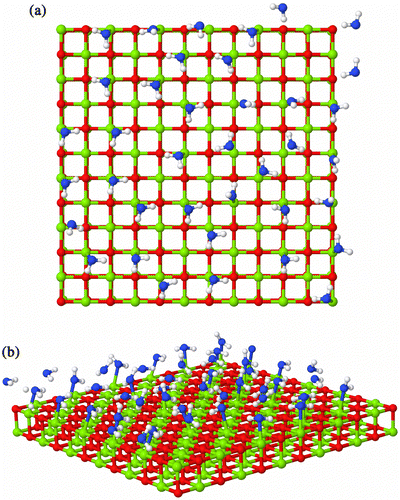
The distribution of energies of the water molecules is both a function of temperature and cover. For the step region, the distribution of energies for the water molecules forms a well-defined peak. This is due to the structure of the water molecules on the surface. The average number of water molecules, , has not reached a monolayer and the water oxygen atom is able to sit almost above an Mg2+ cation with the H atoms pointing towards the O2– ions (Figure (a)). We also note that the peak in energy is approximately 60 kJ mol− 1, which is similar to the value of 73.3 kJ mol− 1 determined by energy minimisation.[Citation21] In the plateau region of the isotherm, the distribution of molecule energies both broadens and has an extra peak at approximately 50 kJ mol− 1 (Figure ). This is due to a greater diversity in molecular orientations to the surface. In Figure (b), water molecules can be observed with both H atoms coordinated to the oxide ions and with only a single H atom coordinated to the oxide ion.
CO2 adsorption in zeolites
The adsorption and separation of CO2 from gas streams is an important area of research, and there are many published works, both experimental and computational, on adsorption and diffusion in bulk zeolite structures Citation28Citation29Citation30Citation31Citation32Citation33Citation34Citation35Citation36Citation37Citation38Citation39Citation40 using a variety of potential models.Citation41Citation42Citation43Citation44 Surface effects are very important for adsorption and much less work has been carried out on the adsorption and transport of CO2 at zeolite surfaces, so this is where we chose to focus our work. However, first we needed to determine an accurate potential model. One of the most sensitive experimental techniques for testing adsorption models is the adsorption isotherm; at low pressures, the uptake will depend almost exclusively on the gas–framework interaction, then as the pressure increases the uptake will depend on the relative strength of the gas–gas and gas–framework interactions, and finally at high pressures the potential model at closer intermolecular distances is probed.
Thus, we used the GCMC feature within DL_MONTE to determine the equilibrium number of CO2 molecules within a given zeolite structure and, by comparison with experimental isotherms, probe the relative strengths of the interactions. Iterative adjustment of the inter-molecular potentials for different zeolites is used to derive a set of potential parameters for application in a range of materials. This is particularly important for zeolite systems as we require flexibility in being able to model both siliceous zeolites and aluminosilicates with different cations, particularly Na+ and K+. Another important feature is that, for these systems, there are a large number of experimental adsorption isotherms available along with heats of adsorption to test the effectiveness of the model as a function of composition.
The CO2 potential that we chose to use in this work was the EPM2 model by Harris and Yung.[Citation45] The EPM2 model has been widely used for the simulation of CO2; it accurately reproduces the liquid–vapour coexistence curve and the critical properties. For the zeolites, we needed a model that included a variety of different cations and also hydroxyl groups for the modelling of surfaces, and was compatible with CO2 and water to cover all of the simulations that we intended to carry out. We chose the CLAYFF force field,[Citation46] originally parameterised for the simulation of clays, which can be thought of as chemically similar to zeolites because of their aluminosilicate composition. It includes parameters for a range of metals including Li, Na and Ca and includes water and the hydroxyl group. The CLAYFF force field has been used successfully for the simulation of zeolites.[Citation47] These authors used the CLAYFF parameters for the zeolite, and added O–Si–O and Si–O–Si bend terms to accurately reproduce the zeolite structures. Moreover, Kerisit et al. [Citation48] successfully used the EPM2 model with the CLAYFF model in simulations of scCO2/H2O mixtures above a forsterite surface.
The zeolite structures were optimised using energy minimisation with the METADISE code.[Citation49] The zeolite structures (Figure ) minimised with the CLAYFF potentials have comparable lattice parameters to experiment, as listed in Table .
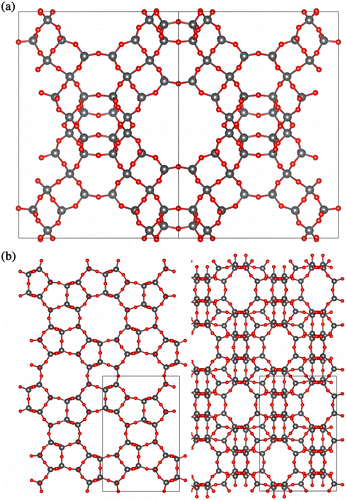
Table 1 Simulated zeolite lattice parameters compared to experiment.
The MFI structure compares very favourably with experiment, while some of the faujasite structures exhibit slightly contracted lattice parameters. However, there are a couple of possible explanations for this discrepancy. First, the simulated and experimental systems are not exactly comparable, as our Na-FAU simulations have a Si:Al ratio of 1, and only Na+ as a cation, whereas the experimental composition is Ca0.95Mg0.22Na1.04K0.02[Al3.40Si8.60O24] · 6H2O – note that as well as having a different composition, there is also water present in this structure which will affect the lattice parameters; secondly, energy minimisation calculations do not take into account any crystal vibrations and hence neglect temperature effects. The structures of siliceous faujasite (FAU) and silicalite (MPI) are shown in Figure .
The adsorption isotherms were generated using the GCMC features in the DL_MONTE code. A different selection procedure was used for the insertion/deletion of molecules from that described above. This allows for the partial pressure to be used as a simulation parameter (the two methods are equivalent). The insertion of a molecule is governed by the selection procedure:
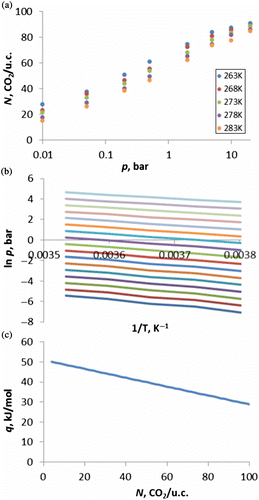
Each isotherm is the result of a series of simulations at different pressures. The number of CO2 molecules in the simulation cell (NCO2) at each pressure is plotted to give the isotherm. The heat of adsorption is calculated from five isotherms generated over a narrow temperature range, usually 263, 268, 273, 278 and 283 K (Figure (a)) and the data are used to plot adsorption isosteres, which are graphs of log p versus 1/T at constant coverage (Figure (b)). The heat of adsorption (isosteric heat) (q), as a function of coverage (Figure (c)), can be calculated from the gradient using the Clausius–Clapeyron relationship (Equation (14)).
Development of model
Initially we focused on the potentials for siliceous zeolites and produced isotherms of CO2 in siliceous MFI and FAU using potentials generated by mixing the Lennard-Jones 12-6 CLAYFF zeolite parameters with the EPM2 CO2 potentials using the Lorentz–Berthelot mixing rules but we found this to overestimate at low pressure and underestimate at high pressure. To correct the inaccuracy, we altered the parameters for the CO2–zeolite interaction, while keeping CO2–CO2 interactions purely as EPM2. The new CO2–zeolite interaction mixed the CLAYFF zeolite with CLAYFF parameters for the oxygen of CO2 and EPM2 with a slightly modified r (Lennard-Jones size parameter) value for C. Figure shows isotherms for CO2 in silicalite (MFI) using this modified potential, which can be seen to reproduce the experimental isotherms of Yamazaki et al. [Citation54] very well. Using these isotherms, we calculate the heat of adsorption to be 17 kJ/mol which is slightly lower than the value published by Yamazaki et al. of 23.4 kJ/mol; however, their calculation was over the temperature range 273–473 K, while our calculation was between 263 and 283 K, which may account for the different values.
![Figure 11 (Colour online) Adsorption isotherms of CO2 in siliceous MFI, coloured according to temperature. Data points are our simulations, line is experimental data from Yamazaki et al. [Citation54] at 273 K.](/cms/asset/8d54b796-80d5-4cdf-ba07-05421133b34d/gmos_a_839871_f0011_oc.gif)
For aluminosilicate zeolites, cations are introduced into the structure, which creates a net charge in the system. We therefore altered the partial charges to maintain a neutral cell. For a Si:Al ratio of 1 in Na-FAU, the Oz (oxygen of zeolite) partial charge was changed by 11% from 1.05 to 1.16875 to keep the cell charge neutral. To negate the effect of this change, we ran a series of tests comparing to experimental values at pressures of 5 and 25 bar by Maurin et al. [Citation41] of N = 93 and 107 molecules CO2/u.c., respectively. Table lists some of the parameter changes that we trialled. The first test was to increase ϵ Oz (Oz ϵ value) by a series of percentages: 5%, 11%, 20% and 25% (Table , tests 1–4). We found that a higher ϵ Oz increased the loading at low pressure more than at high pressure, to give a loading that was too low at higher pressure. We then tried these same percentage increases in ϵ Oz, while also increasing rAl (Al r value) by 0.15 Å (tests 5–8). We chose to increase rAl because, in the CLAYFF model, Si and Al have the same potential parameters, the only difference being the partial charges. Al3+ is a larger ion than Si4+, so we thought that increasing rAl would account for this and reduce some of the increased loading at low pressure. The best result with rAl increased by 0.15 Å was when ϵ Oz increased by 11% (the same percentage that the charge had changed by), although this was still giving too low adsorption at high pressure. We therefore kept these parameters and tried reducing r Oz (Ozr value) by 0.05, 0.1 and 0.15 Å (1.4%, 2.8% and 4.2%) but found that this increased the loading at low pressure, but not as high pressure as we wanted (Table , tests 9–12). Finally, we tried reducing rNa (Na r value) by 10%, 15% and 20%, finding that this increased the loading as we had hoped (tests 13–15). As the subtleties of these parameter changes was hard to discern from just two data points, however, we generated complete isotherms with all of the rNa parameter changes and calculated the heats of adsorption for each of them.
Table 2 Sensitivity on potential parameters of the number of CO2 molecules adsorbed at two test pressures, 5 and 25 bar, to compare with experimental data from Maurin et al. [Citation41].
The DL_MONTE method was able to distinguish well between these small changes in potential sets, changing both the isotherms and the slope of the heats of adsorption graph (Figure ). As the isotherms were all relatively similar and it was hard to choose the best, the final decision on the parameters that we chose to use was based on being able to reproduce the heat of adsorption, providing the isotherm was satisfactory. We therefore chose: ϵ Oz increased by 11%, rAl increased by 0.15 Å and rNa decreased by 15% (Table and Figure , test 14). The full potential set for siliceous and aluminosilicate zeolites is listed in Table .
![Figure 12 (Colour online) Heat of adsorption of CO2 in Na-FAU, Si:Al ratio = 1. Green: test 13, blue: test 14, red: test 15, orange: experimental data from Maurin et al. [Citation41].](/cms/asset/a36b1706-79fc-424b-bdf9-9a1172ddbfef/gmos_a_839871_f0012_b.gif)
Table 3 Lennard-Jones potential parameters and partial charges.
To change the Si:Al ratio, the partial charges must also be changed slightly, so potentials need to be adjusted to match. The technique that we have found to work well is to adjust the Oz charges to make the cell neutral and then adjust the ϵ Oz by the same percentage from the original CLAYFF parameters; all other potential parameters are unchanged from those in Table . An isotherm for Na-FAU with a Si:Al ratio of 1.18 is shown in Figure , with excellent agreement with an experimental isotherm.[Citation55] The potential parameters have an Oz charge of − 1.15885 and ϵ Oz of 0.007437 eV.
![Figure 13 (Colour online) Adsorption isotherm of CO2 in Na-FAU with Si:Al ratio = 1 (green) and Si:Al ratio = 1.18 (red and blue) at 303.2 K. Data points are our simulations, blue line is represents experimental data from Pillai et al. [Citation55].](/cms/asset/651c947c-fc43-4d8a-a8cb-7c442ae4c172/gmos_a_839871_f0013_oc.gif)
Now that we have a reliable model, we can use it as a predictive tool to probe the effect of parameters such as composition on adsorption. Figure shows the effect on CO2 adsorption of changing the Si:Al ratio from 1 to 1.18 in Na-FAU, thereby having 96 and 88 Na+/u.c., respectively. This small change in composition has a significant effect on the CO2 uptake, and our model is sensitive enough to be able to discern these differences. The effect that this change of composition has on the CO2 uptake also highlights how difficult it can be to compare simulated to experimental data as experimentally the samples may not be ideal. For example, if ion exchange is used to change the cation species in a zeolite, it may not be possible to get complete exchange, thus leaving residual amounts of the other cation species which would change the adsorption characteristics.
In summary, in this study, we have used the GCMC functionality in DL_MONTE to derive a set of potentials that can reproduce adsorption isotherms and heats of adsorption in a variety of zeolites. The technique is sensitive enough to distinguish between subtle changes in the potential parameters, to allow optimisation of a model for CO2 adsorption in zeolites which can now be used as a predictive tool.
Conclusion
We have introduced a new flexible MC code called DL_MONTE which is now available to the simulation community. It can be readily applied to a wide range of materials, from covalently bonded molecules through insulators, semiconductors to metals because of the extensive range of force fields available. The inclusion of the Ewald summation scheme allows for the explicit and reliable calculation of the electrostatic contribution to the total interaction energy. Further important developments have included, first, that the input is largely compatible with the widely used DL_POLY MD code to both provide comparisons and reduce the time required for starting simulations, and secondly, unusually for MC simulation codes, there is a measure of parallelisation via MPI so that the user can exploit large parallel computer nodes.
An important capability of DL_MONTE is allowing the user to go beyond the usual NVE and NVT ensembles, and in this paper, we have illustrated this by describing three applications where we apply semi-grand and grand canonical ensembles. These include the use of the semi-grand canonical ensemble to model the phase stability of mixed oxide nanoparticles and the GCMC option to investigate an oxide water interface. In the final application, we again use GCMC, in this case to model CO2 sorption in microporous alumina silicates, but use the approach to improve the quality of the force fields as a pre-cursor to a full investigation.
Our results on mixed MgO/MnO nanoparticles show that the semi-grand ensemble is a highly efficient approach for condensed phase systems, particularly when the atom sizes are similar. We report the phase diagrams and our prediction that there is a marked variation of consolute temperature with temperature and it is only when the nanoparticle has in excess of 25,000 atoms that it converges to bulk behaviour.
The GCMC results of water on MgO surfaces have enabled us to evaluate a more reliable estimate of the critical point and address how this is linked to the adsorption behaviour. In contrast, our work on the sorption of CO2 in the microporous zeolites enables us to distinguish and rationalise the sorption behaviour as a function of framework structure and composition. Furthermore, the presence of detailed experimental isotherms for certain structures and compositions has allowed us to investigate the sensitivity of the results to the details of the intermolecular interactions and indeed to derive new and more reliable parameters.
In summary, the newly available DL_MONTE MC code now allows the academic community to access and use this highly flexible simulation engine. To obtain a copy of the code, please contact J.A.P. and is available through the web link (http://www.ccp5.ac.uk).
Acknowledgements
The authors acknowledge useful discussions with Professor Mike Gillan (UCL) and Professor Neil Allan (Bristol). Part of this work, funded by NERC, made use of the facilities of HECToR, the UK's national high-performance computing service, which is provided by UoE HPCx Ltd at the University of Edinburgh, Cray Inc. and NAG Ltd, and funded by the Office of Science and Technology through EPSRC's High End Computing Programme. The SCARF computing resources were provided by STFC's e-Science facility. DL_MONTE was developed under the auspices CCP5.
Notes
1. Email: [email protected]
2. Email: [email protected]
REFERENCES
- PlimtonS. Fast parallel algorithms for short-range molecular dynamics. J Comput Phys. 1995;117:1–19.
- TodorovIT, SmithW, TrachenkoK, DoveMT. DL_POLY_3: new dimensions in molecular dynamics simulations via massive parallelism. J Mater Chem. 2006;16:1911–1918.
- EwaldPP. Die Berechnung optischer und elektrostatischer Gitterpotentiale. Ann Phys. 1921;64:253–287.
- Forester TR, Smith W. The DL_POLY user's manual, 1994. Ref no. DL/SCI/TM100T.
- van GunsterenWF, BerendsenHJC. Groningen molecular simulation (GROMOS) library manual. Groningen: BIOMOS; 1987.
- MayoSL, OlafsonBD, GoddardWA. DREIDING: a generic force field for molecular simulations. J Phys Chem. 1990;94:8897–8909.
- CornellWD, CieplakP, BaylyCI, GouldIR, MerzKMJr, FergusonDM, SpellmeyerDC, FoxT, CaldwellJW, KollmanPA. A second generation force field for the simulation of proteins, nucleic acids, and organic molecules. J Am Chem Soc. 1995;117:5179–5197.
- SuttonAP, ChenJ. Long range Finnis–Sinclair potentials. Philos Mag Lett. 1990;61:139–146.
- GuptaR. Lattice relaxation at a metal surface. Phys Rev B. 1981;23:6265–6270.
- DawMS, BaskesM. Embedded-atom method: derivation and application to impurities, surfaces, and other defects in metals. Phys Rev B. 1984;29:6443–6453.
- TersoffJ. New empirical approach for the structure and energy of covalent systems. Phys Rev B. 1988;37:6991–7000.
- SmithW, ForesterTR. Parallel macromolecular simulations and the replicated data strategy. 1: The computation of atomic forces. Comput Phys Commun. 1994;79:52–62.
- AllenMP, TildesleyDJ. Computer simulation of liquids. Oxford: Clarendon Press; 1989.
- VlugtTJH, Garcia-PerezE, DubbeldamD, BanS, CaleroS. Computing the heat of adsorption using molecular simulations: the effect of strong coulombic interactions. J Chem Theory Comput. 2008;4:1107–1118.
- LavrentievMY, AllanNL, BarreraG, PurtonJA. Ab initio calculation of phase diagrams of oxides. J Phys Chem B. 2001;105:3594–3599.
- PurtonJA, AllanNL. Monte Carlo simulation of segregation in ceramic thin films: comparison of the MgO/MnO{1 0 0} and {2 1 0} surfaces. J Cryst Growth. 2006;294:130–136.
- PurtonJA, BarreraGD, AllanNL, BlundyJD. Monte Carlo and hybrid Monte Carlo/molecular dynamics approaches to order–disorder in alloys, oxides, and silicates. J Phys Chem B. 1998;102:5202–5207.
- FerryD, GelobA, SenzV, SuzanneJ, ToenniesJP, WeissH. Observation of the second ordered phase of water on the MgO(1 0 0) surface: low energy electron diffraction and helium atom scattering studies. J Chem Phys. 1996;105:1697–1701.
- FerryD, PicaudS, HoangPNM, GirardetC, GiordanoL, DemirdjianB, SuzanneJ. The properties of a two-dimensional water layer on MgO(0 0 1). Surf Sci. 1998;409:101–116.
- LangelW, ParrinelloM. Ab initio molecular dynamics of H2O adsorbed on solid MgO. J Chem Phys. 1995;103:3240–3252.
- McCarthyML, SchenterGK, ScamehornCA, NicholasJB. Structure and dynamics of the water/MgO interface. J Phys Chem. 1996;100:16989–16995.
- AllenJP, MarmierA, ParkerSC. Atomistic simulation of surface selectivity on carbonate formation at calcium and magnesium oxide surfaces. J Phys Chem C. 2012;116:13240–13251.
- FoxH, HorsfieldA, GillanMJ. Methods for calculating the desorption rate of an isolated molecule from a surface: water on MgO(0 0 1). Surf Sci. 2007;601:5016–5025.
- FoxH, GillanMJ, HorsfieldA. Methods for calculating the desorption rate of molecules from a surface at non-zero coverage: water on MgO(0 0 1). Surf Sci. 2009;603:2171–2178.
- FrenkelD, SmitB. Understanding molecular simulation. 2nd ed.San Diego, London: Academic Press; 2002.
- AdamsDJ. Grand canonical ensemble Monte Carlo for a Lennard-Jones fluid. Mol Phys. 1975;29:307–311.
- ColleR, SalvettiD. A general method for approximating the electronic correlation energy in molecules and solids. Theor Chim Acta. 1975;37:1404–1408.
- GojA, ShollDS, AktenED, KohenD. Atomistic simulations of CO2 and N2 adsorption in silica zeolites: the impact of pore size and shape. J Phys Chem B. 2002;106:8367–8375.
- PlantDF, MaurinG, DerocheI, GaberovaL, LlewellynPK. CO2 adsorption in alkali cation exchanged Y faujasites: a quantum chemical study compared to experiments. Chem Phys Lett. 2006;426:387–392.
- HirotaniA, MizukamiK, MiuraR, TakabaH, MiyaT, FahmiA, StirlingA, KuboM, MiyamotoA. Grand canonical Monte Carlo simulation of the adsorption of CO2 on silicalite and NaZSM-5. Appl Surf Sci. 1997;120:81–84.
- MaurinG, LlewellynP, PoyetT, KuchtaB. Influence of extra-framework cations on the adsorption properties of X-faujasite systems: microcalorimetry and molecular simulations. J Phys Chem B. 2005;109:125–129.
- MaurinG, BelmabkhoutY, PirngruberG, GaberovaL, LlewellynP. CO2 adsorption in LiY and NaY at high temperature: molecular simulations compared to experiments. Adsorption. 2007;13:453–460.
- BulanekR, FrolichK, FrydovaE, CicmanecP. Microcalorimetric and FTIR study of the adsorption of carbon dioxide on alkali–metal exchanged FER zeolites. Top Catal. 2010;53:1349–1360.
- MontanariT, BuscaG. On the mechanism of adsorption and separation of CO2 on LTA zeolites: an IR investigation. Vib Spectrosc. 2008;46:45–51.
- DunneJA, MariwalsR, RaoM, SircarS, GorteRJ, MyersAL. Calorimetric heats of adsorption and adsorption isotherms. 1. O2, N2, Ar, CO2, CH4, C2H6, and SF6 on silicalite. Langmuir. 1996;12:5888–5895.
- DunneJA, RaoM, SircarS, GorteRJ, MyersAL. Calorimetric heats of adsorption and adsorption isotherms. 2. O2, N2, Ar, CO2, CH4, C2H6, and SF6 on NaX, H-ZSM-5, and Na-ZSM-5 zeolites. Langmuir. 1996;12:5896–5904.
- PapadopoulosGK, JobicH, TheodorouDN. Transport diffusivity of N2 and CO2 in silicalite: coherent quasielastic neutron scattering measurements and molecular dynamics simulations. J Phys Chem B. 2004;108:12748–12756.
- BabaraoR, JiangJW. Diffusion and separation of CO2 and CH4 in silicalite, C-168 schwarzite, and IRMOF-1: a comparative study from molecular dynamics simulation. Langmuir. 2008;24:5474–5484.
- van den BerghJ, BanSA, VlugtTJH, KapteijnF. Modeling the loading dependency of diffusion in zeolites: the relevant site model. J Phys Chem C. 2009;113:17840–17850.
- DerocheI, MaurinG, BorahBJ, YashonathS, JobicH. Diffusion of pure CH4 and its binary mixture with CO2 in faujasite NaY: a combination of neutron scattering experiments and molecular dynamics simulations. J Phys Chem C. 2010;114:5027–5034.
- MaurinG, LlewellynPL, BellRG. Adsorption mechanism of carbon dioxide in faujasites: grand canonical Monte Carlo simulations and microcalorhnetry measurements. J Phys Chem B. 2005;109:16084–16091.
- Garcia-SanchezA, AniaAO, ParraJB, DubbeldamD, VlugtTJH, KrishnaR, CaleroS. Transferable force field for carbon dioxide adsorption in zeolites. J Phys Chem C. 2009;113:8814–8820.
- JaramilloE, ChandrossM. Adsorption of small molecules in LTA zeolites. 1. NH3, CO2, and H2O in zeolite 4A. J Phys Chem B. 2004;108:20155–20159.
- BabaraoR, HuZQ, JiangJW, ChempathS, SandlerSI. Storage and separation of CO2 and CH4 in silicalite, C-168 schwarzite, and IRMOF-1: a comparative study from Monte Carlo simulation. Langmuir. 2007;23:659–666.
- HarrisJG, YungKH. Carbon dioxide's liquid–vapor coexistence curve and critical properties as predicted by a simple molecular model. J Phys Chem. 1995;99:12021–12024.
- CyganRT, LiangJJ, KalinichevAG. Molecular models of hydroxide, oxyhydroxide, and clay phases and the development of a general force field. J Phys Chem B. 2004;108:1255–1266.
- BushuevYG, SastreG. Atomistic simulations of water and organic templates occluded during the synthesis of zeolites. Micropor Mesopor Mater. 2010;129:42–53.
- KerisitS, WeareJH, FelmyAP. Structure and dynamics of forsterite-scCO2/H2O interfaces as a function of water content. Geochim Cosmochim Acta. 2012;84:137–151.
- WatsonGW, KelseyET, de LeeuwNH, HarrisDJ, ParkerSC. Atomistic simulation of dislocations, surfaces and interfaces in MgO. J Chem Soc, Faraday Trans. 1996;92:433–438.
- ArtioliG, LambertiC, MarraGL. Neutron powder diffraction study of orthorhombic and monoclinic defective silicalite. Acta Crystallogr B. 2000;56:2–10.
- HriljacJA, EddyMM, CheethamAK, DonohueJA, RayGJ. Powder neutron diffraction and 29Si MAS NMR studies of siliceous zeolite-Y. J Solid State Chem. 1993;106:66–72.
- WiseWS. New occurence of faujasite in Southeastern California. Am Mineral. 1982;67:794–798.
- LimWT, ChoiSY, ChoiJH, KimYH, HeoNH, SeffK. Single crystal structure of fully dehydrated fully K+-exchanged zeolite Y (FAU), K71Si121Al71O384. Micropor Mesopor Mater. 2006;92:234–242.
- YamazakiT, KatohM, OzawaS, OginoY. Adsorption of CO2 over univalent cation-exchanged ZSM-5 zeolites. Mol Phys. 1993;80:313–324.
- PillaiRS, PeterSA, JasraRV. CO2 and N2 adsorption in alkali metal ion exchanged X-faujasite: grand canonical Monte Carlo simulation and equilibrium adsorption studies. Micropor Mesopor Mater. 2012;162:143–151.