
ABSTRACT
In an effort to characterise and select promising sweet stem sorghum genotypes with enhanced biofuel productivity, the present study investigated phenotypic variability present among diverse sweet stem sorghum genotypes based on ethanol production and related agronomic traits. One hundred and ninety genotypes were evaluated. Data were subjected to variance, cluster, correlation, path coefficient and principal component analyses. Significant differences (P < 0.01) were detected among tested genotypes for all measured traits. Days to flowering varied from 62 to 152 with a mean of 93. Plant height varied from 90 to 420 cm with a mean of 236 cm. Stem diameter ranged from 7 to 31 mm with a mean of 16 mm. Biomass yield varied from 6.668 to 111.2 t ha−1 with a mean of 30 t ha−1. Stalk dry matter content ranged from 17.2% to 44.2% with a mean of 29.8%, while fibre content varied from 8.92% to 34.8% with a mean of 17.2%. The stalk brix yield varied from 3.3% to 18.9% with a mean of 12.1%. Ethanol productivity ranged from 240.9 to 5500 l ha−1 with a mean of 1886 l ha−1. The best ethanol producing genotypes were AS203, AS391, AS205, AS251 and AS448. Days to flowering, plant height, stalk brix and stem diameter exerted the greatest indirect effects on ethanol production through higher biomass production. Biomass yield had the greatest direct effect on ethanol production. Therefore, the above traits should be considered during breeding sorghum for bio-ethanol production. Also, the traits had high heritability values, hence selection should provide for good genetic gains. Overall, the above sweet stem sorghum genotypes are useful genetic resources for breeding of sorghum with enhanced bio-ethanol production.
Introduction
Sweet stem sorghum (Sorghum bicolor) possesses a number of adaptive and constituent traits rendering it suitabile as a biofuel crop. In comparison with the other biofuel crops such as sugarcane and sugar beet, sweet stem sorghum exhibits more valuable traits such as lower water and fertiliser requirements, greater drought tolerance and salt tolerance with greater adaptability to tropical, subtropical and temperate climates. The crop has a short harvesting period that lies in the intermittent sugar-harvesting period allowing for crop rotation (Ratnavathi et al. Citation2011; Eggleston et al. Citation2013; Morrissey and Thoma Citation2017). Several recent studies (Vermerris Citation2011; Calvino and Messing Citation2012; Mullet et al. Citation2014; Prakasham et al. Citation2014; Anami et al. Citation2015a, Citation2015b) have made the case for using sweet stem sorghum as a bioenergy crop.
Genetic diversity is a vital prerequisite for selecting suitable parents for creating genetic diversity or for developing hybrid cultivars. Genetic enhancement of crops through conventional breeding is viable if substantial genetic variation is present and the desirable traits are heritable. Development of sweet stem sorghum cultivars for bioenergy requires efficient identification and incorporation of suitable traits from complementary genotypes. A number of morphological traits such as thick stems, tall stalks, late maturity and high biomass are regarded as important attributes of the crop for increased bioethanol production (Elangovan et al. Citation2014; Lekgari and Dweikat Citation2014; Regassa and Wortmann Citation2014; Tesfamichael et al. Citation2015). For example, Mathur et al. (Citation2017) in their review on the potential of sweet stem sorghum as a biofuel crop indicated the high potential of the crop for biofuel production attributable to increased biomass yields, thicker and fleshier stems, with high juice yields reaching up to 78% of the total biomass, and Brix content ranging from 14% to 23% (Tesfamichael et al. Citation2015). Breeding for adaptation to tropical and temperate climates, and gene exchange among the five races of sorghum, have endowed sweet stem sorghum with a high level of genetic variability (Elangovan et al. Citation2014).
Given that most breeding endeavours are time consuming and cost intensive, it is necessary to undertake simultaneous selection of several traits and to investigate the inter-relationships of phenotypic traits. Understanding of the associations among traits will subsequently reduce time and funds invested in breeding programmes (Mangena Citation2014; Lombardi et al. Citation2015) for the reason that concurrent enhancement of several traits can be pursued if they are positively correlated. Studies on the correlation of traits are instrumental for assessing the feasibility of mutual selection of two or more traits, based on calculating the influence of selection for secondary traits on genetic gain for the primary trait under consideration. In contrast, if characters are negatively associated, then it is difficult to implement concurrent selection (El Naim et al. Citation2012). Path coefficient analysis, originally proposed by Wright (Citation1921) and later illustrated by Dewey and Lu (Citation1959), permits the apportioning of correlation coefficients into direct and indirect effects of traits on a dependent variable and accordingly assists in evaluating the cause–effect relationship for effective selection (Ezeaku and Mohammed Citation2006; Ali, Abbas et al. Citation2011). Path coefficient analysis has not been not widely applied in sweet stem sorghum selection programmes (Kumar et al. Citation2012). Its application has gained momentum recently (Tesfaye et al. Citation2014; Kassahun et al. Citation2015) mainly due to the upsurge in research on sweet stem sorghum as a biofuel crop.
Phenotypic variability is a reflection of both genetic and non-genetic components (Sami et al. Citation2013; Yaqoob et al. Citation2015), hence, approximation of genetic parameters in the context of trait characterisation is an indispensable component for prospective sweet stem improvement programmes. To initiate a successful breeding programme, it is of paramount significance to have a clear comprehension of variability using parameters like genetic co-efficient of variation, heritability and genetic advance (Govindaraj et al. Citation2010, Citation2011; Kassahun et al. Citation2015). Genetic coefficient of variation concurrently with heritability values give the best estimates of the extent of response anticipated from selection (Akhtar et al. Citation2007).
The African Centre for Crop Improvement (ACCI) of University of KwaZulu-Natal (UKZN) is actively engaged in breeding sweet stem sorghum for bio-fuel production in South Africa. The centre assembled a collection of over 190 sweet stem sorghum genotypes from various countries. The objective of the present study was to determine the phenotypic variability present among diverse sweet stem sorghum genotypes based on ethanol production and seven related agronomic traits. Information presented in the study may assist in selecting promising sweet stem sorghum genotypes with enhanced biofuel productivity for direct production or for future breeding programmes.
Materials and methods
Plant materials and experimental design
The study used 190 sweet stem sorghum genotypes. The genotypes were sourced from various origins including from Zimbabwe, South Africa, the Netherlands, Australia, India, Ethiopia, Mozambique, Kenya, United States of America, Sudan, Zambia, Malawi and Mexico. The South African genotypes were collected from the following provinces: KwaZulu-Natal, Eastern Cape and Limpopo. The test genotypes included Urja and Sugargraze that were used as standard checks. Urja is a commercial sweet stem sorghum hybrid being commercialised by Praj Industries in India. Sugargraze also referred to as SS120 is a three-way hybrid developed in Australia. Detailed information about each genotype is given in . Experiments were laid out in a lattice design containing 22 incomplete blocks with two complete blocks. Nine genotypes were allocated in each incomplete block. Each entry was planted in two-row plots of 3.0 m length with inter-row and intra-row spacing of 80 and 20 cm, respectively.
Table 1. Description of the 190 sweet stem sorghum varieties used in the study.
Trial establishment and maintenance
Experimental genotypes were planted in seedling trays at the greenhouse facility of Controlled Environment Research Unit (CERU) at the University of KwaZulu-Natal. At four weeks after planting seedling plants were transplanted to Ukulinga Research Farm at the University of KwaZulu-Natal, in South Africa (29°37′S 30°22′E; 596 m above sea level). The trial was conducted during the 2015/2016 summer season (November to April). The trial site received 581 mm moisture through rainfall and supplemental irrigation. The average minimum temperature for the season was 10.2°C and the mean maximum temperature was 28.4°C. Experimental plots were fertilised at 375 kg ha−1 with 2:3:2 (N:P:K) granular fertiliser. At the flowering stage plants were side dressed with 130 kg ha−1 of Urea (46% N) granular fertiliser. After transplanting the trial was treated with 100 ml per ha of lamda cyhalothrin (Karate) to control a wide range of pests. When plants reached 60 cm height plots were treated with 120 ml per ha of lamda cyhalothrin to control pests.
Data collection
The following quantitative traits were measured during the study: days to flowering were counted as the date of seeding to the time that 50% of the plants started flowering (Vanderlip and Reeves Citation1972). Plant height was measured from the base of the plant to the tip of the panicle and expressed in cm at 50% flowering. Stem diameter (mm) was measured using a vernier calliper on the midsection of three plants. One row was harvested from each plot. Stalk biomass () was measured by removing leaves and heads, then cutting at ground level and weighing the stems at 50% maturity. Samples of chopped stalks were weighed green and re-weighed after oven drying at 60°C until constant mass was reached to gravitationally estimate dry mass (Hlophe Citation2014). Dry matter was calculated using the formula:
(1) Fibre content was calculated using the formula:
(2) Stalks were cut using a chaff cutter and a representative sample was analyzed for % Brix using cold digester by dividing the stem into three equal parts. Stem juiciness was scored stem brix was calculated as follows:
(3) The final measurement was the mean of the three samples. Given the same brix reading, this calculation results in an upward adjustment of juicy cultivars over dry ones because at equal brix readings, juicier cultivars have more sugar compared to drier ones (Makanda Citation2009).
Ethanol productivity was calculated using the formulae below:(4)
(5)
(6)
Data analyses
General analyses of variance were performed for all quantitative data using the REML programme of GenStat 17th edition with number of plants as the covariate using a model by Cochran and Cox (Citation1957). Multiple comparisons among variety means were conducted by least significant difference (LSD) test at 5% levels of significance. Cluster analysis was performed using Genstat 18th edition to establish genetic relationships among genotypes. Principal component analysis (PCA) based on the correlation matrix was performed using Genstat to identify influential traits for selection. A PCA bi-plot was plotted using GenStat to show the associations among genotypes based on observed traits. The Pearson's phenotypic correlation analysis was performed in GenStat 17th Edition (Payne et al. Citation2011) to describe the relationship among the morphological traits. Path coefficient analysis was used to calculate direct and indirect effects of traits on ethanol production using the PathSAS programme developed by Cramer and Wehner (Citation2000). Variance components were partitioned using the restricted maximum likelihood (REML) approach in Genstat 17th. Heritability in the broad- sense was calculated using Hallauer and Miranda (Citation1981) as follows:(7) where:
= broad-sense heritability;
= genotypic variance;
= phenotypic variance. The heritability % was categorised as low, moderate; and high in accordance with Robinson et al. (Citation1949) as follows: 0–0.3, low; 0.3–0.6, moderate and >0.6, high. Genetic coefficient of variation (GCV) and phenotypic coefficient of variation (PCV) were computed according to Singh and Chaudhary (Citation1979) and expressed as percentage as follows:
(8)
(9) where:
= genotypic variance;
= phenotypic variance;
= grand mean of trait
. Predicted genetic gain (PG) was calculated by selecting 13% of the superior genotypes and calculated using the following formula (Singh and Chaudhary Citation1979):
(10) where:
= selection differential (1.627) at 13% selection intensity;
= broad-sense heritability;
= phenotypic variance. Finally, predicted genetic gain % (PG %) was calculated as percent of the mean calculated according to Shukla et al. (Citation2006):
(11) where:
= grand mean of trait
.
Results and discussion
Analysis of variance
Genotypes showed highly significant (p < 0.001) differences for all measured traits. The significant differences indicated the existence of high degree of variability among the genotypes (Tesfamichael et al. Citation2015) that could be exploited for sweet stem sorghum improvement.Mean response of test genotypes for eight bioethanol related traits.
shows the mean response of test genotypes for eight bioethanol related traits. Days to flowering varied from 62 to 152 with a mean of 93 days. The genotypes with delayed maturity associated with increased biomass production were AS46, AS434, AS443, AS441 and AS205. Plant height varied from 90 to 420 cm with a mean of 236 cm. The tallest genotypes were AS442, AS443, AS447, AS448 and AS441. Stem diameter ranged from 7 to 31.33 mm with a mean of 16 mm. Genotypes with the thickest stalks included AS143, AS441, AS251, AS250 and AS442. Biomass yield varied from 6.668 to 111.2 t ha−1 with a mean of 30 t ha−1. Genotypes AS203, AS205, AS448, AS443, and AS251 had the highest biomass yield. Stalk dry matter content ranged from 17.2% to 44.2% with a mean of 29.8%, while fibre content varied from 8.92% to 34.8% with a mean of 17.2%. The stalk brix of genotypes varied from 3.3% to 18.9% with a mean of 12. %. Ethanol productivity ranged from 240.9 to 5500 l ha−1 with a mean of 1886 l ha−1.
Table 2. Means of eight bioethanol and related traits of 190 sweet stem sorghum genotypes.
The best ethanol yielding genotypes were AS203, AS391, AS205, AS251 and AS448 providing mean yields of 5474, 4509, 4315, 4205 and 3816 l ha−1, in that order. Genotype AS203 produced over at least 20% ethanol greater than all other genotypes. This can be attributed to the fact AS203, being a South African landrace is well adapted to the environment. The top ethanol producing genotype AS 203 also had the highest biomass yield of 84 t ha−1. However, this genotype was slightly shorter, thinner and had lower stalk brix than genotype AS205. A similar trend was observed for the bottom yielding genotype. Genotype AS12 was the lowest yielding only in terms of ethanol production. But genotype AS 12 was thicker, taller and late maturing than genotypes AS71 and AS194. The trend in ethanol production was not affected by other quantitative traits.
Ethanol productivity of some of the tested genotypes were similar to the yields reported by Regassa and Wortmann (Citation2014). The authors reported the highest ethanol productivity that can be anticipated from sweet stem sorghum as 6000 l ha−1. However, stalk brix, plant height and stem diameter of the experimental genotypes did not reach the maximum of 24%, 480 cm and 45 mm respectively reported by the same authors. Wide variability in plant height (90–270 cm) and days to flowering (50–80 days) were reported by Tesfamichael et al. Citation2015. Elangovan et al. (Citation2014) reported large variation among genotypes in days to flowering (68–100 days), plant height (232–497 cm) and stalk brix (4%–22%). Lekgari and Dweikat (Citation2014) also reported a wide range in days to anthesis of 70–147 days, and plant height of 76–423.8 cm.
Ample genetic variability was detected among the tested sweet stem sorghum genotypes allowing for selection for all the measured traits. Most traits had a low standard deviation (SD) from the mean, with plant height having an SD of 4 cm from a mean of 240 cm and stem diameter having an SD of 4.9 cm from a mean of 15.8 cm. On the other hand, biomass yield had a relatively high SD of 15 t ha−1 from a mean of 30 t ha−1. A relatively low coefficient of variation (<17%) was detected for all traits except for biomass and ethanol production. The high coefficient of variation for both biomass and ethanol production were higher denoting susceptibility to environmental factors influencing their expression to some degree (Sinha and Kumaravadivel Citation2016). The selected top 13% of genotypes produced ethanol yields ranging from 3000 to 5500 l ha−1 (). On the other hand, the bottom 13% produced only 240–880 l ha−1.
Clustering of sweet stem genotypes based on eight bioethanol related traits
presents clustering of test genotypes. Most high ethanol producing genotypes were allocated in Cluster III. Sub-clusters a and b in Cluster III contained genotypes that did not produce much ethanol. All Sub-cluster III-b genotypes were among the top five high ethanol producing genotypes. All the sub-clusters had at least 1 high ethanol producing genotype (in the top 13%) except Sub-clusters I-a, I-b and II-a. This is an indication of a high level of morphological diversity among the tested population. Sub-cluster II-a contained three of the five late maturing genotypes (AS434, AS441, AS443) and four of the five tallest genotypes (AS441, AS442 AS 443, AS 447).
Table 3. Clusters and sub-clusters of 190 sweet stem genotypes based on eight bioethanol related traits.
Phenotypic correlation among bioethanol related traits
The correlation coefficients of the eight quantitative traits assessed are presented in . Correlations among quantitative traits were analyzed in terms of significance, strength and nature of correlation. Several traits showed highly significant (p ≤ 0.001) correlations such as days to flowering with all traits; biomass with ethanol yield and plant height; ethanol with all traits except dry matter; plant height with all traits. Kumar et al. (Citation2012) reported that plant height exhibited significant positive associations with days to flowering, and brix. A strong correlation was recorded between biomass with ethanol production (r = 0.83). Biomass was strongly correlated to days to flowering, ethanol production, plant height and stem diameter. These results were in agreement with Ganesh et al. (Citation1995) and Prasad et al. (Citation2013). Their studies indicated that high biomass with total sugar content is a pre-requisite for high ethanol production. Hence, these traits could be utilised in the sweet sorghum breeding programmes for ethanol production. Selection for these traits would help in achieving highest ethanol productivity. Other strong correlations were detected between days to flowering with plant height and stem diameter, plant height with stem diameter, fibre content with dry matter. From these results, it is evident that these traits are associated with ethanol production and are inter-correlated among them. Thus, the selection in any one of these ethanol yield attributing traits will lead to increase in the other traits, thereby enhancing ethanol production. Stalk brix had a relatively weak positive association with biomass, agreeing with the reports of Bangarwa et al. (Citation1989) and Kumar et al. (Citation2012).
Table 4. Pearson's correlation coefficients, among quantitative traits of sweet stem sorghum genotypes (n = 190).
Path coefficient analysis
is a presentation of the direct and indirect effects of the component traits on ethanol productivity. A few traits exhibited significant (p ≤ 0.001) direct effects on ethanol production including plant height, stem diameter and biomass. Biomass had the greatest direct effect on ethanol production. Hence, it may be concluded that these traits could enhance ethanol production more than other traits. Days to flowering, plant height, stalk brix and stem diameter showed the greatest indirect effects on ethanol production through biomass. Similar results have been reported by Kumar et al. (Citation2012). Since biomass had the highest direct effect on ethanol production, these traits should be considered during future selection programmes. This is in agreement with Naphade (Citation1972), Potdukhe et al. (Citation1994) and Kumar et al. (Citation2012) who reported that days to flowering had an indirect positive association with biomass through plant height, while plant height had indirect positive effect on biomass through days to flowering, which indicated that there is a real association between days to flowering and plant height. Hence, these traits should be considered during progeny selection programme. The strongest indirect effect on ethanol production via biomass was exerted by plant height. The strongest indirect effects on ethanol production via dry matter was fibre content and vice versa.
Table 5. Path coefficients showing direct (bold) and indirect effects of quantitative traits on ethanol production in 190 sweet stem sorghum genotypes.
Principal component analysis (PCA)
is a presentation of the rotated component matrix that displays the allocation of the entire variance explained by various principal components and their associations with quantitative traits. Principal component analysis suggested that only 3 first components (eigen value > 1) are important, and account for 88% of the total variation. This result differed from the studies of Mujaju and Chakauya (Citation2008), Ali, Jabran et al. (Citation2011), and Tesfamichael et al. (Citation2015) who reported on different agro-morphological traits in sweet stem sorghum. Ali, Jabran et al. (Citation2011) reported that out of a total of 21, seven principal components were extracted having Eigen value > 1 and these seven PCs contributed 77.653% of the total variability amongst the sorghum genotypes assessed for various morpho-physiological traits. Tesfamichael et al. (Citation2015) reported that out of the seven PCs, the first 4 explained the majority of the total variation. These four PCs with Eigen value > 1 contributed 74.6% of the total variability amongst the sorghum genotypes assessed for various morpho-physiological traits. In the present study principal component-1 (PC-1) and PC-2 were highly significant, contributing 71% to the total variation. The sign of the loading signifies whether the relationship is positive or negative. The first principal component, which accounted for about 45% of the variation, was strongly associated with plant height, stem diameter, biomass and days to flowering. Therefore selection of tall, thick, high biomass and late maturing genotypes is essential for the breeding programme. Fibre content had a high positive loading into the second principal component while ethanol yield and stalk brix had negative loading into the second principal component. Traits with a high correlation to the third principal component in a negative direction were dry matter and stalk brix. Principal component-3 explained only 18% of the total variation.
Table 6. Rotated component matrix of 8 phenotypic traits of 190 sweet stem sorghum genotypes.
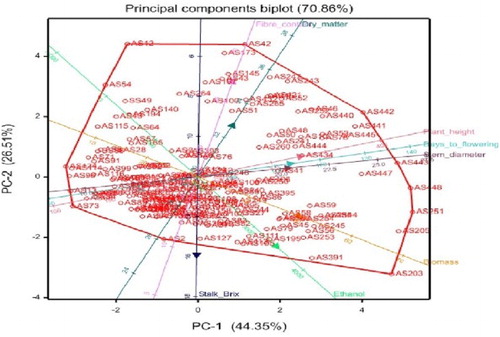
is a presentation of the principal component bi-plot analysis of eight phenotypic traits of 190 sweet stem sorghum genotypes. The bi-plot is illustrative of the associations of the phenotypic traits and the genotypes, with the principal components. According to Mwadzingeni et al. (Citation2016) a high correlation of traits in discriminating genotypes can be observed from traits that have small angles between dimension vectors in the same direction. In the current study, such relationships can be observed among stem diameter, plant height and days to flowering, between ethanol, biomass and stalk brix and between fibre content and dry matter. Genotypes excelling in a particular trait were plotted closer to the vector line and further in the direction of that particular vector, often on the vertices of the convex hull (Mwadzingeni et al. Citation2016). According to the bi-plot the following genotypes: AS391, AS203 and AS205, were the best performers for ethanol yield and biomass because they were closest to these traits and located on the convex hull. Most of the genotypes were scattered in the negative sides of PC-1 and PC-2.
Figure 1. Bi-plot analysis of eight phenotypic traits of 190 sweet stem sorghum genotypes evaluated.
Genetic parameters
In this study all the traits had high heritability (>0.5) (). According to Insan et al. (Citation2016), the characters that have broad genetic variability and high heritability estimates could be influenced by additive gene action. High heritability may not result on high levels of genetic gain (Johnson et al. Citation1955). Therefore it is necessary to oversee heritability estimates alongside genetic gain. In this case, high heritability estimates did not guarantee high predicted gain as the low predicted gain of <30% for most traits did not match the high heritability of >0.8 for most traits. Similar results of low predicted gain were observed by Insan et al. (Citation2016) and such results may be attributed to the non-additive gene effects. On the other hand, high heritability coupled with high levels of genetic gain for traits such as ethanol productivity signified the existence of additive gene action, hence strong response to selection for ethanol productivity (Panse and Sukhatme Citation1964, Citation1989). Medium heritability and low genetic gain indicate the presence of epistatic gene action (Elangovan et al. Citation2014).
Table 7. Predicted genetic gain for eight bioethanol related traits of sweet stem sorghum genotypes selected at 13% selection intensity.
Burton (Citation1952) advocated for the use of genotypic coefficient of variation (GCV) in addition to the heritability estimate in advancing the efficacy of the selection. The phenotypic coefficient of variation (PCV) was higher than the GCV for all traits, indicating the role of environmental factors influencing the expression of the traits to some extent (Godbharle et al. Citation2010; Elangovan et al. Citation2014). Differences in coefficients of variations (both genotypic and phenotypic) were exhibited with the GCV ranging from 12% to 43.2% and PCV varying from 14% to 48.2%. Considering ethanol productivity, the high GCV and PCV values suggested a strong opportunity to select superior genotypes for ethanol productivity. The lower or equal GCV and PCV observed for dry matter, plant height and days to flowering signified that enhancement of these particular traits would be limited (Elangovan et al. Citation2014). Similar results of equal GCV and PCV for plant height in sweet stem sorghum genotypes have also been reported by other researchers (Reddy et al. Citation2009).
The present study selected the best ethanol yielding genotypes including AS203, AS391, AS205, AS251 and AS448 that provided mean yields of 5474, 4509, 4315, 4205 and 3816 l ha−1 in that order. Days to flowering, plant height, stalk brix and stem diameter had the strongest indirect effect on ethanol production through biomass. Since biomass had the strongest direct effect on ethanol production, these traits should be considered during a selection programme.
Acknowledgements
We want to thank to thank Ian Doidge and staff of the African Center of Crop Improvement, University of KwaZulu Natal for help with field work..
Disclosure statement
No potential conflict of interest was reported by the authors.
Notes on contributors
Precious Mangena is a Ph.D. candidate at the University of KwaZulu-Natal. Presently, she is involved on developing superior sweet stem sorghum genotypes for bio-ethanol production.
Hussein Shimelis is a Professor of Plant Breeding at the University of KwaZulu-Natal in South Africa. He is a co-author for the current study.
Mark Laing is a Professor of Plant Pathology at the University of KwaZulu-Natal in South Africa. He is a co-author for the current study.
Additional information
Funding
References
- Akhtar MS, Oki Y, Adachi T, Khan MHR. 2007. Analyses of the genetic parameters (variability, heritability, genetic advance, relationship of yield and yield contributing characters) for some plant traits among brassica cultivars under phosphorus starved environmental cues. J Fac Environ Sci Tech. 12:91–98.
- Ali MA, Abbas A, Awan SI, Jabran K, Gardezi SDA. 2011. Correlated response of various morpho-physiological characters with grain yield in sorghum landraces at different growth phases. J Anim Plant Sci. 21:671–679.
- Ali MA, Jabran K, Awan SI, Abbas A, Zulkiffal M, Acet T, Farooq J, Rehman A. 2011. Morpho-physiological diversity and its implications for improving drought tolerance in grain sorghum at different growth stages. Aust J Crop Sci. 5:311–320.
- Anami SE, Zhang LM, Xia Y, Zhang YM, Liu ZQ, Jing HC. 2015a. Sweet sorghum ideotypes: genetic improvement of the biofuel syndrome. Food Energy Secur. 4:159–177. doi: 10.1002/fes3.63
- Anami SE, Zhang LM, Xia Y, Zhang YM, Liu ZQ, Jing HC. 2015b. Sweet sorghum ideotypes: genetic improvement of stress tolerance. Food Energy Secur. 4:3–24. doi: 10.1002/fes3.54
- Bangarwa KS, Grewal RP, Lodhi GP, Thakral NK. 1989. Association analysis for some quantitative traits in forage sorghum. Indian J Hered. 21:25–28.
- Burton GW. 1952. Quantitative inheritance in grasses 1952. Proceedings of the 6th Grassland conference; August 17–23; Pennsylvania State College p. 227–283.
- Calvino M, Messing J. 2012. Sweet sorghum as a model system for bioenergy crops. Curr Opin Biotechnol. 23:323–329. doi: 10.1016/j.copbio.2011.12.002
- Cochran WG, Cox M. 1957. Experimental designs. New York (NY): John Wiley and Sons Inc.
- Cramer CS, Wehner TC. 2000. Path analysis of the correlation between fruit number and plant traits of cucumber populations. HortScience. 35:708–711.
- Dewey DR, Lu KH. 1959. A correlation and path coefficient analysis of components of crested wheatgrass seed production. Agron J. 51:515–518. doi: 10.2134/agronj1959.00021962005100090002x
- Eggleston G, Cole M, Andrzejewski B. 2013. New commercially viable processing technologies for the production of sugar feedstocks from sweet sorghum (Sorghum bicolor L. Moench) for manufacture of biofuels and bioproducts. Sugar Tech. 15:232–249. doi: 10.1007/s12355-013-0229-6
- Elangovan M, Kiran-babu P, Seetharama N, Patil JV. 2014. Genetic diversity and heritability characters associated in sweet sorghum (Sorghum bicolor (L.) Moench). Sugar Tech. 16:200–210. doi: 10.1007/s12355-013-0262-5
- El Naim AM, Ibrahim IM, Abdel Rahman ME, Ibrahim EA. 2012. Evaluation of some local sorghum (Sorghum Bicolor L. Moench) genotypes in rain-fed. Int J Plant Res. 2:15–20. doi: 10.5923/j.plant.20120201.03
- Ezeaku IE, Mohammed SG. 2006. Character association and path analysis in grain sorghum. Afr J Biotechnol. 5:1337–1340.
- Ganesh S, Fazlullah AK, Suresh M, Senthil N. 1995. Character associated for ethanol yield in sweet sorghum. Madras Agric Cult J. 82:361–363.
- Godbharle AR, More AW, Ambekar SS. 2010. Genetic variability and correlation studies in elite ‘B’ and ‘R’ lines in kharif sorghum. Electron J Plant Breed. 1:989–993.
- Govindaraj M, Selvi B, Rajarathinam S, Sumathi P. 2011. Genetic variability and heritability of grain yield components and grain mineral concentration in India’s pearl millet (Pennisetum Glaucum (L) R. Br.) accessions. Afr J Food Agric Nutr Dev. 11:4758–4772.
- Govindaraj M, Shanmugasundaram P, Muthiah AR. 2010. Estimates of genetic parameters for yield and yield attributes in elite lines and popular cultivars of India’s pearl millet. Afr J Agric Res. 5:3060–3064.
- Hallauer A, Miranda J. 1981. Quantitative genetics in maize breeding. Iowa City (IA): Press, Iowa State University.
- Hlophe HB. 2014. Sweet sorghum (Sorghum bicolor (L.) Moench) response to supplemental irrigation in different growth stages [master’s thesis]. Pretoria: University of Pretoria.
- Insan RR, Wirnas D, Trikoesoemaningtyas. 2016. Estimation of genetic parameters and selection of sorghum (Sorghum bicolor (L.) Moench) RILS F5 derived from single seed descent. Int J Agron Agric Res. 8:95–103.
- Johnson HW, Robinson HF, Comstock RE. 1955. Estimates of genetic and environmental variability in soybean. Agron J. 47:314–318. doi: 10.2134/agronj1955.00021962004700070009x
- Kassahun A, Habtamu Z, Geremew B. 2015. Variability for yield, yield related traits and association among traits of sorghum (Sorghum Bicolor (L.) Moench) varieties in Wollo, Ethiopia. J Plant Breed Crop Sci. 7:125–133.
- Kumar CVS, Umakanth AV, Kotastane TV, Sreelakshmi CH. 2012. Character association and path analysis for qualitative traits in sweet sorghum (Sorghum bicolor L. Moench). J Res. 40:90–93.
- Lekgari A, Dweikat I. 2014. Assessment of genetic variability of 142 sweet sorghum germplasm of diverse origin with molecular and morphological markers. Open J Ecol. 4:371–393. doi: 10.4236/oje.2014.47034
- Lombardi GMR, Nunes JAR, Parrella RAC, Teixeira DHL, Bruzi AT, Durães NNL, Fagundes TG. 2015. Path analysis of agro-industrial traits in sweet sorghum. Genet Mol Res. 14:16392–16402. doi: 10.4238/2015.December.9.8
- Makanda I. 2009. Combining ability and heterosis for stem sugar traits and grain yield components in dual-purpose sorghum (Sorghum bicolor L. Moench) germplasm [PhD thesis]. Pietermaritzburg: University of KwaZulu-Natal.
- Mangena P. 2014. Breeding gains, cytoplasmic effects and path coefficient analysis in pro-vitamin A maize hybrids [master’s thesis]. Pietermaritzburg: University of KwaZulu-Natal.
- Mathur S, Umakanth AV, Tonapi VA, Sharma R, Sharma MK. 2017. Sweet sorghum as biofuel feedstock: recent advances and available resources. Biotechnol Biofuels. 10:146–165. doi: 10.1186/s13068-017-0834-9
- Morrissey K, Thoma D. 2017. Life cycle assessment of sweet sorghum as feedstock for second-generation biofuel production [honors thesis]. Fayetteville (AR): University of Arkansas.
- Mujaju C, Chakauya E. 2008. Morphological variation of sorghum landrace accessions on-farm in semi-arid areas of Zimbabwe. Int J Botany. 4:376–382. doi: 10.3923/ijb.2008.376.382
- Mullet J, Morishige D, McCormick R, Truong S, Hilley J, McKinley B, Anderson R, Olson SN, Rooney W. 2014. Energy sorghum—a genetic model for the design of C4 grass bioenergy crops. J Exp Bot. 65:3479–3489. doi: 10.1093/jxb/eru229
- Mwadzingeni L, Shimelis H, Tesfay S, Tsilo TJ. 2016. Screening of bread wheat genotypes for drought tolerance using phenotypic and proline analyses. Front Plant Sci. 7:1276. doi: 10.3389/fpls.2016.01276
- Naphade DS. 1972. Correlation and path analysis for some characters contributing to fodder yield in sorghum. Indian J Agric Sci. 42:790–791.
- Panse VG, Sukhatme PV. 1964. Statistical methods for agricultural workers. 2nd ed. New Delhi: Indian Council of Agricultural Research.
- Panse VG, Sukhatme PV. 1989. Statistical methods for agricultural workers. New Delhi: Indian Council of Agricultural Research.
- Payne RW, Murray DA, Harding SA, Baird DB, Soutar DM. 2011. An introduction to GenStat for Windows. 14th ed. Hemel Hempstead: VSN International.
- Potdukhe NR, Shekar VB, Thote SG, Wanjari SS, Ingle RW. 1994. Estimates of genetic divergence, correlation coefficient and path analysis in grain yield in sorghum (Sorghum bicolor (L.) Moench). Crop Res. 7:402–406.
- Prakasham RS, Nagaiah D, Vinutha KS, Uma A, Chiranjeevi T, Umakanth AV, Srinivasa Rao P, Yan N. 2014. Sorghum biomass: a novel renewable carbon source for industrial bio-products. Biofuels. 5:159–174. doi: 10.4155/bfs.13.74
- Prasad S, Kumar A, Muralikrishna KS. 2013. Assessment of ethanol yield associated characters in sweet sorghum. Maydica. 58:299–304.
- Ratnavathi C, Chakravarthy S, Komala V, Chavan U, Patil J. 2011. Sweet sorghum as feedstock for biofuel production: a review. Sugar Tech. 13:399–407. doi: 10.1007/s12355-011-0112-2
- Reddy DCS, Audilakshmi S, Seetharama N. 2009. Genetic variability and divergence for DUS testing traits in sorghum (Sorghum bicolor). Indian J Agric Sci. 79:286–290.
- Regassa TH, Wortmann CS. 2014. Sweet sorghum as a bioenergy crop: literature review. Biomass Bioenergy. 64:348–355. doi: 10.1016/j.biombioe.2014.03.052
- Robinson H, Comstock RE, Harvey P. 1949. Estimates of heritability and the degree of dominance in corn. Agron J. 41:353–359. doi: 10.2134/agronj1949.00021962004100080005x
- Sami RA, Yeye MY, Usman IS, Hassan LB, Usman M. 2013. Studies on genetic variability in some sweet sorghum (Sorghum Bicolor L. Moench) genotypes. Acad Res J. 1:1–6.
- Shukla S, Bhargava A, Chatterjee A, Sirivastava J, Singh N, Singh NP. 2006. Mineral profile and variability in vegetable amaranth (Amaranthus tricolor). Foods Hum Nutr. 61:23–28.
- Singh RK, Chaudhary BD. 1979. Biometrical methods in quantitative genetic analysis. New Delhi: Kalyani Publishers.
- Sinha S, Kumaravadivel N. 2016. Understanding genetic diversity of sorghum using quantitative traits. Scientifica. 2016:1–8. doi: 10.1155/2016/3075023
- Tesfamichael A, Githiri SM, Kasili R, Araia W, Nyende AB. 2015. Genetic variation among sorghum (Sorghum bicolor L. Moench) landraces from Eritrea under post-flowering drought stress conditions. Am J Plant Sci. 6:1410–1424. doi: 10.4236/ajps.2015.69141
- Tesfaye WM, Adugna W, Tsige G. 2014. Correlation and path coefficient analysis among yield component traits of Ethiopian mustard (Brassica Carinata a. Brun) at Adet, Northwestern, Ethiopia. J Plant Sci. 2:89–96.
- Vanderlip RL, Reeves HE. 1972. Growth stages of sorghum [Sorghum bicolor, (L.) Moench.]1. Agron J. 64:13–16. doi: 10.2134/agronj1972.00021962006400010005x
- Vermerris W. 2011. Survey of genomics approaches to improve bioenergy traits in maize, sorghum and sugarcane free access. J Integr Plant Biol. 53:105–119. doi: 10.1111/j.1744-7909.2010.01020.x
- Wright S. 1921. Systems of mating. Genetics. 6:111–178.
- Yaqoob M, Hussain N, Rashid A. 2015. Genetic variability and heritability analysis for yield and morphological traits in sorghum (Sorghum Bicolor L. Moench) genotypes. J Agric Res. 53:331–343.