
ABSTRACT
Application of water-saving irrigation technologies in transplanted rice (TPR) cultivation resulted in different soil water regimes compared to traditional flood irrigation and consequent diverse nitrogen transport and losses in paddy fields. In this study, nitrogen transport and transformations in a TPR field under multiple shallow irrigation (MSI) conditions in the Taihu Lake Basin of Eastern China were observed and simulated (Hydrus-1D model) during the 2008 and 2009 seasons based on a previous study. MSI controlled well the depth of floodwater and reduced nitrogen losses substantially through percolation and surface runoff, in particular during the 2008 season with relative less rainfall. Nitrogen balance analysis showed that both denitrification and NH3 volatilisation were the two major paths of nitrogen loss during the two seasons. Most nitrogen transformations occurred in top soil (0–40 cm) during early-middle seasons. The overall nitrification and denitrification differed slightly between the two seasons but largely between soil depths, averagely 92.7% and 73.0% of respective total in a 120 cm soil profile occurred in 0–40 cm soil, respectively. MSI method coupled with deep applied fertiliser is recommended to substantially reduce nitrogen losses through surface runoff, percolation, and NH3 volatilisation in TPR fields.
Introduction
Historically and currently, rice is major food source worldwide, particularly in Asian countries (Bouman and Tuong Citation2001; Rejesus et al. Citation2011). Rice is a heavy water and nitrogen (N) consumer, but water for rice production is increasingly becoming scarce due to the increasing demand for water from the ever-growing population and other industries (Roost et al. Citation2008; Tan et al. Citation2015). Consequently, various cultivation methods and water-saving strategies, as well as optimal fertiliser techniques, have been developed to reduce water and N inputs without substantial yield decline (Tan et al. Citation2015). Transplanted rice (TPR) cultivation has gained farmers’ support in China because of its stable yield and mature management techniques, although some new cultivation methods (e.g. direct-seeding) have appeared in recent years (Chen et al. Citation2009). Generally, N fertiliser applied in an irrigated paddy field is mostly lost through ammonia (NH3) volatilisation (AV), nitrification, denitrification, and percolation (Xing et al. Citation2009; Dong et al. Citation2017), which are mainly subject to soil water regime, crop variety, and climate. Among these, AV and denitrification are usually considered the most important pathways of N loss after N fertiliser application.
With the application of water-saving irrigation technologies in TPR cultivation, soil water regimes and soil environments consequently differ with traditional flood irrigated paddy fields, leading to diverse N transport and losses in paddy fields (Ye et al. Citation2013; Karandish and Simunek Citation2017). Many studies (Belder et al. Citation2005; Peng et al. Citation2011; Siyal et al. Citation2012; Yang et al. Citation2013) have reported that soil water regimes under water-saving irrigation benefit by reducing N losses through surface runoff and percolation, and possibly even volatilisation, and further increase N use efficient. Tan et al. (Citation2015) reported that an alternate wetting and drying (AWD) irrigation decreased N loss 5.0%–11.2% and 3.0%–23.5% by percolation in 2007 and 2008 seasons, respectively, compared to continuous flooding irrigation, but increased loss 6.0%–22.0% and 2.5%–11.7% by volatilisation and 6.7%–19.8% and 4.1%–11.2% by denitrification, respectively. AWD irrigation increased water use and N use efficiencies compared to continuous flooding irrigation. Furthermore, with AWD cycles, water-saving irrigation strengthens the air exchange between soil and atmosphere, thus supplying sufficient oxygen to the root system to accelerate soil organic matter mineralisation and inhibit soil N immobilisation (Tan et al. Citation2013). Growing lowland rice with AWD seems to be more beneficial than with continuous flooding because of the promoted formation of under AWD (Tan et al. Citation2013; Ye et al. Citation2013).
In the Lake Taihu Basin of China, the yearly average applied N fertiliser reaches about 300 kg ha−1 and even more for rice production (Huang et al. Citation2007; Lin et al. Citation2007; Zhao et al. Citation2012). Increased fertiliser application, which correspondingly causes more N losses through surface runoff and percolation, has gradually deteriorated surface- and ground-water environments (Zhao et al. Citation2012). To reduce water input and N losses, water-saving irrigation techniques such as AWD irrigation, intermittent irrigation, and multiple shallow irrigation (MSI) methods have been adopted in this region in recent years (Liu et al. Citation2014; Yang et al. Citation2017). Generally, water-saving irrigation substantially reduces N losses through surface runoff and percolation, but gaseous N from nitrification and denitrification has also been frequently reported as an important N loss pathway (Lan et al. Citation2014; Wang et al. Citation2017). Furthermore, N balance and loss amounts would consequently change with changing soil water regimes implementing water-saving irrigation, thus, N transformations and losses in a TPR field must be explored under water-saving irrigated conditions.
In our previous study (Li et al. Citation2017), we investigated the soil water regimes and water balance in a TPR field under MSI conditions during the 2008 and 2009 seasons. Building on that knowledge, in this study we aimed to analyze the N transport and transformations in the TPR field under MSI conditions over the two growing seasons (2008–2009) and then compared the difference in N losses with other studies to investigate the effects of MSI on the N balance. Furthermore, nitrification and denitrification at different soil layers under MSI conditions are prominently discussed and compared with other reports in this region. Hydrus-1D model simulations were used to better understand N transport and transformation processes in the experimental paddy field. Finally, optimal water and fertiliser managements for TPR cultivation were proposed.
Materials and methods
Field experiments and measurements
Site description
The study site is located in the Dangyang region (31°56′N, 119°43′E), upstream of Lake Taihu in eastern China. Lake Taihu Basin has a subtropical monsoon climate with an average annual rainfall of 1181 mm, 60% of which occurs from May through September. The annual pan evaporation from the water surface is approximately 822 mm, and the average annual air temperature is 15°C –17°C. The agricultural land in the Taihu Lake Basin is used for intensive rice crop production. Different cultivations of rice are currently grown in this region, including TPR, direct-seeded rice (DSR), and seedling-thrown rice. TPR remains dominant in this region, mostly rotating with either wheat or rape crops. The predominant soil type in this region is classified as a hydromorphic paddy soil, and the parent material is a lacustrine deposit. Basic physical and chemical properties of soil in the experimental field were described in detail in Li et al. (Citation2014, Citation2015, Citation2017). Selected properties of the paddy soil were recorded here (). The groundwater table at the experimental field slightly fluctuated during rice seasons, but remained around a depth of 120 cm (between 117.7 and 121.8 cm) below the soil surface, influenced by an adjacent draining pond (Li et al. Citation2014).
Table 1. Selected physical and chemical properties of the tested soil in the Taihu Lake Basin of Eastern China.
Experimental design
Before cultivation, top soil in the experimental paddy field was plowed and levelled by an agricultural machine, mixing old wheat stubble (about 20 cm high) into the soil. The variety of rice used for the TPR cultivation was Wuxiangjing 14 (a lowland rice), a type of Japonica rice predominantly cultivated in the Dangyang region. A water-saving irrigation method, MSI, was implemented in the TPR experiment to reduce losses of water and associated nutrients. Details about water management as well as evaporation, surface runoff, and drainage fluxes are described in detail in Li et al. (Citation2017). Total rainfall and irrigation were 49.6 and 45.0 cm, respectively, during the 2008 season and were 96.4 and 24.0 cm during the 2009 season. Heavy rainfall events during the 2009 season resulted in more water losses as surface runoff and percolation compared to the 2008 season. The MSI method for TPR decreased total irrigation water and corresponding water losses compared to the conventional irrigation method for DSR in the same field (Li et al. Citation2014, Citation2017).
Fertilisation management for the MSI TPR was guided by recommendations from the local Agricultural Technical Guidance Station. The total quantity of N in each rice season was 220 kg ha−1, applied in 3 applications (). The basal fertiliser (BF) was a compound fertiliser, consisting of about 15% of N. BF was evenly applied by hand on 19 June 2008, and 14 June 2009 and mixed in the top soil (about 10 cm deep) by a machine. Rice seedlings (about 1-month age) were then mechanically transplanted 2 days after each BF application (i.e. 21 June 2008, and 16 June 2009). During two additional applications, fertiliser was top-dressed (TF) with flood water in the form of urea (the content of N was about 46%) at the following N rates: 66 (TF1) and 66 (TF2) kg ha−1. The total growing periods for the TPR during the two seasons were each 128 days.
Table 2. Agricultural activities for the transplanted rice under multiple shallow irrigation in the Taihu Lake Basin of China.
Fertiliser management for the synchronous cultivated DSR in the same field was different from the MSI TPR of this study although the total applied N was also 220 kg ha−1. The total N fertiliser for DSR was applied in 5 applications, one for BF (33 kg ha−1) and four for TF (44, 55, 44, and 44 kg ha−1, respectively). Details of water and fertiliser management for DSR are found in Li et al. (Citation2014, Citation2015).
Measurements and analysis
Descriptions of all sampling methods and measurements, including AV, concentrations of and
in floodwater and soil solutions, the percolation N fluxes at a depth of 60 cm, and input and output N quantities, were described in detail in Li et al. (Citation2015) but are briefly described. Floodwater in the paddy field was sampled daily after irrigating/raining until no floodwater. Surface runoff water was sampled hourly at outlets when they were draining. Cumulative N loss from surface runoff was calculated by multiplying water flux (Li et al. Citation2017) with corresponding
and
concentrations. Soil solutions were collected once a week throughout the growing season using porous ceramic cups (60 mm long) embedded into the soil at 20, 40, 60, 80, and 100 cm depths before transplanting. All solution samples were used to analysis
and
concentrations.
Before experiments, self-made flux lysimeters for measuring percolated water fluxes (Li et al. Citation2014) were installed at a depth of 60 cm below the soil surface. Each device consisted of an open-cylinder (25 cm in diameter × 12 cm in height) that was connected to a glass bottle. Percolated water that was collected in the cylinder flowed into the outside glass bottle through a flexible tube. The water volume in the bottle was measured once every two weeks. Cumulative N percolation at 60 cm depth was determined by multiplying the N concentrations at 60 cm depth with corresponding water fluxes. and
concentrations were measured using standard colorimetric methods and flow injection analysis (FIA-6000, Skalar, Breda, Netherlands).
AV was observed daily after fertiliser application and then twice weekly thereafter and was measured using the H2SO4 trap method (Sarkar et al. Citation1991; Kyaw et al. Citation2005). The measurement frequency was three times per day with 2 h of sampling time, which was, in principle, 7:30–9:30, 12:00–14:00, and 16:30–18:30. Three semi-open cylindrical PVC chambers with 15 cm diameter and 20 cm height were placed in each plot and inserted into soil at a depth of 5 cm to capture NH3. Each time two fresh filter disks (Ф9.5 cm) with 1 N H2SO4-impregnated were fixed in the chamber, the upper one to prevent NH3 from air and bottom one to trap the NH3 from soil. The NH3 trapped onto the bottom filter was extracted by deionised water. The concentration of the total dissolved NHX−N was determined by a flow injection analyzer (FIA-6000, Skalar, Breda, Netherlands) for estimating NH3 volatilisation. Cumulative AV during a season was calculated by integrating linearly interpolated gas emissions on sampling days.
Rice growth indexes were observed once every 15 days. Total N (TN) content in the plant samples was determined by automatic combustion in tin (Sn) capsules and analyzed using a stable isotope mass spectrometer (MAT253, Thermo Fisher Scientific, MA, USA). Cumulative TN uptake was determined as the product of the TN content of the rice tissue and the dry weight (Kyaw et al. Citation2005).
Hydrus-1D model
Model description
The one-dimensional Hydrus-1D computer programme was used to simulate N movement and transformations on vertical soil profile in the experimental field, described in detail elsewhere (Šimůnek et al. Citation2012; Li et al. Citation2014, Citation2015). A 120 cm depth soil profile was evenly dispersed into 240 grids on the vertical in the Hydrus-1D simulation. The van Genuchten soil hydraulic parameters (van Genuchten Citation1980), θr, θS, m, α, n, and saturated hydraulic conductivity Ks, were directly adopted from Li et al. (Citation2014), a previous study in the same field. The pore connectivity parameter (l) was assumed equal to an average value of 0.5 (van Genuchten Citation1980). The rice root system was assumed mostly concentrate at 5–10 cm depth and the maximum root depth was set as 40 cm. The input parameters for the solute transport part of Hydrus-1D, including N transport and transformations and root N uptake (started from day 30 in the DSR), were initially adopted from Li et al. (Citation2015).
Two dominant inputs of N, fertiliser applications and mineralisation of organic N, were considered in the Hydrus-1D simulations in this study, whereas other inputs of N, such as from atmospheric depositions and irrigation water, were omitted. Similar to Li et al. (Citation2015), the following N transformation processes were considered: (1) hydrolysis of urea to ; (2) mineralisation of organic N to
; (3) NH3 volatilisation; (4) nitrification of
to
; (5) denitrification of
; (6) adsorption of
; and (7) rice root uptake of
and
. Unlimited passive uptake of
was allowed in the root solute uptake model (Šimůnek and Hopmans Citation2009). By considering active uptake in addition to passive uptake for
rather than considering only passive uptake for
, we ensured that
uptake accounted for approximately 75% of the total N uptake (Kirk and Kronzucker Citation2005; Li et al. Citation2006). The Michaelic-Menten constant for the active uptake of
was assumed equal to 0.31 mg L−1 (Wang et al. Citation1994; Duan et al. Citation2007). Maximum allowed uptake concentrations of
and
were assumed unrestricted in this study.
Initial and boundary conditions
The initial conditions of water flow were defined using the measured pressure head distribution. The soil surface was subject to the atmospheric boundary condition (BC) with specified daily values of precipitation, irrigation, and evaporation. During the soil drying stage and the last 2 weeks before harvest, the upper BC was set equal to an ‘Atmospheric BC with Surface Runoff’, and during the remainder of the season, the upper BC was set equal to an ‘Atmospheric BC with a Surface Layer’ (with maximum water depths of 6 cm during the first 10 days after transplanting and 10 cm during remaining growth stages, respectively). Potential values of EP and TP and measured irrigation and rainfall were used to represent the atmospheric BC. Detailed initial and boundary conditions for water flow are in Li et al. (Citation2017).
The initial conditions of solute were defined using the measured solute profiles in soil, assuming the BF was well mixed in the top 10 cm soil layer and set as the initial conditions. TF was set as a concentration BC in floodwater. The top boundary for solute transport (NH3) was set as a ‘volatile’ BC (Tang and Riley Citation2013) with a stagnant boundary layer of 2.5 cm (calibrated using observed AV data from the 2008 season). The bottom boundary for solute transport was set as a ‘zero concentration gradient’ BC (Šimůnek et al. Citation2012).
Input parameters
Solute transport parameters were considered using the following values: the molecular diffusion coefficients in free water (Dw) for and
were 1.52 and 1.64 cm2 day−1, respectively, the molecular diffusion coefficient in air (Da) for NH3 was 18057.6 cm2 day−1, the longitudinal dispersivity (12 cm) was considered equal to one-tenth of the profile depth (Phogat et al. Citation2012), and the Henry's law constant (KH, at 25°C) for
was 2.95 × 10⁻⁴ (Renard et al. Citation2004). The distribution coefficients (Kd) for
and for different soil layers () are based on values for this region reported by(Chen and Chiang Citation1963). The N reaction parameters were initially adopted from a previous study for DSR in the same field (Li et al. Citation2015) and then adjusted for individual soil layers to fit observed data (). We assumed here that mineralisation and immobilisation occurred only in the root zone (Moreno-Cornejo et al. Citation2014), and that they can be represented by a single comprehensive production rate for
(Antonopoulos Citation2010; Roberts et al. Citation2011).
Table 3. Nitrogen transformation parameters in soil used in the Hydrus-1D simulations in Lake Taihu Basin, China.
Model evaluation
Simulated values of the AV, and
concentrations, and percolation N fluxes at a depth of 60 cm were compared with the observed data in the experimental paddy field during the 2008 and 2009 seasons. The correspondence between simulated and observed data was evaluated using the root mean square error (RMSE), the Nash–Sutcliffe modelling efficiency (E) (Nash and Sutcliffe Citation1970), and the index of agreement (d) (Willmott Citation1981), calculated as:
(1)
(2)
(3) where Si and Mi are simulated and measured values, respectively, M is the mean of the measured data, and n is the number of compared values.
In general, the closer root mean square error (RMSE) is to 0, the more accurate the model is. Nash–Sutcliffe modelling efficiencies (E) can range from −∞ to 1. An efficiency of 1 corresponds to a perfect match between simulated values and observed data. E = 0 indicates that the simulations are as accurate as the mean of the observed data, whereas an efficiency less than zero (−∞ < E < 0) occurs when the observed mean is a better predictor than the simulation. Essentially, the closer the model efficiency is to 1, the more accurate the model is. Index of agreement (d) is a measure of the degree to which the simulated variation precisely estimates the observed variation. The value of d is unity when there is a perfect agreement (Nangia et al. Citation2008).
Results
Model assessment
Input parameters of water flow had been assessed in a previous study (Li et al. Citation2017) and they were directly used in the simulations in this study. Detail calibrated process could be found in a previous study for the DSR in the same field (Li et al. Citation2015). Only the calibrated results were briefly showed here. We used the ‘trial and error’ method to correct the input parameters of N transport and transformation used in the Hydrus-1D model (). Observed data during the 2008 season including AV rate, N concentration in flood water and percolation water, cumulative N flux at a depth of 60 cm, and TN in plant were used calibrate the model parameters and those during the 2009 season were used to verify them.
Simulated results are in reasonable agreement with observed data, with relatively low values of RMSE and high values of E and d (). Comparably, the values of both E and d during the 2009 season are mostly lower than those during the 2008 season, but the simulated results during the 2009 season still agree well with the observed data. Simulated results of during the two seasons fit with observed data better than
, in particular at deep soil. The values of E (−1.559) and d (0.357) of
concentrations at a depth of 80 cm are relatively low compared to the
and pull low the average values of E (−0.372) and d (0.654) of
and
. Additionally, the RMSE values during the 2008 and 2009 seasons are all relatively small and acceptable. Overall, the input parameters of N transport and transformation for Hydrus-1D simulations are reasonable and acceptable.
Table 4. Statistical indices (RMSE, E, d, and n) for assessing nitrogen (N) transport and transformation parameters using in Hydrus-1D simulations in the experimental transplanted rice field during the 2008 and 2009 seasons.
Nitrogen in floodwater and its loss by surface runoff
Simulated and observed concentrations in floodwater during the 2008 and 2009 seasons responded well with fertiliser application events (). Simulated
ranged from 0.12 to 12.50 mg L−1 (average 1.84 mg L−1) during the 2008 season ((a)) and from 0.12 to 9.60 mg L−1 (average 1.95 mg L−1) during the 2009 season ((b)). The
reached a similar peak value of 9.6 mg L−1 about 2 days after the BF application (DAB) during the two seasons and declined rapidly within about 15 days. The TF1 and TF2 caused different peak values of
in floodwater during the two seasons.
Figure 1. Simulated (Sim.) and observed (Obs.) and
concentrations in floodwater during the 2008 (a) and 2009 (b) seasons. P+I: precipitation and irrigation; BF: basal fertiliser; TF1 and TF2: topdressing fertiliser; the arrows at the top indicate fertiliser applications; DAB: days after basal fertiliser application.
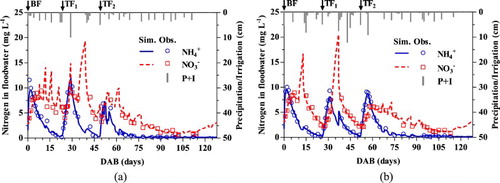
concentration distributions also responded well with fertiliser application events during the two seasons. After fertilising,
increased rapidly but
declined rapidly in floodwater (). The
reached peak values of 19.3 and 20.5 mg L−1 after TF1 application during the 2008 and 2009 seasons, respectively. Overall, peaks of
lagged about 10–15 days behind the
peaks after the BF application and about 5–10 days after the TF1 application. After the TF2 application, however, no apparent peaks of
were observed during the two seasons. Average
concentrations in floodwater were 5.0 and 4.5 mg L−1 during the 2008 and 2009 seasons, respectively.
During the 2009 season, the water lost through surface runoff (7.7 cm, occurred on both 43 and 45 DAB) after the TF1 application carried off and
amounting to about 1.5 and 2.6 kg ha−1, respectively, with average concentrations of 2.1 and 3.6 mg L−1, whereas during the 2008 season, MSI controlled well the depth of floodwater, and no surface runoff occurred (Li et al. Citation2017).
Ammonia volatilisation
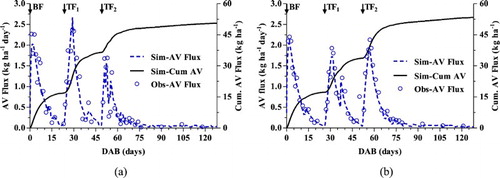
Similar to the concentrations in floodwater, AV flux distributions responded well with the fertiliser applications (), increasing and then rapidly dropping after each fertiliser application. On about 2 DAB, the AV fluxes reached a similar peak value of about 2.1 kg ha−1 day−1 during the 2008 and 2009 seasons and quickly dropped within about 10 days. The TF1 during the 2008 season ((a)) caused a relatively higher peak value of AV flux (about 2.7 kg ha−1 day−1 on 28 DAB) than that during the 2009 season (about 1.7 kg ha−1 day−1 on 31 DAB) ((b)), whereas the TF2 application during the 2009 season resulted in a relatively higher AV flux peak than that during the 2008 season. During late seasons, the AV fluxes remained at a low rate of about 0.05 kg ha−1 day−1, mainly caused by N mineralisation. Simulated cumulative AV fluxes during the 2008 and 2009 season were 50.6 and 53.4 kg ha−1 with averages of 0.40 and 0.42 kg ha−1 day−1, respectively, accounting for about 23.0% and 24.3% of the total applied N (220 kg ha−1).
Figure 2. Simulated (Sim) and observed (Obs) ammonia volatilisation (AV) fluxes and simulated cumulative (Cum) AV fluxes during the 2008 (a) and 2009 (b) seasons. BF: basal fertiliser; TF1 and TF2: topdressing fertiliser; the arrows at the top indicate fertiliser applications; DAB: days after basal fertiliser application.
Rice uptake nitrogen
The simulated N uptake proceeded rapidly after transplanting, reached about 95.0 kg ha−1 during the 2008 season and 91.8 kg ha−1 during the 2009 season, and then increased gradually during the late seasons (), responding well with the rice growth. Cumulative N uptake quantities at harvesting were 118.5 and 116.8 kg ha−1 during the 2008 and 2009 seasons, respectively.
Figure 3. Simulated cumulative (Cum.) nitrogen uptake (,
, and total) and observed (Obs.) total nitrogen uptake during the 2008 (a) and 2009 (b) seasons. DAB: days after basal fertiliser application.
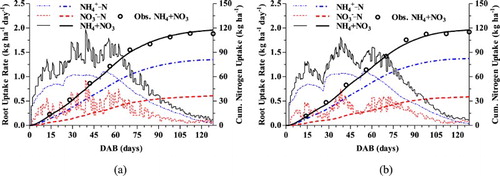
was the main form of N uptake by rice roots over the entire season (). The uptake rates for
peaked on 56 DAB during the 2008 season and on 52 DAB during the 2009 season at a similar value of about 1.1 kg ha−1 day−1. The uptake rates for
varied frequently during the two seasons, depending on both the
uptake rate and available
in surface soil. Averages of uptake rates for
and
were 0.63 and 0.28 kg ha−1 day−1, respectively, during the 2008 season, and 0.64 and 0.27 kg ha−1 day−1 during the 2009 season.
 and concentrations in soil profile
concentrations at different soil depth responded well to the fertiliser application events but lagged several days (). The
at 20 cm depth increased rapidly after the BF application, and reached respective maximum values of 5.8 mg L−1 on 10 DAB during the 2008 season ((a)) and 6.0 mg L−1 on 9 DAB during the 2009 season ((c)). Subsequently, the
at 20 cm depth declined rapidly and then increased slightly until the TF application. TF2 caused little increase in
at 20 cm depth during the 2008 season but a great increase during the 2009 season.
at 40 cm depth increased slowly during early season (i.e. during fertilising stages), and remained relative stable during the remainder of the season. The
at both depths of 60 and 80 cm increased slightly and peaked on about 65 DAB, but gradually declined to initial values at harvest ((a,c)). Fertiliser application apparently increased the
at both 20 and 40 cm depths but had little influence at deeper depths.
Figure 4. Comparison of simulated (Sim.) and observed (Obs.) (a, c) and
(b, d) concentrations at 20, 40, 60, and 80 cm depths during the 2008 (a, b) and 2009 (c, d) seasons. BF: basal fertiliser; TF1 and TF2: topdressing fertiliser; the arrows at the top indicate fertiliser applications; DAB: days after basal fertiliser application.
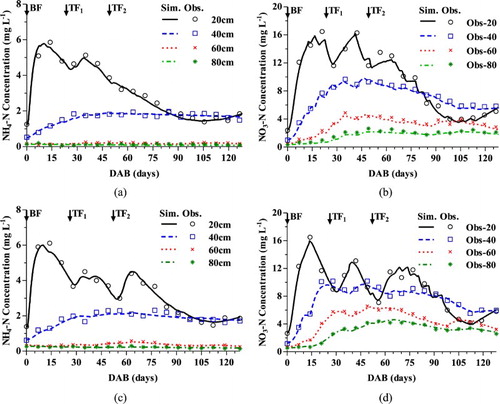
Compared to in soil, the
concentrations at different depths varied widely and also responded well with fertilisation ((b,d)). During the 2008 season, BF and TF1 apparently resulted in large increases in
at 20 cm depth ((b)), whereas during the 2009 season the TF1 resulted in a relatively lower increase ((d)). During both 2008 and 2009 seasons, the
at 20 cm depth reached about 16 mg L−1 after BF and about 12 mg L−1 after TF2. The TF2 during the 2009 season caused a more considerable increase in
at 20 cm depth than during the 2008 season. After the fertilising stage, the
at 20 cm depth declined rapidly and increased slightly during last 2 weeks ((b,d)), as did
((a,c)). The
at 40 cm depth increased continuously after BF application and reached peak values after TF1 and subsequently declined gradually. At both 60 and 80 cm depths, the
still responded well with the fertiliser events during both 2008 and 2009 seasons but lagged more days compared to upper depths.
Percolating nitrogen flux at different depth
Percolation fluxes of at the soil surface increased mainly before 65 DAB (i.e. during fertilising stages) during the two seasons and then maintained relatively stable values until harvest, whereas those at 20, 40, and 60 cm depths increased gradually throughout the seasons with relatively lower increases (). The percolation fluxes of
declined considerably with soil depth. Simulated cumulative
flux at the surface during the 2008 season were 18.0 kg ha−1 and gradually fell to 11.2 kg ha−1 at 20 cm depth, 4.4 kg ha−1 at 40 cm depth, and 0.5 kg ha−1 at 60 cm depth ((a)), whereas during the 2009 season, they declined from 21.9 kg ha−1 at the surface, to 17.6 kg ha−1 at 20 cm depth, 7.7 kg ha−1 at 40 cm depth, and 1.6 kg ha−1 at 60 cm depth ((b)). During both 2008 and 2009 seasons, the
fluxes below 40 cm depth declined sharply compared to upper depths. Average percolation fluxes of
at 60 cm depth were about 0.004 and 0.013 kg ha−1 day−1 throughout the 2008 and 2009 seasons, respectively.
Figure 5. Simulated (Sim) cumulative nitrogen fluxes at 0, 20, 40, and 60 cm depths below the soil surface and observed (Obs) cumulative (Cum.) nitrogen fluxes at the 60 cm depth during the 2008 (a) and 2009 (b) seasons. DAB: days after basal fertiliser application.
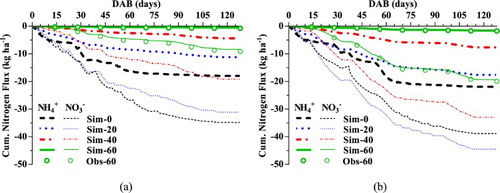
Similar to the fluxes,
percolation fluxes in the paddy soil increased mainly during fertilising stages and increased gradually during the remainder of the season ().
percolation fluxes still responded well to the fertiliser application, particularly at both the surface and 20 cm depth. During the 2008 season, the cumulative percolation fluxes of
reached 34.8 kg ha−1 at the surface and gradually declined to 31.1 kg ha−1 at 20 cm depth, 19.1 kg ha−1 at 40 cm depth, and 8.4 kg ha−1 at 60 cm depth ((a)) whereas during the 2009 season, they increased from 38.8 kg ha−1 at the surface, to 44.5 kg ha−1 at 20 cm depth, and then declined to 33.0 kg ha−1 at 40 cm depth, and 19.3 kg ha−1 at 60 cm depth ((b)). Average percolation fluxes of
at 60 cm depth were about 0.065 and 0.151 kg ha−1 day−1 throughout the 2008 and 2009 seasons, respectively. Comparably,
percolation flux was much higher than
during both 2008 and 2009 seasons. Observed data also showed that the
concentrations in soil were much higher than
concentrations ().
Nitrification and denitrification in soil
Nitrification and denitrification amounts in the TPR field under MSI were simulated for the 2008 and 2009 seasons (). Small differences were found for both between the two seasons, with simulated nitrification and denitrification rates averaging 1.5 and 1.1 kg ha−1 day−1 during the 2008 season and 1.6 and 1.2 kg ha−1 day−1 during the 2009 season, respectively. Nitrification and denitrification quantities differed considerably between soil layers (). The nitrification quantities in the root zone (0–40 cm soil layer) were about 93.7% and 91.6% of their total amounts in the 120 cm soil profile during the 2008 and 2009 seasons, respectively. Similarly, the denitrification quantities mainly occurred in the root zone, with 76.3% during the 2008 season and 69.7% during the 2009 season. In addition, major nitrification and denitrification occurred during early-middle rice season (i.e. before 65 DAB), averaging 72% and 65% of the total, respectively, during the two seasons.
Table 5. Simulated nitrification and denitrification amounts (kg ha−1) in soil in the multiple shallow irrigated transplanted rice field during the 2008 and 2009 seasons.
Discussion
Nitrogen balance analysis
Generally, N transport and transformations are complex in paddy fields, in particular with different water and fertiliser managements, crops, and climates, and N balance analysis could better elucidate the N whereabouts and benefit to fertiliser management. N mineralisation in paddy field is often considered an important source being next only to the applied fertiliser (Moreno-Cornejo et al. Citation2014), and alternate wetting-drying cycles possibly increase mineralisation of N in soil (Mikha et al. Citation2005). In this study, fertiliser and mineralisation were considered the input N sources in the experimental MSI-TPR field, and both were considered to mainly process in top soil (0–40 cm). Increase N sources by mineralisation accounted for about 30.0% and 35.3% of total N inputs (TNI) during the 2008 and 2009 seasons, respectively. N balance analysis in a 60 cm soil profile based on simulated results () shows that N was lost through AV by 16.1% of the TNI, surface runoff by 0%, and percolation by 2.8% during the 2008 season, whereas they accounted for about 15.7%, 1.2%, and 6.1%, respectively, of the TNI during the 2009 season. A considerable difference in N losses was found mainly through surface runoff and percolation between the two seasons and AV between the MSI-TPR and DSR (Li et al. Citation2015) ().
Table 6. Simulated components of nitrogen balance (kg ha−1) in a 60 cm soil profile of the multiple shallow irrigated transplanted rice (TPR) and direct-seeded rice (DSR) fields during the 2008 and 2009 seasons.
During the 2008 season, the BF, although with a higher N application rate (88 kg ha−1), did not result in corresponding higher AV fluxes ((a)) compared to lower TF applications (i.e. 66 kg ha−1) in this study or compared to the lower BF (33 kg ha−1) in the DSR field (Li et al. Citation2015). During the 2009 season ((b)), however, the TF1 caused relatively low AV fluxes, due mainly to in floodwater lost through surface runoff after its application (Li et al. Citation2017). Similar to this study, Cao et al. (Citation2013) reported that the total NH3 losses (measured as N) from a TPR field in this region were 51.6 and 49.2 kg ha−1 during the 2009 and 2010 seasons, amounting to 17.2% and 16.4% of the total N fertiliser, respectively, whereas Zhu et al. (Citation2004) and Li et al. (Citation2008) reported the N losses through AV in a TPR field in this region reached about 18.6%–38.7% and 9.6%–33.7% of the total N fertiliser, respectively. Depending on fertiliser management, environmental conditions, and soil properties, N loss due to NH3 volatilisation can range from 0 to > 50% (Sommer et al. Citation2004). Keeping a relative high depth of floodwater in the field and applying a deep fertilising method as BF indeed decreased the AV flux rates by lowering
concentrations in floodwater (). Huang et al (Citation2016) also reported that relative to surface application, deep placement of fertiliser N significantly decreased NH3 emissions and NH3 intensity because
concentrations were decreased in floodwater. Additionally, the AV quantities in the MSI-TPR field during the 2008 and 2009 seasons were much lower than those in the DSR field with same the total N fertiliser (220 kg ha−1) (Li et al. Citation2015). Unlike the TPR, DSR had only a relatively small root uptake capacity for nutrients during early season when BF and early TFs were applied (Li et al. Citation2015).
Percolation is another major path of N losses from paddy fields in many regions, in particular under flooding irrigation conditions, depending on both percolated water flux and N concentrations. Reduced oxygen in the root zone for long periods of flooding time slow nitrification of and increase leaching of this form of N (Kirk and Kronzucker Citation2005; Duan et al. Citation2007), whereas the
, if not denitrify, easily transport along with soil water flow. The rapidly decreased
flux with soil depth () was mainly due to various processes that removed
from the top soil layers, such as AV, root uptake, and nitrification in the root zone. Note that, contrary to the 2008 season, the cumulative percolation flux of
at a depth of 20 cm during the 2009 season ((a)) was higher than that at the surface ((b)), mainly due to processes that increased
concentrations in the root zone, mostly from nitrification of
. Total percolated N during the 2009 season exceeded twice that during the 2008 season (). The difference of percolated N between the two growing seasons was mainly ascribed to the different water regimes. Cumulative percolated water flux at a depth of 60 cm during the 2009 season was about 1.5 times that during the 2008 season (Li et al. Citation2017). Continuous flood water from frequent rainfall during the 2009 season resulted in more N percolation than during the 2008 season. Zhu et al. (Citation2000) reported in this region a similar percolated N value of 9.3 kg ha−1 in a TPR field with a total 250 kg ha−1 N application. Zhao et al. (Citation2012) estimated that the N loads in percolation water at a depth of 100 cm in a TPR field were between 3.46 and 5.82 kg ha−1 during the 2007–2009 seasons in this region. The cumulative N fluxes in this study under MSI condition were also much lower than those (10.3 and 9.5 kg ha−1 during the 2008 and 2009 seasons, respectively) in a DSR field under regular irrigation in this region (Li et al. Citation2015).
Nitrification and denitrification
In general, nitrification and denitrification are two important N transformation processes in paddy fields. Loss of applied N through nitrification–denitrification sequences in flooded rice fields can amount to 20%–68% of the applied nitrogen (Yang et al., Citation2017; Zhou et al. Citation2017). The produced by urea hydrolysis and mineralisation was mostly nitrified into
or absorbed directly by rice roots and then the
was denitrified in soil ( and ). No significant difference in nitrification and denitrification quantities was observed in this study between the 2008 and 2009 seasons under different water managements. Zhou et al. (Citation2012) reported in situ denitrification, directly determined in the drained–reflooded TPR paddy soil, ranging from 0.05 to 10.35 kg ha−1 day−1 (averaging 38.9% of applied N), whereas rates in the continuously flooded paddy soil ranged from 0.05 to 3.18 kg ha−1 day−1 (9.9%). The top soil near root zones during the 2008 and 2009 seasons was almost saturated (water content was about 70%–100%) during most of the growing season, except during soil drying and harvesting stages (Li et al. Citation2017). Peralta et al. (Citation2013) reported that, in response to the drying/flooding treatments (upland and wetland), a small change in community composition of denitrifier assemblages was observed but no change in the ammonia oxidiser communities. As a result, potential denitrification rates possibly increased under wetter conditions, whereas potential nitrification rates generally showed no significant change (Peralta et al. Citation2013). Overall nitrification and denitrification () were influenced little in the irrigated paddy fields during both 2008 and 2009 seasons, although with different water regimes.
N transformations differed largely between soil layers in this study (), however, which generally is a typical feature in many irrigated and fertilised soil-plant systems (Penton et al. Citation2013; Qiao et al. Citation2013; Huang et al. Citation2016). Nitrification and denitrification mostly occurred in the 0–40 cm soil during the 2008 and 2009 seasons, particularly in the 0–20 cm soil (). Nitrification generally proceeds quickly in the floodwater and top soil near root zones where oxygen is sufficient (Moreno-Cornejo et al. Citation2014). Most nitrobacteria and denitrobacteria are active in the root zone, resulting in a large quantity of N transformation (Linquist et al. Citation2011; Zhou et al. Citation2017). Zhang et al. (Citation2011) reported that the nitrification decreased and denitrification increased with soil depth (in 0–20 cm). Zhou et al. (Citation2017) also reported that the concentration of dissolved N2O by denitrification increased with soil depth and the highest concentration of excess dinitrogen (N2) was observed at 0.2 m depth. While in deep soil, the nitrification and denitrification quantities were mainly subject to relatively low and
concentrations () but not to the water regimes in this study, which were similar throughout the growing season (Li et al. Citation2017). Relatively low activity and quantity of denitrobacteria also limited the denitrification in deep soil (Linquist et al. Citation2011).
Additionally, Zhou et al. (Citation2017) reported that soil carbon might also be the limiting factor for the nitrification–denitrification process in deep soil of paddy fields. Although the soil carbon was sufficient for the nitrification–denitrification sequence in this study (), nitrogen supply might be the limiting factor. Significant reductions of and
by both transformations and root uptake substantially decreased the N concentrations and consequently the nitrification–denitrification potential in deep soil (i.e. below 40 cm). We further proposed that the difference in nitrification and denitrification particularly in deep soil was mainly due to different N supplies but not the transformation rates. Water regimes directly resulted in different N percolation fluxes, in particular the
flux, which supplied the N source for the denitrification process. The remaining N after absorption by plants generally became the main source of N in deep soil by percolating.
Nitrification and denitrification potential in soil varied with crop growth stage and was more pronounced at tillering and panicle initiation stages than at other stages (Adhya et al. Citation1996; Penton et al. Citation2013). In this study, the nitrification and denitrification processes mainly occurred during early-middle stage (fertilising stages) in top soil (0–40 cm), indicating that N supply but not soil carbon mainly determined the overall nitrification and denitrification processes. Consequently, AWD soil conditions driven by MSI in this study temporarily and locally influenced the nitrification and denitrification processes, particularly in the top soil near root zones. When soil is subjected to aerobic–anaerobic cycles, nitrate concentrations tend to increase during aerobic periods but then rapidly decrease when fields are flooded, with soil nitrate presumably lost through denitrification (Becker et al. Citation2007; Linquist et al. Citation2011). By comparison, the nitrification and denitrification N quantities in the traditional irrigated DSR field in this region reached 206.7 and 152.3 kg ha−1 during the 2008 season, 205.7 and 155.3 kg ha−1 during the 2009 season, respectively, although with same total applied N fertiliser (Li et al. Citation2015), and were greatly higher than in the MSI-TPR field in this study (). Comparably, DSR cultivation had longer growing season than TPR cultivation, supplying more inorganic N by mineralisation (). Furthermore, because of relatively low root uptake rates for N in the DSR field, more fertiliser N was lost by AV and percolation during early growing season (Li et al. Citation2015) compared to the TPR field (), indicating that different cultivations and water and fertiliser managements lead to different N transformations in the soil profile.
In conclusion, MSI indeed saved water resources and decreased associated N losses by percolation and surface runoff. Reduced irrigation benefited to decrease water and nitrogen percolation, while sufficiently flooded irrigation when fertiliser was superficial-applied benefited to reduce concentration in flood water and then the NH3 volatilisation. Appropriate fertiliser management practices such as deep placement of fertiliser N combined with water-saving irrigation such as MSI can substantially reduce N losses from TPR fields. Additionally, mineralisation of organic N should be considered in N balance and optimal fertiliser managements in paddy fields.
Disclosure statement
No potential conflict of interest was reported by the authors.
Notes on contributors
Dr. Yong Li is Associate Professor at the College of Environment, Hohai University, Nanjing, China. He received his Ph.D. in Environmental Engineering from the Hohai University, China. His current work is focused on soil physics, freshwater sediment and surface water and groundwater interaction, especially coupled to nutrient elements (e.g., nitrogen, phosphorus, and carbon).
Dr. Chun Xu is postgraduate student at the College of Environment, Hohai University, Nanjing, China. He received his bachelor’s degree in Environmental Engineering from the Hohai University, China. His current work is focused on soil physics and freshwater sediment, especially coupled to nitrogen.
Dr. Shuang Wang is postgraduate student at the College of Environment, Hohai University, Nanjing, China. She received her bachelor’s degree in Environmental Engineering from the Hubei Polytechnic University, China. Her current work is focused on soil physics and freshwater sediment, especially coupled to carbon.
Dr. Yingying Wang is postgraduate student at the College of Environment, Hohai University, Nanjing, China. She received her bachelor’s degree in Water Supply And Drainage from the Anhui Jianzhu University, China. Her current work is focused on soil physics and freshwater sediment, especially coupled to nitrogen.
Additional information
Funding
References
- Adhya TK, Patnaik P, Rao VR, Sethunathan N. 1996. Nitrification of ammonium in different components of a flooded rice soil system. Biol Fert Soils. 23:321–326. doi: 10.1007/BF00335961
- Antonopoulos VZ. 2010. Modelling of water and nitrogen balances in the ponded water and soil profile of rice fields in Northern Greece. Agr Water Manage. 98:321–330. doi: 10.1016/j.agwat.2010.08.026
- Becker M, Asch F, Maskey SL, Pande KR, Shah SC, Shrestha S. 2007. Effects of transition season management on soil N dynamics and system N balances in rice–wheat rotations of Nepal. Field Crop Res. 103:98–108. doi: 10.1016/j.fcr.2007.05.002
- Belder P, Spiertz JHJ, Bouman BAM, Lu G, Tuong TP. 2005. Nitrogen economy and water productivity of lowland rice under water-saving irrigation. Field Crop Res. 93:169–185. doi: 10.1016/j.fcr.2004.09.022
- Bouman BAM, Tuong TP. 2001. Field water management to save water and increase its productivity in irrigated lowland rice. Agr Water Manage. 49:11–30. doi: 10.1016/S0378-3774(00)00128-1
- Cao Y, Tian Y, Yin B, Zhu Z. 2013. Assessment of ammonia volatilization from paddy fields under crop management practices aimed to increase grain yield and N efficiency. Field Crop Res. 147:23–31. doi: 10.1016/j.fcr.2013.03.015
- Chen CF, Chiang PS. 1963. Ammonium ion adsorption of some paddy soils. ACTA Pedologica Sinica. 11:171–184.
- Chen S, Cai SG, Chen X, Zhang GP. 2009. Genotypic differences in growth and physiological responses to transplanting and direct seeding cultivation in rice. Rice Sci. 16:143–150. doi: 10.1016/S1672-6308(08)60071-2
- Dong W, Guo J, Xu L, Song Z, Zhang J, Tang A, Zhang X, Leng C, Liu Y, Wang L, et al. 2017. Water regime-nitrogen fertilizer incorporation interaction: field study on methane and nitrous oxide emissions from a rice agroecosystem in Harbin, China. J Environ Sci. doi:10.1016/j.jes.2017.06.007 (In Press).
- Duan Y, Yin X, Zhang Y, Shen Q. 2007. Mechanisms of enhanced rice growth and nitrogen uptake by nitrate. Pedosphere. 17:697–705. doi: 10.1016/S1002-0160(07)60084-8
- Huang JB, Fan XH, Zhang SL, Ge GF, Sun YH, Feng X. 2007. Investigation on the economically-ecologically appropriate amount of nitrogen fertiliser applied in rice production in Fe-leaching-stagnic anthrosols of the Taihu Lake region. Acta Ecologica Sinica. 27:588–595 (in Chinese with English abstract).
- Huang M, Chen J, Cao F, Jiang L, Zou Y. 2016. Rhizosphere processes associated with the poor nutrient uptake in no-tillage rice (Oryza sativa L.) at tillering stage. Soil Tillage Res. 163:10–13. doi: 10.1016/j.still.2016.05.002
- Huang S, Lv W, Bloszies S, Shi Q, Pan X, Zeng Y. 2016. Effects of fertilizer management practices on yield-scaled ammonia emissions from croplands in China: a meta-analysis. Field Crop Res. 192:118–125. doi: 10.1016/j.fcr.2016.04.023
- Karandish F, Šimůnek J. 2017. Two-dimensional modeling of nitrogen and water dynamics forvarious N-managed water-saving irrigation strategies using HYDRUS. Agr Water Manage. 193:174–190. doi: 10.1016/j.agwat.2017.07.023
- Kirk GJD, Kronzucker HJ. 2005. The potential for nitrification and nitrate uptake in the rhizosphere of wetland plants: a modelling study. Ann Bot. 96:639–646. doi: 10.1093/aob/mci216
- Kyaw KM, Toyota K, Okazaki M, Motobayashi T, Tanaka H. 2005. Nitrogen balance in a paddy field planted with whole crop rice (Oryza Sativa Cv. Kusahonami) during two rice-growing seasons. Biol Fert Soils. 42:72–82. doi: 10.1007/s00374-005-0856-5
- Lan T, Han Y, Roelcke M, Nieder R, Cai Z. 2014. Sources of nitrous and nitricoxides in paddy soils: nitrification and denitrification. J Environ Sci. 26:581–592. doi: 10.1016/S1001-0742(13)60453-2
- Li B, Xin W, Sun S, Shen Q, Xu G. 2006. Physiological and molecular responses of nitrogen-starved rice plants to re-supply of different nitrogen sources. Plant Soil. 287:145–159. doi: 10.1007/s11104-006-9051-1
- Li H, Liang X, Chen Y, Tian G, Zhang Z. 2008. Ammonia volatilization from urea in rice fields with zero-drainage water management. Agr Water Manag. 95:887–894e. doi: 10.1016/j.agwat.2007.05.016
- Li Y, Šimůnek J, Jing L, Zhang Z, Ni L. 2014. Evaluation of water movement and water losses in a direct-seeded-rice field experiment using Hydrus-1D. Agr Water Manage. 142:38–46. doi: 10.1016/j.agwat.2014.04.021
- Li Y, Šimůnek J, Wang S, Yuan J, Zhang W. 2017. Modeling of soil water regime and water balance in a transplanted rice field experiment with reduced irrigation. Water. 9:248. doi: 10.3390/w9040248
- Li Y, Šimůnek J, Zhang Z, Jing L, Ni L. 2015. Evaluation of nitrogen balance in a direct-seeded-rice field experiment using Hydrus-1D. Agr Water Manage. 148:213–222. doi: 10.1016/j.agwat.2014.10.010
- Lin D, Fan X, Hu F, Zhao H, Luo J. 2007. Ammonia volatilization and nitrogen utilization efficiency in response to urea application in rice fields of the Taihu Lake Region, China. Pedosphere. 17:639–645. doi: 10.1016/S1002-0160(07)60076-9
- Linquist BA, Koffler K, Hill JE, van Kessel C. 2011. Rice field drainage affects nitrogen dynamics and management. Calif Agric. 65:80–84. doi: 10.3733/ca.v065n02p80
- Liu Y, Yu X, He Y, Long XJ. 2014. The research progress of water-saving irrigation in China since 2000. Adv Mater Res. 955–959:3206–3210. doi: 10.4028/www.scientific.net/AMR.955-959.3206
- Mikha MM, Rice CW, Milliken GA. 2005. Carbon and nitrogen mineralization as affected by drying and wetting cycles. Soil Biol Biochem. 37:339–347. doi: 10.1016/j.soilbio.2004.08.003
- Moreno-Cornejo J, Zornoza R, Faz A. 2014. Carbon and nitrogen mineralization during decomposition of crop residues in a calcareous soil. Geoderma. 230–231:58–63. doi: 10.1016/j.geoderma.2014.03.024
- Nangia V, Gowda PH, Mulla DJ, Sands GR. 2008. Water quality modeling of fertilizer management impacts on nitrate losses in tile drains at the field scale. J Environ Qual. 37:296–307. doi: 10.2134/jeq2007.0224
- Nash JE, Sutcliffe JV. 1970. River flow forecasting through conceptual models. Part I. A discussion of principles. J Hydrol. 10:282–290. doi: 10.1016/0022-1694(70)90255-6
- Peng S, Yang S, Xu J, Luo Y, Hou H. 2011. Nitrogen and phosphorus leaching losses from paddy fields with different water and nitrogen managements. Paddy Water Environ. 9:333–342. doi: 10.1007/s10333-010-0246-y
- Penton CR, Deenik JL, Popp BN, Bruland GL, Engstrom P, St. Louis D, Tiedje J. 2013. Importance of sub-surface rhizosphere-mediated coupled nitrification-denitrification in a flooded agroecosystem in Hawaii. Soil Biol Biochem. 57:362–373. doi: 10.1016/j.soilbio.2012.10.018
- Peralta AL, Ludmer S, Kent AD. 2013. Hydrologic history influences microbial community composition and nitrogen cycling under experimental drying/wetting treatments. Soil Biol Biochem. 66:29–37. doi: 10.1016/j.soilbio.2013.06.019
- Phogat V, Mahadevan M, Skewes M, Cox JW. 2012. Modelling soil water and salt dynamics under pulsed and continuous surface drip irrigation of almond and implications of system design. Irrigation Sci. 30:315–333. doi: 10.1007/s00271-011-0284-2
- Qiao J, Yang L, Yan T, Xue F, Zhao D. 2013. Rice dry matter and nitrogen accumulation, soil mineral N around root and N leaching, with increasing application rates of fertilizer. Eur J Agron. 49:93–103. doi: 10.1016/j.eja.2013.03.008
- Rejesus RM, Palis FG, Rodriguez DGP, Lampayan RM, Bouman BAM. 2011. Impact of the alternate wetting and drying (AWD) water-saving irrigation technique: evidence from rice producers in the Philippines. Food Policy. 36:280–288. doi: 10.1016/j.foodpol.2010.11.026
- Renard JJ, Calidonna SE, Henley MV. 2004. Fate of ammonia in the atmosphere—a review for applicability to hazardous releases. J Hazard Mater. 108:29–60. doi: 10.1016/j.jhazmat.2004.01.015
- Roberts TL, Ross WJ, Norman RJ, Slaton NA, Wilson CE. 2011. Predicting nitrogen fertilizer needs for rice in Arkansas using alkaline Hydrolyzable-nitrogen. Soil Sci Soc Am J. 75:1–11. doi: 10.2136/sssaj2010.0145
- Roost N, Cai XL, Turral H, Molden D, Cui YL. 2008. Adapting to intersectoral transfers in the Zhanghe irrigation system, China Part II: impacts of in-system storage on water balance and productivity. Agr Water Manage. 95:685–697. doi: 10.1016/j.agwat.2008.01.011
- Sarkar MC, Banerjee NK, Rana DS, Uppal KS. 1991. Field measurements of ammonia volatilization losses of nitrogen from urea applied to wheat. Fertil News. 36:25–28.
- Šimůnek J, Hopmans JW. 2009. Modeling compensated root water and nutrient uptake. Ecol Model. 220:505–521. doi: 10.1016/j.ecolmodel.2008.11.004
- Šimůnek J, van Genuchten MT, Šejna M. 2012. The HYDRUS software package for simulating the two- and three-dimensional movement of water, heat, and multiple solutes in variably-saturated porous media, Technical Manual, Version 2.0, PC-Progress, Prague, Czech Republic, pp. 258.
- Siyal AA, Bristow KL, Šimůnek J. 2012. Minimizing nitrogen leaching from furrow irrigation through novel fertilizer placement and soil surface management strategies. Agr Water Manage. 115:242–251. doi: 10.1016/j.agwat.2012.09.008
- Sommer SG, Schjoerring K, Denmead OT. 2004. Ammonia emission from mineral fertilizers and fertilized crops. Adv Agron. 82:557–622. doi: 10.1016/S0065-2113(03)82008-4
- Tan X, Shao D, Gu W, Liu H. 2015. Field analysis of water and nitrogen fate in lowland paddy fields under different water managements using HYDRUS-1D. Agr Water Manage. 150:67–80. doi: 10.1016/j.agwat.2014.12.005
- Tan X, Shao D, Liu H, Yang F, Xiao C, Yang H. 2013. Effects of alternate wetting and drying irrigation on percolation and nitrogen leaching in paddy fields. Paddy Water Environ. 11:381–395. doi: 10.1007/s10333-012-0328-0
- Tang JY, Riley WJ. 2013. A new top boundary condition for modeling surface diffusive exchange of a generic volatile tracer: theoretical analysis and application to soil evaporation. Hydrol Earth Syst Sci. 17:873–893. doi: 10.5194/hess-17-873-2013
- van Genuchten MT. 1980. A closed-form equation for predicting the hydraulic conductivity of unsaturated soils. Soil Sci Soc Am J. 44:892–898. doi: 10.2136/sssaj1980.03615995004400050002x
- Wang MY, Glass ADM, Shaff JE, Kochian LV. 1994. Ammonium uptake by rice roots: III. Electrophysiology. Plant Physiol. 104:899–906. doi: 10.1104/pp.104.3.899
- Wang S, Shan J, Xia Y, Quan T, Xia L, Lin J, Yan X. 2017. Different effects of biochar and a nitrification inhibitor application on paddy soil denitrification: a field experiment over two consecutive rice-growing seasons. Sci Total Environ. 593–594:347–356. doi: 10.1016/j.scitotenv.2017.03.159
- Willmott CJ. 1981. On the validation of model. Phys Geogr. 2:184–194.
- Xing G, Zhao X, Xiong Z, Yan X, Xu H, Xie Y, Shi S. 2009. Nitrous oxide emission from paddy fields in China. Acta Ecologica Sinica. 29:45–50. doi: 10.1016/j.chnaes.2009.04.006
- Yang J, Zhou Q, Zhang J. 2017. Moderate wetting and drying increases rice yield and reduces water use, grain arsenic level, and methane emission. Crop J. 5:151–158. doi: 10.1016/j.cj.2016.06.002
- Yang S, Peng S, Xu J, Hou H, Gao X. 2013. Nitrogen loss from paddy field with different water and nitrogen managements in Taihu Lake Region of China. Commun Soil Sci Plant Anal. 44:2393–2407. doi: 10.1080/00103624.2013.803564
- Yang Y, Meng T, Qian X, Zhang J, Cai Z. 2017. Evidence for nitrification ability controlling nitrogen use efficiency and N losses via denitrification in paddy soils. Biol Fertil Soils. 53:349–356. doi: 10.1007/s00374-017-1185-1
- Ye Y, Liang X, Chen Y, Liu J, Gu J, Guo R, Li L. 2013. Alternate wetting and drying irrigation and controlled-release nitrogen fertilizer in late-season rice. Effects on dry matter accumulation, yield, water and nitrogen use. Field Crops Res. 144:212–224. doi: 10.1016/j.fcr.2012.12.003
- Zhang JS, Zhang FP, Yang JH, Wang JP, Cai ML, Li CF, Cao CG. 2011. Emissions of N2O and NH3, and nitrogen leaching from direct seeded rice under different tillage practices in central China. Agric Ecosyst Environ. 140:164–173. doi: 10.1016/j.agee.2010.11.023
- Zhao X, Zhou Y, Min J, Wang S, Shi W, Xing G. 2012. Nitrogen runoff dominates water nitrogen pollution from rice-wheat rotation in the Taihu Lake region of China. Agric Ecosyst Environ. 156:1–11. doi: 10.1016/j.agee.2012.04.024
- Zhou S, Sakiyama Y, Riya S, Song X, Terada A, Hosomi M. 2012. Assessing nitrification and denitrification in a paddy soil with different water dynamics and applied liquid cattle waste using the 15N isotopic technique. Sci Total Environ. 430:93–100. doi: 10.1016/j.scitotenv.2012.04.056
- Zhou W, Xia L, Yan X. 2017. Vertical distribution of denitrification end-products in paddy soils. Sci Total Environ. 576:462–471. doi: 10.1016/j.scitotenv.2016.10.135
- Zhu JG, Han Y, Liu G, Zhang YL, Shao XH. 2000. Nitrogen in percolation water in paddy fields with a rice/wheat rotation. Nutr Cycl Agroecosyst. 57:75–82. doi: 10.1023/A:1009712404335
- Zhu ZL, Fan XH, Sun YH, Wang DJ. 2004. Nitrogen-cycle in an early-rice field and its environmental effects in Taihu Lake Region. Crop Res. 4:187–191 (In Chinese with English Abstract).