
 ?Mathematical formulae have been encoded as MathML and are displayed in this HTML version using MathJax in order to improve their display. Uncheck the box to turn MathJax off. This feature requires Javascript. Click on a formula to zoom.
ABSTRACT
Natural rubber consumption has led to the expansion of rubber (Hevea brasiliensis) plantations which affects the deforestation and ecosystem. However, no study of the long-term effect of rubber plantations on soil biodiversity has been carried out yet. This study aimed to assess the long-term impact of continuous rubber monocropping on soil biodiversity, focusing on soil macrofauna and nematode diversity. Three successive rubber rotations at young and old ages were compared with the adjacent forest in Suratthani province, Thailand. Soil biodiversity quality index was calculated from a set of indicators which were combined into a single score to present a functional assessment of the gradient of disturbance. The results showed three negative effects on soil biodiversity (i) the biodiversity quality index immediately declined after deforestation (ii) the old age rubber plantations had a lower soil biodiversity as the nematodes were a main driver of diversity in the young plantation, and (iii) similarly, for the soil chemical properties, the long-term effect of rubber chronosequence evidenced deterioration in the third rotation. Therefore, two rotations of rubber plantation (around 50 years) seemed to be the maximum length of rubber monocropping in terms of soil biodiversity recovery.
Introduction
The rubber tree (Hevea brasiliensis), which is the unique commercial source of natural rubber, is one of the most important industrial crops in Asia (FAO Citation2012). The industrial-scale and smallholder monoculture of rubber plantations were developed during the strong demand for natural rubber (Warren-Thomas et al. Citation2015). This widespread agricultural system has expanded faster than all other tree crops, with a 1.8 fold increase in the last 30 years (Fox and Castella Citation2013). Several ecological studies have documented a negative impact of deforestation for rubber monoculture on soil quality in terms of soil pH, soil carbon stock, erosion and hydrology (Li et al. Citation2008; de Blécourt et al. Citation2013; Ahrends et al. Citation2015; Drescher et al. Citation2016; Liu et al. Citation2019). In addition, the conversion of land use to monoculture plantation leads to the degradation of ecosystem functions and the loss of tropical biodiversity (Fitzherbert et al. Citation2008).
Nowadays, biodiversity loss has become a major issue in terms of sustainable development, and halting it is one of the United Nations’ sustainable development goals (SDGs) (Bach et al. Citation2020). Soil biodiversity is important for agricultural ecosystems as the soil is home to more than a quarter of the earth’s total biodiversity (Turbé et al. Citation2010). Soil biota has three main contributions to the soil. First, soil microorganisms (i.e. bacteria and fungi) and microfauna (i.e. protozoa and nematodes) can transform organic and inorganic compounds which are essential for nutrient cycling (FAO Citation2020). Second, all soil organisms control the energy cycles by their food webs (Griffiths et al. Citation2000). And finally, soil macrofauna such as earthworms act as ecosystem engineers to modify soil porosity, water and gas transport (Blanchart et al. Citation2004; Schneider and Schröder Citation2012). Therefore, soil biodiversity plays a crucial role in various processes in the soil and has a direct influence on soil fertility (Villenave et al. Citation2004).
Thailand has been a major producer of the world’s natural rubber since the early twentieth century (IRSG Citation2015). During the initial of ‘rubber boom’, the rubber plantation in Thailand had started in forest areas. However, most current rubber areas have been in two or three replanting cycles (Chambon et al. Citation2016). As the typical economic lifespan of a rubber plantation is around 25 years, then two or three rotations of rubber replanting on the same land could lead to overexploitation of soil nutrients and significant loss of soil fertility and biodiversity. This study aimed to examine the long term effect of rubber monoculture on soil biodiversity, focusing on soil macrofauna and nematode diversity as the bioindicators. To address the impact of rubber replanting compared to the deforestation effect, three successive rotations of rubber monocropping (in both young and old age rubber plantations) were compared with the adjacent natural forest, focusing on the main patterns of soil macrofauna and nematodes. Soil invertebrates are the main biological component that regulates many soil processes (Brussaard Citation1998). They contribute to improving soil aggregate structure and are involved in soil fertility maintenance (Rousseau et al. Citation2013; Melman et al. Citation2019). Soil nematodes are the indicators of soil food web conditions which have subsequent effects on ecosystem variables and processes, such as plant and soil microbial biomass, nitrogen mineralisation and decomposition (Neher Citation2010; Jiang et al. Citation2017). A soil biodiversity quality index was calculated at the end to integrate the measured soil macrofauna and nematodes parameters into a single score that could be used as an indicator of overall soil biodiversity quality in this context.
Materials and methods
Experimental site and sampling
This study was conducted in smallholding rubber plantations (Hevea brasiliensis) in a major rubber growing area in Suratthani province, southern Thailand and an adjacent natural forest nearby the rubber plantations (8°54′–8°56′N; 99°24′–99°28′E). The initial rubber planting was established by clearing the forests in the area. The area is generally dominated by a tropical monsoon climate with two main seasons: the dry monsoon (December to April) and the wet monsoon (May to November). All samples were collected in September 2015 when the period of light rain precipitation. The mean monthly precipitation in this month was 250.9 mm and the average temperature was 26.8°C (Meteorological Department Citation2015).
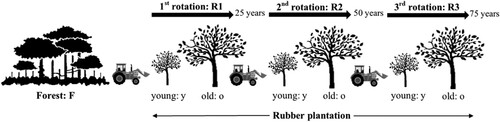
The experiment was designed to assess both the impacts of disturbances following (i) the land clearance – from forest to the first rubber plantation and then to the next second and third rotation – and (ii) the evolution of soil fauna and nematode during the lifespan of each rotation. Therefore, two classes of rubber plantations were chosen according to age ranges: young stage (3–6 years old) and old stage (18–22 years old). The plantations were also categorised based on the number of replanting cycles with three successive rubber plantations: the first rotation – planted after clearing the forest area, the second rotation – planted after the first rubber rotation and the third rotation – planted after the second rubber rotation. Seven treatments with three plots (true replications) of each were assessed. The seven treatments were: Forest (F), the first rotation at the young stage (R1y), the first rotation at the old stage (R1o), the second rotation at the young stage (R2y), the second rotation at the old stage (R2o), the third rotation at the young stage (R3y), and the third rotation at the old stage (R3o) (). In the plantations, all samples were collected at 0–10 cm of soil depth because the topsoil layer contains the main part of the soil biota that drive soil processes (European Commission Citation2010). The samples were taken from the inter-row of rubber trees, as agricultural practices were typically carried out in the inter-row spaces (Kazakou et al. Citation2016). However, in the forest, all samples were collected between the trees at the same depth.
Figure 1. Experimental design of the study. F: Forest, R1y: 1st rotation at the young stage, R1o: 1st rotation at the old stage, R2y: 2nd rotation at the young stage, R2o: 2nd rotation at the old stage, R3y: 3rd rotation at the young stage, and R3o: 3rd rotation at the old stage.
Soil analysis
In each plot, soil samples were composited from three subsites consisting of 10 rows of rubber trees. Then, composite soil samples were sieved using a 2 mm mesh and dried at room temperature before laboratory analysis performed by the Office of Science for Land Development, Land Development Department, Bangkok, using the following methods: total nitrogen (N)(%) was determined using the Kjeldahl method (AOAC Citation1984); available phosphorus (P) (mg kg−1) was determined using the Bray II method (Bray and Kurtz Citation1945); available potassium (K) (mg kg−1), calcium (Ca) (mg kg−1) and magnesium (Mg) (mg kg−1) were extracted by neutral 1 N ammonium acetate (Chapman Citation1965) and analysed by flame photometer for potassium and atomic absorption spectrophotometer for calcium and magnesium; organic matter (OM) (%) was determined by using the Walkley and Black method (Walkley and Black Citation1934); and pH was determined in distilled water (1:1 soil-water ratio) (Peech Citation1965).
Soil fauna assessment
Soil macrofauna
In each plot, soil macrofauna was sampled using the soil monolith collection from a topsoil area of 25 × 25 cm with 10 cm depth (Anderson and Ingram Citation1993). The samples were individually hand-sorted in the fields and all visible organisms were collected and stored in 70% alcohol solution. All invertebrates were counted and identified in a laboratory according to trophic groups: (a) predator, (b) detritivore, (c) phytophagous, (d) omnivore, and (e) geophagous (Capinera Citation2008).
Nematodes
Nematodes were extracted from 100 g of fresh soil samples using the elutriation method. With this method, nematodes were separated from soil particles that settled faster and floated in the water. Then, all extracted nematodes were counted and identified under a dissecting microscope (Seinhorst Citation1956). Nematodes were identified by feeding group which can be deduced from the structure of their mouthparts: (a) bacterivore, (b) fungivore, (c) plant parasitic, (d) carnivore, and (e) omnivore (Bongers and Bongers Citation1998).
Biodiversity indices
The biodiversity indices were calculated from the soil macrofauna and nematode datasets:
Abundance showed the total number of species in the sample.
Richness index – which corresponded to the number of taxons detected in the sample (Ludwig and Reynold Citation1988).
Diversity index or Shannon index (
) – which synthesised taxon richness and their relative abundance (Van Strien et al. Citation2012).
Evenness index or Pielou index (
Quality index calculation
A quality index was calculated in three steps following Obriot et al. (Citation2016) to combine all biodiversity data sets into one score. The first step was to select the minimum data set. Pearson correlation matrix was calculated and only parameters with correlation coefficients (r) less than 0.8 were kept. The second step was to calculate the normalised indicator score (). The linear response curve was used to give the indicator. In this case, it was assumed that higher values would result in a better impact on soil quality for all parameters. To normalise data, the observed values (
) were divided by the highest value (
)
In the third step, all selected parameters were weighted by principal component analysis (PCA) to consider the weighted factor () by multiplying the sum of square coordinates of an indicator on each eigenvector (
) (only the components with eigenvalue more than 1 were kept) by the percentages of the total variability of each principal component (
).
where
is the weighted factor,
is the sum of squared coordinates of an indicator on each eigenvector,
is the percentages of the total variability of each principal component and
is the number of principal component.
Then the quality index (QI) was calculated by the weighted factor and the normalised indicator score.
where QI is the quality index, Si is the normalised indicator score, Wi is the weighted factors, and n is the number of indicators in the data set.
Statistical analysis
All statistical analyses were performed using R v3.1.0 (R Development Core Team Citation2014). Normality and homogeneity of variance were tested in Shapiro and Bartlett tests on model residuals. When one or both conditions were not met, the data were log-transformed. A Linear Mixed Model was generated for quantitative data and a Generalised Linear Mixed Model for count data. One-Way ANOVA was used and followed by Tukey multiple comparisons of means tests to compare differences between all the treatments with a Bonferroni correction. Between-Class Analyses (BCA) were performed on the data based on Principal Component Analyses (PCA) results with consideration of variables. Monte-Carlo permutation tests (999 permutations) were generated to assess the significance of the multivariate representation. Pearson’s correlation coefficients were used to assess the relationships of the data sets.
Results
Soil analysis
All soil properties in every treatment were significantly different (). The highest values of all soil properties were found in the forest, except the available phosphorus. The results showed that the soil fertility decreased immediately after deforestation and land use change. The decreasing of cation contents (K+, Mg2+, and Ca2+) were similar after the deforestation and each rotation. Old plantations seemed to have a higher value of cation contents than those of young plantations. Furthermore, soil degradation was found in the third rotation.
Table 1. Descriptive statistics of the measured soil properties in each plantation; total nitrogen (N), available phosphorus (P), available potassium (K), calcium (Ca), magnesium (Mg) and organic matter (OM).
Soil fauna diversity
Soil macrofauna
About 30 taxa groups had been found and identified into five groups depending on their trophic groups: predator, detritivore, phytophagous, omnivore, and geophagous. Detritivore was the most abundant group in this experiment. Isoptera was the main fauna in this ecosystem. However, the significant differences were found only in the predator and geophagous groups. The number of predators seemed to be more in young plantations (R1y and R2y) as the habitat of weeds provides more aboveground insects which are their food. With dense shades and higher soil moisture content as the results of close canopies, the forest showed the highest number of geophagous or earthworm, followed by the old plantations (). However, it was found that the total abundance of soil macrofauna was not significantly different. Only the richness index, linked to the number of all taxa groups, was significant as the third rotation indicated the decreasing of richness index along the chronosequence ().
Table 2. The abundances of soil macrofauna in each trophic group.
Table 3. The total abundances of soil macrofauna and their biodiversity indices.
Nematodes
Bacterivore was the most abundant trophic group of nematodes in the study. The number of bacterivore nematodes was the highest in the forest but decreased in the old plantation. This decreasing pattern was also found in omnivore, plant parasitic, the total abundance, and richness index of nematodes. The decreasing of richness gradually reduced along the rubber chronosequence after deforestation, and the lowest number of the richness index was found in the old stage of the third rotation ( and ).
Table 4. The abundances of nematode in each trophic group.
Table 5. The total abundances of nematodes and their biodiversity indices.
Biodiversity quality index
For biodiversity quality index calculation, seven variables from the soil macrofauna and nematode measurement were selected as the minimum of the data sets; the abundance of predator and geophagous feeding group and the richness index of soil macrofauna, the abundance of omnivore and plant parasitic trophic group in nematode with the total abundance and the richness index. The results indicated that the biodiversity quality index was significantly decreasing along the rubber plantation succession with the lowest value in the third rotation. And the richness index of nematode seemed to be a main driver of the biodiversity ecological system in this context, followed by the abundance of earthworm which was the geophagous feeding group ((a)).
Figure 2. Biodiversity quality index along rubber chronosequence compared to forest. Part (a) was the biodiversity index from the quality index calculation (mean ± SD, n = 3). The different letters indicate statistically different values (p-value < 0.01). Part (b) was the individual representation and correlation circle of each biodiversity quality index variable from the Between Class Analysis (BCA). F: Forest, R1y: 1st rotation at the young stage, R1o: 1st rotation at the old stage, R2y: 2nd rotation at the young stage, R2o: 2nd rotation at the old stage, R3y: 3rd rotation at the young stage, and R3o: 3rd rotation at the old stage.
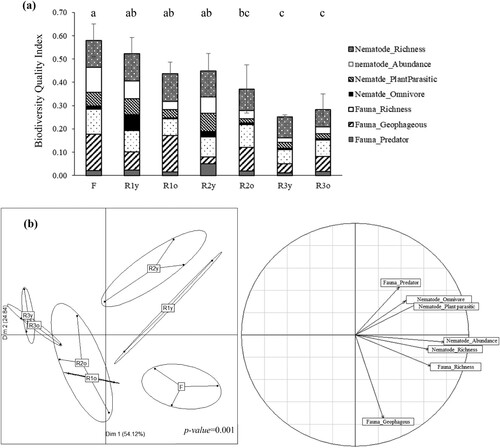
The percentages of inertia of two first dimensions of BCA showed the significantly different values (P-value < 0.05) with 54.12% of variability in the first axis and 24.84% in the second axis ((b)). The BCA explained the correlation of each biodiversity quality index variables and the plantation into 4 clusters; (1) forest, (2) young age of the first and the second rotation, (3) old age of the first and the second rotation, and (4) young and old age of the third rotation.
Discussion
Relationships between soil biodiversity and soil properties
The results of this study showed a similar pattern of soil properties and soil biodiversity decreasing with time. A rapid decline occurred immediately after deforestation, while the deterioration was continued along the rubber chronosequence. This result can be explained by the fact that soil biodiversity is affected by the interaction of abiotic and biotic factors, on which land use change and degradation may have a negative effect (Tibbett et al. Citation2019). The explanation could be verified by Van Noordwijk et al. (Citation1997) who found that the conversion of natural forest into an agricultural area leads to soil degradation due to the reduction of aboveground biomass and soil organic carbon. A similar result was also found after rubber monoculture perturbation, which is the cause of soil nutrient loss (Zhang et al. Citation2007). As soil hosts the largest diversity of organisms, it plays a key role for biogeochemical cycles which are related to regulating and supporting ecosystem services (Smith et al. Citation2015). In addition, soil biodiversity loss will affect soil processes such as the nitrification or litter decomposition, and also reduce some capacity to recover from the disturbances (Nielsen et al. Citation2015). Such observations were reported in Mulder et al. (Citation2005) and Sinsabaugh et al. (Citation2008) that soil pH seemed to strongly affect soil biodiversity as it relates to the soil fauna community by influencing the relative abundance and biomass of soil microbes and the activity of soil enzymes. However, this study revealed that the soil degradation varied by available phosphorus. The available phosphorus was less in the forest and decreased along with the plantation ages, because it was gradually depleted in soil solutions with time (Elser et al. Citation2007; Turner and Condron Citation2013).
Changing of soil macrofauna and nematodes in rubber monocropping plantation
Soil macrofauna
Soil macrofauna was selected to be a bioindicator for monitoring the effect of land use change in this study because of their sensitivity to the habitat change and the effect on the material cycle and energy flow in ecosystems (Tan et al. Citation2013; Wu and Wang Citation2019). The results showed the significant differences only in predator and geophagous trophic groups and the richness index. The increasing of predator in the young age of the first and the second rubber rotation was a result of the larger weed area that serves as food sources for more aboveground insects. Thus, the limitation in food sources is the main cause of biodiversity loss (Semper-Pascual et al. Citation2019). However, all predators decreased after the third rotation which can be explained by the decreasing of prey and the retardation in decomposition rate (Kajak Citation1995). Regarding the earthworm assemblages, Guéi and Tondoh (Citation2012) reported that organic carbon was the most important variable for earthworm abundance, followed by nitrogen and pH. Thus, the higher value of these soil variables in the forest and the old plantation caused the higher abundance of the geophagous group. The forest and the old rubber plantation were significant in soil fertility richness through enhanced litter decomposition with more litter (Sofo et al. Citation2020; Xu et al. Citation2020). This reason could explain the increase of soil fauna richness index in the forest and the old plantation. However, it was observed that the soil degradation in the third rotation caused a decrease in soil fauna diversity.
Nematode
Nematode, one of the most numerous members of the soil fauna, is an indicators of the soil food web (Herren et al. Citation2020). It is sensitive to organic amendments and contributes to soil nutrient turnover linked to land use changes (Treonis et al. Citation2010). For example, the shift toward monoculture was a kind of soil disturbance that reduced the nematode growing (Duddigan et al. Citation2020). Like other previous studies of the land use changes effect on soil organisms, this study found significantly different values in the abundance of bacterivore, omnivore and plant parasitic feeding nematodes with the total abundance and the richness index. This study also indicated the decrease of nematode abundance in old rubber plantation because weeds grow less well under dense shades causing the loss of plant biomass, an important carbon source for the growth and activity of nematodes (Ferris Citation2010; Li et al. Citation2021). Also, the cover plants, directly and indirectly, affect the microclimate which influences the above and belowground organisms (Belnap et al. Citation2005).
Loss of biodiversity quality index along successive rubber rotations
The results showed that the deforestation, the age effect, and the rotation of rubber plantation were all related to the loss of biodiversity quality index. The results highlight the effect of the deforestation which caused the fragmentation and habitat loss of the biota (Ehrlich and Pringle Citation2008). The high abundance of earthworms, as the main driver of the biodiversity quality index in the forest, was due to more litter biomass with low soil temperature and higher moisture (Tien et al. Citation2000). However, Ganesh et al. (Citation2009) reported that the litter with higher polyphenol and lignin observed in forests was not preferred by earthworms.
Since most of the other variables from all minimum of the data sets linked to nematode factors, the age effect showed the difference in the young stage of the first and the second rotation. The decreasing of the biodiversity quality index in the old stage of the plantation was caused by a decreased in plant cover, which affected the richness index of soil biota because of the decreasing ecosystem primary productivity (Ye et al. Citation2020). The study also found the opposite abundance of earthworm and nematodes during the ageing of the rubber plantation. Demetrio et al. (Citation2019) explained this negative effect of earthworms on nematodes by suggesting that it related to food competition.
Concerning the rotation effect, the results showed that the biodiversity quality index was not significantly different in the first and second rotation, but considerably reduced in the third rotation. Fiorini et al. (Citation2020) observed that soil fauna worked as a sensitive device to detect the soil quality change by soil tillage. This decrease may be due to the strong oxygenation from the tillage which helped accelerate the rapid mineralisation of organic matter, reduced the organic carbon content, and caused the nutrient leaching (Micucci and Taboada Citation2006; Angers and Eriksen-Hamel Citation2008). These affiliations were also reported in a study by Melero et al. (Citation2009) that the increasing of microorganism biomass in soil under no-tillage cultivation enhanced soil organic carbon content. Thus, these earlier reports had explained the decreasing of biodiversity quality index after the land preparation by tillage in each rotation.
Moazzam et al. (Citation2014) suggested that the longer cycle in each rotation (40 years) might allow the recovery of maximum carbon content in the rubber plantation as the organic carbon encouraged the soil nutrient cycling and linked to the food resources of soil organisms, Thus, the loss of soil biodiversity could be also restored. Meanwhile, agroforestry is an option to improve ecosystem services that play a critical role in sustainable agriculture (Haggar et al. Citation2019; Santos et al. Citation2019).
Conclusion
This study indicated the long-term impact of rubber monocropping on topsoil biodiversity particularly soil macrofauna and nematodes. In addition to the obvious degradation after deforestation, the study observed the pattern of soil biodiversity loss after three rotations of rubber plantations. The soil biodiversity quality index still maintained after the first rotation, and evidenced the deterioration after the second rotation, which is after about 50 years of rubber monocropping. Thus, to reduce this impact on the sustainable land use, alternative cultivations such as agroforestry or intercropping systems could be an attractive option to ensure the environmental benefits.
Acknowledgements
The authors would like to thank all our participants, Prince of Songkla University (PSU), the French Institute of Research for Development (IRD) and CIRAD for their support. Additionally, the authors are grateful to Khon Kaen University (KKU) and the Land Development Department (LDD) for all technical and logistical support, as well as the Department of National Parks, Wildlife and Plant Conservation (DNP), and all farmers for their helpfulness in the fields.
Disclosure statement
No potential conflict of interest was reported by the author(s).
Additional information
Funding
Notes on contributors
Phantip Panklang
Phantip Panklang is a Ph.D. student and an agricultural research officer who has 15 years of experience working with farmers in southern Thailand, mainly focusing on soil quality improvement and soil ecology.
Philippe Thaler
Philippe Thaler is a senior researcher who contributes mainly to the ‘plant-soil interactions and biogeochemical cycles’ research topic. His research focuses on the ecophysiology of the rubber tree and also leads multi-disciplinary studies on the sustainability of natural rubber production.
Alexis Thoumazeau
Alexis Thoumazeau is a researcher, working on assessing the performance of agroecological practices following multicriteria approaches to disentangle tradeoffs between agro-environmental and socio-economic aspects.
Rawee Chiarawipa
Rawee Chiarawipa is an assistant professor in the department of plant science, where he teaches plant physiology, agricultural meteorology, and tropical agricultural resource management. His research interests include rubber plantation management, plant ecophysiology, and the management of fruits and medicinal plants.
Sayan Sdoodee
Sayan Sdoodee is a professor with more than 40 years of teaching experience and research. His research has focused on crop physiology, especially the physiology of tropical fruits and rubber trees.
Alain Brauman
Alain Brauman is a senior scientist. His current work concerns the impact of land use changes on soil functioning and he recently conducted this research to better assess the relationship between soil functional assemblages and soil ecosystem services in agro-ecological systems.
References
- Ahrends A, Hollingsworth PM, Ziegler AD, Fox JM, Chen H, Su Y, Xu J. 2015. Current trends of rubber plantation expansion may threaten biodiversity and livelihoods. Global Environ Change. 34:48–58. DOI:10.1016/j.gloenvcha.2015.06.002.
- Anderson JM, Ingram JSI. 1993. Tropical soil biology and fertility: a handbook of methods. Wallingford: CAB International. DOI:10.2307/2261129.
- Angers D, Eriksen-Hamel N. 2008. Full-inversion tillage and organic carbon distribution in soil profiles: a meta-analysis. Soil Sci Soc Am J. 72:1370–1374. DOI:10.2136/sssaj2007.0342.
- AOAC. 1984. Official methods of analysis. Arlington: Association of Official Analytical Chemists.
- Bach EM, Ramirez KS, Fraser TD, Wall DH. 2020. Soil biodiversity integrates solutions for a sustainable future. Sustainability. 12:2662. DOI:10.3390/su12072662.
- Belnap J, Phillips S, Sherrod SK, Moldenke A. 2005. Soil biota can change after exotic plant invasion: does this affect ecosystem processes? Ecology. 86:3007–3017. DOI:10.1890/05-0333.
- Blanchart E, Albrecht A, Brown G, Decaens T, Duboisset A, Lavelle P, Mariani L, Roose E. 2004. Effects of tropical endogeic earthworms on soil erosion. Agric Ecosyst Environ. 104:303–315. DOI:10.1016/j.agee.2004.01.031.
- Bongers T, Bongers M. 1998. Functional diversity of nematodes. Appl Soil Ecol. 10:239–251. DOI:10.1016/S0929-1393(98)00123-1.
- Bray RH, Kurtz LT. 1945. Determination of total, organic and available forms of phosphorus in soils. Soil Sci. 59:39–46. DOI:10.1097/00010694-194501000-00006.
- Brussaard L. 1998. Soil fauna, guilds, functional groups and ecosystem processes. Appl Soil Ecol. 9:123–135. DOI:10.1016/S0929-1393(98)00066-3.
- Capinera JL. 2008. Encyclopedia of entomology. Heidelberg: Springer Science & Business Media. DOI:10.1007/978-1-4020-6359-6.
- Chambon B, Ruf F, Kongmanee C, Angthong S. 2016. Can the cocoa cycle model explain the continuous growth of the rubber (Hevea brasiliensis) sector for more than a century in Thailand? J Rural Stud. 44:187–197. DOI:10.1013/j.jrurstud.2016.02.003.
- Chapman HD. 1965. Cation-exchange capacity. In: Black CA, editor. Methods of soil analysis. Vol. 2. Madison: American Society of Agronomy; p. 891–901.
- de Blécourt M, Brumme R, Xu J, Corre MD, Veldkamp E. 2013. Soil carbon stocks decrease following conversion of secondary forests to rubber (Hevea brasiliensis) plantations. PLoS One. 8:e69357. DOI:10.1371/journal.pone.0069357.
- Demetrio WC, Dionísio JA, Maceda A. 2019. Negative effects of earthworms on soil nematodes are dependent on earthworm density, ecological category and experimental conditions. Pedobiologia. 76:150568. DOI:10.1016/j.pedobi.2019.150568.
- Drescher J, Rembold K, Allen K, Beckschäfer P, Buchori D, Clough Y, Faust H, Fauzi AM, Gunawan D, Hertel D, et al. 2016. Ecological and socio-economic functions across tropical land use systems after rainforest conversion. Philos Trans R Soc B Biol Sci. 371:20150275. DOI:10.1098/rstb.2015.0275.
- Duddigan S, Gil-Martinez M, Fraser T, Green I, Diaz A, Sizmur T, Pawlett M, Raulund-Rasmussen K, Tibbett M. 2020. Evaluating heathland restoration belowground using different quality indices of soil chemical and biological properties. Agronomy. 10:1140. DOI:10.3390/agronomy10081140.
- Ehrlich PR, Pringle R. 2008. Where does biodiversity go from here? A grim business-as-usual forecast and a hopeful portfolio of partial solutions. PNAS. 105:11579–11586. DOI:10.1073/pnas.0801911105.
- Elser JJ, Bracken MES, Cleland EE, Griner DS, Harpole WS, Hillebrand H, Ngai JT, Seabloom EW, Shurin JB, Smith JE. 2007. Global analysis of nitrogen and phosphorus limitation of primary producers in freshwater, marine and terrestrial ecosystems. Ecol Lett. 10:1135–1142. DOI:10.1111/j.1461-0248.2007.0113.x.
- European Commission. 2010. The factory of life: why soil biodiversity is so important. Luxembourg: Office for Official Publications of the European Union. DOI:10.2779/17050.
- FAO. 2012. World agriculture watch: methodological framework summary version 2.6. Rome: FAO.
- FAO. 2020. State of knowledge of soil biodiversity-status, challenges and potentialities. Rome: FAO. DOI:10.4060/cb1928en.
- Ferris H. 2010. Form and function: metabolic footprints of nematodes in the soil food web. Eur J Soil Biol. 46:97–104. DOI:10.1016/j.ejsobi.2010.01.003.
- Fiorini A, Boselli R, Maris SC, Santelli S, Perego A, Acutis M, Brenna S, Tabaglio V. 2020. Soil type and cropping system as drivers of soil quality indicators response to no-till: a 7-year study. Appl Soil Ecol. 155:103646. DOI:10.1016/j.apsoil.2020.103646.
- Fitzherbert EB, Struebig MJ, Morel A, Danielsen F, Brühl CA, Donald PF, Phalan B. 2008. How will oil palm expansion affect biodiversity? Trends Ecol Evol. 23:538–545. DOI:10.1016/j.tree.2008.06.012.
- Fox J, Castella J. 2013. Expansion of rubber (Hevea brasiliensis) in mainland Southeast Asia: what are the prospects for small holders? J Peasant Stud. 40:155–170. DOI:10.1080/03066150.2012.750605.
- Ganesh PS, Gajalakshmi S, Abbasi SA. 2009. Vermicomposting of the leaf litter of acacia (Acacia auriculiformis): possible roles of reactor geometry, polyphenols, and lignin. Bioresour Technol. 100:1819–1827. DOI:10.1016/j.biortech.2008.09.051.
- Griffiths BS, Ritz K, Bardgett RD, Cook R, Christensen S, Ekelund F, Sørensen SJ, Bååth E, Bloem J, de Ruiter PC, et al. 2000. Ecosystem response of pasture soil communities to fumigation-induced microbial diversity reductions: an examination of the biodiversity–ecosystem function relationship. Oikos. 90:279–294. DOI:10.1034/j.1600-0706.2000.900208.x.
- Guéi AM, Tondoh JE. 2012. Ecological preferences of earthworms for land-use types in semi-deciduous forest areas, Ivory Coast. Ecol Indic. 18:644–651. DOI:10.1016/j.ecolind.2012.01.018.
- Haggar J, Pons D, Saenz L, Vides M. 2019. Contribution of agroforestry systems to sustaining biodiversity in fragmented forest landscapes. Agric Ecosyst Environ. 283:106567. DOI:10.1016/j.agee.2019.06.006.
- Herren GL, Habraken J, Waeyenberge L, Haegeman A, Viaene N, Cougnon M, Rehuel D, Steel H, Bert W. 2020. Effects of synthetic fertilizer and farm compost on soil nematode community in long-term crop rotation plots: a morphological and metabarcoding approach. PLoS ONE. 15:e0230153. DOI:10.1371/journal.pone.0230153.
- IRSG. 2015. Rubber statistical bulletin. Singapore: International Rubber Study Group.
- Jiang YJ, Liu MQ, Zhang JB, Yan C, Chen XY, Chen LJ, Li HX, Zhang XX, Sun B. 2017. Nematode grazing promotes bacterial community dynamics in soil at the aggregate level. ISME J. 11:2705–2717. DOI:10.1038/ismej.2017.120.
- Kajak A. 1995. The role of soil predators in decomposition processes. Eur J Entomol. 92:573–580. [accessed 2021 Dec 5]. https://www.eje.cz/pdfs/eje/1995/03/06.pdf.
- Kazakou E, Fried G, Richarte J, Gimenez O, Violle C, Metay A. 2016. A plant trait-based response-and-effect frameworl to assess vineyard inter-row soil management. Bot Lett. 163:1–16. DOI:10.1080/23818107.2016.1232205.
- Li H, Ma Y, Aide TM, Liu W. 2008. Past, present and future land-use in Xishuangbanna, China and the implications for carbon dynamics. For Ecol Manage. 255:16–24. DOI:10.1016/j.foreco.2007.06.051.
- Li S, Song M, Jing S. 2021. Effects of different carbon inputs on soil nematode abundance and community composition. Appl Soil Ecol. 163:103915. DOI:10.1016/j.apsoil.2021.103915.
- Liu CA, Liang MY, Nie Y, Tang JW, Siddique KHM. 2019. The conversion of tropical forests to rubber plantations accelerates soil acidification and changes the distribution of soil metal ions in topsoil layers. Sci Total Environ. 696:134082. DOI:10.1016/j.scitotenv.2019.134082.
- Ludwig JA, Reynold JF. 1988. Statistical ecology: a primer on computing and methods. New York: John Wiley and Sons. DOI:10.1016/0304-3800(91)90106-B.
- Melero S, López-Garrido R, Murillo M, Moreno F. 2009. Conservation tillage: shortand long-term effects on soil carbon fractions and enzymatic activities under Mediterranean conditions. Soil Till Res. 104:292–298. DOI:10.1016/j.still.2009.04.001.
- Melman DA, Kelly C, Schneekloth J, Caldeŕon F, Fonte SJ. 2019. Tillage and residue management drive rapid changes in soil macrofauna communities and soil properties in a semiarid cropping system of Eastern Colorado. Appl Soil Ecol. 143:98–106. DOI:10.1016/j.apsoil.2019.05.022.
- Meteorological department. 2015. Agrometeorological report – September 2015. Bangkok: Meteorological Department.
- Micucci FG, Taboada MA. 2006. Soil physical properties and soybean (Glycine max, Merrill) root abundance in conventionally and zero-tilled soil in the humid pampas of Argentina. Soil Till Res. 86:152–162. DOI:10.1016/j.still.2005.02.004.
- Moazzam NS, Zhang Y, Liqing S, Zhao W, Zhang X. 2014. Managing carbon sinks in rubber (Hevea brasilensis) plantation by changing rotation length in SW China. PLoS One. 9:e115234. DOI:10.1371/journal.pone.0115234.
- Mulder C, Van Wijnen HJ, Van Wezel AP. 2005. Numerical abundance and biodiversity of belowground taxocenes along a pH gradient across the Netherlands. J Biogeogr. 32:1775–1790. DOI:10.1111/j.1365-2699.2005.01321.x.
- Neher DA. 2010. Ecology of plant and free-living nematodes in natural and agricultural soil. Annu Rev Phytopathol. 48:371–394. DOI:10.1146/annurev-phyto-073009-114439.
- Nielsen UN, Wall DH, Six J. 2015. Soil biodiversity and the environment. Annu Rev Environ Resour. 40:63–90. DOI:10.1146/annurev-environ-102014-021257.
- Obriot F, Stauffer M, Goubard Y, Cheviron N, Peres G, Eden M, Revallier A, Vieuble-Gonod L, Houot S. 2016. Multi-criteria indices to evaluate the effects of repeated organic amendment applications on soil and crop quality. Agric Ecosyst Environ. 232:165–178. DOI:10.1016/j.agee.2016.08.004.
- Peech M. 1965. Hydrogen-ion activity. In: Black CA, editor. Methods of soil analysis. Vol. 2. Wisconsin: American Society of Agronomy; p. 914–926.
- Pielou EC. 1966. The measurement of diversity in different types of biological collections. J Theoretical Biol. 13:131–144. DOI:10.1016/0022-5193(66)90013-0.
- R Development Core Team. 2014. R: a language and environment for statistical computing. Vienna: R Foundation for Statistical Computing.
- Rousseau L, Fonte SJ, Téllez O, Van der Hoek R, Lavelle P. 2013. Soil macrofauna as indicators of soil quality and land use impacts in smallholder agroecosystems of western Nicaragua. Ecol Indicat. 27:71–82. DOI:10.1016/j.ecolind.2012.11.020.
- Santos PZF, Crouzeilles R, Sansevero JBB. 2019. Can agroforestry systems enhance biodiversity and ecosystem service provision in agricultural landscapes? A meta-analysis for the Brazilian Atlantic Forest. For Ecol Manage. 433:140–145. DOI:10.1016/j.foreco.2018.10.064.
- Schneider AK, Schröder B. 2012. Perspectives in modelling earthworm dynamics and their feedbacks with abiotic soil properties. Appl Soil Ecol. 58:29–36. DOI:10.1016/j.apsoil.2012.02.020.
- Seinhorst JW. 1956. The quantitative extraction of nematodes from soil. Nematologica. 1:249–267. DOI:10.1163/187529256X00096.
- Semper-Pascual A, Decarre J, Baumann M, Busso JM, Camino M, Gómez-Valencia B, Kuemmerle T. 2019. Biodiversity loss in deforestation frontiers: linking occupancy modelling and physiological stress indicators to understand local extinctions. Biol Conserv. 236:281–288. DOI:10.1016/j.biocon.2019.05.050.
- Sinsabaugh RL, Lauber CL, Weintraub MN, Ahmed B, Allison SD, Crenshaw C, Contosta AR, Cusack D, Frey S, Gallo ME, et al. 2008. Stoichiometry of soil enzyme activity at global scale. Ecol Lett. 11:1252–1264. DOI:10.1111/j.1461-0248.2008.01245.x.
- Smith P, Cotrufo MF, Rumpel C, Paustian K, Kuikman PJ, Elliott JA, McDowell R, Griffiths RI, Asakawa S, Bustmante M, et al. 2015. Biogeochemical cycles and biodiversity as key drivers of ecosystem services provided by soils. Soil. 1:665–685. DOI:10.5194/soil-1-665-2015.
- Sofo A, Mininni AN, Ricciuti P. 2020. Comparing the effects of soil fauna on litter decomposition and organic matter turnover in sustainably and conventionally managed olive orchards. Geoderma. 372:114393. DOI:10.1016/j.geoderma.2020.114393.
- Tan B, Wu F, Yang W, Yu S, Liu L, Wang A, Yang Y. 2013. Seasonal dynamics of soil fauna in the subalpine and alpine forests of west Sichuan at different altitudes. Acta Ecol Sin. 33:12–22. DOI:10.1016/j.chnaes.2012.12.003.
- Tibbett M, Gil-Martínezb M, Fraserc T, Greend ID, Duddigana S, De Oliveiraa VH, Raulund-Rasmussene K, Sizmurf T, Diaz A. 2019. Long-term acidification of pH neutral grasslands affects soil biodiversity, fertility and function in a heathland restoration. Catena. 180:401–415. DOI:10.1016/j.catena.2019.03.013.
- Tien G, Olimah JA, Adeoye GO, Kang BT. 2000. Regeneration of earthworm population in a degraded soil by natural and planted fallows under humid tropical conditions. Soil Sci Soc Am J. 64:222–228. DOI:10.2136/sssaj2000.641222x.
- Treonis AM, Austin EE, Buyer JS, Maul JE, Spicer L, Zasada IA. 2010. Effects of organic amendment and tillage on soil microorganisms and microfauna. Appl Soil Ecol. 46:103–110. DOI:10.1016/j.apsoil.2010.06.017.
- Turbé A, Toni AD, Benito P, Lavelle P, Lavelle P, Ruiz N, Van der Putten WH, Labouze E, Mudgal S. 2010. Soil biodiversity: functions, threats and tools for policy makers. Report for European Commission (DG Environment). Paris: Bio Intelligence Service, IRD, and NIOO.
- Turner BL, Condron LM. 2013. Pedogenesis, nutrient dynamics, and ecosystem development: the legacy of TW Walker and JK Syers. Plant Soil. 367:1–10. DOI:10.1007/s11104-013-1750-9.
- Van Noordwijk M, Cerri C, Woomer PL, Nugroho K, Bernoux M. 1997. Soil carbon dynamics in the humid tropical forest zone. Geoderma. 79:187–225. DOI:10.1016/S0016-7061(97)00042-6.
- Van Strien AJ, Soldaat LL, Gregory RD. 2012. Desirable mathematical properties of indicators for biodiversity change. Ecol Indic. 14:202–208. DOI:10.1016/j.ecolind.2011.07.007.
- Villenave C, Ekschmitt K, Nazaret S, Bongers T. 2004. Interactions between nematodes and microbial communities in a tropical soil following manipulation of the soil food web. Soil Biol Biochem. 36:2033–2043. DOI:10.1016/j.soilbio.2004.05.022.
- Walkley A, Black IA. 1934. An examination of the Degtjareff method for determining of soil organic matter and a proposed modification of the chromic acid titration method. Soil Sci. 37:29–38. DOI:10.1097/00010694-193401000-00003.
- Warren-Thomas E, Dolman PM, Edwards DP. 2015. Increasing demand for natural rubber necessitates a robust sustainability initiative to mitigate impacts on tropical biodiversity. Conser Lett. 8:230–241. DOI:10.1111/conl.12170.
- Wu P, Wang C. 2019. Differences in spatiotemporal dynamics between soil macrofauna and mesofauna communities in forest ecosystems: the significance for soil fauna diversity monitoring. Geoderma. 337:266–272. DOI:10.1016/j.geoderma.2018.09.031.
- Xu X, Sun Y, Sun J, Cao P, Wang Y, Chen HYH, Wang W, Ruan H. 2020. Cellulose dominantly affects soil fauna in the decomposition of forest litter: a meta-analysis. Geoderma. 378:114620. DOI:10.1016/j.geoderma.2020.114620.
- Ye Y, Rui Y, Zeng Z, He X, Wang K, Zhao J. 2020. Responses of soil nematode community to monoculture or mixed culture of a grass and a legume forage species in China. Pedosphere. 30:791–800. DOI:10.1016/S1002-0160(20)60039-X.
- Zhang H, Zhang GL, Zhao YG, Zhao WJ, Qi ZP. 2007. Chemical degradation of a Ferralsol (Oxisol) under intensive rubber (Hevea brasiliensis) farming in tropical China. Soil Till Res. 93:109–116. DOI:10.1016/j.still.2006.03.013.