
ABSTRACT
Fluency is an important yet difficult-to-measure criterion in interpreting assessment. This empirical study of English-Chinese consecutive interpreting aims to identify fluency parameters for a machine-learning-based automated assessment system. The main findings include: (a) empirical evidence supports the choice of the median values as the cut-offs for unfilled pauses and articulation rate; (b) it informs the selection of outliers as particularly long unfilled pauses, relatively long unfilled pauses, particularly slow articulation and relatively slow articulation; (c) number of filled pauses, number of unfilled pauses, number of relatively slow articulation, mean length of unfilled pauses, mean length of filled pauses can be chosen to build machine-learning models to predict interpreting fluency in future studies as they can explain the variance of established temporal measures and show stronger explanatory power than dependent variables when predicting scores. The study identifies assessment rubrics on an empirical basis and provides a methodological solution to automate the labour-intensive tasks in interpreting assessments.
1. Introduction
Since the mid-1980s, some researchers have explored criteria for interpreting quality assessment mainly through survey studies (e.g., Bühler, Citation1986). Fluency of delivery is identified as one of the most important criteria for interpreting quality along with criteria about content such as sense consistency, logical cohesion and correct terminology, according to the results from surveys among interpreters and users (Bühler, Citation1986; Kurz, Citation1993, Citation2002; Pöchhacker & Zwischenberger, Citation2010). Fluency as a quality criterion in interpreting assessment is a particularly meaningful but much under-explored topic in interpreting studies. A major reason for the under-exploration is mainly due to the evanescent nature of interpreting and speaking, which causes special difficulties in data collection, collation, transcription, annotation and analysis (esp. of prosodic and paraverbal features). As seen in the literature below, some studies have begun investigating the phenomenon of (dis)fluency in simultaneous interpreting, with the indices of filled, unfilled pauses and repairs, with less attention on consecutive interpreting.
Against this background, this study intends to identify the parameter that best predicts five established temporal measures for objective fluency assessments. It explores the quantification of acoustical measures and extraction of fluency features in English-Chinese consecutive interpreting, which can be used to build a machine-learning-based automated assessment system. We focus specifically on the variables for two reasons. One reason is that literature has proposed many variables based on the theory, but descriptive statistics has not examined the interpreting data. The other reason is that the variables are expected to be used to build a system for a more objective assessment of fluency than humans. When raters assess the quality in a holistic manner, it is not easy to rate in the aspect of fluency by calculating the occurrences of disfluency. Not all raters all equally severe overall, even when they rate each sentence within the same rendition. Therefore, fluency quantification via computer system is expected to facilitate objective assessment for interpreting training and academic research.
Building on relevant concepts and findings validated by previous researchers in interpreting studies and spoken language studies, fluency can be measured by five temporal measures: phonation time ratio, speaking rate, articulation rate, the mean length of runs and the average length of pauses (Towell et al., Citation1996). This study further examines the relationship among variables first and investigate how variation of phonation time ratio, speaking rate, articulation rate, the mean length of runs and the average length of pauses as indicators of interpreting fluency can be explained by parameters extracted based on descriptive statistics in regression analysis.
2. Literature review
Spoken language studies have sought to define and categorise fluency in terms of objective acoustic measures of an utterance (Segalowitz, Citation2010; Tavakoli & Skehan, Citation2005). According to Paul Lennon, fluency is ‘the listener's feeling that the psycholinguistic processes of speech planning and speech output are operating readily and efficiently’ (Lennon, Citation1990, p. 391). Following that, Towell et al. (Citation1996) conclude that fluency can be measured by five temporal measures based on the previous studies: phonation time ratio, speaking rate, average length of pauses, articulation rate, and mean length of runs. Tavakoli and Skehan (Citation2005) categorise fluency into breakdown fluency, speed fluency and repair fluency. Breakdown fluency is represented by filled pause and unfilled pauses in a speech. Repair fluency includes reformulation, replacement, false starts and repetition of words or phrases.
In interpreting studies, fluency has been conceptualised in a narrower sense, as shown in its limited use of only some measures listed above and in its focus on pauses and hesitation in the interpreting product. Commonly used indices of disfluency are filled pauses and unfilled pauses (Pöchhacker, Citation2016). Mead (Citation2005) posits that the pauses in interpreting might be attributed to difficulty with formulation or notes, logical doubts or other reasons. The author found that novices tend to have more formulation problems and proficient interpreters are more likely to pause. An analysis based on the European Parliament Interpreting Corpus (EPIC) for two types of disfluencies (mispronounced words and truncated words) by Bendazzoli et al. (Citation2011) reveals that these two types of disfluencies appeared more frequently than filled pauses in the interpretations.
The findings on the threshold of silent pauses are rather eclectic. Goldman-Eisler (Citation1958) concludes that the minimum cut-off point should be 0.25 seconds because 71.5% of pauses in oral speech are between 0.25 and 1 second. Grosjean and Deschamps (Citation1972, Citation1973, Citation1975) apply the same standard in their study. However, according to Raupach's (Citation2011) definition, pauses are intervals of 0.3 seconds or longer, within or between sentences. Riggenbach (Citation1991) distinguishes hesitation from pauses. He defines the threshold for micro-pauses as 0.2 seconds, hesitation ranges from 0.3 to 0.4 seconds, and an unfilled pause between 0.5 and 3 seconds. Towell et al. (Citation1996) conclude the minimum cut-off point should be 0.28 seconds. Mead (Citation2005) sets the threshold at 0.25 seconds, and the upper cut-off point is 3 seconds.
Interpreting studies about fluency have concerned mainly with the simultaneous mode (Bakti, Citation2009; Macías, Citation2006; Petite, Citation2005; Tissi, Citation2000; Wang & Li, Citation2015), with little attention to consecutive interpreting. Among the previous studies, Wang and Li's (Citation2015) empirical study on characteristics of and motivations for pauses is most relevant to the present study since it conducts empirical research on pauses about the language pair of English and Chinese. They find that pauses are less frequent but longer in Chinese-English simultaneous interpreting than in the original speech and that pauses are distributed hierarchically in correspondence with syntactic complexity.
It is nevertheless only recently that several empirical studies have begun to apply more complex statistical models in testing the predictability of objective fluency in modelling judged fluency in interpreting. Objective fluency refers to counting occurrences of a certain type of disfluency. Judged fluency is the rating of fluency perceived by raters. Yu and van Heuven (Citation2017) report result from an experimental study of consecutive interpreting involving twelve trainee interpreters, suggesting that speech rate, number of unfilled pauses, articulation rate and mean length of pauses could be the main predictors of judged fluency. These findings are confirmed in the subsequent work by Han et al. (Citation2020), who conclude that mean length of unfilled pauses, phonation ratio, mean length of run and speech rate are strongly correlated with perceived fluency ratings in both directions and across raters. These empirical inquiries converge on the view that assessment of fluency in interpreting is strongly related to acoustic measures such as speech rate, articulation rate, phonation time ratio, mean length of unfilled pauses and mean length of runs, which can be used as a basis for the exploration of automated assessment of interpreting fluency.
Though the above studies have identified some predictors for interpreting fluency, little research has been done to identify objective fluency parameters that explain judged fluency in an automated approach, possibly due to the methodological difficulty of computed-system building. As a necessary step in empirical research, transcription and extraction of paraverbal features have always relied on manual work, which typically use such software as PRAAT or Cool Edit Pro to convert acoustic signals into a visualised wave pattern so that fluency features can be identified manually. The whole process also requires a lot of time and effort from annotators and analysts.
In addition, in order to provide acoustic measures to index interpreting fluency, specific temporal measures representing data attributes based on statistical distribution are required to build more precise regression models. The approach to identifying the independent variables is expected to extract the smallest number of variables to obtain a solid and valid assessment of fluency as an economic approach.
Finally, the linear regression models built in the recent literature are based on data truncated per minute with variables such as articulation rate, speaking rate and phonation time ratio (Yu & van Heuven, Citation2017). The limitation of such a method of collecting data is that there won't be enough data to build a machine-learning model. It is worthwhile to explore a new methodology to better explain the variables with outliers spreading within the dataset by understanding, summarising and organising data.
Against this background, this study aims to define and identify parameters of objective fluency that explain judged fluency. It is expected the identified parameters can be extracted in an automated approach for the future research via a python script. It bases parameters in part on Yu and van Heuven (Citation2017) and Han et al. (Citation2020) ‘s previous research and develops new parameters. All parameters are operationalised under Tavakoli and Skehan's categorisation of fluency since they are closely related to Tavakoli and Skehan's theory of utterance fluency and are suitable to be quantified in empirical experiments. In contrast to earlier studies, fluency parameters in this study were developed through quantitative descriptions and analysed in a manageable form. They can thus be applied in machine learning training for an automatic assessment system.
3. Research questions
Based on the above literature review, it has been identified as meaningful to extract fluency features applicable in an automatic assessment system. This study will explore the following research questions:
How can the prosodic features, i.e., filled pauses, unfilled pauses, and articulation rate, which are difficult to be transcribed manually, be extracted and retained in the transcription using a more efficient method?
What parameters measuring fluency can be identified through statistical analysis of interpreting data?
How do the interpreting fluency parameters relate to each other?
How much variation of dependent variables, i.e., phonation time ratio, articulation rate, speaking rate, average length pauses, and mean length of runs, which have been verified to explain fluency, is explained by fluency parameters defined by descriptive statistics in regression models?
4. Methodology
4.1 Developing a model for identifying parameters to assess interpreting fluency automatically
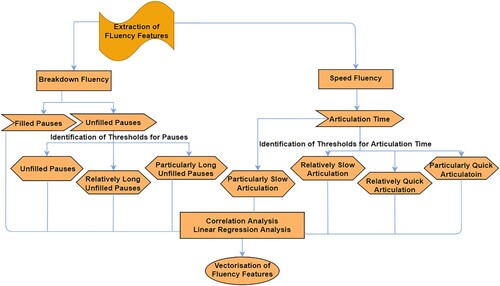
This study develops a model for identifying parameters to build the machine-learning-based automated system to assess interpreting fluency. Before the extraction of fluency features, the interpreting data as video and audio recordings first need to be transcribed into texts and written into a bespoke database. Next, fluency features are identified with newly defined thresholds for vectorisation. Vectorisation of fluency features is a concept to compute the best machine-readable parameters. In other words, it maps fluency features to corresponding vectors of real numbers, used to find fluency predictions. The study extracts breakdown and speed fluency features based on a descriptive statistical analysis of interpreting data. However, the development of Natural Language Processing is not advanced enough to assist in identifying features for repair fluency. Data distribution is displayed in a standardised way to select thresholds for unfilled pauses and articulation time (Bird et al., Citation2009). It is based on the anatomy of a five-number summary (‘minimum’, first quartile (Q1) or twenty-fifth percentile, median, third quartile (Q3) or seventy-fifth percentile, and ‘maximum’). Outliers, incidental systematic flaws or anomalous observations distant from the data centre are calculated to indicate disfluency. The new approach applied in the model helps interpret and organise data for regression modelling ().
Figure 1. A model of identification of interpreting fluency parameters.
4.2 Corpus and ratings of renditions
The data used in this study are recorded interpreting performances of interpreting trainees in the professional interpreter training programme. They were all would-be professionals majoring in interpreting, studying consecutive interpreting and simultaneous interpreting for two semesters. Their L1 language is Mandarin and L2 language is English.
The raters include a native English tutor and a Mandarin Chinese interpreting tutor with both more than ten years of professional interpreting experience. They rated each trainee's performance in four aspects: accuracy, completeness, use of language, and delivery and presentation. In terms of delivery and presentation, paraverbal features are assessed such as fluency and good pace, articulation and pronunciation, and nonverbal features such as the ability to engage with the audience (eye contact and posture) and stamina (see appendix 1). The discrepancy in rating a trainee's performance between two raters is normally smaller than three points. In case where the discrepancy is bigger than three points, a third-rater adjudication is employed. The mean score from the three raters is used as the final.
There are 48 recordings in total performed by 24 participants. The database contains two renditions per participant as each participant performed interpreting on two different topics. The recordings of interpreting performances are collected at three critical assessment points of the one-year postgraduate interpreting programme: in the middle and at the end of Semester 1 and at the end of Semester 2.
In Semester 1, the participants interpret consecutively at mid-term a speech of about 4.5 minutes, and in the final a speech of about 5.5 minutes. At the end of Semester 2 they interpret consecutively a speech of about 7–8 minutes with more specialised content and information density. All the speeches are delivered spontaneously without a script though the speaker is allowed to prepare the content on the topic in advance.
4.3 Automated transcription
All video files are first converted into audio files and then transcribed automatically via a speech-recognition engine with a self-designed system on Python. FLAC format of audio is preferable and outperforms the MP3 in preserving the quality to improve transcription.
‘Speech-to-text’ cloud service from IBM is integrated with the application programming interface. IBM returns more accurate timestamps and reserves filled pauses in interpreted texts. By contrast, Google provides superior results in transcription with the terminology or name entity, but it merges unfilled pauses with the duration of spoken words and returns less accurate timestamps. This study opts for IBM Waston as the primary goal of this study is to identify prosodic features based on accurate timestamp information. The accuracy of the automatic transcription is 95.6%, as the study also annotates the incorrect transcription.
4.4 Data analysis
Before building regression models, it is necessary to find correlations among dependent and independent variables (see ) since multicollinearity might happen when independent variables in the regression model are highly correlated to each other. Multicollinearity makes it difficult to interpret regression models and leads to overfitting problems. The quantitative data fit into bivariate and multiple linear regression inferential statistical modelling to explore the extent to which different temporal measures could explain the variance of the fluency predictand (Hebbali, Citation2020; R Core Team, Citation2021). R feature selection technique, Best Subsets and Stepwise Regression (Venables & Ripley, Citation2002) is applied to identifying key variables responding to the dependent variables and overcoming overfitting problems. The Best Subsets can calculate regression models of all possible combinations of parameters, but it might increase the computational complexity. Thus, this study also uses bidirectional elimination in stepwise regression, combining forward selection and backward elimination procedures to select the smallest needed set of temporal measures to predict five measures corroborated as fluency-related measures.
Table 1. List of 15 selected temporal measures of fluency and their brief definition.
The regression variables are calculated based on timestamps. Transcription and timestamps are stored in a dataset built in the Relational Database Management System and organised into multiple tables for further analysis. In the study, fifty-one English-to-Chinese consecutive interpreting videos have been transcribed into fifty-one files containing 68,305 characters. The total count of pauses is 6776 (filled and unfilled pauses), and the total pause duration is 5627 seconds (93.8 minutes).
5. Results
5.1 Fluency parameters identified
summarises fifteen parameters of fluency in the study (for details of the calculation, see ), which base dependent variables on Towell et al.'s (Citation1996) temporal measures of speech fluency and some independent variables on Han et al. (Citation2020) and Yu and van Heuven (Citation2017) ‘s measures in previous studies.
One of the differences between dependent and independent variables is that independent variables are those extracted based on descriptive analysis. The thresholds to define unfilled pauses are concluded from the perspective of L2 oral fluency, with no previous study exploring it from interpreting studies. Dependent variables are those concluded by Towell et al. (Citation1996). Parameters with * are newly defined in this article, while the others correspond to the ones proposed and used by others in previous studies (Han et al., Citation2020; Towell et al., Citation1996; Yu & van Heuven, Citation2017).
5.1.1 Parameters related to pauses
The distribution of data for unfilled pause is skewed to the right, with mean value greater than the median value. The skewness indicates that the median value of 0.25 seconds should be taken as the cut-off point for unfilled pauses instead of the mean value of 0.45 seconds, as 0.25 seconds is the centre of the dataset without being affected by outliers. Number of unfilled pauses (NUP) counts the number of unfilled pauses equal to and longer than 0.25 seconds, excluding the first pause at the very beginning of interpreting.
New parameters are defined based on the outliers. Mild outliers of unfilled pauses are calculated as any values larger than 1.405 seconds (Q3 + 1.5 times IQR) and smaller or equal to 2.2 seconds (Q3 + 3 times IQR). Extreme outlier of unfilled pauses is any value larger than 2.2 seconds (see ). Therefore, number of relatively long unfilled pauses (NRLUP) and number of particularly long unfilled pauses (NPLUP), corresponding to number of mild and extreme outliers, are developed to better describe the attributes possessed by pauses.
Table 2. Data distribution based on a five-number summary.
Number of filled pauses (NPF) refers to the number of 啊(uh),嗯(mm),and 呃(er).
5.1.2 Parameters related to articulation time of syllables
New measures in terms of speed are also developed by applying the same method. IQR of duration per syllable ranges from 0.1 to 0.2 seconds, and mean value is approximately equal to the median with fewer outliers, indicating trainees hesitated and spoke slowly. Upper mild outlier of articulation is any value larger than 0.388 seconds (Q3 + 1.5 times IQR) and smaller than or equal to 0.53 seconds (Q3 + 3 times IQR); upper extreme outlier of articulation is any value larger than 0.53 seconds. Lower mild outlier of articulation is any value smaller than 0.007 seconds (Q1 − 1.5 times IQR) and larger than or equal to −1.51 (Q1 − 3 times IQR); lower extreme outlier of articulation is any value smaller than −1.51 seconds (see ). The thresholds help generate four parameters, namely, number of relatively slow articulation (NRSA), number of particularly slow articulation (NPSA), number of relatively quick articulation (NMQA), and number of particularly quick articulation (NEQA).
Table 3. Thresholds to define outliers.
5.2 Predictability of the variables tested in statistical models
5.2.1 Correlation between temporal measures
The inter-correlation among the parameters has been summarised in to estimate regression models better and determine how well each independent variable can be used most effectively to predict dependent variables. The correlation between two variables is also measured to check if multicollinearity occurs, which may lead to skewed or misleading results. On the bottom of the diagonal, the bivariate scatter plots with a fitted line are displayed to show the correlation between two measures. The closer the data points gather to form a straight line, the higher the correlation between the two measures is.
Figure 2. Correlation matrix chart. Note * p < 0.05, **p < 0.01, ***p < 0.001.
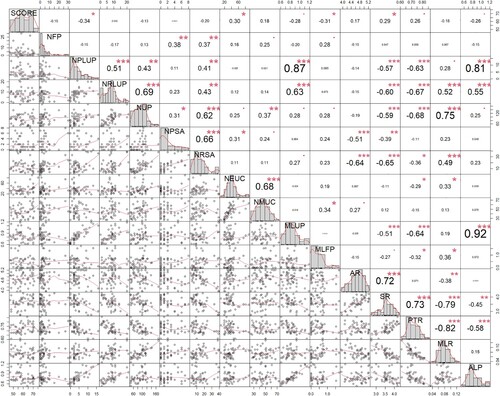
Correlation coefficient values are presented on the top of the diagonal. Interestingly, in theory, some indices that are supposed to cluster together show very low correlation. Although both NUP and MLUP belong to breakdown fluency, no moderate or strong correlations are identified between them (r = 0.28, p < 0.05). However, two newly proposed measures, NPLUP and NRLUP, with absolute Pearson's r values ranging from 0.63 to 0.87, do have a positive, strong, and moderate correlation with MLUP, respectively. Pearson correlation analysis also reveals a strong positive association between NPLUP and ALP (r = 0.81, p < 0.001), and a negative moderate correlation between NPLUP and PTR (r = −0.67, p < 0.001). Another newly developed measure, NRSA, has a negative moderate correlation with both SR (r = −0.65, p < 0.001) and AR (r = −0.64, p < 0.001). High correlations between the new parameters and dependent variables help to explain the variance of dependent variables better in regression models.
5.2.2 Regression analysis of temporal measures
Five dependent variables are explained with pre-selected most correlated predictors by building linear regression models. Two general scores between zero and one, the so-called R2 and adjusted R2, gauge the variance, with a larger adjusted R2 corresponding to a better fit. Regression models built by best subset selection for each dependent variable include models built with only one variable, all possible combinations of variables and a full model. The best model predicting AR by stepwise regression is explained by NFP, NUP, NRSA and MLUP with an adjusted R2 value of 0.480 (see appendix 3). Four utterance measures, NRSA, NPLUP, NRLUP, and NUP, are selected as potential predictors in the regression analysis to model SR. 16 regression models are built totally. In conclusion of SR, the best model by subset is model 15 (i.e., NRSA + NPLUP, + NRLUP + NUP) with an adjusted R2 value of 0.547; the best model by stepwise regression is explained by model 16 (NFP + NRSA + MLUP + MLFP + NUP) with an adjusted R2 value of 0.591 (see appendix 4). The analysis in appendix 5 predicts PTR by NPLUP, MLUP, NRLUP and NUP. The last model via stepwise selection explains 71.4% of PTR variance, and the full model explains 66.1%, the two most successful models predicting PTR in the study. ALP is perfectly explained by two different sets of predictors (see appendix 6). The model with only one variable of MLU accounts for 83.6% of the variance in ALP as the best result. As for the models predicting MLR, the one by stepwise selection produces the best results (56.4%) with NUP and MLFP (see appendix 7).
5.2.3 Regression analysis explaining holistic manual ratings
Regression models are built to compare their ability to predict manual scores with dependent and independent variables, respectively. The score presents results for models with the best performance. Model 1 using two independent predictors (MLFP, NPLUP) shows a more desired property of goodness of fit, though this parsimonious model explains 16.6% of the variance of ratings. In contrast, models built with dependent variables display limited explanatory power in Model 3 (SR) and Model 4 (AR + PTR + MLR), explaining 6.6% of the variance of human ratings.
Table 4. Regression models predicting overall assessment SCORE.
6. Discussion
About Research Question 1, the prosodic features in interpreting that would be lost in manual transcription are retained and extracted via the rule-based calculation based on timestamps by means of Python script. It is expected that once the parameters have been identified, the rule-based programming could automate the extraction and annotation for the future research. Specifically, the study integrates automatic transcription results and timestamps provided by the Waston service provided by IBM. The innovative part about identifying the fluency parameters using ‘speech-to-text’ service than software for speech analysis in phonetics is that it uses the timestamps to calculate pauses and articulation time and conduct statistical analysis so that all the prosodic information can be extracted in batches.
Concerning Research Question 2, breakdown fluency related to filled pauses, unfilled pauses and speed fluency concerning articulation rate can be identified through automated processing of interpreting data. Ten parameters are identified through the automated processing of interpreting data, namely, number of unfilled pauses, mean length of unfilled pauses, number of relatively long unfilled pauses, number of particularly long unfilled pauses, number of filled pauses, mean length of filled pauses, number of relatively slow articulation, number of particularly slow articulation, number of relatively quick articulation, and number of particularly quick articulation. Seven of them are newly defined parameters (NUP, NRLUP, NPLUP, NRSA, NPSA, NRQA, NPQA).
As the most important index of breakdown fluency, the straightforward way to describe and characterise it is to define its threshold. However, the controversy concerning the selection of a pause in the literature shows that there has been little empirical evidence supporting the choice of a particular threshold. Like previous studies (Goldman-Eisler, Citation1958; Towell et al., Citation1996), this study also uses 0.25 seconds as the threshold of unfilled pauses. While this result resonates with the finding, the principles employed to conclude are different. The centre value of 0.25 seconds in the study accurately represents the length of unfilled pauses in trainees’ performance because very short or long pauses influence the widely used average value of 0.45 seconds. It is noticeable that 0.25 seconds as the median value is smaller than 0.45 seconds as the mean value, indicating that the data are ‘skewed’ such that the mean is pulled higher by long pauses. Since the threshold is only valid for the specific data set in this study and maybe a different result in other language pairs or ever larger data sets. It is suggested that the median is informative to be used as a cut-off for an unfilled pause in future studies. By calculating the interquartile range, we determine whether some long pauses are outliers and distinguish relatively long pauses from particularly long pauses to explain indicators accurately. The newly developed parameters in the study are scientifically interesting observations. Future interpreting research may identify the long pauses as outliers based on the five-number summary. The same method has been applied to distinguish articulation-related parameters.
Regarding Research Question 3, correlations among the parameters prove that the newly developed measures correlate more with the dependent variables. Han et al. (Citation2020) suggest that no correlation is identified among the measures of breakdown fluency. However, the study does not resonate with the previous findings, as number of particularly long unfilled pauses has strongly positive correlations with both mean length of unfilled pauses and average length of pauses, and number of relatively long unfilled pauses has a moderately positive correlation with mean length of unfilled pauses. Measures of speed fluency cluster together, as the number of relatively slow articulation has a moderately negative correlation with both speaking and articulation rate. The strong relationships among these indices indicate that these parameters, defined by outliers, can be used to judge fluency, for they better reflect trainees’ unproficiency and limited competence.
About Research Question 4, i.e., how much variation of dependent variables is explained by fluency parameters, it is found that the independent variables can explain the variation of the dependent variables. In the models best-predicting articulation rate, speaking rate, phonation time ratio, average length of pause, and mean length of runs, the R2 value ranges from 83.6% to 48%, with the selected parameters as number of filled pauses, number of unfilled pauses, number of relatively slow articulation, mean length of unfilled pauses, mean length of filled pauses. Although number of particularly long unfilled pauses correlates highly with mean length of unfilled pauses, these two independent variables have not been selected simultaneously in the best regression models predicting independent variables by stepwise selection. Therefore, the parameter chosen can be used to build a machine-learning model as it does not imply imperfect multicollinearity.
With respect to the approaches utilised in building the regression models, the best model explaining the variation of all the dependent variables are those built through the stepwise regression setup. This methodology selects all accurate measures and excludes all the noise predictors. It is beneficial when theory and experience provide a vague sense of which variables to include in the model. For instance, in the models predicting mean length of runs, since number of relatively long unfilled pauses and number of unfilled pauses correlate highly with mean length of runs, model 3 chooses these two measures to build a full model. However, stepwise selection in model 4 chooses number of unfilled pauses and mean length of filled pauses, the parameter showing a weak correlation with the mean length of runs, to build the regression model. Incidentally, the model built through the stepwise selection process presents a better result because it addresses the problem of overfitting. The model reduces the noise and makes a maximum contribution to explaining the variation of the dependent variables.
Regression models parsimoniously explain 16.6% of variance of human ratings. The model presents a weak explanatory power but is acceptable because human ratings are given by a holistic approach and the high variance in interpreting data. Therefore, fluency accounts for only a tiny portion of the variation. The results compared between the best models built with the newly developed parameters (adjusted R2 = 16.6%) and the dependent variables (adjusted R2 = 6.6%) show that new parameters explain human ratings better. The result of two best models using mean length of filled pauses is in line with previous findings, as Yu and van Heuven (Citation2017) suggest that measures related to filled pauses could be taken as a significant predictor of fluency ratings. The study also finds that mean length of unfilled pauses, and two specific measures related to articulation time constitute models explaining judged fluency, which partially corroborates with Han et al. (Citation2020).
7. Conclusion
This study identifies and vectorises objective utterance measures through descriptive statistical analysis of interpreting data. It also explores the best explanation for the variation of dependent variables with newly defined parameters. The regression models built with these new parameters explain the variation in five dependent variables from 48% to 83%. The analysis results indicate that (a) future interpreting studies should select the median value as the threshold for unfilled pauses or articulation rate; (b) outliers can be extracted as the relatively long and particularly long unfilled pauses, as well as relatively slow articulation and particularly slow articulation; (c) newly developed parameters explain human ratings better than well-established ones; (d) number of filled pauses, number of unfilled pauses, number of relatively slow articulation, mean length of unfilled pauses, mean length of filled pauses are selected to build machine-learning models to predict interpreting fluency in future studies.
Identification of dependent variables and redefinition of their correlation to fluency is applicable for the machine-learning-based automated interpreting assessment system. Similar to word embedding approach in deep learning for natural language processing where each word is represented by a real-valued vector, in this study, each fluency parameter is mapped to one vector so that the vector values are to be further learned by machine in a way that resembles human ratings of fluency. This has both methodological and practical implications for not only assessment of fluency in practice and research but also assessment of interpreting quality in a broader sense.
Despite the above findings, the study has several limitations. Firstly, the non-normal data of some independent variables with skewed distributions violated normality assumptions. With the application of our newly developed tool in future studies, larger normally distributed databases can help improve the explanatory power of the regression models. Secondly, the study only examines speed measures, while repair features remain unexplored because automatic segmentation of speech data is carried out on the basis of unfilled pauses rather than semantic meanings. Extraction of repair features such as false starts or reformulation is based on accurate punctuation-delimited clauses. Automatic speech recognition views pause as the boundaries between sentences when splitting audio files. Thus, inaccurate segmentation of the flow of speeches may result in invalid feature extraction. Future research can explore the possibility of segmentation based on text understanding via deep learning technology.
Disclosure statement
No potential conflict of interest was reported by the author(s).
Additional information
Funding
Notes on contributors
Xiaoman Wang
Xiaoman Wang is currently a PhD candidate in the digital humanities programme at the University of Leeds, UK. Her research interests are Interpreting Studies and computational linguistics, specifically automatic assessment for Chinese/English Interpreting.
Binhua Wang
Binhua Wang is Chair/Professor of interpreting and translation studies and previously Director of the Centre for Translation Studies in University of Leeds. He serves on the editorial boards of Babel, Forum, Chinese Translators Journal and Translation Quarterly. His research has focused on interpreting and translation studies, in which he has published over 40 articles in refereed CSSCI and SSCI/A&HCI journals and over a dozen peer-reviewed book chapters. He has authored the monographs Theorising Interpreting Studies and A Descriptive Study of Norms in Interpreting.
References
- Bakti, M. (2009). Speech disfluencies in simultaneous interpretation. In C. R. O. M. Dries DE (Ed.), Selected papers of the CETRA research seminar in translation studies 2008 (pp. 1–17). Leuven University Press. Retrieved March 5, 2022, from http://www.kuleuven.be/cetra/papers/papers.html Accessed 5th Mar 2021
- Bendazzoli, C., Sandrelli, A., & Russo, M. (2011). Disfluencies in simultaneous interpreting: A corpus-based analysis. In A. Kruger, K. Wallmach, & J. Munday (Eds.), Corpus-based translation studies: Research and applications (pp. 282–306). Continuum.
- Bird, S., Loper, E., & Klein, E. (2009). Processing raw text. In J. Steele (Ed.), Natural language processing with python (pp. 79–112). O'ReillyMedia Inc. https://doi.org/10.1007/s10579-010-9124-x
- Bühler, H. (1986). Linguistic (semantic) and extra-linguistic (pragmatic) criteria for the evaluation of conference interpretation and interpreters. Multilingua - Journal of Cross-Cultural and Interlanguage Communication, 5(4), 231–235. https://doi.org/10.1515/mult.1986.5.4.231
- Goldman-Eisler, F. (1958). The predictability of words in context and the length of pauses in speech. Language and Speech, 1(3), 226–231. https://doi.org/10.1177/002383095800100308
- Grosjean, F., & Deschamps, A. (1972). Analyse des variables temporelles du français spontané. Phonetica, 26(3), 129–156. https://doi.org/10.1159/000259407
- Grosjean, F., & Deschamps, A. (1973). Analyse des variables temporelles du français spontané. Phonetica, 28(3-4), 191–226. https://doi.org/10.1159/000259456
- Grosjean, F., & Deschamps, A. (1975). Analyse contrastive des variables temporelles de l’anglais et du français: Vitesse de parole et variables composantes, phénomènes d’hésitation. Phonetica, 31(3-4), 144–184. https://doi.org/10.1159/000259667
- Han, C., Chen, S., Fu, R., & Fan, Q. (2020). Modelling the relationship between utterance fluency and raters’ perceived fluency of consecutive interpreting. Interpreting. International Journal of Research and Practice in Interpreting, 22(2), 211–237. https://doi.org/10.1075/intp.00040.han
- Hebbali, A. (2020). olsrr: Tools for Building OLS Regression Models. R package version 0.5.3. https://CRAN.R-project.org/package=olsrr
- Kurz, I. (1993). Conference interpretation: Expectations of different user groups. The Interpreters Newsletter, 5, 13–21. http://hdl.handle.net/10077/4908
- Kurz, I. (2002). Conference interpreting: Quality in the ears of the user. Meta, 46(2), 394–409. https://doi.org/10.7202/003364ar
- Lennon, P. (1990). Investigating fluency in EFL: A quantitative approach. Language Learning, 40(3), 387–417. https://doi.org/10.1111/j.1467-1770.1990.tb00669.x
- Macías, M. P. (2006). Probing quality criteria in simultaneous interpreting: The role of silent pauses in fluency. Interpreting. International Journal of Research and Practice in Interpreting, 8(1), 25–43. https://doi.org/10.1075/intp.8.1.03pra
- Mead, P. (2005). Methodological issues in the study of interpreters’ fluency. The Interpreters Newsletter, 13, 39–63. http://hdl.handle.net/10077/2469
- Petite, C. (2005). Evidence of repair mechanisms in simultaneous interpreting: A corpus-based analysis. Interpreting. International Journal of Research and Practice in Interpreting, 7(1), 27–49. https://doi.org/10.1075/intp.7.1.03pet
- Pöchhacker, F. (2016). Introducing interpreting studies. Routledge. https://doi.org/10.4324/9781315649573
- Pöchhacker, F., & Zwischenberger, C. (2010). Survey on quality and role: Conference interpreters’ expectations and self-perceptions. AIIC Communicate! Spring, 2010(53). http://aiic.net/p/3405
- R Core Team. (2021). R: A language and environment for statistical computing. R Foundation for Statistical Computing.
- Raupach, M. (2011). Temporal variables in first and second language speech production. In H. Dechert & M. Raupach (Eds.), Temporal variables in speech: Studies in honour of Frieda Goldman-Eisler (pp. 263–270). De Gruyter Mouton. https://doi.org/10.1515/9783110816570.263
- Riggenbach, H. (1991). Toward an understanding of fluency: A microanalysis of nonnative speaker conversations. Discourse Processes, 14(4), 423–441. https://www.R-project.org/ https://doi.org/10.1080/01638539109544795
- Segalowitz, N. (2010). Cognitive bases of second language fluency. Routledge. https://doi.org/10.4324/9780203851357
- Tavakoli, P., & Skehan, P. (2005). Strategic planning, task structure and performance testing, in: Planning and task performance in a second language (pp. 239–273). John Benjamins.
- Tissi, B. (2000). Silent pauses and disfluencies in simultaneous interpretation: A descriptive analysis. The Interpreters Newsletter, 10, 103–127. http://hdl.handle.net/10077/2455
- Towell, R., Hawkins, R., & Bazergui, N. (1996). The development of fluency in advanced learners of French. Applied Linguistics, 17(1), 84–119. https://doi.org/10.1093/applin/17.1.84
- Venables, W. N., & Ripley, B. D. (2002). Random and mixed effects. In J. Chambers & W. Eddy (Eds.), Modern applied statistics with S. statistics and computing (pp. 271–300). Springer. https://doi.org/10.1007/978-0-387-21706-2_10
- Wang, B., & Li, T. (2015). An empirical study of pauses in Chinese-English simultaneous interpreting. Perspectives, 23(1), 124–142. https://doi.org/10.1080/0907676X.2014.948885
- Yu, W., & van Heuven, V. J. (2017). Predicting judged fluency of consecutive interpreting from acoustic measures: Potential for automated assessment and pedagogic implications. Interpreting. International Journal of Research and Practice in Interpreting, 19(1), 47–68. https://doi.org/10.1075/intp.19.1.03yu