Abstract
Four cardenolide glycosides, glucodigifucoside (2), 3′-O-acetylglucoevatromonoside (9), digitoxigenin 3-O-β-D-glucopyranosyl-(1→4)-β-D-glucopyranosyl-(1→4)-3-O-acetyl-β-D-digitoxopyranoside (11), and purpureaglycoside A (12), isolated from the seeds of Digitalis purpurea, exhibited potent cytotoxicity against human renal adenocarcinoma cell line ACHN. These compounds exhibited significantly lower IC50 values against ACHN than that against normal human renal proximal tubule-derived cell line HK-2. In particular, 2 exhibited the most potent and carcinoma-specific cytotoxicity, with a sixfold lower IC50 value against ACHN than that against HK-2. Measurement of cyclin-dependent kinase inhibitor levels revealed that upregulation of p21/Cip1 expression was involved in the carcinoma-specific cytotoxicity of 2. Further, compound 2 also exhibited the carcinoma-specific cytotoxicity toward hepatocellular carcinoma cell line.
Graphical Abstract
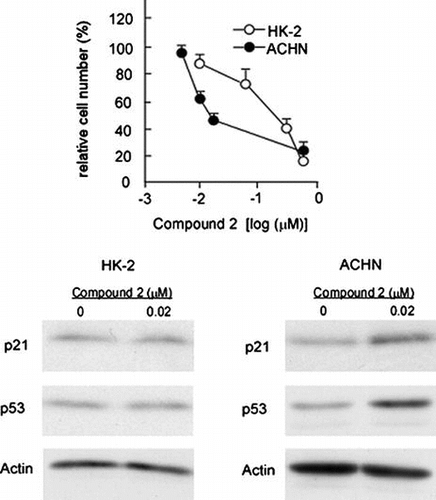
Glucodigifucoside (compound 2) from the seeds of Digitalis purpurea exhibit carcinoma-specific cytotoxicity towards renal adenocarcinoma cells in p53/p21-dependent manner.
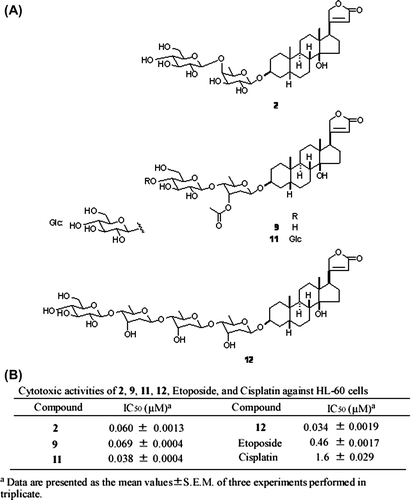
Cardenolide glycosides are a group of naturally occurring compounds found in a select number of plant families, including Scrophulariaceae, Apocynaceae, Liliaceae, and Ranunculaceae. We previously performed a systematic phytochemical examination of Digitalis purpurea seeds, which resulted in the isolation of 15 cardenolide glycosides.Citation1) We also examined the cytotoxic activity of these cardenolide glycosides against HL-60 human promyelocytic leukemia cells and found that 2, 9, 11, and 12 exhibited potent cytotoxicityCitation1) (Fig. ).
Fig. 1. Structure and cytotoxic activity of compounds 2, 9, 11, 12.
Notes: (A) Structures of 2, 9, 11, and 12. (B) IC50 values of 2, 9, 11, 12, etoposide, and cisplatin against HL-60 cells were posted from our paper (that of etoposide and cisplatin: as positive control) (1).
In this study, we examined whether or not the cardenolide glycosides also exhibited cytotoxicity toward the human renal adenocarcinoma and hepatocellular carcinoma cell lines. We clearly demonstrated that proliferation of human renal adenocarcinoma cells and hepatocellular carcinoma cells was significantly inhibited by the cardenolide glycosides, whereas that of normal human renal cells and human hepatocyte-derived cells was not remarkably affected, suggesting that their cytotoxicity is carcinoma specific. Moreover, these compounds significantly upregulated CDK inhibitor p21/Cip1 expression in carcinoma types of cells but not in normal types of cells.
Materials and methods
Materials
Etoposide, cisplatin, and actinomycin D were purchased from Wako Pure Chemicals Industries (Osaka, Japan). Cardenolide glycosides (2, 9, 11, and 12) were isolated from the MeOH extract of the seeds of D. purpurea.Citation1) Human renal adenocarcinoma cell lines, ACHN and 786-O, a human renal proximal tubule cell line, HK-2, and a human hepatocyte-derived cell line, Fa2 N-4, were obtained from ATCC.
Cell culture
ACHN, 786-O, HK-2, a human embryonic kidney cell line, HEK293, human hepatocellular carcinoma cell lines, HepG2 and HuH7, and Fa2 N-4, were maintained in Dulbecco’s modified eagle medium containing 10% fetal calf serum, 50 units/mL penicillin G sodium salt, and 50 μg/mL streptomycin sulfate and cultured in a humidified atmosphere of 8.5% CO2 at 37 °C.
Immunoblotting
Cells were washed with PBS, and cell extracts were prepared using SDS sample buffer without loading dye. After normalization of protein content via the protein assay, the dye was added to samples, followed by SDS-PAGE and immunoblotting analyses. For the detection of farnesoid x receptor (FXR), p16, p21, p53, hepatocyte nuclear factor-4 α (HNF4α), forkhead box m1b (Foxm1b), and PPARγ, the PVDF membranes were incubated with the primary antibody for 2 h at room temperature, followed by further incubation for 16 h at 4 °C. For the detection of β-actin, the membranes were incubated with the primary antibody for 2 h. Immunocomplexes on the PVDF membranes were visualized with enhanced chemiluminescence Western blotting detection reagents (GE Healthcare Biosciences, Tokyo, Japan).
Quantification of mRNA
Quantification of mRNA was performed via real-time polymerase chain reaction (PCR). Briefly, 5 μg of total RNA was reverse transcribed using Ready-To-Go You-Prime First-Strand Beads (GE Healthcare Biosciences) in accordance with the manufacturer’s instructions. The resultant cDNA was then subjected to real-time PCR analysis using a TaqMan Gene Expression Assay kit (Applied Biosystems, Tokyo, Japan). The mRNA levels were determined via TaqMan assay mixtures as follows: the four isoforms of FXR (Hs00231968), p21 (Hs01121172), p16 (Hs99999189), and β-actin (4310881E). TaqMan assay mixture Hs00231968 can detect all four isoforms of FXR.Citation2) Amplification and quantification were performed via the PRISM 7000 real-time PCR System (Applied Biosystems). FXR, p21, and p16 mRNA levels were normalized to the levels of β-actin mRNA as an internal control. Data were analyzed via Student’s t-test.
Cytotoxicity assay
Cytotoxic effects of cardenolide glycosides on the growth of HEK293, HK-2, ACHN, Fa2 N-4, Huh7, and HepG2 cells were examined as follows: HEK293, HK-2, and ACHNcells seeded on 60-mm dishes at a density of 2.0 × 10⁵ cells/dish were incubated in 8.5% CO2/air for 24 h at 37 °C followed by the treatment with various concentrations (0.005–2 μM) of 2, 9, 11, or 12 for 72 h. As negative controls, cells were treated with vehicle dimethyl sulfoxide (DMSO). As positive controls, cells were treated with etoposide or cisplatin for 72 h. After washing cells, cell number/dish was determined.
In the case of Fa2 N-4, Huh7, and HepG2 cells, cells seeded on 60-mm dishes at a density of 1 × 10⁵ cells/dish were incubated for 24 h. Then cells were treated with various concentrations (0.25–2 μM) of 2 for 48 h. As negative controls, DMSO was added to the culture. As positive controls, cells were treated with etoposide or cisplatin. Cell number/dish was determined as described above.
All samples were assayed in triplicate, and the IC50 values were calculated. Data were analyzed via Student’s t-test.
Morphological observation of nucleus
Cells were treated with DMSO or 2 for 72 h. Then cells were washed carefully with phosphate-buffered saline (PBS) and exposed to 10 μg/mL Hoechst 33258 at room temperature in the dark for 1 h. Fluorescence images were captured by CCD camera (QICAMFAST1394; QIMAGING) mounted on a Leica DM IRB microscope using IP Laboratory imaging software (Scanalytics). Cells showing cytoplasmic and nuclear shrinkage, chromatin condensation or fragmentation, were defined as apoptotic cells. Actinomycin D was used as positive control.
Results
Cardenolide glycosides exhibit carcinoma-specific cytotoxicity toward renal adenocarcinoma cells
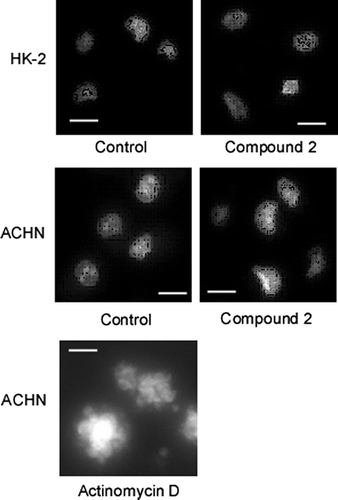
Cardenolide glycosides exhibited potent cytotoxicity against HL-60 human promyelocytic leukemia cells.Citation1) (Fig. ) We then examined whether or not the cardenolide glycosides also exhibited cytotoxicity toward the human renal adenocarcinoma cell line ACHN and normal human renal proximal tubule cell line HK-2. Fig. (A) (a–d) and Table show that all of the cardenolide glycosides exhibited more potent cytotoxicity against ACHN than that against HK-2. In contrast, significant differences were not noted with etoposide and cisplatin treatment (Fig. (A) (e, f)). In particular, 2 exhibited the most potent specificity against ACHN cells, with the ratio of IC50 against ACHN to that of HK-2 being the highest of the four and therefore used in the following experiments. Adenocarcinoma specificity of 2 can be also confirmed using human renal adenocarcinoma cell line 786-O and human embryonic kidney cell line HEK293 (IC50 against 786-O is 0.03 ± 0.01 μM, IC50 against HEK293 is 0.20 ± 0.04 μM). Cytotoxicity does not arise from apoptosis, because typical apoptotic morphological changes were not observed in the nuclei of cells treated with 2 (Fig. ).
Fig. 2. Dose-dependent cytotoxicity of compounds 2, 9, 11, and 12 on HK-2, ACHN, Fa2 N-4, and HepG2 cells.
Notes: (A) HK-2 and ACHN cells were subjected to the treatment with cardenolide glycosides (2, 9, 11, and 12) and their cytotoxic effects were examined as described in Materials and methods. (B) Fa2 N-4 and HepG2 cells were subjected to the treatment with compound 2 and their cytotoxic effects were examined as described in Materials and methods. Data are presented as the mean values ± SEM of three experiments performed in triplicate.
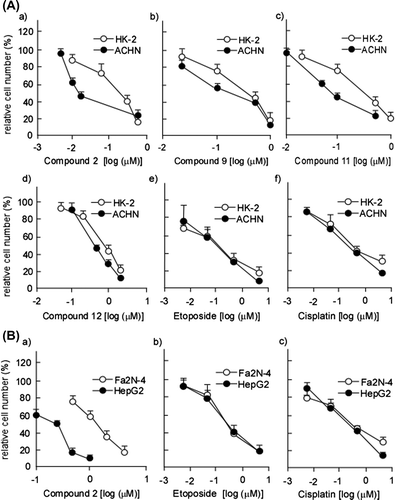
Table 1. Cytotoxic activities of 2, 9, 11, 12 against HK-2 and ACHN cells.
Cardenolide glycosides exhibit carcinoma-specific cytotoxicity toward hepatocellular carcinoma cells
We recently reported that 2 exhibits potent cytotoxicity against the hepatocellular carcinoma cell line HepG2.Citation1) However, it is still unknown whether or not 2 exert carcinoma-specific cytotoxicity against hepatic cells. We therefore compared the cytotoxicity of 2 against normal human hepatocyte-derived cell line, Fa2 N-4 and that against HepG2 cells. Fig. (B) (a) and Table demonstrated that potent cytotoxicity of 2 was remarkably observed in HepG2 cells but not in Fa2 N-4 cells. Hepatocellular carcinoma-specific cytotoxicity was also observed in human hepatocellular carcinoma cell line, Huh7, treated at lower concentration of 2 (IC50 = 0.28 ± 0.03 μM).
Table 2. Cytotoxic activities of 2 against Fa2 N-4 and HepG2 cells.
Upregulation of p21/Cip1 expression is involved in the carcinoma-specific cytotoxicity of 2
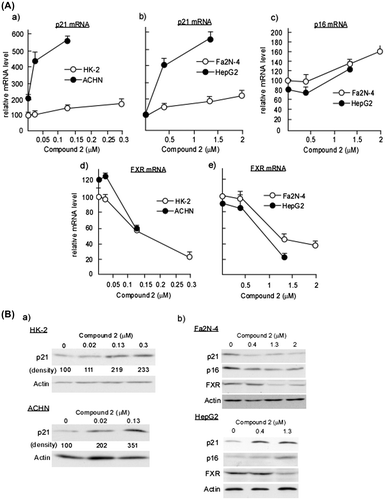
We next investigated the mechanism by which 2 exerts cytotoxicity toward renal adenocarcinoma cells. Due to cell cycle regulation being required for cell viability, the cytotoxic action of 2 may have involved the modification of a cell cycle factor. We first obtained preliminary data showing that the knockdown of the CDK inhibitors p21/Cip1 (Fig. (A) and (B)) and p16/INK4a (data not shown) markedly increased the number of HK-2 and ACHN cells, indicating the significance of those factors in the cellular proliferation of HK-2 and ACHN. We then examined whether or not the expression levels of p21/Cip1 were altered in HK-2 and ACHN cells treated with 2. Fig. (A) (a) and (B) (a) show that mRNA and protein levels of p21/Cip1 were markedly increased in 2-treated ACHN cells at the IC50 concentration (0.02 μM). In contrast, the expression of p21/Cip1 in HK-2 cells was not affected by 2 at the same concentration (Fig. (A) (a) and (B) (a)). Therefore, cytotoxic action of 2 specifically observed in ACHN cells may arise from the alteration of p21/Cip1 expression. Indeed, knockdown of p21/Cip1 impaired the 2-induced cytotoxicity (Fig. (C) and(D)).
Fig. 4. p21 upregulation is responsible for compound 2-mediated cytotoxicity on ACHN Cells.
Notes: (A) HK-2 and ACHN cells were seeded at a density of 4.0 × 10⁴ cells/35-mm dish and treated with control or p21/Cip1 siRNA (100 nM) using HiPerfect transfection reagent (Qiagen). After 72 h, total RNA was extracted and quantification of p21/Cip1 mRNA was performed as described in Materials and methods. Data are presented as the mean values ± SEM of three experiments performed in triplicate and analyzed via a Student’s t-test. (B) HK-2 and ACHN cells were treated with control or p21/Cip1 siRNA as described in (A). After 72 h, cell number/dish was determined. Data are presented as the mean values ± SEM of three experiments performed in triplicate and analyzed via a Student’s t-test. (C) ACHN cells were treated with control or p21/Cip1 siRNA as described in (A). After 24 h, cells were treated or left untreated with 2 (0.02 μM) for 72 h. Quantification of p21/Cip1 mRNA was performed as described in (A). (D) ACHN cells were treated with control or p21/Cip1 siRNA, and then subjected to the compound 2 treatment as described in (C). Then cell number/dish was determined as described in (B).
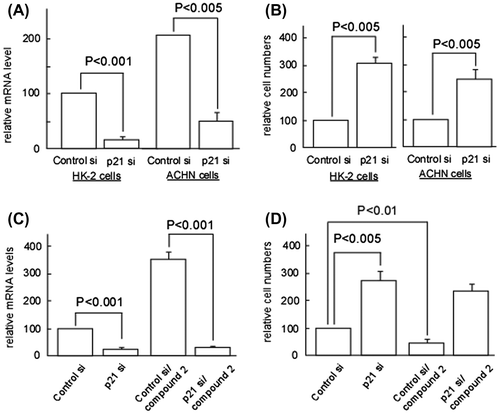
Fig. 5. Analyses for p21/Cip1, p16/INK4a, and FXR expressions in 2-treated HK-2, ACHN, Fa2 N-4, and HepG2 Cells.
Notes: HK-2 and ACHN seeded at a density of 8.0 × 10⁴ cells/35-mm dish and Fa2 N-4 and HepG2 cells seeded at a density of 4.0 × 10⁴ cells/35-mm were treated with various concentrations of 2. After 48 h (Fa2 N-4 and HepG2 cells) or 72 h (HK-2 and ACHN cells), total RNA was extracted and quantification of p21/Cip1, p16/INK4a, and FXR mRNAs was performed as described in Materials and methods. Data are presented as the mean values ± SEM of three experiments performed in triplicate. (B) HK-2, ACHN, Fa2 N-4, and HepG2 cells were treated with various concentrations of 2 as described in (A). After 48 h (Fa2 N-4 and HepG2) or 72 h (HK-2 and ACHN), cell extracts were prepared and immunoblotting analyses were performed to detect p21/Cip1, p16/INK4a, and FXR as described in Materials and methods.
In addition to p21/Cip1, p16/INK4a plays a pivotal role in cell cycle regulation. We therefore measured p16/INK4a expression in HK-2 and ACHN cells treated with the IC50 concentration of 2 for ACHN cells. We successfully observed that p16/INK4a expression level was not altered in 2-treated HK-2 cells, however, that in ACHN cells, it was not detected at all concentrations tested (data not shown).
We recently reported that the proliferation of hepatocellular carcinoma cells is regulated by the FXR, a bile acid-activated nuclear receptor.Citation3) FXR positively regulates the proliferation of the hepatocellular carcinoma cell line HepG2 by downregulating the expression of the CDK inhibitors p21/Cip1 and p16/INK4a.Citation3) When FXR is downregulated by hepatocyte growth factor, p21/Cip1 and p16/INK4a levels are upregulated, thereby cell proliferation is inhibited. Given that the 2-induced increase in p21/Cip1 level is dependent on FXR downregulation, we examined the FXR levels in HK-2 and ACHN cells treated with 2. As shown in Fig. (A) (d), FXR mRNA levels in ACHN cells were not affected by the treatment with 2 at IC50 concentration, while p21/Cip1 expression was significantly increased by the same treatment (Fig. (A) (a) and (B) (a)). Therefore, FXR-independent upregulation of p21/Cipl is responsible for 2-induced inhibition of proliferation in ACHN cells.
To identify the factors responsible for the carcinoma-specific cytotoxicity of 2 against hepatic cells, we measured the expression levels of p16/INK4a, p21/Cip1, and FXR. As shown in Fig. (A) (b) and (B) (b), mRNA and protein levels of p21/Cip1 in HepG2 cells were markedly increased at the concentrations around IC50 of 2 (0.4 μM), whereas a slight decrease in protein level was observed in Fa2 N-4 cells (Fig. (B) (b)). Given that the expression of FXR and p16/INK4a were not altered at the concentrations around IC50 of 2 in both Fa2 N-4 and HepG2 cells (Fig. (A) (c, e) and (B) (b)), 2 may exert specific cytotoxicity toward hepatocellular carcinoma cells, as well as renal adenocarcinoma, in a p21/Cip1 expression-dependent manner.
Compound 2 may exert p53-dependent cytotoxicity against carcinoma cells
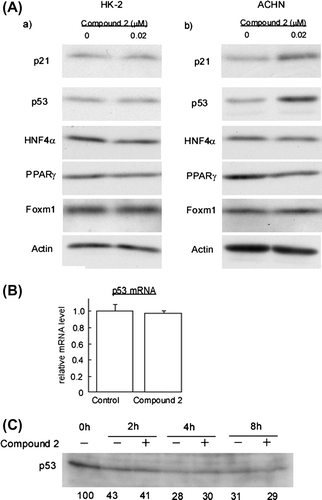
At present, several different transcriptional factors acting as upstream regulators for p21/Cip1 are identified as follows: tumor suppressor factors p53,Citation4) HNF4α,Citation5,6) PPARγ,Citation7) and the Foxm1b.Citation8) We therefore examined whether or not expression levels of these factors were altered by the treatment with 2 (Fig. (A)). Among them, the expression levels of p53 was significantly increased in ACHN cells while they were not altered in HK-2 cells (Fig. (A) (b)). Interestingly, p53 mRNA levels were comparable in control and cells treated with 2 (Fig. (B)). Furthermore, when we examined the kinetics of p53 degradation in ACHN cells treated with cycloheximide, the stability of p53 protein was not affected by the treatment with 2 (Fig. (C)), suggesting that the cardenolide glycoside 2 may upregulate p53 by stimulating its translation.
Fig. 6. Compound 2 upregulates p53 protein in ACHN Cells.
Notes: (A) HK-2 and ACHN cells were seeded at a density of 8.0 × 10⁴ cells/35-mm dish. After 24 h, cells were treated with 0.02 μM for 72 h. Then cell extracts were prepared and immunoblotting analyses were performed to detect p21/Cip1, p53, HNF4α, PPARγ, and Foxm1. (B) ACHN cells were subjected to the 2 treatment as described in (A). Total RNA was extracted and quantification of p53 mRNA was performed as described in Materials and methods. Data are presented as the mean values ± SEM of three experiments performed in triplicate. (C) ACHN cells were seeded at a density of 2.0 × 10⁵ cells/60-mm dish. After 24 h, 10 μg/ml cycloheximide was added to the culture and further incubated for the indicated times in the presence or absence of 0.02 μM 2. Then cell extracts were prepared and immunoblotting analyses were performed to detect.
Discussion
Here, we show that cardenolide glycosides exhibit carcinoma-specific cytotoxicity toward renal adenocarcinoma and hepatocellular carcinoma cells due to the p53-mediated upregulation of p21/Cip1 expression.
Four cardenolide glycosides (2, 9, 11, and 12) were found to exhibit different magnitudes of cytotoxicity, suggesting that this discrepancy may reflect the difference of sugar residues bound to cardenolide structure, although the precise structure–activity relationship remains to be studied. Interestingly, while 12 exhibits more potent cytotoxicity than 2 toward HL-60 cells (Fig. ), its cytotoxicity against ACHN and HepG2 was markedly weaker than that of 2 (Tables and ). At present, we could not answer why cytotoxic actions of cardenolide glycosides were differently estimated, depending on cancer cell lines tested. It is possible that cardenolide glycosides may trigger different cytotoxic pathways in leukemia cells and solid tumors. In the present study, we have clearly demonstrated that 2 exerts cytotoxicity against solid tumor-derived carcinoma cell lines, ACHN and HepG2, via a same molecular mechanism, i.e. p21/Cip1-dependent pathway.
Among the transcriptional factors that are known to induce p21/Cip1 expression, only p53 was shown to be upregulated in response to 2 (Fig. (A) (b)), suggesting that p53 is the most possible candidate that induces p21/Cip1 expression resulting in the growth inhibition of carcinoma cells treated with cardenolide glycoside 2. It should be noted that 2 does not induce typical apoptotic morphological changes in ACHN cells (Fig. ), although p53 is known to induce the transcription of pro-apoptotic factor, Bax, on the other hand, represses the transcription of antiapoptotic factor Bcl-2, thereby inducing apoptosis.Citation9–11) However, immunoblotting analyses to detect Bax and Bcl-2 demonstrated that the treatment of ACHN cells with 2 do not change their expression levels (data not shown), suggesting that 2 exerts its cytotoxicity against carcinoma cells through p53-induced p21/Cip1 expression, independently of p53-evoked pro-apoptotic pathway. Interestingly, cardenolide glycoside 2 neither elevates p53 mRNA levels nor changes the p53 protein stability in ACHN cells. There exists a unique mechanism through which cardenolide glycosides stimulate the translation of p53.
Cardiac glycosides are known to exert an anticancer effect in several types of cancer and p21/Cip1 has been recognized as a pivotal factor in the antiproliferative effect of cardiac glycosides.Citation12–14) Of note, p53, known to be an upstream transcriptional factor of p21/Cip1, has been reported to participate in the p21/Cip1-dependent anticancer effect,Citation15) although contrary findings have also been reported.Citation16) It is necessary to examine whether or not other upstream factors besides p53 are involved in the specific cytotoxicity of 2, 9, 11, 12 toward adenocarcinoma and hepatocellular carcinoma cells. Indeed, as shown in Fig. , IC50 concentration of 2 for HK-2 cell growth (0.13 μM) causes only slight increases in p21/Cip1 mRNA levels in HK-2 cells (Fig. (A) (a)), whereas the protein level of p21/Cip1 in HK-2 cells is dramatically increased by the treatment with 2 at the same concentration (Fig. (B) (a)), suggesting that cardenolide glycoside 2 may modulate protein translation, thereby elevating p21/Cip1 protein levels, as it does in p53 protein levels.
In conclusion, cardenolide glycosides exhibit specific cytotoxicity against renal adenocarcinoma and hepatocellular carcinoma cells, implicating them as potential candidates in the development of anticancer drugs.
Acknowledgments
We thank Kenji Osafune, Akihito Yokosuka, Hideaki Higurashi, and Ken Ando for helpful advice and discussion.
Additional information
Funding
Notes
Abbreviations: CDK, cyclin-dependent kinase; DMEM, Dulbecco’s modified Eagle medium; DMSO, dimethyl sulfoxide; EGFR, epidermal growth factor receptor; Foxm1b, forkhead box m1b; FXR, farnesoid x receptor; HNF4α, hepatocyte nuclear factor-4α; PCR, polymerase chain reaction; PPARγ, peroxisome proliferator-activated receptorγ.
References
- Kuroda M, Kubo S, Matsuo Y, Atou T, Satoh J, Fujino T, Hayakawa M, Mimaki Y. New cardenolide glycosides from the seeds of Digitalis purpurea and their cytotoxic activity. Biosci. Biotechnol. Biochem. 2013;77:1186–1192.10.1271/bbb.120922
- Zhang Y, Castellani LW, Sinal CJ, Gonzalez FJ, Edwards PA. Peroxisome proliferator-activated receptor-γ coactivator 1 α (PGC-1α) regulates triglyceride metabolism by activation of the nuclear receptor FXR. Genes Dev. 2004;18:157–169.10.1101/gad.1138104
- Fujino T, Takeuchi A, Maruko-Ohtake A, Ohtake Y, Satoh J, Kobayashi T, Tanaka T, Ito H, Sakamaki R, Kashimura R, Ando K, Nishimaki-Mogami T, Ohkubo Y, Kitamura N, Sato R, Kikugawa K, Hayakawa M. Critical role of farnesoid X receptor for hepatocellular carcinoma cell proliferation. J. Biochem. 2012;152:577–586.10.1093/jb/mvs101
- Zhang DM, Liu JS, Tang MK, Yiu A, Cao HH, Jiang L, Yuet-Wa Chan JY, Tian HY, Fung KP, Ye WC. Bufotalin from Venenum Bufonis inhibits growth of multidrug resistant HepG2 cells through G2/M cell cycle arrest and apoptosis. Eur. J. Pharmacol. 2012;692:19–28.10.1016/j.ejphar.2012.06.045
- Hwang-Verslues WW, Sladek FM. Nuclear receptor hepatocyte nuclear factor 4α1 competes with oncoprotein c-Myc for control of the p21/WAF1 promoter. Mol. Endocrinol. 2008;22:78–90.10.1210/me.2007-0298
- Chiba H, Itoh T, Satohisa S, Sakai N, Noguchi H, Osanai M, Kojima T, Sawada N. Activation of p21CIP1/WAF1 gene expression and inhibition of cell proliferation by overexpression of hepatocyte nuclear factor-4α. Exp. Cell Res. 2005;302:11–21.10.1016/j.yexcr.2004.08.014
- Lu D, Han C, Wu T. 15-PGDH inhibits hepatocellular carcinoma growth through 15-keto-PGE2/PPARγ-mediated activation of p21WAF1/Cip1. Oncogene. 2014;33:1101–1112.10.1038/onc.2013.69
- Wang X, Kiyokawa H, Dennewitz MB, Costa RH. The Forkhead Box m1b transcription factor is essential for hepatocyte DNA replication and mitosis during mouse liver regeneration. Proc. Nat. Acad. Sci. USA. 2002;99:16881–16886.10.1073/pnas.252570299
- Miyashita T, Krajewski S, Krajewska M, Wang HG, Lin HK, Liebermann DA, Hoffman B, Reed JC. Tumor suppressor p53 is a regulator of bcl-2 and bax gene expression in vitro and in vivo. Oncogene. 1994;9:1799–1805.
- Sugars KL, Budhram-Mahadeo V, Packham G, Latchman DS. A minimal Bcl-x promoter is activated by Brn-3a and repressed by p53. Nucleic Acids Res. 2001;29:4530–4540.10.1093/nar/29.22.4530
- Pietrzak M, Puzianowska-Kuznicka M. p53-dependent repression of the human MCL-1 gene encoding an antiapoptotic member of the BCL-2 family: the role of Sp1 and of basic transcription factor binding sites in the MCL-1 promoter. Biol. Chem. 2008;389:383–393.
- Hiyoshi H, Abdelhady S, Segerström L, Sveinbjörnsson B, Nuriya M, Lundgren TK, Desfrere L, Miyakawa A, Yasui M, Kogner P, Johnsen JI, Andäng M, Uhlén P. Quiescence and γH2AX in neuroblastoma are regulated by ouabain/Na,K-ATPase. Br. J. Cancer. 2012;106:1807–1815.10.1038/bjc.2012.159
- Xu ZW, Wang FM, Gao MJ, Chen XY, Shan NN, Cheng SX, Mai X, Zala GH, Hu WL, Xu RC. Cardiotonic steroids attenuate ERK phosphorylation and generate cell cycle arrest to block human hepatoma cell growth. J. Steroid Biochem. Mol. Biol. 2011;125:181–191.10.1016/j.jsbmb.2010.12.016
- Einbond LS, Wu HA, Su T, Chang T, Panjikaran M, Wang X, Goldsberry S. Digitoxin activates EGR1 and synergizes with paclitaxel on human breast cancer cells. J. Carcinog. 2010 Nov 18;9:10.10.4103/1477-3163.72578
- Zhang DM, Liu JS, Tang MK, Yiu A, Cao HH, Jiang L, Yuet-Wa Chan JY, Tian HY, Fung KP, Ye WC. Bufotalin from Venenum Bufonis inhibits growth of multidrug resistant. HepG2 cells through G2/M cell cycle arrest and apoptosis. Eur. J. Pharmacol. 2012;692:19–28.10.1016/j.ejphar.2012.06.045
- Kometiani P, Liu L, Askari A. Digitalis-induced signaling by Na+/K+-ATPase in human breast cancer cells. Mol. Pharmacol. 2005;67:929–936.

