
Abstract
Not only amylose but also amylopectin greatly affects the gelatinization properties of rice starch and the quality of cooked rice grains. We here characterized the starches of 32 rice cultivars and evaluated the relationship between their iodine absorption curve, apparent amylose content (AAC), pasting property, resistant starch (RS) content, and chain length distribution of amylopectin. We found that the iodine absorption curve differed among the various sample rice cultivars. Using the wavelength at which absorbance becomes maximum on iodine staining of starch (λmax), we propose a novel index, “new λmax” (AAC/(λmax of sample rice starches–λmax of glutinous rice starch)). We developed the novel estimation formulae for AAC, RS contents, and amylopectin fractions with the use of λmax and “new λmax.” These formulae would lead to the improved method for estimating starch properties using an easy and rapid iodine colorimetric method.
Graphical Abstract
We developed the novel estimation formulae for amylose, resistant starch contents, and amylopectin fractions based upon analyses of the iodine absorption curve.
Starch is composed of essentially two kinds of α-glucans that have distinctive structure. Amylose is small, linear, and slightly branched molecules, whereas amylopectin is large and highly branched molecule. Particularly, amylose is one of the components of rice starch that greatly affects the quality and gelatinization properties of cooked rice.Citation1) Low-amylose rice generally becomes soft and sticky after cooking, whereas high-amylose rice becomes hard with fluffy separated grains.Citation2) The group of high-amylose starches includes two types of rice starches with similar apparent amylose content (AAC) but different super-long chains (SLC) contents of amylopectin.Citation3,4) The structure of amylopectin in the starch granule has been described using a cluster model.Citation5–7) Nakamura et al. classified the starches of 129 rice varieties cultivated in Asia into two types, L and S, based on the differences in the chain length of the amylopectin cluster.Citation8)
Rice starches contain 0–30% of amylose, and the content among varieties of rice varies with the ambient temperatures during development of the grain. The starches of rice grown at low temperature had a significantly higher amylose content than that of rice grown at high temperatures.Citation9–13) Amylose is synthesized by starch granule-bound starch synthase encoded by the waxy gene. The fact that amylose content is usually higher in endosperm starch of indica rice than that of japonica rice has been explained by the presence of two types of waxy alleles, Wxa and Wx.b Citation14) Inouchi et al.Citation9) and Hirano et al.Citation15) showed a high positive correlation between the amounts of waxy (Wx) protein and the SLC contents of starch.
A routine method for the quantification of amylose in rice improvement programs went through rapid development in the 1970s and early 1980s, resulting in the publication of two slightly different methods by International Organization for Standardization (ISO) and American Association of Cereal Chemists International (AACCI). Each different version of the iodine-binding method has led to revision of the protocol for the standard curve. The most widely used method for amylose determination is a colorimetric assay where iodine binds with amylose to produce a blue–purple color, which is measured spectrophotometrically at a single wavelength (620 nm).Citation16) Amylopectin also has a color reaction with iodine, which interfering with the direct measurement of the color generated by the amylose–iodine complex. Dual-wavelength spectrophotometry obtains more accurate measurements for both amylose–iodine and amylopectin–iodine in mixture than the standard method of Juliano.Citation17,18) Fukahori et al.Citation19) showed that the amylose and amylopectin fractionated from different rice cultivars could be evaluated by the dual-wavelength spectrophotometry. By conducting a survey of the methods for measuring amylose in various rice quality evaluation laboratories, as well as testing the reproducibility between different laboratories, it was found that at least five different versions of the iodine method are in operation, with variability in the construction of the standard curve, standing time, and wavelength used for measurement.Citation20) It was necessary to develop the method for measuring amylose and together standardize a method for quantifying actual values of amylose. Igarashi et al.Citation21) used an automatic analyzer, developed to obtain an iodine absorption spectrum ranging from 400 to 900 nm setting 600 nm as a bordering wavelength. In this study, wavelength at which absorbance becomes maximum on iodine staining of starch (λmax) and absorbance at λmax (Aλmax) were used for estimating AAC (not used standard curve).
Several researchers reported the development of high-resistant starch (RS) riceCitation22,23) as well as high-amylose- and high-dietary-fiber rice,Citation24) through physical and chemical mutations. The glycemic effect of foods depends on numerous factors, such as the structures of amylose and amylopectin structure.Citation25,26) However, the cooked grains of ae mutant rice cultivars are too hard and non-sticky because ae mutant rice cultivars lack starch branching enzyme II b and the presence of SLC. They are promising in terms of their bio-functionality such as diabetes prevention.Citation27–33) RS may be included within the term “fiber” on the nutrition labels used in some countries but not in others.Citation34,35) Resistant starch is starch that escapes digestion in the small intestine and that may be fermented in the large intestine. Four main subtypes of resistant starch have been identified based on structure or source. There are several kinds of method of measurement for determining RS contents.Citation36,37) RS differs depending on the different processing methods. It is necessary to develop the novel and simple method for measuring RS.
Physicochemical properties of the starches were often evaluated as pasting characteristics using a Rapid Visco Analyzer (RVA). High-amylose rice cultivars are reported to have a higher final viscosity than low-amylose cultivars, where the final viscosity is related to the degree of starch retrogradation after cooling.Citation3,38) The group of high-amylose starches had different SLC contents of amylopectin, different peak viscosities and setback (SB) values (we use the term “consistency” for “SB” in the this paper) according to the measurements using a RVA.Citation39,40)
RVA appears to be a useful tool for the rapid and simple evaluation of amylose contents or chain length distribution of amylopectin, while it was relatively expensive.
Umemoto et al.Citation41) showed that the fine structure of amylopectin in the japonica rice variety differed distinctly from that in the indica rice variety. Side-chain structure of amylopectin affects physicochemical properties of the starches, and several methods for determination of molar-based distribution of amylopectin have been reported. Among them, typical method is high-performance anion-exchange chromatography with pulsed amperometric detection(HPAEC-PAD)to analyze microstructure of amylopectin. Different from amylose, it is necessary to use the sophisticated ion-chromatography to analyze the fine structure of amylopectin. HPAEC-PAD has been frequently used for the examination of the distribution for amylopectin.
We adopted a special detection system because starch does not show absorption in the region of ultraviolet wave length. As another way, analyzing method of molar molecular weight distribution of amylopectin labeling reducing-ends by fluorescent reagents was reported. Hanashiro et al.Citation42) developed a method for determining the molar-based distribution of amylopectin using fluorescent 2-aminopyridine. The pre-column labeling enables online, direct measurement of a molar-based distribution of the molecules.
Measurement of the structure of amylopectin cluster needs sophisticate technology or the expensive equipment. We here characterized the starch of various rice cultivars and evaluated the relationship between their iodine absorption curve and AACs, pasting properties, and resistant starch. The improvements, which we performed for analyzing the iodine colorimetric method, and the novel estimation formulae, which we developed in this paper against the amylose contents, resistant starch or a certain fractions of definite chain length amylopectin, would lead to an easy and low-cost spectroscopic method for starch characteristics.
Materials and methods
Materials
Ae mutant rice (EM10, EM189, EM72, EM129, EM16, EM174, and EM145) and wx mutant rice (EM21), japonica-indica hybrid rice (Hoshiyutaka) and japonica rice (Kinmaze) were cultivated in an experimental field of Kyushu University in 2011. The ae mutant rice (Hokurikukona243go), high-quality premium japonica rice (Koshihikari), indica rice (Yumetoiro), and japonica-indica hybrid rice cultivars (Kareimai and Koshinokaori) were cultivated in an experimental field at the Hokuriku Research Center in the Central Agricultural Research Center, Joetsu in 2011. Glutinous rice (Koganemochi), japonica rice (Kamenoo), and high-amylose japonica rice (Ekkako) were cultivated at the Niigata Prefectural Agricultural Research Institute in 2011. Japonica rice cultivars (Kirara 397, Hinohikari, Hitomebore, and Akitakomachi), Japonica-indica hybrid rice cultivar (Jasmin rice), Tropical Japonica rice cultivar (Carnaroli), low-amylose japonica rice (Yumepirika), high-amylose japonica rice (Mizuhochikara), and glutinous rice cultivars (Hakuchomochi and Hiyokumochi) were purchased in a local market. Japonica-indica hybrid rice cultivars (Taiwan aromatic rice, Super hybrid rice, Kitsurin 88go) and japonica rice (Taiwan delicious rice) were kindly provided by Professor J. Cui of Tianjin Agricultural University, China.
Preparation of polished white rice samples
Brown rice was polished using an experimental friction-type rice milling machine (Yamamotoseisakusyo, Co. Ltd., Tendoh, Japan) to obtain a milling yield (yield after polishing) of 90–91%. White rice flour was prepared using a cyclone mill (SFC-S1; Udy, Fort Collins, CO) with a screen of 1-mm-diameter pores.
Preparation of starch granules
Starch granules were prepared from polished rice flour using the cold alkaline method.Citation43,44)
Measurement of iodine absorption spectra
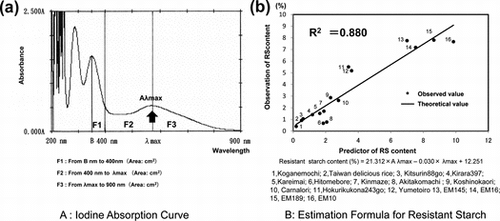
The iodine absorption spectrum of the rice starch (treated with alkaline solution) was measured using a Shimadzu UV-1800 spectrophotometer. The AAC of rice starch (treated with alkaline solution) was estimated using the iodine colorimetric method of Juliano.Citation16,17) Potato amylose (type III; Sigma Chemical Co., St. Louis, MO) and waxy rice starch (fat and proteins removed from waxy rice) were used as standard amylose and standard amylopectin, respectively, for amylose determination. The iodine absorption spectrum was analyzed from 200 to 900 nm. The absorbance was measured at 620 nm (followed to Juliano’s method), λmax (peak wavelength on iodine staining of starch, which shows high correlation with the length of glucan chain; molecular size of amylose; and SLC), and absorbance at λmax, 400 nm, and B nm (wave length of first peak below 400 nm), is shown in Fig. . The area of F1 (from B nm to 400 nm), area of F2 (from 400 nm to λmax), and area of F3 (from λmax to 900 nm) were calculated. For distinguishing between AAC and SLC, we introduced a novel index, “new λmax,” which is calculated as follows:
Fig. 1. Analysis of the iodine absorption curve of starch.
Notes: F1: Area from Bnm to 400nm (cm2), F2: Area from 400nm to λmax(cm2), F3: Area from λmax to 900nm (cm2). The iodine absorption spectrum was analyzed from 200 nm to 900 nm. The absorbance was measured at 620 nm, the maximum absorption wavelength (λmax), and absorbance at λmax, 400 nm and B nm is shown. The area of F1 (from B nm to 400 nm), area of F2 (from 400 nm to λmax), area of F3 (from λmax to 900 nm), and the new λmax index [the apparent amylose content of various rice starches / (the maximum absorption wavelength of various rice starches - the maximum absorption wavelength of glutinous starch)] were calculated. (A) Ae mutant rice; EM10, (B) Japonica rice; Koshihikari, (C) High- amylose rice; Koshinokaori, (D) Glutinous rice; Koganemochi.
![Fig. 1. Analysis of the iodine absorption curve of starch.Notes: F1: Area from Bnm to 400nm (cm2), F2: Area from 400nm to λmax(cm2), F3: Area from λmax to 900nm (cm2). The iodine absorption spectrum was analyzed from 200 nm to 900 nm. The absorbance was measured at 620 nm, the maximum absorption wavelength (λmax), and absorbance at λmax, 400 nm and B nm is shown. The area of F1 (from B nm to 400 nm), area of F2 (from 400 nm to λmax), area of F3 (from λmax to 900 nm), and the new λmax index [the apparent amylose content of various rice starches / (the maximum absorption wavelength of various rice starches - the maximum absorption wavelength of glutinous starch)] were calculated. (A) Ae mutant rice; EM10, (B) Japonica rice; Koshihikari, (C) High- amylose rice; Koshinokaori, (D) Glutinous rice; Koganemochi.](/cms/asset/98ce1be4-dbea-4475-b2a6-2ba9b7d6acbb/tbbb_a_978257_f0001_b.gif)
New λmax means “revised amylose content including the effect of amylopectin microstructure,” which includes the effect by the characteristics of amylopectin microstructure by dividing AAC by (λmax of various rice starches‐λmax of glutinous starch). λmax of glutinous starch value was calculated from average of Koganemochi, Hakuchomochi, and Hiyokumochi. We defined New λmax of glutinous rice as zero because New λmax is “corrected amylose content including the effect by short-chain amylopectin.”
Measurement of pasting properties of rice flours
The pasting properties of starch rice flours were measured using RVA (model Super 4; New-port Scientific Pty Ltd., Warriewood, Australia). A programmed heating and cooling cycle was followed, as described by Toyoshima et al.Citation45)
Measurement of RS
RS in the starch rice flour was measured according to the AOAC method using a RS assay kit (Megazyme, Wicklow, Ireland). Each sample (100 mg) was digested with pancreatin and amyloglucosidase at 37 °C for 6 h, and glucose was measured using a spectrophotometer at 510 nm.
HPAEC-PAD of isoamylase-debranched materials of starch
The embryo and pericarp were removed from three de-hulled grains of average size. The endosperms were ground with a mortar and pestle, and 5 mg of the powder produced was suspended in 5 mL of methanol and boiled for 10 min. The homogenate was centrifuged at 2500 g for 5 min. The pelleted polyglucan was washed two times with 5 mL of 90% (v/v) methanol, suspended in 5 mL of distilled water, and boiled for 60 min. An aliquot (1.0 mL) of the sample of gelatinized polyglucan was added to 50 μL of 600 mM sodium acetate buffer (pH 4.4) with 10 μL of 2% (w/v) NaN3, and hydrolysis was achieved by the addition of 10 μL of isoamylase from Pseudomonas amyloderamosa (1400 units; Seikagaku Corp., Tokyo, Japan) incubating at 37 °C for 24 h. The aldehyde groups of the debranched glucans were reduced to alcohol groups by treatment with 0.5% (w/v) sodium borohydride under alkaline conditions for 20 h using the method of Nagamine et al.Citation46) The preparation was dried in a vacuumo at room temperature and allowed to dissolve in 20 μL of 1 M NaOH for 60 min. Next, the solution was diluted with 180 μL of distilled water. An aliquot (25 μL) of the preparation was injected into a BioLC system (model DX-500; Dionex, Sunnyvale, CA) equipped with PAD and a Carbopac PA-1 column (4-mm i.d. × 25 cm). Size fractionation of α-1,4 glucans was performed using a linear gradient of sodium acetate (50–500 mM) in 0.1 M NaOH at a flow rate of 1 mL min−1.
Statistical analyses
All results, including the significance of regression coefficients, were statistically analyzed using the t-test and one-way ANOVA, method of Tukey, and Excel Statistics (ver. 2006, Microsoft Corp., Tokyo, Japan).
Results and discussion
Measurement of iodine absorption spectra
The iodine absorption spectrum was analyzed from 200 to 900 nm (Fig. ). The molecular structures of many starches, including amylose molecular sizes and amylopectin branch chain lengths, have been reported.Citation47–49) The high molecular weight amyloses tend to have a longer wavelength of λmax.Citation19) The λmax value of amylose was 598 nm with a molecular weight of approximately 70,000, and a high positive correlation was observed between absorbance at λmax and amylose content.Citation21) Fig. shows that the iodine absorption spectrum of ae mutant rice cultivar EM10; (A), japonica rice cultivar Koshihikari; (B), high-amylose rice Koshinokaori; (C) (japonica-indica hybrid rice) and glutinous rice Koganemochi; (D). The λmax values of the ae mutant rice cultivars tend to be higher than the glutinous rice cultivars, whereas they are lower than the high-amylose rice cultivars, because ae mutant rice cultivars lack starch branching enzyme II b and contain SLC. Table shows that the glutinous rice cultivars have very low λmax values, and indica rice, japonica-indica hybrid rice cultivars, and high-amylose japonica rice cultivar showed higher λmax values, especially Koshinokaori had the highest value. The λmax values of the japonica rice cultivars were intermediate.
Table 1. Analyses of iodine absorption curve, amylose contents, and resistant starch contents of various starch samples.
Table shows that the absorbance at λmax of the ae mutant rice cultivars was higher than the japonica rice, japonica-indica hybrid rice, and the glutinous rice. In case of similarly λmax value in various rice cultivars EM16 (582.5 nm), Hitomebore (583.0 nm), and Jasmin rice (583.0 nm), the absorbance at λmax of EM16 (0.59) was higher than Hitomebore (0.28) and Jasmin rice (0.28).
Table and Fig. reveal that the ae mutant rice cultivar showed higher F2 values than japonica rice, japonica-indica hybrid rice, and the glutinous rice. The indica rice and Yumetoiro showed very high value, and Japonica-indica hybrid rice showed high values, and the japonica rice showed intermediate values.
As shown in Table and Fig. , the ae mutant rice cultivar had higher F3 values than the japonica rice, japonica-indica hybrid rice, and the glutinous rice. The F3 values of the glutinous rice cultivars were very low, whereas those of the ae mutant rice cultivars were very high. The F3 values of the indica rice, japonica-indica hybrid rice cultivars, and high-amylose japonica rice cultivars were also high, whereas those of the japonica rice cultivars were intermediate. As a result, F2 and F3 values had similar tendency to absorbance at λmax.
Table shows that the new λmax of the ae mutant rice cultivars was 2.23–2.99 times greater than those of the japonica rice cultivars, which were very low, particularly the low-amylose japonica rice Yumepirika. Koshihikari, Yumetoiro, and Hoshiyutaka also had high values. Furthermore, Koshinokaori, Carnaroli, Ekkako, and Mizuhochikara had intermediate values. As a result, in case of similar ACC (ACC contain a lot of amylose and a little SLC in amylopectin) in various rice cultivars, the difference of New λmax values is presumed to be related to SLC in amylopectin, as shown in the relationship between Hokurikukona243go (AAC; 21.6%, New λmax; 0.66) and Carnaroli (AAC; 22.0%, New λmax; 0.30), the relationship between Hoshiyutaka (AAC; 27.2%, New λmax; 0.44) and Koshinokaori (AAC; 25.8%, New λmax; 0.31), and the relationship between EM129 (AAC; 31.3%, New λmax; 0.64) and Yumetoiro (AAC; 30.7%, New λmax; 0.46).
AAC of starch
AAC has been used as a good parameter for estimating the cooking or eating qualities of rice grains and iodine colorimetric method at 620 nm for AAC measurement was developed by Juliano.Citation16)
In general, cereal starches are reported to have higher AAC than root and tuber starches, which tend to retrograde more rapidly after boiling, while cereal amyloses are smaller molecules than amyloses of other origins. Moreover, large molecular weight amyloses are readily gelatinized but not retrograded easily.Citation50) Eating or cooking quality of rice is related to the amylose content and the fine structure of amylopectin.Citation51) The AAC contents are higher than the actual amylose contents because of long-chain amylopectin binding with iodine.Citation47)
Table shows that the AAC was 21.6–36.8 (%) in the ae mutant rice cultivars, that is, 1.05 times greater than that in the indica rice, Yumetoiro; 1.18 times greater than that in the japonica-indica hybrid rice, Hoshiyutaka; and 2.08 times greater than that in the japonica rice cultivar, Koshihikari. As a result, in case of similar AAC in various rice cultivars, the difference of λmax values tends to reflect amylose molecular sizes (the length of the glucan chain; molecular size of amylose and SLC), as shown in the relationship between Hokurikukona243go (AAC; 21.6%, λmax; 555.5 nm) and Carnaroli (AAC; 22.0%, λmax; 596.5 nm), the relationship between Hoshiyutaka (AAC; 27.2%, λmax; 585.0 nm) and Koshinokaori (AAC; 25.8%, λmax; 605.5 nm), and the relationship between EM129 (AAC; 31.3%, λmax; 571.5 nm) and Yumetoiro (AAC; 30.7%, λmax; 589.0 nm).
RS contents
Yang et al.Citation22) reported that mutant rice is rich in RS. The japonica rice cultivars had significantly lower RS contents than the indica rice and japonica-indica hybrid rice cultivars with similar amylose contents.Citation52) Two crystalline structures of starch have been identified (A and B type), which contain differing proportions of amylopectin. A type starches are found in cereals, whereas B type starches are found in tubers and amylose-rich starches.Citation53) The resistance of starch to digestion is influenced by the nature of the association between starch polymers, with higher amylose levels in the starch being associated with slower digestibility rates. Both B and C type starches appear to be more resistant to digestion, with high-amylose maize producing RS that has been particularly useful in the preparation of foods.Citation54) In general, starches rich in amylose are naturally more resistant to digestion and more susceptible to retrograde, while SLC in amylopectin behaved in a manner similar to amylose by restricting starch swelling.Citation55) As shown in Table , the RS contents of the ae mutant rice cultivars (excluding Hokurikukona243go) were very high at 7.35–9.85%, that is, 2.34 times greater than those of the indica rice, 3.59 times greater than those of the japonica-indica hybrid rice and high-amylose japonica rice, and 4.00 times greater than those of the japonica rice cultivars.
Pasting properties of rice flours
The pasting properties also influence the rice eating quality; therefore, it is useful to conduct a gelatinization test as a quality assay for rice. Breakdown (BD) indicates the ease with which the starch granules are disintegrated. High-amylose cultivars had a higher final viscosity than low-amylose cultivars, where the final viscosity is related to the degree of starch retrogradation after cooling.Citation27,56) Supplemental Table 1 shows that the ae mutant rice cultivars had very low maximum viscosity, BD values, and setback2, SB2 (final.vis– maximum.vis), viscosity than the other cultivars, but they had high pasting temperature, final viscosity, minimum viscosity, consistency (final.vis–minimum.vis) and consistency/BD ratios. A highly positive relationship was observed between the SLC contents and consistency; therefore, SLC in amylopectin appear to have a great effect on the consistency of starch.Citation8) In contrast, Hokurikukona243go had very high maximum viscosity and BD values. Moreover, the japonica-indica hybrid rice and high-amylose japonica rice cultivars showed high pasting temperature, maximum viscosity, final viscosity, and BD compared with the other cultivars. In addition, the japonica rice cultivars had high maximum viscosity, BD values, and SB viscosity.
Correlation between analysis of iodine absorption curve, amylose contents, resistant starch and pasting properties of 32 cultivars of rice starch
The water-insoluble amylose contents estimated in milled rice flour showed a high positive correlation with the λmax of the iodine color.Citation57) The color and λmax of the complex varied according to DP of the polymer chain. The λmax also increased with the length of the glucan chain.Citation58) In this study, the “new λmax” showed a positive correlation with absorbance at λmax (A λmax, r = 0.95), AAC (r = 0.92), RS (r = 0.89), minimum viscosity (r = 0.84), final viscosity (r = 0.82), SB2 viscosity (r = 0.62), pasting temperature (r = 0.76), consistency (r = 0.63), and consistency/BD ratios (r = 0.70) at p < 0.01. The “new λmax” (r = 0.89) and A λmax (r = 0.89) had higher correlations with RS contents than AAC (r = 0.83) at p < 0.01. Thus, the “new λmax” is presumed to be related to SLC in amylopectin. Table shows that the AAC was correlated positively with absorbance at λmax. The iodine absorption curve had a higher correlation with RS contents than the pasting property values obtained using an RVA.
Table 2. Correlation between results of analysis of iodine absorption curve, amylose contents, resistant starch contents, and pasting properties of 32 rice cultivars starch samples.
Unit-chain length distributions of debranched materials of starches measured by HPAEC-PAD
In addition to amylose, amylopectin chain length distribution affects the eating or cooking qualities of rice.Citation3,4,9,11,13,42)
The segregation pattern profile for amylopectin chain length demonstrated the enrichment of short chains (DP ≦ 11) and the depletion of intermediate-size chains (12 ≦ DP ≦24) in japonica rice compared with indica rice, and starch granules that contained amylopectin with longer chains were more resistant to gelatinization.Citation41) The waxy rice used to produce soft cakes, such as Hakuchomochi, contained more short chains and fewer long chains than that used to produce hard cakes, such as Koganemochi.Citation58) Table shows that the proportion of short chains was much lower in the ae mutant rice cultivars than in the wild-type rice. In contrast, the proportion of longer chains was higher in the ae mutant rice cultivars than in the wild-type rice. In particular, the proportion of short chains (DP ≦ 12) was markedly lower in the endosperm starch of the ae mutant rice cultivars, whereas the proportion of long chains (DP ≧ 37) was greatly elevated. In Kinmaze (wild type), the proportion of short chains (DP ≦ 12), intermediate-size chains (fb1 : 13 ≦ DP ≦ 24), and long chains (DP ≧ 37) was intermediate compared with that in the ae mutant rice and glutinous rice cultivars. In the glutinous rice cultivars, the proportion of short chains (DP ≦ 12) was very high and that of intermediate-size chains (fb1 : 13 ≦ DP ≦ 24) was high, whereas the proportion of long chains (DP ≧ 37) was very low compared with that in the ae mutant rice cultivars and wild-type rice. The results are same with the report by Nishi et al.Citation25)
Table 3. Chain-length distribution of ae mutant rice, japonica rice and waxy rice starches.
Correlation between DP, iodine absorption curve, amylose contents, RS contents, and correlation of New λmax with amylopectin and pasting properties
As shown in Table , the “new λmax” and absorbance at λmax (A λmax) had higher negative correlations with Fa (DP ≦ 12) than the AAC, and pasting property values, such as pasting temperature and consistency viscosity, obtained using an RVA. The “new λmax” had a higher negative correlation with Fb1 (13 ≦ DP ≦ 24) than AAC, pasting temperature, and consistency viscosity. RS contents also had a positive correlation with Fb3 (DP ≧ 37), Fb1+2+3 (DP ≧ 13), and Fb1/Fa ratios and negative correlation with Fa (DP ≦ 12), which means that not only amylose but also chain length distribution of amylopectin affects RS contents.
Table 4. Correlation between results of analysis of iodine absorption curve, amylose contents, resistant starch contents, pasting properties, and degree of polymerization of 10 rice cultivars starch samples.
Formula for estimating the AAC based on the iodine absorption curve of starch
Igarashi et al.Citation21) reported a positive correlation between absorbance at λmax and AAC. In this study, the AAC of starch from 32 cultivars had positive correlations with absorbance at λmax (r = 0.97, p < 0.01) and λmax (r = 0.48, p < 0.05). Inouchi et al.Citation9) showed that SLC content of starch can be estimated on the basis of λmax and the blue value of purified amylopectin. The color and λmax of the complex varied accordingly to DP of the polymer chain. λmax also increases with the length of the glucan chain.Citation59) For the ae mutant rice cultivars and indica rice with similar amylose contents, λmax of the ae mutant rice was lower than that of the indica rice. The amylopectin contents of the ae mutant rice cultivars were probably higher than those of the indica rice. The formula for estimating AAC was developed as follows: The AAC was used as response variables and the parameters from analysis of the iodine absorption curve were used as predictor variables in the multiple regression analyses. Fig. (A) shows the formula developed for estimating the AAC based on the analysis of the iodine absorption curve of starch. In order to reflect not only the properties of amylose but also the effect of amylopectin chain length, we selected A λmax as an indicator for amylopectin microstructure and λmax as an indicator for chain length of amylose. The equation has a multiple regression coefficient of 0.998 based on the calibration. The following formula for estimating the amylose content was obtained using 10 cultivars (EM10, Hokurikukona243go, EM189, EM72, EM129, EM21, EM16, Kinmaze, Koganemochi, and Hakuchomochi) for calibration:
Fig. 2. Formula for estimating the amylose content based on the iodine absorption curve of starch (2A). The equation had multiple regression coefficients of 0.989 based on the calibration.
Notes: (A) Estimation formula; amylose content (%) = 67.944 × A λmax + 0.118 × λmax –74.600. 1, EM10; 2, Hokurikukona243go; 3, EM189; 4, EM72; 5, EM129; 6, EM21; 7, EM16; 8, Kinmaze; 9, Koganemochi; and 10, Hakuchomochi. (B) shows that a multiple regression coefficient of 0.972 was obtained with the application of the estimated formula to 22 unknown samples. Therefore, the validation test showed that the equation can be applied to unknown samples. (B) Application of the formula to unknown samples. 1, Yumetoiro; 2, Hoshiyutaka; 3, Kamenoo; 4, Kirara397; 5, Koshinokaori; 6, Hinohikari; 7, Hitomebore; 8, Akitakomachi; 9, EM174; 10, EM145; 11, Koshihikari; 12, Hiyokumochi; 13, Yumepirika; 14, Kitsurin 88go; 15, Jasmin rice; 16, Taiwan delicious rice; 17, Taiwan aromatic rice; 18, Carbaroli; 19, Kareimai; 20, Mizuhochikara; 21, Super hybrid rice; and 22, Ekkako.
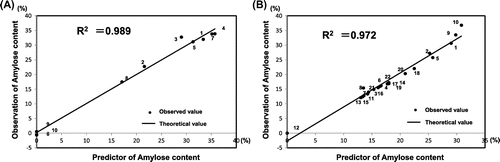
Fig. (B) shows that a multiple regression coefficient of 0.987 was obtained with the application of the above-mentioned formula to 22 unknown samples (Yumetoiro, Hoshiyutaka, Kamenoo, Kirara397, Koshinokaori, Hinohikari, Hitomebore, Akitakomachi, EM174, EM145, Koshihikari, Hiyokumochi, Yumepirika, Kitsurin88go, Jasmin rice, Taiwan delicious rice, Taiwan aromatic rice, Carnaroli, Kareimai, Mizuhochikara, Super hybrid rice, and Ekkako). Thus, the validation test showed that the equation can be applied to unknown samples. As a result, in AAC measurement, the calibration curve (as standard amylose and standard amylopectin) became unnecessary. Therefore, definition for “new λmax” can be expressed as follows:
By replacing AAC with (73.307 × A max + 0.111 × λmax – 73.016), it became possible to calculate the value of “new λmax” using only the results of iodine colorimetric measurements.
Formula for estimating the RS content based on the iodine absorption curve of starch
Among the ae mutant rice cultivars and indica rice with similar amylose contents, the λmax values of the ae mutant rice cultivars were lower than those of the indica rice, while RS contents of the ae mutant rice cultivars were higher than those of the indica rice, probably because the amylopectin contents of the ae mutant rice cultivars were higher than those of the indica rice. The formula for estimating resistant starch was developed as follows: Resistant starch was used as response variables and the parameters from analysis of the iodine absorption curve were used as predictor variables in the multiple regression analyses. Fig. (A) shows the formula developed for estimating the RS content based on the iodine absorption curve of starch. The equation had a multiple regression coefficients of 0.880 based on the calibration. The following formula for estimating the RS content was obtained using 16 cultivars (Koganemochi, Taiwan delicious rice, Kitsurin88go, Kirara397, Kareimai, Hitomebore, Kinmaze, Akitakomachi, Koshinokaori, Carnalori, Hokurikukona243go, Yumetoiro, EM145, EM16, EM189, and EM10) for calibration:
Fig. 3. Formula for estimating the resistant starch content based on the iodine absorption curve of starch (3A). The equation had a multiple regression coefficient of 0.880 based on the calibration.
Notes: (A) Estimation formula; resistant content (%) = 21.312 × A λmax – 0.030 × λmax + 12.251. 1,Koganemochi; 2, Taiwan delicious rice; 3, Kitsurin88go; 4,Kirara397; 5, Kareimai; 6, Hitomebore; 7, Kinmaze; 8, Akitakomachi; 9, Koshinokaori; 10, Carnalori; 11, Hokurikukona243go; 12, Yumetoiro; 13, EM145; 14, EM16; 15, EM189; and 16, EM10. (B) shows that a multiple regression coefficient of 0.784 was obtained with the application of the estimation formula to 16 unknown samples. Therefore, the validation test showed that the equation can be applied to unknown samples. (B) Application of the estimated formula to unknown samples 1, Hiyokumochi; 2, Hakuchomochi; 3, Yumepirika; 4, Jasmin rice; 5, EM21; 6, Super hybrid rice; 7, Taiwan aromatic rice; 8, Kamenoo; 9, Hinohikari; 10, Ekkako; 11, Mizuhochikara; 12, Koshihikari; 13, Hoshiyutaka; 14, EM174; 15, EM129; 16, EM72.
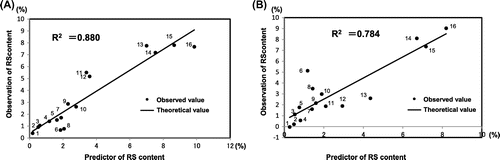
Fig. (B) shows that a multiple regression coefficient of 0.784 was obtained with the application of the above-mentioned formula to 16 unknown samples (Hiyokumochi, Hakuchomochi, Yumepirika, Jasmin rice, EM21, Super hybrid rice, Taiwan aromatic rice, Kamenoo, Hinohikari, Ekkako, Mizuhochikara, Koshihikari, Hoshiyutaka, EM174, EM129, and EM72). Thus, the validation test showed that the equation can be applied well to unknown samples.
Formulae for estimating the proportions of short chains (Fa) and long chains (Fb3) in amylopectin based on the iodine absorption curve of starch
Amylose forms small, linear, and slightly branched molecules, whereas amylopectin is a large and highly branched molecule, and their structures have been shown to be characteristics of specific botanical sources.Citation60) The amylopectin chain length distribution is of particular interest because of its relationship with the physicochemical properties of starch, such as its crystalline structure.Citation7) These results suggest that amylopectin chain length distribution affects the physical properties related to retrogradation. The formula for estimating amylopectin side-chain structures was developed as follows: The proportion of DP (DP ≦ 12) or that of DP (DP ≧ 37) was used as a response variable and the parameters from analysis of the iodine absorption curves were used as predictor variables in the multiple regression analyses. Fig. (A) shows the formula developed for estimating the proportion of DP (DP ≦ 12), Fa, on the basis of the iodine absorption curve of starch. The equation had a multiple regression coefficients of 0.962 based on the calibration. In order to estimate short-chain fraction of amylopectin (Fa) precisely, we developed the following formula adopting F2 value and New λmax as parameters based on the data of 10 cultivars (EM10, Hokurikukona243go, EM189, EM72, EM129, EM21, EM16, Kinmaze, Koganemochi, and Hakuchomochi) for calibration:
Fig. 4. Formulas for estimating the glucans Fa (DP ≦ 12) and Fb3(DP ≧ 37) based on the iodine absorption curve of starch (4A).
Notes: (A) shows the formula for estimation the proportion of the degree of polymerization (DP ≦ 12), Fa, based on the iodine absorption curve of starch. The equation had a multiple regression coefficients of 0.962 based on the calibration. (A) Estimation formula; proportion of short chain (Fa) (%)=–11.59 × F2 value – 10.92 × New λmax index + 34.429 1, EM10; 2, Hokurikukona243go; 3, EM189; 4, EM72; 5, EM129; 6, EM21; 7, EM16; 8, Kinmaze; 9, Koganemochi; and 10, Hakuchomochi. (B) shows the formula for estimation of the proportion of the degree of polymerization (DP ≧ 37), Fb3, based on the iodine absorption curve of starch. The equation had a multiple regression coefficients of 0.979 based on the calibration. (B) Estimation formula; Proportion of long chain (Fb3) (%) = 44.691 × A λmax – 0.774.
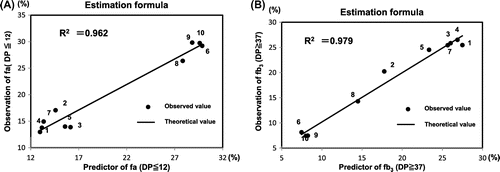
Fig. (B) shows the formula developed for estimating the proportion of DP (DP ≧ 37), Fb3, on the basis of the iodine absorption curve of starch. The equation had a multiple regression coefficients of 0.979 based on the calibration. The following formula for estimating the proportion of long chains (Fb3) was developed by adopting A λmax as a parameter based upon the data of 10 cultivars (EM10, Hokurikukona243go, EM189, EM72, EM129, EM21, EM16, Kinmaze, Koganemochi, and Hakuchomochi) for calibration:
To ascertain the adaptability of these estimation formulae, correlations between estimated Fa and Fb3 with AAC, RS, “new λmax”, λmax, A λmax, F1, F2, F3, F1 + F2, minimum viscosity. BD values, final viscosity, SB2 viscosity, pasting temperature, consistency, consistency/BD ratios, and maximum viscosity were examined using 22 unknown rice starch samples (Yumetoiro, Hoshiyutaka, Kamenoo, Kirara397, Koshinokaori, Hinohikari, Hitomebore, Akitakomachi, EM174, EM145, Koshihikari, Hiyokumochi, Yumepirika, Kitsurin88go, Jasmin rice, Taiwan delicious rice, Taiwan aromatic rice, Carnaroli, Kareimai, Mizuhochikara, Super hybrid rice, and Ekkako). Supplemental Table 2 shows that Fa had significantly negative correlation with pasting temperature (r = −0.686) at p < 0.01, and Fb3 revealed significantly positive correlation with consistency (r = 0.663) at p < 0.01. As shown in Supplemental Table 2, estimated Fa and Fb3 showed extremely similar tendency as reported by Inouchi et al. Citation9,11) which revealed that these estimation formulae for Fa and Fb3 could be applied to unknown rice samples.
Conclusions
We searched for the easy and simple method to measure the novel indicators, which reflect not only AAC but also RS and CD of amylopectin.
We found that the iodine absorption curve differed among the indica rice, japonica rice, japonica-indica hybrid rice, ae mutant rice cultivars, and glutinous rice cultivars.
We propose a novel index, “new λmax” based on iodine absorption curve, which shows higher correlation with amylose, resistant starch or CD of amylopectin than ordinary λmax of iodine absorption curve or RVA parameters.
We developed the novel estimation formulae for AAC, RS contents, and amylopectin chain lengths (Fa; DP ≦ 12, Fb3; DP ≧ 37) on the basis of the iodine absorption curve, which would enable us to evaluate the characteristics of various kinds of starch by an easy and low-cost spectroscopic method.
Supplemental material
The supplemental material for this paper is available at http://dx.doi.org/10.1080/09168451.2014.978257.
Supplemetal Materials
Download MS Power Point (1.1 MB)Acknowledgment
We thank FOSS Japan Co., Ltd., for leasing the RVA device. We express our gratitude to Dr. Masayuki Yamaguchi of NARO and Professor J. Cui of Tenjian Agricultural University, China for kind gift of rice samples. Part of this research was supported by the Research Project on Development of Agricultural Products and Foods with Health-Promoting Benefits (NARO).
Notes
Abbreviations: AAC, apparent amylose content; CD, chain length distribution; RS, resistant starch; GI, glycemic index; SLC, super-long chains; SB, setback; BD, breakdown.
Related Research Data
References
- Juliano BO, Onate LU, Mundo AM. A simplified assay for milled rice amylose. Food Technol. 1965;19:1006–1011.
- Okadome H, Kurihara M, Kusuda O, Toyoshima H, Kim JI, Shimotsubo K, Matsuda T, Ohtsubo K. Multiple measurements of physical properties of cooked rice grains with different nitrogenous fertilizers. Jpn. J. Crop Sci. 1999;68:211–216.10.1626/jcs.68.211
- Takeda Y, Hizukuri S, Juliano BO. Purification and structure of amylose from rice starch. Carbohydr. Res. 1986;148:299–308.10.1016/S0008-6215(00)90397-5
- Takeda Y, Hizukuri S, Juliano BO. Structures of rice amylopectins with low and high affinities for iodine. Carbohydr. Res. 1987;168:79–88.10.1016/0008-6215(87)80008-3
- Gallant DJ, Bouchet B, Baldwin PM. Microscopy of starch evidence of a new level of granule organization. Carbohydrate Polym. 1997;32:177–191.10.1016/S0144-8617(97)00008-8
- Robin JP, Mercier C, Charbonniere R, Guilbot A. Gel filtration and enzymatic studies of insoluble residues from prolonged acid treatment of potato starch. Cereal Chem. 1974;51:389–406.
- Hizukuri S. Polymodal distribution of the chain lengths of amylopectins and its significance. Carbohydr. Res. 1986;147:342–347.10.1016/S0008-6215(00)90643-8
- Nakamura Y, Sakurai A, Inaba Y, Kimura K, Iwasawa N, Nagamine T. The fine structure of amylopectin in endosperm from asian cultivated rice can be largely classified into two classes. Starch Starke. 2002;54:117–131.10.1002/1521-379X(200204)54:3/4<117::AID-STAR117>3.0.CO;2-2
- Inouchi N, Hibiu H, Li T, Horibata T, Fuwa H, Itani T. Structure and properties of endosperm starches from cultivated rice of asia and other countries. J. Appl. Glycoscience. 2005;52:239–246.10.5458/jag.52.239
- Asaoka M, Okuno K. Effect of environmental temperature at the milky stage on amylose content and fine structure of amylopectin of waxy and nonwaxy endosperm starches of rice (Oryza sativa L.). Agric. Biol. Chem. 1985;49:373–379.10.1271/bbb1961.49.373
- Inouchi N, Ando H, Asaoka M, Okuno K, Fuwa H. The effect of environmental temperature on distribution of unit chains of rice amylopectin. Starch Stärke. 2000;52:8–12.10.1002/(ISSN)1521-379X
- Adam A, Karen AKM, Anna MM, Donn HB, Brucc RH. Effect of growth location in the United States on amylose content, amylopectin fine structure, and thermal properties of starches of long grain rice cultivars. Cereal Chem. 2006;83:93–98.
- Umemoto T, Terashima K, Nakamura Y, Satoh H. Differences in amylopectin structure between two rice varieties in relation to the effects of temperature during grain-filling. Starch Stärke. 1999;51:58–62.10.1002/(ISSN)1521-379X
- Sano Y. Differential regulation of waxy gene expression in rice endosperm. Theor. Appl. Genet. 1984;68:467–473.
- Hirano H, Sano Y. Enhancement of Wx gene expression and the accumulation of amylose in response to cool temperatures during seed development in rice. Plant Cell Physiol. 1998;39:807–812.10.1093/oxfordjournals.pcp.a029438
- Juliani BO. A simplified assay for milled-rice amylose. Cereal Sci. Today. 1971;12:334–360.
- Landers PS, Gbur EE, Sharp RN. Comparison of two methods to predict amylose concentration in rice flours as determined by spectrophotometric assay. Cereal Chem. 1991;68:545–548.
- Yamashita S, Baba N, Moriyama H. Application of dual-wavelength spectroscopy to determination of amylose and amylopectin contents. Nippon Shokuhin Kogyo Gakkaishi. 1993;40:365–369. Japanese.10.3136/nskkk1962.40.5_365
- Fukahori N, Yamashita S, Baba N. Influence of cultivars of rice and molecular weight of amylose on the selected wavelength for the dual-wavelength method. Bull. Fukuoka Agr. Res. cent. 1996;15:15–17.
- Fitzgerald MS, Bergman CJ, Resurreccion AP, Möller J, Jimenez R, Reinke RF, Martin M, Blanco P, Molina F, Chen MH, Kuri V, Romero MV, Habibi F, Umemoto T, Jongdee S, Graterol E, Reddy KR, Bassinello PZ, Sivakami R, Rani NS, Das S, Wang YJ, Indrasari SD, Ramli A, Ahmad R, Dipti SS, Xie L, Lang N, Singh P, Toro DC, Tavasoli F, Mestres CJ. Addressing the dilemmas of measuring amylose in rice. Cereal Chem. 2009;86:492–498.10.1094/CCHEM-86-5-0492
- Igarashi T, Yanagihara T, Kanda H, Kawamoto K, Masaki K. Development of new eating quality evaluation method based on iodine adsorption multispectral analysis of rice flour. Jpn. J. Crop Sci. 2009;78:66–73.10.1626/jcs.78.66
- Yang CZ, Shu XL, Zhang LL, Wang XY, Zhao HJ, Ma CX, Wu DX. Starch properties of mutant rice high in resistant starch. J. Agric. Food Chem. 2006;54:523–528.10.1021/jf0524123
- Goddard M, Yong G, Marcus R. The effect of amylose content on insulin and glucose responses to ingested rice. J. Clin. Nutr. 1984;39:388–392.
- Kang HJ, Hwang IK, Kim KS, Choi HC. Ultrastructure of individual and compound starch granules in isolation preparation from a high-quality, low-amylose rice, Ilpumbyeo, and its mutant, G2, a high-dietary fiber, high-amylose rice. J. Agric. Food. Chem. 2003;51:6598–6603.10.1021/jf0344946
- Nishi A, Nakamura Y, Tanaka N, Satoh H. Biochemical and genetic analysis of the effects of amylose-extender mutation in rice endosperm. Plant Physiol. 2001;127:459–472.10.1104/pp.010127
- Miyazato S, Nakagawa C, Kishimoto Y, Tagami H, Hara H. The effect of amylose content on insulin and glucose responses to ingested rice. Eur. J. Nutr. 2010;49:165–171.10.1007/s00394-009-0062-6
- Nilsson AC, Ostman EM, Granfeldt Y, Bjorck IM. Effect of cereal test breakfasts differing in glycemic index and content of indigestible carbohydrates on daylong glucose tolerance in healthy subjects. J. Clinic. Nutr. 2008;87:645–654.
- Henry CJ, Lightowler HJ, Tydeman EA, Skeath R. Use of low-glycemic index bread to reduce 24-h blood glucose implications for dietary advice to non-diabetic and diabetic subjects. J. Food Nutr. 2006;57:273–278.
- Nakamura S, Ohtsubo K. Influence of physicochemical properties of rice flour on oil uptake of tempura frying batter. Biosci. Biotechnol. Biochem. 2010;74:2484–2489.10.1271/bbb.100584
- Nakamura S, Satoh H, ohtsubo K. Palatable and bio-functional wheat/rice products developed from pre-germinated brown rice of super-hard cultivar EM10. Biosci. Biotechnol. Biochem. 2010;74:1164–1172.10.1271/bbb.90850
- Nakamura S, Satoh H, Ohtsubo K. Characteristics of pre-gelatinized ae mutant rice flours prepared by boiling after pre-roasting. J. Agric. Food Chem. 2011;59:10665–10676.10.1021/jf200973x
- Englyst HN, Kingman SM, Cummings JH. Classification and measurement of nutritionally important starch fractions. Eur. J. Clin. Nutr. 1992;46:S33–S50.
- Englyst HN, Cumming JH. Digestion of the polysaccharides of some cereal foods in the human small intestine. J. Clin. Nutr. 1985;42:778–787.
- Prosky L, Asp N-G, Furda I, Devries JW, Schweizer TF, Harland BF. Determination of total dietary fiber in foods and food products: collaborative study. J. Assoc. Anal. Chem. 1985;68:677–679.
- Englyst HN, Cumming JH. Improved method for measurement of dietary fiber as non-starch polysaccharides in plant foods. J. Assoc. Anal. Chem. 1988;71:808–814.
- Homma N, Akaishi R, Yoshii Y. Measurement of resistant starch content in polished rice and processed rice products. Nippon Shokuhin Kogyo Gakkaishi. 2008;55:18–24.10.3136/nskkk.55.18
- Yu-Ting C, Maria LS. Effect of variety and cooking method on resistant starch content of white rice and subsequent postprandial glucose response and appetite in humans. Asia Pac. J. Clin. Nutr. 2013;22:372–379.
- Hizukuri S, Takeda Y, Yasuda M, Suzuki A. Re-examination of the action of sweet potato beta-amylase on phosphorylated (1-4) α-D-glucan. Carbohydr. Res. 1981;94:205–213.10.1016/S0008-6215(00)80718-1
- Okuda M, Hashizume K, Aramaki I, Numata M. Influence of starch characteristics on digestibility of steamed rice grains under sake-making conditions,and rapid estimation methods of digestibility by physical analysis. J. Appl. Glycoscience. 2009;56:185–192.10.5458/jag.56.185
- Xian-Zhong H, Bruce RH. Amylopectin fine structure and rice starch paste breakdown. J. Cereal Sci. 2001;34:279–284.
- Umemoto T, Yano M, Satoh H, Shomura A, Nakamura Y. Mapping of a gene responsible for the difference in amylopectin structure between japonica-type and indica-type rice varieties. Theor. Appl. Genet. 2002;104:1–8.10.1007/s001220200000
- Hanashiro I, Tagawa M, Shibahara S, Iwata K, Yakeda T. Examination of molecular-based distribution of A, B and C chains of amylopectin by fluorescent labeling with 2-aminopyridine. Carbohyd. Res. 2002;337:1208–1212.
- Yamamoto K, Sawada S, Onogaki I. Properties of rice starch prepared by alkali method with various conditions (in Japanese). Denpun Kagaku. 1973;20:99–104.
- Yamamoto K, Sawada S, Onogaki I. Starch granules were prepared from polished rice following the cold-alkali method. Denpun Kagaku. 1981;28:241–244. Japanese.
- Toyoshima H, Okadome H, Ohtsubo K, Suto M, Horisue N, Inatsu O, Narizuka A, Aizaki M, Okawa T, Inouchi N. Cooperative test on the small-scale rapid method for the gelatinization properties test of rice flours with a Rapid-Visco-Analyser (RVA). Nippon Shokuhin Kogakukaishi. 1997;44:579–584.10.3136/nskkk.44.579
- Nagamine T, Komae K. Improvement of a method for chain-length distribution analysis of wheat amylopectin. J. Chromatogr. A. 1996;732:255–259.10.1016/0021-9673(95)01229-X
- Jideani IA, Takeda Y, Hizukuri S. Structures and physicochemical properties of starches from Acha (Digitaria exilis), Iburu (D. iburua), and Tamba (Eleusine coracana). J Cereal Chem. 1996;6:677–685.
- Takeda Y, Shitaozono T, Hizukuri S. Molecular structure of corn starch. Starch Staerke. 1988;40:51–54.10.1002/(ISSN)1521-379X
- Takeda C, Takeda Y, Hizukuri S. Structures of amylomaize amylose. Cereal Chem. 1989;66:22–25.
- Takeda Y, Hizukuri S. Structures of branched molecules of amyloses of various origins, and molar fractions of branched and unbranched molecules. Carbohydr. Res. 1987;165:139–145.10.1016/0008-6215(87)80089-7
- Ong MH, Blanshard JMV. Texture determinants of cooked parboiled rice II: Physicochemical properties and leaching behaviour of rice. J. Cereal Sci. 1995;21:251–260.10.1006/jcrs.1995.0028
- Peisong Hu, Zhao Haijun, Duan Zhiying, Linlin Zhang, Dianxing Wu. Starch digestibility and the estimated glycemic score of different types of rice differing amylose contents. J. Cereal Sci. 2004;40:231–237.
- Topping DL, Clifton PM. Short-chain fatty acids and human colonic function: roles of resistant starch and non-starch polysaccharides. Physiol. Rev. 2001;81:1031–1064.
- Brown IL. Applications and uses of resistant starch. J. Assoc. Anal. Chem. 2004;3:727–732.
- Jane J, Chen YY, Lee LF, McPherson AE, Wong KS, Radosavljevic M. Effects of amylopectin branch chain length and amylose content on the gelatinization and pasting properties of starch 1. J. Cereal Chem. 1999;76:629–637.10.1094/CCHEM.1999.76.5.629
- Yamada H, Sasagawa N, Kitazawa K. Relationship between gelatinization properties by an amylograph and expansion of rice crackers from new-characteristic rice. Nippon Shokuhin Kogakukaishi. 1993;40:278–286. Japanese.10.3136/nskkk1962.40.278
- Chinnaswamy R, Bhattacharya KR. Characteristics of Gel-chromatographic fractions of starch in relation to rice and expanded rice-product qualities. Starch Starke. 1986;38:51–57.10.1002/(ISSN)1521-379X
- Igarashi T, Kinoshita M, Kanda H, Nakamori T, Kusume T. Evaluation of hardness of waxy rice cake based on the amylopectin chain-length distribution. J. Appl. Glycoscience. 2008;55:13–19.10.5458/jag.55.13
- Banks W, Greenwood CT. Studies on the biosynthesis of starch granules.2. The properties of the components of starches from smooth- and wrinkled-seeded peas during growth. In: Bank W, Greenwood CT, editor. Starch and its components. Edinburgh: Edinburgh University Press; 1975. p. 2–111.
- Hizukuri S, J-I Abe, Hanashiro I. Starch, analytical aspects. In: Eliasson A-C, editor. Carbohydrates in food. New York, NY: Marcel Dekker; 1996. p. 347–429.