
Abstract
We examined whether soybean (SB) and soy protein isolate (SPI) can prevent the betaine-induced elevation of plasma cholesterol as well as maintain the betaine-induced reduction of plasma Hcy concentration. Rats were fed casein-, SB-, or SPI-based diet with or without betaine; SPI-based diet with betaine containing soybean fiber (SF) or soy lecithin (SL) or the combination of SF and SL. Plasma Hcy concentration was decreased by feeding betaine to rats fed the casein-, SB-, and SPI-based diets. Betaine-induced elevation of plasma cholesterol was decreased by feeding the SB-based diet compared with the casein-based diet, but was not decreased by feeding the SPI-based diet. In rats fed the SPI-based diet, the increased concentration of plasma cholesterol by betaine feeding was not prevented by independent addition of SL or SF, but was prevented by a combination of SL and SF, and was associated with increased fecal excretion of bile acids.
Graphical abstract
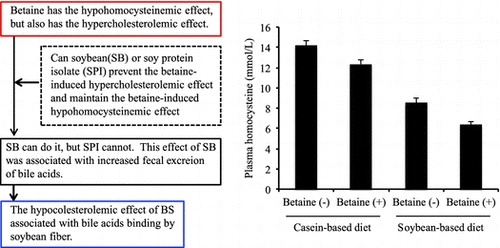
Soybean prevents the betaine-induced hypercholesterolemic effect and maintains the betaine-induced hypohomocysteinemic effect, which was associated with increased fecal excretion of bile acids by soybean fiber.
Abbreviations:
- BHMT, betaine-homocysteine-S-methyltransferase
- CBS, cystathionine β-synthesis
- CYP7A1, cholesterol 7α-hydroxylase
- Hcy, homocysteine
- HMG-CoA reductase, hydroxymethylglutaryl-CoA reductase
- MS, methionine synthesis
- MTP, microsomal triglyceride transfer protein
- SAH, S-adenosyl-L-homocysteine
- SAM, S-adenosylmethionine, SPI, soy protein isolate
- SB, soybean
- SL, soy lecithin
- SF, soy fiber
- TG, triglyceride
Metabolism of the nonprotein amino acid homocysteine (Hcy) has attracted considerable interest in recent years since it was observed that increased plasma Hcy concentrations in humans correlate with increased risk of cardiovascular disease [Citation1,2]. Hcy concentrations can be lowered through increased remethylation of Hcy into methionine. Betaine (trimethylglycine) serves as a methyl donor in this reaction. Betaine supplementation lowers plasma Hcy in humans [Citation3,4] and rats [Citation5,6].
Clinical and pathological studies show that elevated plasma levels of total cholesterol, LDL-cholesterol, and apo B are risk factors for developing cardiovascular disease. Betaine supplements increase cholesterol levels, which could work against any treatment for heart disease. On the other hand, Olthof et al. [Citation7] questioned the safety of betaine supplementation on the basis of the elevation in plasma LDL-cholesterol. In normal, rats betain supplementation leads to increased hepatic production of apoB [Citation8] and increased plasma cholesterol [Citation9]. The adverse effects on blood lipids may undo the potential benefits of betaine supplementation on cardiovascular health.
Soybean (SB) contains several hypocholesterolemic components, such as protein, dietary fiber, and lecithin. We suggest SB and soy protein isolate (SPI) may work in conjunction with betaine so that the concentrations of plasma cholesterol and Hcy are both decreased.
Therefore, we examined whether SB and SPI can prevent the betaine-induced elevation of plasma cholesterol level yet still enable the betaine-induced decrease in plasma Hcy concentration. We also examined which component in SB prevents the betaine-induced elevation in plasma cholesterol concentration.
Materials and methods
Materials
Casein (C): vitamin-free casein was purchased from Oriental Yeast Co., Ltd., Tokyo, Japan. The protein content in vitamin-free casein was 89.9 g/100 g. The methionine content in C was 2.5 g/100 g.
Soybean (SB): commercially available dried soybeans were soaked in water for 12 h. After soaking, the beans were cooked in boiling water for 1 h, cooled to room temperature, broken coarsely, and then freeze-dried. Freeze-dried beans were ground into a fine powder. The composition of SB was (g/100 g): 36.8 g protein, 19.2 g lipids, 22.5 g dietary fiber, 1.7 g ash, 4.6 g water, and 15.2 g others. The contents of methionine and phospholipid in SB were 0.44 g/100 g and 0.35 g/100 g, respectively.
Soy protein isolate (SPI): soy protein isolate (Fujipro R®) was donated from Fuji Oil Co., Osaka, Japan. The composition of SPI was (g/100 g): 90.5 g protein, 0.3 g lipids, 4.3 g ash, 4.6 g water, and 0.3 g others. The content of methionine in SPI was 1.0 g/100 g.
Soybean fiber (SF): soybean fiber (Newpro plus 1000®) was donated from Fuji Oil Co., Osaka, Japan. The composition of SF was (g/100 g): 16.7 g protein, 74.5 g dietary fiber, 5.2 g water, and 3.6 g others.
Soy lecithin (SL): soy lecithin was donated from Fuji Oil Co., Osaka, Japan.
Protein content was determined by the Kjeldahl method [Citation10], using an N-to-protein conversion factor of 6.25. The concentration of lipids was determined by the Soxhlet method. The amount of moisture was determined as the loss in weight after drying at 105 °C for 24 h. The ash content was determined by the direct ignition method (550 °C overnight). The dietary fiber content of SB and SF was determined using the Megazyme Total Dietary Fiber Assay Kit (Bicon Japan Ltd., Nagoya, Japan). Phosphorus determination in lipid samples was made by the method of Fiske and Subbarow [Citation11]. The factor 25 was used to convert lipid phosphorus to phospholipids. The amino acid content of C, SB, and SPI was determined using an amino acid analyzer (model JLC-555/V; Japan Electron Optics Laboratory Co., Ltd., Tokyo, Japan) [Citation12].
Animals
Wistar male rats (Japan SLC, Hamamatsu, Japan), at 7 weeks old, were used throughout this study. Rats were housed individually in screen-bottomed, stainless steel cages in a room maintained at 23 ± 1 °C with a 12 h light/dark cycle (light on, 0700–1900 h). This study was approved by the Laboratory Animal Care Committee of Ehime University. Rats were maintained in accordance with the Guidelines for the Care and Use of Laboratory Animals of Ehime University.
Experiment 1
Rats were acclimated by feeding a commercial solid diet (RodenLab Diet EQ, PMI, Mo, USA) for 7 days. After acclimation, rats were randomly divided into 4 groups (n = 6) and were allowed free access to distilled deionized water and one of the following diets for 28 days: C/B(−) C/B(+), SB/B(−) or SB/B(+) (Table ) [Citation13]. Body weight and food intake were recorded daily for each rat in the morning before the food was replaced.
Table 1. Composition of experimental diets.
Experiment 2
Rats were acclimated by feeding a commercial solid diet (RodenLab Diet EQ, PMI, Mo, USA) for 7 days. After acclimation, rats were randomly divided into 4 groups (n = 6) and were allowed free access to distilled deionized water and one of the following diets for 28 days: C/B(−), C/B(+), SPI/B(−) or SPI/B(+) (Table ) [Citation13]. Body weight and food intake were recorded daily for each rat in the morning before the food was replaced.
Experiment 3
Rats were acclimated by feeding a commercial solid diet (RodenLab Diet EQ, PMI, Mo, USA) for 7 days. After acclimation, rats were randomly divided into 4 groups (n = 6) and were allowed free access to distilled deionized water and one of the following diets for 28 days: SPI/B(+), SPI/SL/B(+), SPI/SF/B(+) or SPI/SL/SF/B(+) (Table ) [Citation13]. Body weight and food intake were recorded daily for each rat in the morning before the food was replaced.
Sampling
Before the rats were killed, feces were collected from each rat over the final 3 days of the experimental period. The feces were freeze-dried, weighed, and milled.
At midnight on the last day of the experimental period, a blood sample was collected from the neck of each rat into a blood collection tube (Vacutainer; Becton Dickinson, Franklin Lakes, NJ) containing heparin as an anticoagulant. Plasma was separated by centrifugation at 1400×g at 4 °C for 15 min and stored at −50 °C until analysis. After blood collection, the liver was immediately perfused with cold saline (9 g/L NaCl), removed, washed with cold saline, blotted dry on filter paper, weighed, and stored at −50 °C until analysis.
Biochemical analysis
The concentrations of total cholesterol and TG in the plasma were determined enzymatically using commercial diagnostic kits (Cholesterol E-Test Wako, and Triglyceride E-Test Wako; Wako Pure Chemical Industries, Osaka, Japan). The concentration of total Hcy in plasma was measured by high-performance liquid chromatography (HPLC) according to the method described by Araki and Sako [Citation14]. The concentration of total liver lipids was determined gravimetrically after extraction, in accordance with the method of Folch et al. [Citation15]. The concentrations of cholesterol and TG in the liver were determined enzymatically, as previously described [Citation16]. The concentrations of S-adenosylmethionine (SAM) and S-adenosyl-L-homocysteine (SAH) in the liver were measured by HPLC according to the method of Cook et al. [Citation17]. The concentration of bile acids in the feces was determined enzymatically using the 3α-dehydrogenase assay method of Sheltaway and Losowsky [Citation18], and taurocholic acid as the standard.
RNA extraction from the liver and RT-PCR analysis of gene expression
Total RNA was extracted from livers according to the method described by Chomczynski and Sacchi [Citation19]. RNA integrity was verified by agarose gel electrophoresis after purification of the mRNA using Oligotex-dT30 (Takara Bio, Shiga, Japan). One microgram of mRNA was used for cDNA synthesis with 10 U of AMV Reverse Transcriptase (Takara Bio, Shiga, Japan) and 2 μL of oligo(dT) primer (Novagen, Inc., Madison, WI, USA), according to the manufacturer’s instructions. Expression of the mRNAs, for betaine-homocysteine-S-methyltransferase (BHMT), cystathionine synthesis (CBS), cholesterol 7α-hydroxylase (CYP7A1), S-adenosyl-L-homocysteine (SAH) hydrolase, 3-hydroxy-3-methylglutaryl-CoA (HMG-CoA) reductase, LDL-Receptor, methionine synthase (MS), microsomal triglyceride transfer protein (MTP), and β-actin, as a housekeeping gene for normalization, was determined by real-time monitoring of a polymerase chain reaction (PCR) using a Light Cycler instrument (Roche Diagnostics, Mannheim, Germany). Two microliters of cDNA were amplified in a total volume of 20 μl using the 2×QuantiTect SYBR Green RT-PCR Master Mix (Qiagen, Hilden, Germany) and specific primers, each at 0.5 M. After initial denaturation and activation of the polymerase at 95 °C for 15 min, cycling was performed for 50 cycles with annealing for 25 s, synthesis at 72 °C for 30 s, and denaturation at 94 °C for 15 s. Fluorescence was measured at the end of the elongation step at 72 °C. The sequences of the gene-specific primers (Carl Roth, Karlsruhe, Germany) used in this study are listed in Table . Relative gene expression was calculated using the crossing point of each target gene, using the β-actin gene as the reference. RT-PCR specificity was verified by melt-curve analysis.
Table 2. Primer sequence, product size, and annealing temperature.
Statistical analyses
Data are expressed as mean ± SEM (n = 6). In Experiments 1 and 2, two-way analysis of variance (ANOVA; StatView Version 4.5; Abacus ConceptSBerkeley, CA) was used to test the significance of the effects of dietary carbohydrate and betaine and their interaction. When the interaction effect is significant, individual comparison was made by Tukey’s multiple range test, using the Super ANOVA statistical software package (Abacus Concepts). In Experiment 3, the data were subjected to one-way analysis of variance (ANOVA), followed by Tukey’s multiple range test to determine the statistical significance of the difference between groups. Differences were considered to be significant at p < 0.05.
Results
Experiment 1
Body weight gain, liver weight, liver cholesterol concentration, and plasma TG concentration were not affected by diets (Data not shown). The concentrations of lipids and TG in the liver and food intake were significantly higher in rats fed a C-based diet compared with rats fed an SB-based diet (Table ). The concentrations of SAM and SAH in the liver and plasma cholesterol were significantly lower in rats fed the SB-based diet compared with the C-based diet and were significantly higher in rats fed a diet with betaine compared with a diet without betaine. The SAM/SAH ratio was not affected by protein source in the diet, but was significantly higher in rats fed a diet with betaine compared with a diet without betaine. Plasma Hcy concentration was significantly lower in rats fed the SB-based diet compared with rats fed the C-based diet, and betaine significantly decreased plasma Hcy concentration in rats fed the SB-based diet and the C-based diet. Fecal excretion of bile acids was significantly higher in rats fed the SB-based diet compared with rats fed the C-based diet, but was not affected by betaine feeding.
Table 3. Effects of dietary protein source and betaine on body weight gain, food intake, liver weight, liver lipids, liver S-adenosylmethionine (SAM), S-adenosyl-L-homocysteine (SAH), SAM/SAH ratio, plasma lipids, plasma homocysteine, and fecal excretion (Experiment 1)Table Footnote*.
The mRNA expressions of MTP, CBS, MS, and SAH hydrolase in the liver were not affected by diets (Data not shown). The mRNA expressions of CYP7A1 in the liver were significantly higher in rats fed the SB-based diet compared with rats fed the C-based diet (Table ). The mRNA expressions of LDL-receptor and BHMT in the liver were significantly increased by betaine feeding. The mRNA expressions of HMG-CoA reductase tended to increase in rats fed the SB-based diet compared with rats fed the C-based diet.
Table 4. Effects of dietary protein source and betaine on hepatic gene expression (Experiment 1)Table Footnote*.
Experiment 2
Body weight gain, food intake, and the concentrations of plasma TG and liver cholesterol were not affected by diets (Data not shown). Liver weight was increased by betaine feeding (Table ). The concentrations of lipids and TG in the liver were significantly higher in rats fed the C-based diet compared with rats fed the SPI-based diet. The concentrations of SAM and SAH in the liver were significantly lower in rats fed the SPI-based diet compared with the C-based diet and were increased by betaine feeding. The SAM/SAH ratio in rats fed the C-based diet was not affected by betaine feeding, but that in rats fed the SPI-based diet was significantly increased by betaine feeding. Plasma cholesterol concentration was significantly increased by betaine feeding. Fecal excretion of bile acids was significantly higher in rats fed the SPI-based diet compared with rats fed the C-based diet and was not affected by betaine feeding.
Table 5. Effects of dietary protein source and betaine on body weight gain, food intake, liver weight, liver lipids, liver S-adenosylmethionine (SAM), S-adenosyl-L-homocysteine (SAH), SAM/SAH ratio, plasma lipids, plasma homocysteine, and fecal excretion (Experiment 2)Table Footnote*.
The mRNA expressions of CYP7A1, LDL-receptor, and MTP in the liver were not affected by diets (Data not shown). The mRNA expressions of HMG-CoA reductase, BHMT, CBS, MS, and SAH hydrolase in the liver were significantly decreased by betaine feeding (Table ).
Table 6. Effects of dietary protein source and betaine on hepatic gene expression (Experiment 2)Table Footnote*.
Experiment 3
Food intake was significantly lower in rats fed the SPI/B(+)/SF and SPI/B(+)/SL/SF diets compared with the SPI/B(+) diet, but body weight gain was not affected by diet (Table ). Liver weight and concentrations of total lipids, TG and cholesterol in the liver were not affected by diet. The concentration of SAH in the liver was significantly lower in rats fed the SPI/B(+)/SF diet compared with the SPI/B(+), SPI/B(+)/SL, and SPI/B(+)/SL/SF diets; the SAM/SAH ratio in the liver was not affected by diet. The concentration of plasma Hcy was not affected by diet. The concentration of plasma cholesterol was significantly lower in rats fed the SPI/B(+)/SL/SF diet compared with the SPI/B(+) and SPI/B(+)/SL diet. Fecal excretion of bile acids was significantly increased in rats fed the SPI/B(+)/SF and SPI/B(+)/SL/SF diets compared with the SPI/B(+) and SPI/B(+)/SL diets.
Table 7. Effects of addition of soy lecithin, soy fiber on body weight gain, food intake, liver weight, liver lipids, liver S-adenosylmethionine (SAM), S-adenosyl-L-homocysteine (SAH), SAM/SAH ratio, plasma lipids, plasma homocysteine, and fecal excretion in rats fed diet containing soy protein isolate as protein source with betaine (Experiment 3)Table Footnote*
The mRNA expressions of LDL-receptor, HMG-CoA reductase, MTP, CBS, MS, and SAH in the liver were not affected by diets (Data not shown). The mRNA expression of CYP7A1 in the liver was significantly higher in rats fed the SPI/B(+)/SF and SPI/B(+)/SL/BF diets compared with the SPI/B(+) and SPI/B(+)/SL diets (Table ). The mRNA expression of BHMT in the liver was significantly higher in rats fed the SPI/B(+)/SL/SF diet compared with the SPI/B(+) diet, however that was not significantly changed between rats fed the SPI/B(+)/SL, SPI/B(+)/BF, and SPI/B(+)/SL/SF diets.
Table 8. Effects of addition of soy lecithin (SL) and soy fiber (SF) on hepatic gene expression in rats fed the diet containing soy protein isolate with betaine (Experiment 3)Table Footnote*.
Discussion
Hcy metabolism in mammals is intimately linked with the metabolism of methyl groups, methionine, and methyl donor availability [Citation20]. High levels of methionine in the diet increase plasma Hcy concentration in rats [Citation21–23]. Methionine is the sole precursor of Hcy and is needed to synthesize plasma Hcy [Citation24–26]. The methionine contents in the SB-based diet (2 g/kg diet) and the SPI-based diet (2 g/kg diet) were less than half that in the C-based diet (5 g/kg diet), suggesting that the decreased plasma Hcy concentrations in rats fed the BS-based diet and the SPI-based diet depend on a low methionine content in the diet.
Betaine supplementation lowered plasma total Hcy concentration [Citation3,4]. In the present study, betaine supplementation decreased plasma Hcy concentration. The effect of betaine was obvious in rats fed the SB- and SPI-based diets compared with the C-based diet, as they amplified the hypohomocysteinemic effect of betaine. Hcy has three alternative metabolic fates: it can be re-methylated to form methionine, it can be condensed with serine to form cystathionine via a reaction catalyzed by CBS, or it can revert back to SAH via reversal of a reaction catalyzed by SAH hydrolase [Citation27]. Increased Hcy in serum is associated with an increase in SAH and a decrease in the SAM/SAH ratio [Citation28]. In Experiments 1 and 2, plasma SAH concentration was increased by betaine feeding; however, the SAM/SAH ratio was also significantly increased. Efficient removal of Hcy will lead to an increase in SAH [Citation29]. BHMT catalyzes resynthesis of methionine using Hcy and the methyl donor betaine. BHMT is one of only three metabolic enzymes that utilize Hcy. The BHMT-/- mouse, with a loss of BHMT function, resulted in a sixfold increase in hepatic and an eightfold increase in plasma Hcy concentrations, suggesting the importance of BHMT in Hcy removal [Citation30]. In Experiments 1 and 2, mRNA expression of BHMT was increased by betaine feeding. Therefore, decreased plasma Hcy concentrations due to betaine feeding might mainly depend on increased BHMT.
In the rats fed a diet without betaine, plasma cholesterol concentration was significantly lower in rats fed the SB-based and SPI-based diets compared with the C-based diet. The alterations in plasma cholesterol concentration could be mediated by differences in the amino acid patterns of the dietary proteins. Methionine is one of the amino acids that could contribute to this phenomenon [Citation22]. Methionine has been shown to increase plasma cholesterol concentration in animals; however, plasma cholesterol levels were also significantly enhanced by the dietary addition of methyl compounds, such as choline and betaine [Citation31,32]. Plasma total cholesterol concentration was increased by betaine feeding, as shown in Experiments 1 and 2. In Experiments 1 and 2, intake of methionine and betaine during the experimental period was almost the same in rats fed the diet with betaine. However, plasma total cholesterol concentration in rats fed the SB-based diet was lower than that in rats fed the C-based diet. Therefore, dietary factor(s) other than methionine and betaine might participate in the plasma total cholesterol-lowering effect of SB.
In Experiments 1 and 2, some mRNA expression level containing HMG-CoA reductase in rats fed the C/B(-) and C/B(+) diets did not show the same tendency. Though the details are unclear, this contradiction might be due to the measurement at a certain point in time in which mRNA expression levels of individual enzymes interact with each other complicatedly.
Soybean (SB) contains the some nonprotein components to decrease the concentration of plasma cholesterol, such as dietary fiber [Citation33,34], lecithin [Citation35,36], saponin [Citation37,38] phytosterol [Citation39,40], and isoflavones [Citation41,42]. In Experiment 3, plasma cholesterol concentration was significantly lower in rats fed the SPI/B(+)/SL/SF diet compared with the SPI/B(+) and SPI/B(+)/SL diet, but it was not significantly different to the SPI/B(+)/SF diet. Fecal excretions of bile acids in rats fed the diets with SF [SPI/B(+)/SF and SPI/B(+)/SL/SF diets] were greater when compared with rats fed the diets without SF [SPI/B(+) and SPI/B(+)/SL diets]. In addition, mRNA expression of CYP7A1 in rats fed the diets with SF [SPI/B(+)/SF and SPI/B(+)/SL/SF diets] was significantly higher than those in rats fed the diets without SF [SPI/B(+) and SPI/B(+)/SL diets]. Dietary fiber can bind bile acid. These suggest that SF reduced the reabsorption of bile acids in the ileum. On the other hand, several studies have indicated that lecithin has hypocholesterolemic properties [Citation35,36]. Dietary soybean lecithin stimulated bile formation by increasing the activity of CYP7A1 [Citation36]. However, fecal excretion of bile acids and hepatic mRNA expression of CYP7A1 were not increased by feeding the SPI/B(+)/SL diet compared with the SPI/B(+) diet. Moreover, the concentration of plasma cholesterol was not decreased by feeding the SPI/B(+)/SL diet compared with the SPI/B(+) diet. Therefore, plasma cholesterol concentration was influenced by SF rather than SL. The major effect of SF on plasma cholesterol concentration would associate with bile acid binding, leading to increased fecal excretion of bile acid [Citation43,44].
In conclusion, in rats fed a C-based diet, betaine decreased the concentration of plasma Hcy, but increased the concentration of plasma cholesterol. The effect of betaine on plasma Hcy concentration was amplified in rats fed the SB-based and SPI-based diets. Soybean prevented the increase in plasma cholesterol concentration by betaine, but SPI did not. In rats fed the SPI-based diet, the increased plasma cholesterol concentration by betaine feeding was not decreased by adding SL or SF, but that was significantly decreased by adding a combination of SL and SF. The effect was associated with increased fecal excretion of bile acids.
Author contributions
All members conceived and designed the experiments and discussed the results for the completion of the manuscript. R. Shimada and K. Ebihara performed the experiments and analyzed the data and wrote the manuscript in consultation with R. Shimada and K. Ebihara.
Disclosure statement
No potential conflict of interest was reported by the authors.
Funding
This work was supported by a grant from the program Cooperation of Innovative Technology and Advanced Research in the Evolution Area (CITY AREA, Development Stage) of the Ministry of Education, Culture, Sports, Science, and Technology of Japan; the Tokachi Foundation [grant number J13004].
References
- Škovierová H, Vidomanová E, Mahmood S, et al. The molecular and cellular effect of homocysteine metabolism imbalance on human health. Int J Mol Sci. 2016;17. DOI:10.3390/ijms1701733
- McCully KS. Vascular pathology of homocysteine: implications for pathogenesis of arteriosclerosis. Am J Pathol. 1696;56:111–128.
- Steenge GR, Verhoef P, Katan MB. Betaine supplementation lowers plasma homocysteine in healthy men and women. J Nutr. 2003;133:1291–1295.
- Atkinson W, Elmslie J, Lever M, et al. Dietary and supplementary betaine: acute effects on plasma betaine and homocysteine concentrations under standard and postmethionine load conditions in healthy male subjects. Am J Clin Nutr. 2008;87:577–585.
- Yagisawa M, Shigematsu N, Nakata R. Effects of chronic betaine ingestion on methionine-loading induced plasma homocysteine elevation in rats. J Nutr Sci Vitaminol (Tokyo). 2006;52:194–199.10.3177/jnsv.52.194
- Slow S, Lever M, Lee MB, et al. Betaine analogues alter homocysteine metabolism in rats. Int J Biochem Cell Biol. 2004;36:870–880.10.1016/j.biocel.2003.10.001
- Olthof MR, Vliet TV, Verhoef P, et al. Effect of homocysteine-lowering nutrients on blood lipids: results from four randomised, placebo-controlled studies in healthy humans. PLoS Med. 2005;2:e135.10.1371/journal.pmed.0020135
- Sparks JD, Collins HL, Chirieac DV, et al. Hepatic very-low-density lipoprotein and apolipoprotein B production are increased following in vivo induction of betaine–homocysteine S-methyltransferase. Biochem J. 2006;395:363–371.10.1042/BJ20051966
- Hayes KC, Pronczuk A, Cook MW, et al. Betaine in sub-acute and sub-chronic rat studies. Food Chem Toxicol. 2003;41:1685–1700.10.1016/S0278-6915(03)00196-0
- Miller L, Houghton JA. The micro-Kjeldahl determination of the nitrogen content of amino-acids and proteins. J Biol Chem. 1945;159:373–380.
- Fiske CH, Subbarow Y. The colorimetrie determination of phosphorus. J Biol Chem. 1925;66:375–381.
- Hasegawa T, Kuroda M. Automated amino acids determination. Med Technol. 1990;18:121–127.
- Reeves PG, Nielsen FH, Fahey GC. AIN-93 purified diets for laboratory rodents: final report of the American Institute of the Nutrition Ad Hoc writing committee on the reformulation of AIN-76A rodent diet. J Nutr. 1993;123:1939–1951.
- Araki A, Sako Y. Determination of free homocysteine in human plasma by high-performance liquid chromatography with fluorescence detection. J Chromatogr. 1997;442:43–52.
- Folch J, Less M, Sloane-Stanley GH. A simple method for the isolation and purification of total lipids from animal tissue. J Biol Chem. 1957;226:497–509.
- Ebihara K, Shiraishi R, Okuma K. Hydroxypropyl-modified potato starch increases fecal bile acid excretion in rats. J Nutr. 1998;128:848–854.
- Cook RJ, Horne DW, Wagner C. Effect of dietary methyl group deficiency on one-carbon metabolism in rats. J Nutr. 1989;119:612–617.
- Sheltawy MJ, Losowsky MS. Determination of faecal bile acids by an enzymic method. Clin Chem Acta. 1975;64:127–132.10.1016/0009-8981(75)90194-1
- Chomczynski P, Sacchi N. Single-step method of RNA isolation by acid guanidinium thiocyanate–phenol–chloroform extraction. Anal Biochem. 1987;162:156–159.10.1016/0003-2697(87)90021-2
- Park EI, Garrow TA. Interaction between dietary methionine and methyl donor intake on rat liver betaine-homocysteine methyltransferase gene expression and organization of the human gene. J Biol Chem. 1999;274:7816–7824.10.1074/jbc.274.12.7816
- Hirche F, Schröder A, Knoth B, et al. Methionine-induced elevation of plasma homocysteine concentration is associated with an increase of plasma cholesterol in adult rats. Ann Nutr Metab. 2006;50:139–146.10.1159/000090635
- Hirche F, Schröder A, Knoth B, et al. Effect of dietary methionine on plasma and liver cholesterol concentrations in rats and expression of hepatic genes involved in cholesterol metabolism. Br J Nutr. 2006;95:879–888.10.1079/BJN20061729
- Okawa H, Morita T, Sugiyama K. Increased plasma homocysteine concentration in rats from a low casein diet. Biosci Biotechnol Biochem. 2006;70:3050–3053.10.1271/bbb.60374
- Fortin L-J, Genest J. Measurement of homocyst(e)ine in the prediction of arteriosclerosis. Clin Biochem. 1995;28:155–162.10.1016/0009-9120(94)00073-5
- Hankey GJ, Eikelboom JW. Homocysteine and vascular disease. Lancet. 1999;354:407–413.10.1016/S0140-6736(98)11058-9
- Guba SC, Fink LM, Fonseca V. Hyperhomocysteinemia: an emerging and important risk factor for thromboembolic and cardiovascular disease. Am J Clin Pathol. 1996;106:709–722.10.1093/ajcp/106.6.709
- Finkelstein JD, Martin JJ. Methionine metabolism in mammals: adaptation to methionine excess. J Biol Chem. 1986;261:1582–1587.
- Melnyk S, Pogribna M, Pogribny IP, et al. Measurement of plasma and intracellular S-adenosylmethionine and S-adenosylhomocysteine utilizing coulometric electrochemical detection: alterations with plasma homocysteine and pyridoxal 5′-hosphate concentrations. Clin Chem. 2000;46:265–272.
- Hoffman DR, Marion DW, Cornatzer WE, et al. S-Adenosylmethionine and S-adenosylhomocystein metabolism in isolated rat liver. Effects of L- methionine, L-homocystein, and adenosine. J Biol Chem. 1980;255:10822–10827.
- Teng Y-W, Mehedint MG, Garrow TA, et al. Deletion of betaine-homocysteine S-methyltransferase in mice perturbs choline and 1-carbon metabolism, resulting in fatty liver and hepatocellular carcinomas. J Biol Chem. 2011;286:36258–36267.10.1074/jbc.M111.265348
- Sugiyama K, Akai H, Muramatsu K. Effects of methionine and related compounds on plasma cholesterol level in rats fed a high cholesterol diet. J Nutr Sci Vitaminol. 1986;32:537–549.10.3177/jnsv.32.537
- Schwab U, Törrönen A, Toppinen L, et al. Betaine supplementation decreases plasma homocysteine concentrations but does not affect body weight, body composition, or resting energy expenditure in human subjects. Am J Clin Nutr. 2002;76:961–967.
- Lo GS, Goldberg AP, Lim A, et al. Soy fiber improves lipid and carbohydrate metabolism in primary hyperlipidemic subjects. Atherosclerosis. 1986;62:239–248.10.1016/0021-9150(86)90098-5
- Shoery RA, Day PJ, Willis RA, et al. Effects of soybean polysaccharide on plasma lipids. J Am Diet Assoc. 1985;85:1461–1465.
- Wilson TA, Meservey CM, Nicolosi RJ. Soy lecithin reduces plasma lipoprotein cholesterol and early atherogenesis in hypercholesterolemic monkeys and hamsters: beyond linoleate. Atherosclerosis. 1998;140:147–153.10.1016/S0021-9150(98)00132-4
- LeBlanc M-J, Brunet S, Bouchard G, et al. Effects of dietary soybean lecithin on plasma lipid transport and hepatic cholesterol metabolism in rats. J Nutr Biochem. 2003;14:40–48.10.1016/S0955-2863(02)00253-X
- Lee S-O, Simons AL, Murphy PA, et al. Soyasaponins lowered plasma cholesterol and increased fecal bile acids in female golden syrian hamsters. Exp Biol Med. 2005;230:472–478.10.1177/153537020523000705
- Fukui K, Tachibana N, Wanezaki S, et al. Isoflavone-free soy protein prepared by column chromatography reduces plasma cholesterol in rats. J Agric Food Chem. 2002;50:5717–5721.10.1021/jf025642f
- Nguyen TT. The cholesterol lowering action of plant stanol esters. J Nutr. 2000;129:2109–2112.
- Matvienko OA, Lewis DS, Swanson M, et al. A single daily dose of soybean phytosterols in ground beef decreases serum total cholesterol and LDL cholesterol in young, mildly hypercholesterolemic men. Am J Clin Nutr. 2002;76:57–64.
- Kirk EA, Sutherland P, Wang SA, et al. Dietary isoflavones reduce plasma cholesterol and atherosclerosis in C57BL/6 mice but not LDL receptor-deficient mice. J Nutr. 1998;128:954–959.
- Wangen KE, Duncan AM, Xu X, et al. Soy isoflavones improve plasma lipids in normocholesterolemic and mildly hypercholesterolemic postmenopausal women. Am J Clin Nutr. 2001;73:225–231.
- Tsai AC, Mott EL, Owen GM, et al. Effects of soy polysaccharide on gastrointestinal functions, nutrient balance, steroid excretions, glucose tolerance, serum lipids, and other parameters in humans. Am J Clin Nutr. 1983;38:504–511.
- Anderson JW, Major AW. Pulses and lipaemia, short- and long-term effect: potential in the potential in the prevention of cardiovascular disease. Br J Nutr. 2002;88:263–271.10.1079/BJN2002716