
Abstract
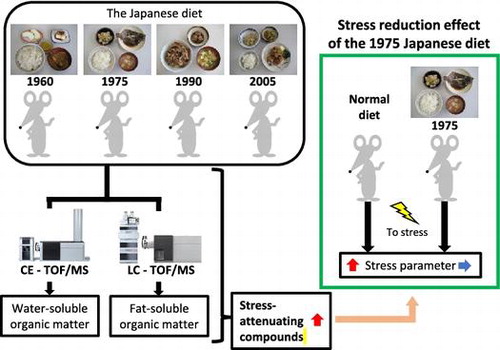
We aimed to find new physiological effects of the Japanese diet. First, to determine the key components in serum from mice fed the 1975 diet, serum from mice fed the 1960, 1975, 1990 or 2005 Japanese diet was analyzed using CE-TOFMS and LC-TOFMS. Based on these results, the key components were determined by principal component analysis. Among the identified compounds, GABA was included. Therefore, a stress reduction effect was inferred as a novel physiological effect of this diet. Next, we tested whether the 1975 diet had an actual stress reduction effect in mice. Mice were given the 1975 diet or a control diet for 4 weeks, after which they were divided into restraint stress and non-stress groups. Mice fed the 1975 diet had significantly decreased stress parameters compared with those fed the control diet. These results provide the first evidence that the 1975 Japanese diet has a stress reduction effect.
In the current study, we aimed to find new physiological effects of the Japanese diet. As a result, we found that the 1975.
In the 1980s, Japan was viewed as a healthy country with life expectancy among the highest worldwide [Citation1]. The influence of the Japanese diet was one of the factors explaining this high life expectancy. The Japanese diet is diverse and high in rice and traditional food such as fish, vegetables, and soy, as well as meat, milk, oils, and fruits [Citation1–3]. In addition, lipid and protein contents differ from those of Western diets because of high consumption of fresh seafood. However, the studies on the health impact of the Japanese diet are not reported too much.
In our previous study, modern Japanese and American diets were prepared, freeze-dried, powdered, and fed to male rats for three weeks [Citation1]. The results showed that lipid and peroxide levels in the liver and plasma were lower with the Japanese diet. DNA microarray analysis of gene expression in the liver, energy, glucose, and lipid metabolism-related genes were expressed at higher levels in rats fed the Japanese diet. These findings suggest that the Japanese diet stimulates metabolism and is less likely to cause obesity compared with the American diet.
The contents of the Japanese diet have been greatly altered by Western influence in the last 50 years [Citation2]. In comparisons of representative freeze-dried and powdered Japanese diets from 1960, 1975, 1990 and 2005 (based on National Health and Nutrition Research (NHNR) data) fed to mice [Citation3], we found that the 1975 diet most strongly suppressed visceral fat accumulation and had the greatest health benefits. The 1975 diet also reduced the risk of diabetes, fatty liver and dementia, and also lengthened the lifespan [Citation4]. However, despite the clear benefits of the 1975 diet, the underlying physiological effects have yet to be found.
In this study, we attempted to find new physiological effects of the 1975 Japanese diet using metabolome analysis. First, to determine the key components in serum from mice fed the 1975 diet, serum from mice fed the 1960, 1975, 1990 or 2005 Japanese diet was analyzed using capillary electrophoresis time-of-flight mass spectrometry (CE-TOFMS) and liquid chromatography time-of-flight MS (LC-TOFMS). Based on these results, the key components in serum from mice fed the 1975 Japanese diet were determined by principal component analysis (PCA), and a stress reduction effect was inferred as a novel physiological effect of the 1975 diet. Subsequent experiments showed that the 1975 Japanese diet does have an actual stress reduction effect in mice.
Materials and Methods
Preparation of Japanese diets
Japanese diets from 1960, 1975, 1990, and 2005 based on NHNR data were replicated and cooked (Supplemental Tables 1 and 2) [Citation3,4]. The diets were freeze-dried and powdered using a vacuum freeze drier (Eyela, FD-550P, Tokyo Rikakikai Co., Tokyo, Japan), and then stirred and homogenized. Diets prepared in this way were fed to mice. The protein, lipid, carbohydrate, moisture, and ash components of each test diet were analyzed by combustion, acid digestion, atmospheric heating-drying, and direct ashing, respectively, and carbohydrate was determined as the difference between the total weight and the weight of the other components. The energy of each sample was calculated using Atwater’s energy conversion factors (protein, 4 kcal/g; lipid, 9 kcal/g; carbohydrate, 4 kcal/g) (Supplemental Table 3) [Citation3,4].
Animals
All animal procedures were performed in accordance with the Animal Experiment Guidelines of Tohoku University, and the animal protocol was approved by the Animal Use Committee at Tohoku University (2016AgA-009) [Citation5]. Male ICR mice (four weeks old) were obtained from Clea Japan (Tokyo, Japan). The mice had access to their respective diet and distilled water ad libitum in a temperature- and humidity-controlled room with a 12/12-h light/dark cycle.
Metabolome analysis
After acclimatization to CE-2 powder for one week, 32 mice were randomly divided into four groups (two cages with 4 mice per cage) fed the 1960, 1975, 1990, and 2005 Japanese diets, respectively (1960, 1975, 1990, and 2005 groups) for 4 weeks. There was no significant difference in food intake between four groups. At 9 weeks of age, the mice were weighed and blood samples were collected by decapitation at 9 AM after fasting for 12 h. To obtain serum, blood samples were centrifuged (900 × g, 5 °C, 15 min). Serum was stored at −80 °C until use.
Metabolome measurements were performed at Human Metabolome Technologies Inc. (HMT, Tsuruoka, Japan). Ionic and lipophilic low molecular weight compounds in serum were analyzed using CE-TOFMS and LC-TOFMS, respectively. Serum from the 1960, 1975, 1990, and 2005 groups was pooled in equal volume from each mouse and preprocessed for CE-TOFMS analysis [Citation6,7]. Approximately 30 μL of pooled serum was dissolved in 500 μL of methanol containing 50 μM internal standard (H3304-1002, HMT) at 0 °C to inactivate enzymes. The sample was plunged and stirred into 500 μL of chloroform and 200 μL of Milli-Q water, and then centrifuged at 2300 × g at 4 °C for 5 min. Subsequently, 200 μL of aqueous layer was filtered centrifugally through a 5 kDa cutoff filter (Ultrafree MC PLHCC, HMT) at 9100 × g at 4 °C for 120 min. The filtrate was desiccated and resuspended in 50 μL of Milli-Q water for CE-MS analysis.
CE-TOFMS was carried out using a CE system equipped with a 6210 TOF mass spectrometer, 1100 isocratic HPLC pump, G1603A CE-MS adapter kit, and G1607A CE-ESI-MS sprayer kit (all from Agilent Technologies, Waldbronn, Germany). The system was controlled by G2201AA ChemStation software ver. B.03.01 for CE. Metabolites were analyzed using a fused silica capillary (50 μm i.d. × 80 cm length) with a commercial electrophoresis buffer (Solution ID: H3301-1001 for cation analysis and H3302-1021 for anion analysis; HMT) as the electrolyte. The sample was injected at a pressure of 50 mbar for 10 s (~10 nL), CE voltage of 27 kV, and capillary voltage of 4000 V in cation analysis, and at 50 mbar for 25 s (~25 nL), CE voltage of 30 kV, and capillary voltage of 3500 V in anion analysis. The spectrum was scanned from m/z 50 to 1000. Other conditions were as described previously [Citation6,7].
Serum were preprocessed for LC-TOFMS analysis [Citation7,8]. Approximately 50 μL of pooled serum was plunged into 500 μL of 1% formic acid/acetonitrile containing 20 μM internal standard solution (Solution ID: H3304–1002; HMT) at 0 °C to inactivate enzymes. Samples were homogenized after adding 167 μL of Milli-Q water and then centrifuged at 2300 × g at 4 °C for 5 min. After the supernatant was collected, 500 μL of 1% formic acid/acetonitrile and 167 μL of Milli-Q water were added to the precipitate. Homogenization and centrifugation at 9100 × g at 4 °C for 120 min were performed and the supernatant was mixed with previously collected supernatant. The mixture (350 μL) was filtrated through a 3 kDa cutoff filter (Nanosep 3 K Omega, Pall Corp., Ann Arbor, MI, USA) to remove proteins and through a Hybrid SPE phospholipid 55261-U filter (Supelco, Bellefonte, PA, USA) to remove phospholipids. The filtrate was desiccated and then dissolved in 300 μL of 50% isopropanol/Milli-Q water for LC-MS analysis.
LC-TOFMS was carried out using an Agilent 1200 series RRLC system SL equipped with a 6230 TOF mass spectrometer. The system was controlled by G2201AA ChemStation software ver. B.03.01 for CE. Compounds were separated using an ODS column (i.d. 2.0 × 50 mm, 2 μm) [Citation7,8], eluted with a binary gradient of solvent A (water containing 0.1% formic acid) and solvent B (isopropanol : acetonitrile : water (65: 30: 5) containing 0.1% formic acid and 2 mM ammonium formate). The gradient profile was as follows: 0 to 0.5 min, 1% B; 0.5 to 13.5 min, 1 to 100% B linear; 13.5 to 20 min, 100% B. The flow rate was 0.3 mL/min and the column temperature was 40 °C. In electrospray positive and negative ion analysis, the nebulizer pressure was 40 psi, dry gas flow was 10 L/min, dry gas temperature was 350 °C, and capillary voltage was 4000 V. The spectrum was scanned from m/z 100 to 1700.
The peaks detected by each MS were automatically extracted peaks with a signal / noise (S / N) ratio of 3 or more using automatic integration software (MasterHands ver.2.16.0.15, Keio University), and m/z, peak area and migration time (CE-TOFMS) or retention time (LC-TOFMS) were obtained. The peak area thus obtained was corrected with an internal standard material and converted to a relative area value. In addition, the detected peaks were collated with all the substances registered in the HMT metabolite library (HMT) based on the values of m/z and migration time or retention time, and retrieval was performed.
Principal component analysis
Principal component analysis (PCA) is a method of reducing the dimension of multidimensional data, abstracting the entire data, displaying it in a visually plain plot, and interpreting it. The results of MS analysis of serum in mice fed the Japanese diets were evaluated using PCA in statistical software SampleStat ver.3.14 (HMT). The principal component score, contribution rate, and factor loading were determined in this analysis.
Stress protocol
After acclimatization to CE-2 powder (Table ) for one week, 48 mice at 5 weeks of age were randomly divided into four groups (two cages with 6 mice per cage): mice fed the control diet (CE-2 powder) and housed under ordinary conditions (CO group, n = 12) or subjected to restraint stress (CO+ group, n = 12), and mice fed the 1975 Japanese diet (Table ) and housed under ordinary conditions (75 group, n = 12) or subjected to restraint stress (75+ group, n = 12). At 9 weeks of age, the CO+ and 75+ groups were subjected to restraint stress, as described previously [Citation9]. In brief, each mouse was restrained individually by placing it in a 50 mL plastic tubes with holes (0.4 cm diameter) for respiration for 24 h, while the CO and 75 groups were fasted for 24 h. Then, the mice were weighed and blood samples were collected by decapitation. To obtain serum, blood samples were centrifuged (900 × g, 5 °C, 15 min). Serum was stored at -80 °C until use.
Table 1. Nutritional compositions of the control diet and the 1975 Japanese diet.
Serum biochemical analysis
Biochemical analyses of serum samples were performed as described previously [Citation10,11]. The serum corticosterone level, a measure of stress, was determined using an ELISA kit (Yanaihara, Fujinomiya, Japan); serum glucose was measured using commercial enzyme kits (Wako Pure Chemical, Osaka, Japan); serum insulin was determined by ELISA (Morinaga Institute of Biological Science, Kanagawa, Japan); and serum gamma-aminobutyric acid (GABA) was determined by ELISA (ImmuSmol SAS, Pessac, France).
Statistical analysis
Results are expressed as mean ± SE. The significance of the effects of the Japanese diet intake and restraint stress, and their interaction, was tested using two-way ANOVA. When a significant difference (p < 0.05) was found, individual comparisons were made by Tukey test. Differences were considered significant at p < 0.05.
Results
Metabolome analysis
Ionic and lipophilic low molecular weight compounds in serum from the 1960, 1975, 1990 and 2005 groups were analyzed by CE-TOFMS and LC-TOFMS. In these respective analyses, 163 of about 900 measurable ionic compounds, and 79 of about 300 measurable lipophilic compounds were detected. The results of the two MS analyses (Relative area of each compound) are shown in Supplemental Table 4. These data were subjected to PCA.
Principal component analysis
PCA of the MS results showed that the components in serum from diets of different years differed considerably because each sample appeared in separate quadrants (Figure (a)). Principal components (PC) 1 and 2 accounted for 77% of all dietary components. In PC 1, components with high or low values in more recent diets were identified, and 45% of all components showed this trend. The loading plot of the PCA chart (Figure (b), Supplemental Figure , Supplemental Table 5) shows PC 1 and 2 for individual components in serum of the 1960, 1975, 1990, and 2005 groups. The measured components were biased to the right and left side of the graph, and the first PC was one of many components that increased or decreased from year to year.
Figure 1. Principal component analysis charts: score plot (a) and loading plot (b). (a) Principle components 1 and 2 for components in serum of the 1960, 1975, 1990, and 2005 groups. (b) Principle components 1 and 2 for individual components in serum of the 1960, 1975, 1990, and 2005 groups. Compounds with values of PC2 greater than 0.1 were shown compound names. Details of these compounds were shown in Table .
In PC 2, components with high or low values in serum of the 1975 group were identified, and 31% of all components showed this trend. The components in PC 2 were of most interest because the 1975 diet has been found to have high health benefits in previous studies. In Figure (b), since there is a slight bias on the higher side of the graph, we focused on compounds that had a PC 2 value of 0.1 or more (components with the highest concentration in the 1975 diet). In PC 2, the components with especially high values in the 1975 diet and low values in other diets were 2-aminoadipic acid, GABA, 2′-deoxycytidine, mucic acid, asymmetric dimethylarginine (ADMA), 15-(S)-hydroxyeicosatetraenoic acid (15(S)-HETE), N,N-dimethylglycine, S-methylmethionine, and linoleic acid (Table ). 2-Aminoadipic acid and GABA are neurotransmitters, and GABA has particularly beneficial physiological effects, including stress reduction. We next examined whether the 1975 Japanese diet has a stress reduction effect in mice.
Table 2. List of compounds whose PC2 value is greater than 0.1 (In PC 2, the components with especially high values in 1975 and low values in other diets).
Growth parameters
To examine whether the 1975 Japanese diet has a stress reduction effect, mice at 5 weeks of age were randomly divided into four groups: Mice fed the control diet and housed under ordinary conditions (CO group) or subjected to restraint stress (CO+ group), and mice fed the 1975 Japanese diet and housed under ordinary conditions (75 group) or subjected to restraint stress (75+ group). At 9 weeks of age, the CO+ and 75+ groups were subjected to restraint stress. The effects of the1975 Japanese diet on growth parameters are shown in Table . There were no significant differences in final body weights among the CO, CO+, 75, and 75+ groups. Food and energy intakes were significantly lower in the 75 and 75+ groups compared to the CO and CO+ groups.
Table 3. Body weight, food intake, and energy intake in mice.
Biochemical parameters in serum
The effects of the1975 Japanese diet and restraint stress on serum corticosterone, glucose, insulin and GABA levels are shown in Figure . Serum corticosterone (Figure (a)) and glucose (Figure (b)) were significantly elevated in mice exposed to restraint stress, confirming that these mice were experiencing stress. Intake of the 1975 diet reduced the elevated corticosterone and glucose levels. There were no significant differences in serum insulin levels among the CO, CO+, 75, and 75+ groups (Figure (c)). Serum GABA (Figure (d)) was significantly elevated in mice exposed to restraint stress, and 1975 diet intake further elevated the GABA level.
Figure 2. Effects of the 1975 Japanese diet and restraint stress on serum parameters in mice. Levels of (a) corticosterone, (b) glucose, (c) insulin, and (d) GABA in serum of mice in the CO (control diet and normal conditions), CO+(control diet and restraint stress), 75 (1975 Japanese diet and normal conditions), 75+(1975 Japanese diet and restraint stress) groups. Values are means ± SE, n = 12. Statistical analysis was performed by two-way ANOVA followed by a Tukey test to identify differences among groups. Test diet effect, stress effect and interaction were described below the graph: Diet, test diet effect (control diet vs. 1975 Japanese diet); Stress, stress effect (stress+ vs. stress−); Interaction, interaction between Diet and Stress. Different superscript letters indicate significantly different means at p < 0.05. ns, no significant difference.
Discussion
The aim of this study was to identify new physiological effects of the 1975 Japanese diet. First, MS and PCA of serum from mice fed the 1960, 1975, 1990 or 2005 Japanese diet were used to identify 2-aminoadipic acid, GABA, 2′-deoxycytidine, mucic acid, ADMA, 15(S)-HETE, N,N-dimethylglycine, S-methylmethionine, and linoleic acid as key components of serum in mice fed the 1975 diet. In the following paragraphs, we discuss the potential health benefits of these compounds.
2-Aminoadipic acid antagonizes neuroexcitatory activity modulated by the glutamate receptor [Citation12] and GABA is the chief inhibitory neurotransmitter in the vertebrate central nervous system. Compounds that increase the amount of available GABA typically have relaxing, anti-anxiety and anti-convulsive effects [Citation13,14]. 2′-Deoxycytidine is a deoxynucleoside that is phosphorylated to deoxycytidine triphosphate for use in DNA synthesis by DNA polymerases or reverse transcriptases; mucic acid is a sugar dicarboxylic acid resulting from oxidation of galactose with dilute nitric acid; and ADMA affects cholesterol metabolism. No beneficial physiological effects of these three compounds have been reported. 15(S)-HETE is produced from arachidonic acid by 15-lipoxygenase, and has anti-inflammatory properties that improve arthritis and lower leukotriene B4 in synovial fluid [Citation15]. N,N-dimethylglycine supplementation improves humoral and cell-mediated immune responses in humans [Citation16], while S-methylmethionine may have protective effects in the gastrointestinal mucosa and liver [Citation17]. Linoleic acid is an unsaturated (omega-6) fatty acid that we have shown to be present at high concentrations in mice fed the 1975 Japanese diet [Citation5], as confirmed in the current study.
Among these components, 2-aminoadipic acid and GABA are neurotransmitters, and GABA has beneficial physiological activities such as stress reduction. This suggests that the 1975 Japanese diet may have a stress reduction effect. Therefore, we investigated this effect of the 1975 diet in mice. Food intake was significantly decreased with the1975 diet, energy intake was not significantly changed, and growth parameters were not affected by restraint stress. Serum corticosterone, an indicator of stress [Citation11,18], and glucose that is known to increase by stress [Citation11] were significantly elevated in mice exposed to restraint stress, confirming that these mice had experienced stress. Intake of the 1975 diet reduced serum corticosterone and glucose, which suggests that this diet reduces stress sensitivity in mice. Serum GABA is associated with stress reduction [Citation13,14] and was significantly elevated in mice exposed to restraint stress, and further elevated by intake of the 1975 diet. It is known that serum GABA increases to relieve stress when stress is applied [Citation13,14]. In this study, serum GABA was significantly elevated in mice exposed to restraint stress, confirming that these mice had experienced stress. It was thought that the reason that serum GABA increases due to stress is a defense mechanism for reducing stress. The possibility that GABA increased with the stress applied by the 1975 diet was denied by the change in serum corticosterone level. Since the increase in serum GABA in mice fed the 1975 diet was seen regardless of the presence or absence of stress, it was thought that metabolism from glutamate (Glu) to GABA was promoted. These findings suggest that the1975 diet increases the serum GABA level and reduces stress. In addition, it was thought that an increase in serum GABA did not directly decrease serum corticosterone, an increase in serum GABA relieved the stress, thereby reduced serum corticosterone.
To determine why serum GABA is high in mice fed the 1975 Japanese diet, we examined the findings in our recent study, in which the characteristic components in the 1975 diet were identified using MS and PCA of Japanese diets from 1960, 1975, 1990 and 2005 [Citation7]. Histidine, naringin, pyridoxamine, catechin, chromium, boron, isoleucine, arachidonic acid, glycitein, stearidonic acid, daidzein, tyramine and leucine were identified as key components of the 1975 diet. Among these components, pyridoxamine may be most likely to raise the serum GABA level in vivo. Pyridoxamine is involved in the biosynthetic pathway of GABA and promotes metabolism of glutamate to GABA [Citation19,20]. Therefore, pyridoxamine in the 1975 Japanese diet may promote biosynthesis of GABA in vivo. In this study, Glu in serum of mice fed the 1975 diet was lower than that of mice fed the 1990 diet (Supplemental Table 4). On the other hand, Glu in the meal showed a high value in the 1975 diet compared to the 1990 diet [Citation7]. These results suggest that the metabolism from Glu to GABA is promoted in mice fed the 1975 diet. In fact, serum GABA showed a high value in mice fed the 1975 diet (Table ).
Serotonin, a neurotransmitter, is known as a component that acts to attenuate stress [Citation21]. In this study, serum serotonin showed a high value in mice fed the 1975 diet (Supplemental Table 4). It was thought that pyridoxamine, which was contained much in the 1975 diet, was involved in the increase in serum serotonin since vitamin B6 is essential for the biosynthesis of serotonin [Citation7,21]. Therefore, it was suggested that serotonin plays a role in stress reduction effect of the 1975 diet in addition to GABA.
It is known that food intake changes with stress [Citation22]. In this study, food intake decreased in mice fed the 1975 diet. Considering with the behavior of other stress parameters, it was thought that the 1975 diet did not stress to mice, and was a satisfactory meal even a small amount. Serotonin is known as a neurotransmitter that increases satisfaction [Citation21]. In this study, serum serotonin showed a high value in mice fed the 1975 diet (Supplemental Table 4). Therefore, it was suggested that the 1975 diet was a satisfactory meal even with a small amount.
Many aging-related disease develop due to inflammation and oxidative stress [Citation23–26]. Our previous studies showed that the 1975 Japanese diet prevents diabetes and fatty liver, aging-related diseases, decreases oxidative stress, delays senescence, and extends lifespan [Citation3,4]. Anti-inflammatory effects of 15(S)-HETE, N,N-dimethylglycine, and S-methylmethionine in vivo may explain these findings. Thus, the metabolome analysis in this study is an effective approach for identifying new physiological effects. However, the number of components that can be measured is still insufficient, and some components are difficult to ionize in the mass spectrometer. These technical limitations should be considered in interpreting the results of this study.
Author contributions
Study concept and design: Tsuyoshi TSUDUKI. Acquisition of data: Yui IWAGAKI, Yasuhisa HURUYA, Miki SATO, Qiming WU, Shuang E, and Kazushi YAMAMOTO. Analysis and interpretation of data: Yui IWAGAKI, Saeko SUGAWARA, Yasuhisa HURUYA, Miki SATO, Qiming WU, Shuang E, Kazushi YAMAMOTO, and Tsuyoshi TSUDUKI. Drafting of the manuscript: Yui IWAGAKI, Yasuhisa HURUYA, and Tsuyoshi TSUDUKI. All authors reviewed and approved the final manuscript.
Disclosure statement
No potential conflict of interest was reported by the authors.
Funding
This work was supported by grants from the Project of the NARO Bio-oriented Technology Research Advancement Institution (Advanced integration research for agriculture and interdisciplinary fields); The Canon Foundation; Integration Research for Agriculture and Interdisciplinary Fields and Integration Development Research for Agriculture and Interdisciplinary Fields, Ministry of Agriculture, Forestry and Fisheries of Japan; The Canon Foundation.
Supplemental data
Supplemental data for this article can be accessed https://doi.org/10.1080/09168451.2017.1417022.
supplemental_table_5.pdf
Download PDF (458.4 KB)supplemental_table_4.pdf
Download PDF (577.2 KB)supplemental_table_1-3.pdf
Download PDF (232.8 KB)Supplemental_Figure_1.pdf
Download PDF (28.8 KB)Related Research Data
References
- Tsuduki T, Takeshika N, Nakamura Y, et al. DNA microarray analysis of rat liver after ingestion of Japanese and American food. J Jpn Soc Nutr Sci. 2008;61:255–264.10.4327/jsnfs.61.255
- Ministry of Agriculture Forestry and Fisheries. Food Supply and Demand Table. (2014). [cited 2015 Mar 31]. Available from: http://www.maff.go.jp/j/tokei/kouhyou/zyukyu/index.html
- Kitano Y, Honma T, Hatakeyama Y, et al. Effects of historical differences in components of the Japanese diet on the risk of obesity in mice. J Jpn Soc Food Sci Technol. 2014;67:73–85.10.4327/jsnfs.67.73
- Yamamoto K, ES, Hatakeyama Y, et al. The Japanese diet from delays senescence and prolongs life span in SAMP8 mice. Nutrition. 1975;2016(32):122–128.
- Sakamoto Y, Yamamoto K, Hatakeyama Y, et al. Effects of fatty acid quality and quantity in the Japanese diet on the suppression of lipid accumulation. J Oleo Sci. 2016;65:61–73.10.5650/jos.ess15150
- Soga T, Ohashi Y, Ueno Y, et al. Quantitative metabolome analysis using capillary electrophoresis mass spectrometry. J Proteome Res. 2003;2:488–494.10.1021/pr034020 m
- Iwagaki Y, Sakamoto Y, Sugawara S, et al. Identification of characteristic components and foodstuffs in healthy Japanese diet and the health effects of a diet with increased use frequency of these foodstuffs. Mol Nutr Food Res. 2017; 61. DOI:10.1002/mnfr.201700430
- Ooga T, Sato H, Nagashima A, et al. Metabolomic anatomy of an animal model revealing homeostatic imbalances in dyslipidaemia. Mol Biosyst. 2011;7:1217–1223.10.1039/c0mb00141d
- Watanabe M, Ayugase J. Chiral separation of catechins in buckwheat groats and the effects of phenolic compounds in mice subjected to restraint stress. J Agric Food Chem. 2009;57:6438–6442.10.1021/jf901281j
- Tsuduki T, Kikuchi I, Kimura T, et al. Intake of mulberry 1-deoxynojirimycin prevents diet-induced obesity through increases in adiponectin in mice. Food Chem. 2013;139:16–23.10.1016/j.foodchem.2013.02.025
- Tsuduki T, Yamamoto K, ES, et al. High dietary fat intake during lactation promotes the development of social stress-induced obesity in the offspring of mice. Nutrients. 2015;7:5916–5932.10.3390/nu7075257
- Wu HQ, Ungerstedt U, Schwarcz R. L-alpha-aminoadipic acid as a regulator of kynurenic acid production in the hippocampus: a microdialysis study in freely moving rats. Eur J Pharmacol. 1995;281:55–61.10.1016/0014-2999(95)00224-9
- Kim HY, Yokozawa T, Nakagawa T, et al. Protective effect of gamma-aminobutyric acid against glycerol-induced acute renal failure in rats. Food Chem Toxicol. 2004;42:2009–2014.10.1016/j.fct.2004.06.021
- Krystal JH, Sanacora G, Blumberg H, et al. Glutamate and GABA systems as targets for novel antidepressant and mood-stabilizing treatments. Mol Psychiatry. 2002;7(Suppl 1):S71–80.10.1038/sj.mp.4001021
- Fogh K, Stender Hansen E, et al. 15-Hydroxy-eicosatetraenoic acid (15-Hete) inhibits carragheenan-induced experimental arthritis and reduces synovial fluid leukotriene B4 (LTB4). Prostaglandins. 1989;37:213–228.10.1016/0090-6980(89)90058-0
- Graber CD, Goust JM, Glassman AD, et al. Immunomodulating properties of dimethylglycine in humans. J Infect Dis. 1981;143:101–105.10.1093/infdis/143.1.101
- Patel AD, Prajapati NK. Review on biochemical importance of vitamin-U. J Chem Pharm Res. 2012;4:209–215.
- Toth M, Mikics E, Tulogdi A, et al. Post-weaning social isolation induces abnormal forms of aggression in conjunction with increased glucocorticoid and autonomic stress responses. Horm Behav. 2011;60:28–36.10.1016/j.yhbeh.2011.02.003
- Hellmann H, Mooney S. Vitamin B6: a molecule for human health? Molecules. 2010;15:442–459.10.3390/molecules15010442
- Combs GF. The vitamins: fundamental aspects in nutrition and health. San Diego (CA): Elsevier; 2008.
- Jonnakuty C, Gragnoli C. What do we know about serotonin? J Cell Physiol. 2008;217:301–306.10.1002/jcp.v217:2
- Torres SJ, Nowson CA. Relationship between stress, eating behavior, and obesity. Nutrition. 2007;23:887–894.10.1016/j.nut.2007.08.008
- Bodamyali T, Stevens CR, Blake DR, et al. Reactive oxygen/nitrgen species and acute inflammation: a physiological process. In: Winyard PG, Blake DR, Evans CH editors. Free radicals and inflammation. Basel: Birkhauser Verlag; 2000. p. 11-16.10.1007/978-3-0348-8482-2
- Chung HY, Kim HJ, Kim JW, et al. The inflammation hypothesis of aging: molecular modulation by calorie restriction. Ann N Y Acad Sci. 2001;928:327–335.
- Yanaka M, Honma T, Sato K, et al. Increased monocytic adhesion by senescence in human umbilical vein endothelial cells. Biosci Biotechnol Biochem. 2011;75:1098–1103.10.1271/bbb.100909
- Shuang E, Kijima R, Honma T, et al. 1-Deoxynojirimycin attenuates high glucose-accelerated senescence in human umbilical vein endothelial cells. Exp Gerontol. 2014;55:63-69.