
ABSTRACT
In 2017 the Office for Standards in Education, Children’s Services and Skills (Ofsted) identified stuck schools that have failed inspections continuously since 2005. Our study used quantitative methods to identify factors associated with improving or remaining stuck by analysing a sample of 580 primary and secondary stuck schools and their matched comparison group. We found that not only geographical location, student population, and deprivation play a part when explaining stuckness, but critically, persistently receiving less than good inspection grades contributed to this through two negative cycles: Schools located in more challenging places or with more disadvantaged pupils received worse inspection grades, which triggered increases in teacher turnover, and further received less than good Ofsted inspection judgements. These findings call for place-based inspections that consider school location and student composition, and recognise the detrimental role that inspections can play when judging school effectiveness, particularly of schools educating the most disadvantaged communities.
Introduction
Schools in England are held accountable for a variety of aspects of their performance, both through Office for Standards in Education, Children’s Services and Skills (Ofsted) inspections and national assessments which inform public performance tables. In the launch of the 2016/2017 annual report (Ofsted, Citation2017), Chief Inspector Amanda Spielman used the term “intractable” to refer to schools that have never been judged good in inspections at any point in the last decade. The terminology later changed to “stuck” but referred to the same conception: primary, secondary, pupil referral units, and special schools that received consistently weak inspection outcomes throughout the last 13 years. Whilst enhanced monitoring of these schools is thought to support their improvement (Munoz-Chereau & Ehren, Citation2021), this is not always the case (Munoz-Chereau et al., Citation2022).
Conversely, some head teachers have claimed that the classification of stuck acts as a barrier rather than levering positive change (Riall, Citation2017). A study by Hutchinson (Citation2016) indicates that the context in which these schools are operating plays a key role in why they are failing. Hutchinson shows that schools with disadvantaged intakes or with a high proportion of pupils with low prior attainment are 5 times more likely to be rated inadequate than those with better intakes, and less than half as likely to be rated outstanding. Greany and Higham (Citation2018) also analysed 10 years of Ofsted inspections and reported an inverse association between Ofsted grades and changes in schools’ student deprivation composition: Whilst schools judged good or outstanding tended to see reductions in the proportion of their students who are eligible for free school meals (an indicator of deprivation), the opposite was true for schools judged as less than good. The socioeconomic context of schools thus matters in their odds of receiving a positive inspection outcome, while the outcome – in turn – may also affect school’s student population, potentially creating a vicious cycle of stuckness. Yet what remains unclear is the relation between schools’ location, their student population composition, performance, and stuckness. This paper seeks to clarify these relations and specifically answer the questions: Do place-based disparities explain persistent underperformance and a low inspection outcome? And how/why?
In the next sections, we will first present an overview of the literature on place-based disparities of school performance and the role of inspection outcomes in stuckness. We will then describe our research methods before we present our findings, conclusions, and discussion.
Conceptual framework
Stuck schools and other deficit terminology
The terms intractable or stuck reflect the wider literature in the field of school effectiveness and school improvement on failing schools, and resonate with deficit labels, such as “underperforming”, “very weak”, and “coasting”. Collinson (Citation2010), for example, refers to complacency to describe stuck schools’ maintenance of the status quo instead of aiming for continuous improvement. Nicolaidou and Ainscow (Citation2005), Collinson (Citation2010), Ko et al. (Citation2012), and Rosenholtz (Citation1989) further distinguish between “moving” and stuck and explain the stuck school’s incapacity to improve by referring to a culture of detachment, resigned pessimism, and paralysis. A lack of leadership and self-examination, narrow perceptions of learning, a culture of dependency and distrust, and an overall high level of frustration amongst staff are also conditions which are often associated in the literature with schools’ stuck/moving status. According to Ofsted (Citation2020), these schools tend to have an inward focus and exercise a minimal reaction to parental pressure or state policies; they are typically chaotic and suffer from change fatigue.
In theory, stuck schools can be on any end of the performance continuum, but the term is most often used to refer exclusively to low-performing schools. Ofsted (Citation2020), for example, uses it for:
a school (including its predecessor if it has converted to become an academy) that has had consistently weak inspection outcomes throughout the last 13 years. This means that it has:
| ◼ | been judged to be inadequate, satisfactory or to require improvement in every inspection it has had between 1 September 2006 and 31 August 2019 | ||||
| ◼ | had at least four full inspections in the period. (pp. 5–6). | ||||
Place-based disparities of schools’ underperformance
Place-based disparities and how socioeconomic conditions and cultural opportunities in the community impact pupil attainment are longstanding issues. At a European level, these disparities are not only profound and persistent but have been widening (Ehrlich & Overman, Citation2020). In England, Ofsted (Citation2020) acknowledges that all stuck schools are operating in very challenging circumstances, in which a mixture of geographical isolation (understood as places that are undesirable to live in), unstable pupil populations, and poor parental motivation appear to be compounding the issues for children. These place-based challenges vary according to geographical location, and the particular socioeconomic and cultural opportunities that are available at the community and area level.
According to the Ofsted (Citation2020) report, some of the worst education is delivered in communities that have been left out of improvements in economic prosperity. These areas are designated by the government as “cold spots”. Young people growing up in these areas have “less chance of achieving good educational outcomes and often end up trapped by a lack of access to further education and employment opportunities” (Social Mobility Commission, Citation2017, p. 2).
Location-based challenges that affect school quality and reproduce inequality have been described by Boterman et al. (Citation2019) for the Global North, Ovenden-Hope and Passy (Citation2019) and Passy and Ovenden-Hope (Citation2016, Citation2020) in England, De la Fuente et al. (Citation2013) in Chile, and Roscigno et al. (Citation2006) in the US. Ovenden-Hope and Passy (Citation2019, p. 6) summarise these location-based challenges and their consequences for school quality in the following three categories:
Geographic remoteness and isolation from other schools and services. Schools would be located in rural and coastal areas where there is limited access to affordable public transport. Hence high cost of travel and long journeys negatively affect teacher recruitment and retention, teachers and their partners’ commuting, and parental/community engagement with the school. Geographical remoteness often translates into school staff having limited availability of school support, restricted access to exemplary practice (e.g., through collaboration with a university, access to conferences, and professional development), or elusive inclusion into externally funded interventions (De la Fuente et al., Citation2013; Roscigno et al., Citation2006).
Socioeconomic disadvantage of a community/neighbourhood and the student population in the school. Local community deprivation goes hand in hand with the absence of large-scale, innovative employers and sound employment prospects, high unemployment, and/or seasonal and poorly paid jobs. This environment in turn influences the expectations of young people, their motivation to work hard at school, the type of career advice they receive, and available role models. Families that have a history of high unemployment tend to perceive less benefit of education in general, which will likely affect the time and money they invest into educating their children (Roscigno et al., Citation2006). Roscigno et al. (Citation2006) and Robinson (Citation2016) also relate deprivation to negative childhood development, low birth weight, behavioural problems, injury, and child abuse, and these all affect school outcomes. High unemployment further affects teacher recruitment as there are limited employment prospects for partners of teachers and school leaders and teachers generally favour areas populated by educated, two-parent families with lower poverty, which are easier to teach in.
Cultural isolation. Areas that are geographically isolated often offer limited cultural opportunities, such as museums and theatres, and reduced cultural diversity. This affects children’s wider educational experience and exposure to different lifestyles, as well as the potential to recruit high-quality teachers and school leaders who would rather work in areas with a wider range of social opportunities.
Which role place-based disparities play in the production of educational inequalities further depends on the entire educational landscape and how a system is regulated. Boterman et al. (Citation2019) refer to “the extent of public funding, the degree to which parental choice and/or geographical proximity drive school selection, the role and status of private schools and the religious and pedagogical pluralism of the educational system” (p. 3055). These institutional conditions interact with spatial geographies of an education landscape as they influence “the ethnic and social composition of school populations and their reputations; the underlying levels and trends of residential segregation; and the spatial distribution of schools in urban space” (p. 3055). Inspection outcomes can also play an important role in structuring the local landscape and the way in which schools (fail to) improve, as we will describe below.
The role of inspection in stuckness
Most of the research on school inspections looks at the effects and unintended consequences of inspections on school improvement and student outcomes. A number of recent literature reviews (de Wolf & Janssens, Citation2007; Ehren, Citation2016; Hofer et al., Citation2020; Munoz-Chereau et al., Citation2023; Penninckx, Citation2015; Quintelier et al., Citation2020) indicate variable effects, ranging from improved outcomes following an inspection to a decline in outcomes or strategic responses such as narrowing the curriculum, or window dressing. Some studies have also explored the mechanisms by which school inspection leads or does not lead to improved outcomes, and how these might vary for different types of schools, according to their previous performance or the student populations they are serving. These studies help to understand how inspection potentially causes stuckness.
Inspection and improvement
Ehren and Shackleton (Citation2016) describe how the impact of school inspections is not linear but operates through diffuse and cyclical processes of change. In the event of a failed inspection outcome, the process may propel a vicious cycle of decline in performance rather than improvement, causing schools to become stuck over time. Their and other studies explain how these schools concentrate on quick wins to make superficial changes, aimed to improve inspection outcomes but without sustainable, long-term impact on student outcomes. Such efforts, however, take time and effort and may cause some of the improvement fatigue or resistance to change that has been associated with stuck schools. Dedering (Citation2018), for example, finds that German schools with a failed inspection outcome implemented plans aimed to improve inspection standards over the short term, supported by external consultants who are contracted to deliver speedy results which may, in the end, not lead to improved outcomes over time.
Other studies point to how failed inspection outcomes damage staff and student morale. Schools judged by the Dutch Inspectorate of Education as weak or very weak were categorised by declined student satisfaction, and reduced student numbers and student–staff ratios over time (Ehren & Shackleton, Citation2016). This would suggest that students are less likely to choose schools that are evaluated as weak or very weak by the inspectorate, and students in these schools become less satisfied when the school is assessed to be failing. Such a decline in student satisfaction may result from an overall lack of morale in the school, following a negative inspection assessment, or may be caused by the fact that time and effort go into raising student achievement in core subjects to the disadvantage of other subjects or activities. These efforts for quick wins in inspection outcomes bring an adverse effect in making the school a less attractive place to learn and teach.
Honingh et al. (Citation2020) point to reputational damage of a failed inspection outcome where a decline in student numbers would affect a school’s ability to recruit high-quality staff. Where a negative report leads to a decline in student numbers, this will also affect the financial stability of the school and opportunities to invest in quality improvement. Schools who are part of a wider grouping, such as school boards, can reduce some of these adverse effects when appropriate measures are taken, such as redirecting some of the funding or staff. Yet, a study by Ehren and Godfrey (Citation2017) in England indicates that this was only possible when a school board (a multi-academy trust) has few failing schools, as reinvestments are not an option when all schools need help. Failing schools reduce the overall available capacity of the multi-academy trust to offer support to all schools.
The reputation of the region in which the school is located may, however, mitigate some of these unintended consequences of failed inspections (Honingh et al., Citation2020). Where the region is an attractive place to teach, a failing report will not necessarily lead to a decline in student numbers or issues around teacher recruitment as much as where the region is considered unattractive. A similar argument can be made for the number of schools within a locality that compete over student admissions. Where there is a good choice of schools, a failed inspection will more likely lead particularly educated and middle/high-income parents to choose a school with a good inspection outcome.
A negative inspection can, in some cases, also provide an impetus for change (Ehren, Citation2016; Hofer et al., Citation2020). Dutch schools in a study by Honingh et al. (Citation2020) reported an increased sense of urgency to improve after a failed inspection with enhanced external support and financial investments in the quality of education, school culture, professional development of staff, and the internal systems for quality assurance. This sense of urgency resulted in positive change where schools also faced low student satisfaction with teaching (as measured in school internal surveys), external societal pressure to improve (e.g., through the media/community pressure), and creating opportunities to discuss and address areas of weakness.
This paper aims to enhance our understanding of the interaction between schools’ location and socioeconomic context, its inspection outcome, and how this affects school change. In the next section, we will explain our methodology and the specific school and context conditions included in our study.
Methodology
Our study includes an analysis of secondary data to examine differences in location factors between the 580 stuck schools and all state-funded schools in England, as shown in . We incorporated these data into a bespoke data set to capture a time series of information about each school, stretching from 2005 to 2018 and incorporating every inspection that took place over this period. Where mergers have taken place, we recreated a historical time series accounting for all predecessor schools which were recorded as part of the school by September 2018. For example, we aggregated the percentage of pupils eligible for free school meals so that the resulting data included pupils across all relevant predecessor schools. This data structure enabled us to answer questions about the history and progression of the school over time without losing information about parts of what is now considered as one school but previously was two or more separate schools.
Table 1. Data sets used in our study.
The data set included 580 stuck schools in total. Of this sample, 57% (329) are primary schools (relatively underrepresented compared with the 77% of all primary schools), and 37% of stuck schools (216) were secondary schools (overrepresented compared with 15% of all secondary schools). Eight of the 580 stuck schools were all-through schools, nine were middle schools, and 18 were non-mainstream schools.
Data analysis
The data were analysed applying the following quantitative analyses. First, propensity score matching (PSM) was used to select a sample of schools that were comparable to the 580 stuck schools, and the development of differences between stuck schools and their matched comparison group following the first adverse inspection result was analysed. Logistic regression models were fitted to describe the association of the factors in with the outcome of stuck status. The Stata command psmatch2 was used to find the most similar schools using a “nearest neighbour” algorithm. The quality of the match was assessed by checking the balance of the covariates, and this was an outcome of interest because it described the extent to which stuck schools were similar to other schools, distinct from other schools, or unique such that good matches did not exist among schools that were not stuck.
Table 2. Summary of variables in our study.
Second, we implemented path analysis (PA) with the number of inspections for which each school has been judged less than good to understand how an inspection outcome does or does not lead to change over time. We examined the relationships between different factors and events to understand how schools can become stuck within the inspection system. This analysis is not causal, and we cannot say that one factor causes another, but we can set out a chain of events and examine the plausibility of different hypotheses about which events mattered in the journey to becoming stuck. In particular, we modelled the following hypotheses:
| (1) | School population model: School population changes contribute to prolonged school inspection failure, through the following intermediate events, after a school receives an adverse inspection result:
| ||||
| (2) | School intervention model: School improvement intervention processes contribute to changes in inspection outcomes of schools through the following intermediate effects on school population change:
| ||||
We focused on the 2012 Ofsted inspection framework period, in which data on teacher turnover were available. This ensured that all inspection judgements had the same meaning having taken place after grade “3” became known as “requires improvement” rather than “satisfactory”. We modelled events following inspection for schools inspected in the academic year 2012/13, using the outcomes from this inspection as a contributing factor to subsequent changes experienced in schools. We formulated the outcome of the models as the number of requires improvement or inadequate inspection judgements in 2013/14–2017/18 inclusive. This was used in place of stuck status because path analysis requires larger numbers of schools to support the testing of effects on multiple intermediary events and factors.
Stata was used to implement structural equation modelling using the sem command. The path diagrams presented illustrate simplified versions of the final models. These were selected after using the root-mean-square error of approximation (RMSEA), comparative fit index (CFI), Tucker–Lewis index (TLI), and standardised root-mean-square residual (SRMR) goodness of fit postestimation indices to assess the model fit and make adjustments. Effect sizes measured in standard deviations of the outcome measure associated with a one standard deviation increase in the predicting variable are reported to facilitate comparisons between different paths and outcomes. Data analysis was implemented separately for primary and secondary schools given the differences in school size, catchment, and competition with neighbouring schools.
Findings
In this section, we first describe the place-based characteristics of stuck schools, and then present outcomes of our models. For more details about our models, we have added supplementary material.
Location of stuck schools
A comparison with all state schools indicates that schools in areas of medium urban density were the most likely to be stuck; 53% (306) of the 580 stuck schools were in cities and urban towns (41% of all schools), and 8% of stuck schools (45 schools) were in minor conurbations (3% of all schools). Twenty-seven per cent of stuck schools (157 schools) were in major conurbations, but these were 31% of all schools. Eight per cent of stuck schools (47 schools) were in rural towns compared with 10% of all schools. Three per cent of stuck schools (16 schools) were in rural villages, and 2% (9 schools) were in rural hamlets, compared with 11% and 4% of all schools, respectively.
We also found that schools with failed inspections over the last decade are more likely to be located in specific regions: Yorkshire and the Humber (17% stuck, 11% of all schools); West Midlands (15% stuck, 11% all schools); and East Midlands (14% stuck, 9% all schools). In contrast, a minority of stuck schools are located in London (5% stuck, 11% of all schools).
PSM shows that stuck schools were not unique, but they do exist in distinctively deprived contexts. Increased deprivation was important in predicting stuck status among primary schools. At the second inspection point, both Income Deprivation Affecting Children Index neighbourhood deprivation and free school meals rates were associated with remaining stuck. Stuck primary schools were also more likely to have higher proportions of children from ethnic groups with historically lower attainment and academic progress than their counterparts.
Secondary schools that experienced increases in their percentage of pupils eligible for free school meals by the time of the second inspection were more likely to remain stuck after controlling for other factors. Other deprivation effects were very small as the addition of variables detailing school governance and staff turnover in the model results in moderation of deprivation effects.
School population model
We fitted path models to test the relation between changes in school population and stuckness. As the models were generally better at explaining the outcome of multiple poor inspection judgements for secondary schools, we first describe these, before applying them to primary schools.
We built the secondary school model by introducing school population factors at the baseline year of 2011/12 and drawing in effects from these to the inspection outcome in 2012/13. is a simplified path diagram where the largest standardised coefficient, or effect size, on the 2013 inspection grade outcome is the value-added pupil progress score for the previous year with an effect size of −0.49. This means that for an increase of one standard deviation in pupil progress, there is around half a standard deviation in reduction in the Ofsted grade. Because the Ofsted inspection grade “1” is the highest or best grade and grade “4” is the worst, better pupil progress is associated with improved inspection grades, as expected.
Figure 1. Path analysis secondary school population model.
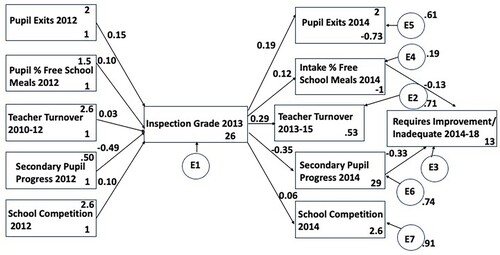
Each of the other factors measured in 2012 had a much smaller but negative (worsening) effect on the 2013 Ofsted grade. Schools with more pupil mobility (more pupils leaving other than at the regular leaving age) had worse Ofsted grades in 2013, with an effect size of 0.15. Those with higher percentages of pupils eligible for free school meals had worse Ofsted grades in 2013 (ES = 0.10), as did schools facing stronger differentials from neighbouring schools with better prior inspection grades (ES = 0.10). Finally, a very small effect was found for schools with higher 2-year cumulative teacher turnover prior to their inspection in 2013, which also received worse inspection grades (ES = 0.03). Together, these factors explained 35% of the variation in 2013 Ofsted grades.
Outcomes after the 2013 inspection
On the right-hand side of the 2013 inspection grade in the path diagram, the same factors are then measured in 2014, and we estimate the effects of the Ofsted grade following the inspection. The model included control paths that were not of primary interest (and are omitted from the path diagram for legibility) but which had potential to confound the paths of interest. These were paths from the earlier 2012 values of the school population factors to the later 2014 values of the same population factors, and a path from the 2013 inspection grade to the 2014–2018 number of less than good grades outcome.
Turning to the effects of the 2013 inspection grade on the subsequent school factors in 2014, again the largest effect was on value-added pupil progress, with an effect size of –0.35 on progress in 2014. This meant that a better Ofsted grade was associated with greater pupil progress and a worse Ofsted grade was associated with poorer pupil progress. This is unlikely to be a causal effect and most likely represents the fact that pupils sitting their General Certificate of Secondary Education in 2014 have normally been in the school for 5 years, 3 of which were before the 2013 inspection took place. It is unlikely that meaningful changes in pupil progress would result from changes to provision within 1 year of an adverse inspection and more likely that challenges facing schools persist over time.
All other effects had positive signs meaning that worse Ofsted grades led to worsened school factors, with a moderate effect on teacher turnover (ES = 0.29). There was also an increase in pupil exits associated with lower Ofsted grades (ES = 0.19), as well as small increases in pupil deprivation (ES = 0.12) and grade differentials compared with neighbouring schools (ES = 0.06).
Knock-on effects on subsequent 2014–2018 inspections
The model has demonstrated that small to moderate penalties are experienced by schools after they receive a lower Ofsted grade (and vice versa). We then tested paths from each school factor to the number of less than good grades received over the period 2014–2018 inclusive and found that only two of the factors had statistically significant associations with these outcomes. Unsurprisingly, better pupil progress was associated with fewer negative judgements from Ofsted (ES = −0.33).
The other factor associated with later Ofsted judgements was the percentage of the school’s intake year group eligible for free school meals (ES = 0.13). This meant that there was a small increase in low inspection grades associated with higher deprivation levels in 2014. The two factors of pupil progress and pupil deprivation plus the earlier Ofsted grade outcome in 2013 together accounted for 31% of the variation in the number of subsequent grades that were less than good.
While the contribution of the free school meals percentage to the number of later adverse Ofsted judgements was small in size, there was nevertheless some evidence of a negative cycle, in which schools with more disadvantaged pupils received lower Ofsted grades, schools with lower Ofsted grades recruited pupil intakes that were increasingly deprived, and schools with the most deprived intakes then received more negative judgements from Ofsted in the following years. The schools that initially received lower Ofsted grades in 2013 also experienced other adverse outcomes in terms of greater pupil and teacher mobility, though these were not associated with subsequent Ofsted grades.
When we tested alternative specifications of the model substituting binary variables for requires improvement or inadequate Ofsted grades in 2013, there was an additional statistically significant path from higher cumulative teacher turnover in 2013–2015 to more less than good Ofsted outcomes in 2014–2018. This was a small effect (ES = 0.08 with 2013 requires improvement and ES = 0.09 with 2013 inadequate) but completed the paths to create a second feedback loop: A more challenging context is associated with a worse grade in 2013, which is followed by increases in teacher turnover after 2013, which then correlated with more less than good judgements from 2014 to 2018.
Primary schools
We applied the same model to primary schools. The most important difference was that the model was less successful in explaining variation in the number of less than good grades received from 2014 to 2018, with only 18% of the variation explained. Pupil progress remained the most important predictor (ES = −0.47), pupil mobility was less important (ES = 0.06), whereas pupil deprivation and teacher turnover were more important for primary schools although the effects were still small (Pupil FSM ES = 0.13) or very small (Teacher Turnover ES = 0.07).
The effects of the 2013 inspection grade were the same as for secondary schools in that worse Ofsted grades were followed by greater challenges of pupil exits in 2014 (ES = 0.19) and teacher turnover (ES = 0.29). There was a larger (yet still very small) effect on grade differentials from neighbouring schools (ES = 0.08).
In addition to the pupil deprivation path, there was an additional path from higher teacher turnover for 2013–2015 to more subsequent requires improvement or inadequate grades. This had a small effect size of 0.11 but indicated that while the pupil deprivation path was weaker for primary schools, there was again a negative cycle between intensifying teacher turnover and subsequent negative inspection results.
School intervention model
In our second set of path models, we tested the hypothesis that school improvement interventions (specifically, changes in the governance and leadership of the school) contribute to stuckness. We took the 2013 inspection as the starting point and assessed the mediating effect of joining a multi-academy trust (MAT) and changes to the head teacher on pupil progress, pupil mobility, and teacher turnover, and the knock-on effects of these on less than good judgements from 2014 to 2018. The model for secondary schools is illustrated by the simplified path diagram in .
Figure 2. Path analysis secondary school intervention model.
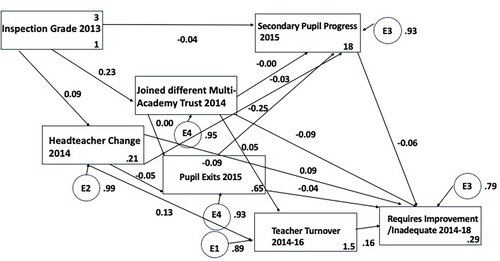
First, we considered the effects of the 2013 inspection outcome on the likelihood of schools experiencing a school improvement intervention in the following year. As the academy programme forced schools with a poor inspection outcome to join a MAT, we observed a moderate effect of a weaker Ofsted grade in 2013 on joining a new or different MAT in 2014 (ES = 0.23). There was also a small increase in the chances that the school would get a new head teacher in 2014 (ES = 0.09). These interventions in governance and leadership set the scene for subsequent events in 2015.
Joining a MAT had a negligible effect on pupil progress and pupil exits in 2015, but it did have a very small negative effect on teacher turnover in 2014–2016 (ES = −0.05), reducing the number of teachers who left the school compared with other schools. The reduction in turnover associated with joining a MAT reduced less than good grades in subsequent years. Joining a MAT also had a small direct effect on reducing the number of subsequent less than good Ofsted grades, although it was not associated with any improvement in pupil progress in 2015.
Turning to head teacher change, this had a direct effect of increasing the number of less than good inspection outcomes in 2014–2018 by a small effect size of 0.09. It also increased negative inspection outcomes through intermediate changes to teacher turnover, pupil mobility, and pupil progress.
The largest effect of a head teacher change was a (small) effect of increasing teacher turnover (ES = 0.13). As greater teacher turnover was followed by more less than good grades (ES = 0.16), head teacher change contributed to poor inspection results directly as well as indirectly.
Head teacher change also increased pupil exits in 2015 (ES = 0.05) and had a very small suppressing effect on pupil progress (ES = −0.03), which then negatively influenced later Ofsted grades (ES = 0.06). Larger percentages of pupils leaving in 2014 were associated with fewer less than good Ofsted grades, although the effect size was very small (ES = −0.04), but this effect may have been larger had the increased pupil exits not also been followed by reduced pupil progress in 2014 with a moderate effect size of −0.25, as this would have a small offsetting effect on subsequent Ofsted grades.
The effects of joining a new MAT, a change of head teacher, pupil progress, and pupil and teacher mobility explained 21% of the variation in less than good Ofsted grades received by secondary schools in total. There was a small direct effect of reducing the number of negative Ofsted judgements, although it is possible that this might be partly accounted for by inspection holidays given to schools when they make a fresh start as a sponsor-led academy, which would reduce the number of inspections undertaken from 2014 to 2018.
In contrast to joining a MAT, schools that experienced a change of head teacher in 2014 faced subsequent increases in contextual challenges from increased pupil exits, which indirectly increased negative inspection judgements through intermediate effects of suppressing pupil progress, and more importantly through increases in teacher turnover, which then increased less than good grades received. Schools which had a change of head teacher also experienced a direct effect of this on increased negative Ofsted judgements.
Primary schools
In total, the factors in our school intervention model for primary education explained only 14% of the variation in 2014–2018 Ofsted outcomes, indicating that the model was not good at explaining these in primary schools.
The positive effects of joining a MAT observed for secondary schools did not hold true for primary schools, and in fact the effects were the opposite of our secondary findings. For primary schools, the knock-on effects of joining a MAT were a small increase in teacher turnover (ES = 0.08) and a very small increase in pupil exits (ES = 0.02). Both were associated with receiving more negative Ofsted grades from 2014 to 2018 with small effect sizes (Pupil Exits ES = 0.09 and Teacher Turnover ES = 0.16).
As for secondary schools, a change of head teacher presented risks for schools in the subsequent years. A lower inspection grade in 2013 increased the chances of a change of head teacher the following year with a small effect size of 0.09. This then had a small knock-on effect on increased teacher turnover (ES = 0.11), which was then associated with more subsequent less than good Ofsted grades (ES = 0.16). There were also small effects through the pupil exits path and the pupil progress path.
Conclusion and discussion
The challenges of place-based disparities to school improvement and inspection are not new. Previous studies have highlighted the crucial role of location in the production of educational inequality and how regional disparities affect educational attainment and social mobility. Placed-based disparities in which children and young people grow up have a profound effect on how well they do in school; this also affects the extent to which schools are attractive places to work in. Schools in challenging regions and which serve a deprived student population will have a higher chance of receiving a failed inspection outcome; a low inspection outcome, in turn, may further increase the difficulty of bringing about positive change when, for example, more affluent students leave the school or when the school has difficulties to recruit high-performing staff.
Crucially, this paper aimed to better understand the relation between Ofsted’s failed inspection outcomes and whether and how challenging locations and populations interact with inspection outcomes to contribute to stuckness for schools in England. Using a longitudinal data set, our study offers an important contribution to the wider field of school inspection research, particularly in understanding longer term school change trajectories related to inspection outcomes and the nature and location of schools that have failed their inspection.
First, our findings indicate that there are relatively more stuck secondary schools, compared to primary schools. The chances of being stuck are related to place in that schools in areas of medium urban density were the most likely to be stuck, particularly in Yorkshire and the Humber and the West Midlands. The stuck schools were also slightly more distinctive in higher levels of neighbourhood deprivation and students on free school meals compared with schools that had an initial poor inspection result but did not remain stuck.
Second, we found that Ofsted inspections played a role when explaining stuckness. We found evidence for a cycle of events in which poor Ofsted judgements play a modest contributory role in the onset of increasingly challenging circumstances, which then make it more likely that the school experiences further poor inspection grades in the subsequent 8 years. There was a negative cycle between low Ofsted grades and increasingly deprived pupil intakes, and another between low Ofsted grades and increasing levels of teacher turnover. The effect sizes for these were small, indicating that they are contributory factors but not the main determinants of schools becoming or remaining stuck.
Third, we found that academisation played a small positive role when explaining resilience against stuckness in secondary, but not in primary schools. Our models included changes in governance, as the 2010 academy programme forced schools with a low inspection outcome to join a MAT. Whilst during the 2000s some academies replaced schools considered failing by Ofsted, since 2010 this became compulsory. Hence, we looked at the subsequent effect of this and found small positive effects of lower teacher turnover, and lower chances of remaining stuck by receiving negative Ofsted grades in subsequent inspections among secondary schools. However, this might be partly accounted for by inspection holidays given to schools when they make a fresh start as a sponsor-led academy, rather than reflecting school improvement. In contrast, a change of head teacher had small negative effects of increased teacher turnover and more subsequent less than good grades. For primary stuck schools, we did not observe any positive or negative effect of joining a MAT on subsequent inspection outcomes, but also observed negative effects of having a change in head teacher, which was followed by increases in teacher turnover, reductions in pupil progress, and further adverse inspection outcomes. All effects were small in size.
Our analyses are not causal, and the fact that the overall variance explained by the models was low and the effect sizes were small suggests that important variables not observed in administrative data are omitted from our models. Leader quality is an obvious candidate that might explain both initial and subsequent Ofsted judgements, and be correlated with adverse pupil and teacher trends, plus provide motivation for decisions to intervene in school governance and leadership. This explanation would fit official narratives, but in the absence of independent information about leader quality, uncertainty remains as to whether the inspection system is removing lower quality school leaders as intended, or alternatively whether unobserved contextual challenges (such as parental education and engagement) could account for long-term outcomes.
Notwithstanding this uncertainty, our analyses revealed plausible chains of events that provide insights on how negative Ofsted inspection outcomes can contribute to a more challenging set of circumstances for schools. Given that schools in disadvantaged areas have a higher probability to receiving failed inspection grades, this potentially creates a reinforcing cycle that is difficult to break. Stuck schools have to counter a reputation of failure and the consequences of this for staff and student motivation, while engaging in a substantive change process to improve their quality.
The greater uncertainty surrounding how primary schools become and remain stuck suggests that the dominant model of intervention through academisation has not addressed the needs of primary schools that are judged less than good. It was designed to solve problems in secondary schooling, and perhaps insufficient attention has been paid to the distinct challenges and strengths of primary education. Indeed, initial Ofsted grades in our primary school models were weakly related to the application of governance and leadership interventions. This is suggestive of an intervention model imposed on an educational phase for which it is not well adapted.
Our findings raise important questions about the fairness of inspections and their role in the improvement of schools. Fairness tends to be discussed by how schools are judged and whether all schools need to be treated equally in applying a standardised inspection procedure, or whether individual circumstances should be recognised when assessing quality (Oehme, Citation2015). However, our findings indicate that we also need to understand fairness in both the retributive and consequential sense (Nisbet & Shaw, Citation2020): Are the inspection outcomes fair in the reward or penalty they provide, and in how they inform, or are they used as a basis for actions in the future? Overall, Ofsted inspections of school effectiveness need to consider not only placed-based disparities resulting from disadvantaged locations and student population compositions but, critically, the detrimental role that inspections can play when judging the effectiveness of schools educating the most disadvantaged communities.
Ethics
This study has full ethical approval, REC 1250: “Intractable” schools: can an Ofsted judgement prevent sustainable improvement? Granted by UCL Institute of Education Ethics Committee, 15 July 2019, Data protection registration number: No Z6364106 2019 07 94 social research.
Supplemental Material
Download MS Word (2.4 MB)Disclosure statement
No potential conflict of interest was reported by the authors.
Additional information
Notes on contributors
Melanie Ehren
Melanie Ehren is a professor in Educational Sciences at the Free University of Amsterdam and an honorary professor in Educational Accountability and Improvement at the UCL Institute of Education.
Jo Hutchinson
Jo Hutchinson is the Director for Social Mobility and Vulnerable Learners at the Education Policy Institute (https://epi.org.uk/team/jo-hutchinson/).
Bernardita Muñoz-Chereau
Bernardita Muñoz-Chereau is a lecturer at the Centre for Educational Leadership, Department for Learning and Leadership, UCL Institute of Education.
References
- Boterman, W., Musterd, S., Pacchi, C., & Ranci, C. (2019). School segregation in contemporary cities: Socio-spatial dynamics, institutional context and urban outcomes. Urban Studies, 56(15), 3055–3073. https://doi.org/10.1177/0042098019868377
- Collinson, V. (2010). To learn or not to learn: A potential organizational learning gap among school systems? Leadership and Policy in Schools, 9(2), 190–219. https://doi.org/10.1080/15700760903342368
- Dedering, K. (2018). Consultancy in ‘failing schools’: Emerging issues. Improving Schools, 21(2), 141–157. https://doi.org/10.1177/1365480217753515
- De la Fuente, H., Rojas, C., Salado, M. J., Carrasco, J. A., & Neutens, T. (2013). Socio-spatial inequality in education facilities in the Concepción metropolitan area (Chile). Current Urban Studies, 1(4), 117–129. https://doi.org/10.4236/cus.2013.14013
- de Wolf, I. F., & Janssens, F. J. G. (2007). Effects and side effects of inspections and accountability in education: An overview of empirical studies. Oxford Review of Education, 33(3), 379–396. https://doi.org/10.1080/03054980701366207
- Ehren, M. C. M. (2016). School inspections and school improvement; the current evidence base. In M. C. M. Ehren (Ed.), Methods and modalities of effective school inspections (pp. 69–85). Springer. https://doi.org/10.1007/978-3-319-31003-9_4
- Ehren, M. C. M., & Godfrey, D. (2017). External accountability of collaborative arrangements; a case study of a Multi Academy Trust in England. Educational Assessment, Evaluation and Accountability, 29(4), 339–362. https://doi.org/10.1007/s11092-017-9267-z
- Ehren, M. C. M., & Shackleton, N. (2016). Risk-based school inspections: Impact of targeted inspection approaches on Dutch secondary schools. Educational Assessment, Evaluation and Accountability, 28(4), 299–321. https://doi.org/10.1007/s11092-016-9242-0
- Ehrlich, M. v., & Overman, H. G. (2020). Place-based policies and spatial disparities across European cities. Journal of Economic Perspectives, 34(3), 128–149. https://doi.org/10.1257/jep.34.3.128
- Greany, T., & Higham, R. (2018). Hierarchy, markets and networks: Analysing the ‘self-improving school-led system’ agenda in England and the implications for schools. UCL Institute of Education Press. https://discovery.ucl.ac.uk/id/eprint/10053501
- Hofer, S. I., Holzberger, D., & Reiss, K. (2020). Evaluating school inspection effectiveness: A systematic research synthesis on 30 years of international research. Studies in Educational Evaluation, 65, Article 100864. https://doi.org/10.1016/j.stueduc.2020.100864
- Honingh, M., Ruiter, M., & van Thiel, S. (2020). Are school boards and educational quality related? Results of an international literature review. Educational Review, 72(2), 157–172. https://doi.org/10.1080/00131911.2018.1487387
- Hutchinson, J. (2016). School Inspection in England: Is there room to improve? Education Policy Institute. https://epi.org.uk/publications-and-research/school-inspection-england-room-improve/
- Ko, J. Y. C., Hallinger, P., & Walker, A. D. (2012). Exploring school improvement in Hong Kong secondary schools. Peabody Journal of Education, 87(2), 216–234. https://doi.org/10.1080/0161956X.2012.664474
- Munoz-Chereau, B. & Ehren, M. (2021). Inspection across the UK: How the four nations intend to contribute to school improvement. Edge Foundation. https://www.edge.co.uk/documents/139/Inspectionacross-the-UK-report-FINAL.pdf
- Munoz-Chereau, B., Ehren, M. C. M., & Hutchinson, J. (2023). The impact of Ofsted school inspections: A systematic review of the literature [Manuscript submitted for publication]. Institute of Education, University College London.
- Munoz Chereau, B., Hutchinson, J., & Ehren, M.C.M. (2022). ‘Stuck’ schools: Can below good Ofsted inspections prevent sustainable improvement? Institute of Education, University College London. https://discovery.ucl.ac.uk/id/eprint/10149556/
- Nicolaidou, M., & Ainscow, M. (2005). Understanding failing schools: Perspectives from the inside. School Effectiveness and School Improvement, 16(3), 229–248. https://doi.org/10.1080/09243450500113647
- Nisbet, I., & Shaw, S. (2020). Is assessment fair? SAGE Publications.
- Oehme, F. (2015, September 7–11). Fairness to whom? A study on inspectors’ justice beliefs regarding school inspection in England and Germany [Paper presentation]. European Educational Research Association 2015 conference, Budapest, Hungary. https://eera-ecer.de/ecer-programmes/conference/20/contribution/35316/
- Office for Standards in Education, Children's Services and Skills. (2017, December 13). Amanda Spielman on the launch of Ofsted's Annual Report 2016/17. https://www.gov.uk/government/speeches/amanda-spielman-on-the-launch-of-ofsteds-annual-report-201617
- Office for Standards in Education, Children's Services and Skills. (2020). Fight or flight? How ‘stuck’ schools are overcoming isolation: An evaluation project (Reference No. 190042). https://www.gov.uk/government/publications/fight-or-flight-how-stuck-schools-are-overcoming-isolation/fight-or-flight-how-stuck-schools-are-overcoming-isolation-evaluation-report
- Ovenden-Hope, T., & Passy, R. (2019). Educational isolation: A challenge for schools in England. https://marjon.repository.guildhe.ac.uk/17357/1/Education%20Isolation%20Report_Ovenden-Hope.pdf
- Passy, R., & Ovenden-Hope, T. (2016). Changing student behaviour in schools located in areas of socioeconomic deprivation: Findings from the ‘coastal academies’ project. Education Today, 66(3).
- Passy, R., & Ovenden-Hope, T. (2020). Exploring school leadership in coastal schools: ‘Getting a fair deal’ for students in disadvantaged communities. Journal of Education Policy, 35(2), 222–236. https://doi.org/10.1080/02680939.2019.1573382
- Penninckx, M. (2015). Inspecting school inspections [Doctoral dissertation, University of Antwerp]. https://hdl.handle.net/10067/1252380151162165141
- Quintelier, A., De Maeyer, S., & Vanhoof, J. (2020). Determinants of teachers’ feedback acceptance during a school inspection visit. School Effectiveness and School Improvement, 31(4), 529–547. https://doi.org/10.1080/09243453.2020.1750432
- Riall, M. (2017, September 18). Schools no one wants are in limbo – Here’s what needs to change. Schools Week. https://schoolsweek.co.uk/schools-no-one-wants-are-in-limbo-heres-what-needs-to-change
- Robinson, M. (2016). Professional practice schools as a form of school-university partnership in teacher education: Towards a social justice agenda. Education as Change, 20(2), 11–26. https://doi.org/10.17159/1947-9417/2016/496
- Roscigno, V. J., Tomaskovic-Devey, D., & Crowley, M. (2006). Education and the inequalities of place. Social Forces, 84(4), 2121–2145. https://doi.org/10.1353/sof.2006.0108
- Rosenholtz, S. J. (1989). Workplace conditions that affect teacher quality and commitment: Implications for teacher induction programs. The Elementary School Journal, 89(4), 421–439. https://doi.org/10.1086/461584
- Social Mobility Commission. (2017). State of the Nation 2017: Social mobility in Great Britain. https://assets.publishing.service.gov.uk/government/uploads/system/uploads/attachment_data/file/662744/State_of_the_Nation_2017_-_Social_Mobility_in_Great_Britain.pdf