
 ?Mathematical formulae have been encoded as MathML and are displayed in this HTML version using MathJax in order to improve their display. Uncheck the box to turn MathJax off. This feature requires Javascript. Click on a formula to zoom.
ABSTRACT
Two approaches in materials physics have proven immensely successful in alloy design: First, thermodynamic and kinetic descriptions for tailoring and processing alloys to achieve a desired microstructure. Second, crystal defect manipulation to control strength, formability and corrosion resistance. However, to date, the two concepts remain essentially decoupled. A bridge is needed between these powerful approaches to achieve a single conceptual framework. Considering defects and their thermodynamic state holistically as ‘defect phases’, provides a future materials design strategy by jointly treating the thermodynamic stability of both, the local crystalline structure and the distribution of elements at defects. Here, we suggest that these concepts are naturally linked by defect phase diagrams describing the coexistence and transitions of defect phases. Construction of these defect phase diagrams will require new quantitative descriptors. We believe such a framework will enable a paradigm shift in the description and design of future engineering materials.
KEYWORDS:
- Defect
- defect phase
- lattice defect
- thermodynamics
- phase diagram
- Pourbaix diagram
- defect phase diagram
- transmission electron microscopy
- atom probe tomography
- atomistic simulation
- density functional theory
- nanomechanics
- complexion
- mechanical properties
- corrosion properties
- dislocation
- grain boundary
- phase boundary
- surface
Current and future materials design: from defects and phases towards ‘defect phases'
Strategies to design structural metallic materials are traditionally based on two key concepts: First, the use of thermodynamic bulk phase diagrams for structural properties of materials and Pourbaix diagrams for corrosion. These allow us to identify in which directions materials tend to develop under given environmental conditions and which bulk phases, precipitates and oxides can be expected. Such knowledge is essential for identifying state variables such as temperature and composition that are suited to realise phase mixtures that lead to materials with desirable mechanical and corrosion properties. Second, the fundamental concepts of lattice defects and their patterning and how these can be manipulated to control the mechanical and corrosion behaviour. The relevant defects include vacancies, solutes and segregated atoms, dislocations, grain and phase boundaries, as well as surfaces, including those at cracks and pores.
Today, these concepts are mostly considered in a decoupled fashion: Phase diagrams are the main pillar for the design of the composition of bulk materials and the existence ranges of their constituent phases, however, there is no comparable comprehensive concept for defects and, thus, phase diagrams cannot be employed for chemo-structural defect design. This comes from the view that a phase in bulk thermodynamic equilibrium is per definition considered to be defect-free (except for thermal vacancies), although most materials have very dense populations of defects that prevail due to their local mechanical stability. As an example, highly strained metals can contain up to a light year of dislocation line length in one cubic metre of material. Similar to the bulk phase diagrams, Pourbaix diagrams focus only on a single element in a corrosive environment and do not consider local chemical changes due to lattice defects or their impact on electrochemical reactions.
Indeed, the presently established concepts to describe how chemistry – the addition of alloying elements – affects defects, focus almost completely on singular phenomena in dilute alloys. Examples of such phenomena on the different defect scales are the Portevin-Le-Chatelier effect [Citation1], local phase transformation or formation of a linear defect phase (or ‘complexion’) [Citation2–5], pitting corrosion at the level of dislocations [Citation6,Citation7] and Suzuki- and Anti-Suzuki-effects at stacking faults [Citation8,Citation9]. At interfaces, mechanical and liquid metal induced embrittlement [Citation10–13], intergranular corrosion [Citation14], mobility/pinning of grain boundaries [Citation15], composition dependent changes in interface cohesion [Citation16,Citation17] and planar defect phase (or ‘complexion’) formation [Citation18–21] are known. Furthermore, both, uniform corrosion and nucleation of selective corrosion [Citation22] as well as cracks [Citation23–25] originate at the surface. Finally, in complex phases, chemical and structural ordering is known to control ductility/brittleness [Citation26] and micro-galvanic elements [Citation27] are induced where complex phases are in combination with a metallic matrix.
While the study of bulk structures naturally involves the consideration of all atom positions in perfect unit cells and the elemental distribution in a phase, defects such as dislocations or grain boundaries are commonly considered on a much more abstract level. In many intermetallic phases – even in perfect stoichiometry – the structure of the dislocations is yet to be resolved. Further, the position of segregating atoms at defects in crystal lattices is mostly described only as a local average concentration. Such an average quantity is not able to distinguish those atoms located in the centre of the defect, with its locally different atomic structure, and those located in the surrounding strain field. However, it is this atomic scale structure of each defect that forms the basis for the consideration of its thermodynamic stability and its differentiation from and competition with alternative defect states. As the atomic structure and distribution of chemical elements is inherently more complex than in the surrounding lattice, we will refer to this essential property as ‘structural and chemical atomic complexity’.
Structural and chemical atomic complexity
Complex arrangements of all atoms forming a defect in terms of their positions and elemental species (as opposed to the surrounding lattice with its strict crystallographic order based on simpler structural units with random chemical occupation).
The ‘structural and chemical atomic complexity' therefore describes the arrangement of all atoms forming a defect in terms of their positions and also their elemental species. And it is this information, in contrast to simpler considerations of average chemical compositions over a local volume or idealised defect structures, which is crucial to understand how changes in the stoichiometry or impurities affect the response of defects to mechanical load and chemical attack. Recent experimental and theoretical studies [Citation2,Citation3,Citation18–21,Citation28,Citation29] do indeed show a large variety of highly ordered local structural and thermodynamic defect states, summarised here under the term ‘structural and chemical atomic complexity'.
Sharp transitions of the defect geometry and chemical composition at the atomic scale, which resemble defect state transitions, are consequently not commonly considered, although they are likely ubiquitous and lead to qualitative changes in the structure–property relations. The reason is that experimental and modelling techniques to jointly probe the structural and chemical features of such ‘defect phases’ and their transitions at the (near-) atomic scale have only recently become available [Citation30–35].
Defect phase
Distinct atomic-scale defect configuration for which all physical properties can be expressed as smooth functions of intensive control variables such as temperature, chemical potentials, external stress etc.
→Defect Phase Diagram
Here, we define a ‘defect phase’ as a structurally and chemically distinct atomic-scale defect configuration for which all physical properties can be expressed as smooth (continuous and infinitely differentiable) functions of intensive control variables such as temperature or chemical potential. A defect phase can only exist in the vicinity of its defect. A generalised axiomatic definition of ‘defect phase’ has been derived in Ref. [Citation36] by extending Gibbs’ concept of a fundamental equation and replacing all extensive properties by their excess. This definition is further discussed at the beginning of the third section of this review 'A comparison: bulk versus defect phase diagrams'.
Only very recently, with the advent of aberration corrected transmission electron microscopy (TEM) and atom probe tomography (APT), as well as of advanced computational techniques, it became evident that defect phases exist not as rare exceptions, but appear to be common in materials [Citation2,Citation3,Citation18–21]. These pioneering studies indicate that analogous diagrams can be created for defects that are similar to bulk phase or Pourbaix diagrams.
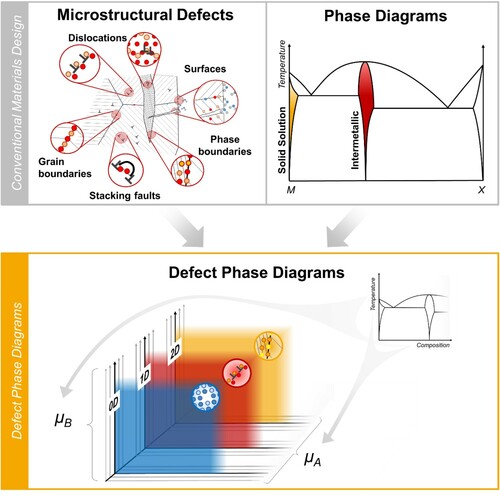
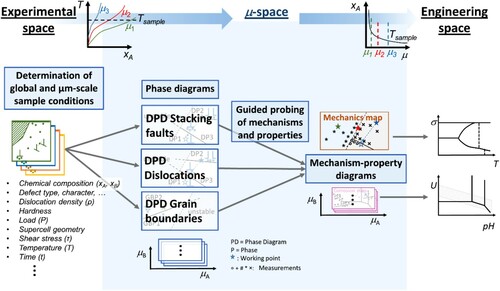
Such ‘defect phase diagrams’ can play the same role as their bulk counterparts. They will allow selection of defects with a desired structural and chemical configuration, which in turn are the carriers of specific defect-property relations and, hence, enable the atomistically motivated design of materials with tailored mechanical and corrosion properties. In order to construct defect phase diagrams, a currently missing research field has to be opened and explored: the atomic scale structure and chemistry of defects and their thermodynamic description as defect phases. In essence, we will need to join the two existing approaches of defect science on the one hand and thermodynamic phase engineering on the other (). Both have proven immensely powerful in facilitating and enabling knowledge-driven materials design over the last century [Citation37–39].
Figure 1. Defect phase diagrams as a potential new basis for materials design joining the current strategies of phase and defect engineering. An analogous picture could be drawn for Pourbaix diagrams and the interaction of corrosion mechanisms with defects.
In this review, we therefore set out to discuss all the elements needed to establish a unified conceptual framework and review important contributions in the literature towards this goal.
Review of experimental and computational evidence of defect phases and associated theoretical concepts
Experimental work
For the past decades, it has been speculated that grain and phase boundaries can be analysed using local equilibrium thermodynamics and may transform in a manner analogous to bulk phases [Citation40–44]. It was initially argued that equilibrium interfacial states do not always satisfy the Gibbs definition of a phase because they are inhomogeneous and may have gradients of structure, composition, properties and other parameters. Therefore, the term ‘complexion’ was introduced in the literature to denote an equilibrium interfacial state and to emphasise the fact that they would not exist in the absence of the adjoining bulk phase(s) [Citation18,Citation19,Citation21,Citation45–47]. However, it has also been shown that a unified thermodynamic framework may in fact be developed for such thermodynamically stable configurations at defects and we therefore use here the term ‘defect phase’ instead of complexion, see 'A comparison: bulk versus defect phase diagrams' in the next section for more detail. The existence of confined states at interfaces has been investigated for at least two decades, especially for grain boundaries and using high resolution (scanning) transmission electron microscopy (HR-(S)TEM). This was done in an attempt to explain phenomena like abnormal grain growth (especially in alumina), grain boundary embrittlement and activated sintering [Citation18–20,Citation47,Citation48], as these phenomena had not been successfully described by purely mechanistic explanations. It has also been recognised that similar chemically and thermally induced structural transitions, analogous to those between grain boundary defect phases, may occur in the structure of triple lines and four-grain junctions, which may, for example, affect the nucleation and propagation of cracks [Citation18]. Such defect phases have been mainly observed in ceramic materials [Citation45], but have also been observed very recently in a Ti alloy [Citation49]. It was further observed that, analogous to bulk phases, transitions of grain boundary defect phases can occur upon changes in local concentration and/or temperature [Citation50]. As a transition between grain boundary defect phases can induce changes of the macroscopic properties, first pioneering attempts were undertaken to construct time-temperature-transformation (TTT) diagrams for these defect phases [Citation51]. A detailed review of evidence for defect phase (or complexion) transitions at grain boundaries has been collated by Cantwell et al. [Citation50].
Similar to interfaces, such confined defect states exist also for dislocations. Already in the middle of the last century, Cottrell and Bilby [Citation52] proposed that in metallic solid solutions the solute atoms do not form a random solute solution but tend to segregate to dislocations forming a defect state known as a Cottrell cloud [Citation52]. This is reflected macroscopically as measurable serrations in the stress–strain curve. With the advances of high-resolution characterisation and simulation methods during the past decade, the existence of 1D (dislocation) defect phases, also called ‘linear complexions’, has been proven using correlative TEM-APT [Citation2,Citation3] in a Fe9wt-%Mn alloy, where equilibrium segregation of Mn to dislocations can induce local phase transition of the dislocation core into austenite, for more detail see ‘Local transformations of dislocation cores in Fe-Mn steel' in the last section of this review. These austenite embryos were found to be confined to the strain field of the dislocation, staying sub-critical even after an extended tempering treatment for 2 weeks [Citation2,Citation3]. In line with these experimental studies, computational investigations using density function theory (DFT) and atomistic simulations have shown the existence of 1D defect phases in a wide range of fcc materials [Citation4,Citation5,Citation53], see also ‘Local hydride formation at dislocations in nickel' in the section on ‘Specific examples of defect phases and their thermodynamics'. Upon changes in the temperature or (local) composition at the dislocation, clear transitions between the dislocation defect phases were found [Citation5].
At surfaces, periodic atomic arrangements deviating from the bulk environment have been observed and studied for decades using various surface science techniques [Citation54] in order to understand stability [Citation55–57], growth [Citation58–60] or reactivity and corrosion [Citation61–64]. Such deviations in atomic arrangements manifest themselves in two ways: first, in terms of surface relaxations, where the distance between surface layers deviates from the bulk layer distances as a consequence of the cutting of bonds. The direction of relaxations, i.e. inward or outward, can be explained based on physical concepts as, for example, back-transfer of charge [Citation65]. Second, in terms of reconstructions, where the rearrangement of atoms leads to a change in the periodicity at the surface (possibly lowering its symmetry) and/or the number of atoms in the surface layer(s) is not conserved (grand canonical). Well-known surface reconstructions are the Herringbone reconstruction on Au(111) [Citation66] and the (7 × 7) reconstruction on Si(111) [Citation67]. Reconstructions may occur as a consequence of electronic effects, segregation or interactions with the environment. In this context, we also mention the preferential oxidation of alloying elements, one of the most important mechanisms for corrosion prevention [Citation68], such as in stainless steel as a prominent example, where a minimum of 10.5 wt.-% of Cr added to the iron matrix successfully prevents the material’s degradation [Citation69].
Computational work
The stabilisation of defects by solute segregation can be well understood by the extension of the Gibbs adsorption isotherm, e.g. as provided by Kirchheim [Citation70] and Weißmüller [Citation71]. Further, as shown in a fundamental study by Mishin and Frolov [Citation36], the mathematical concepts of phases, phase equilibria and phase rules can be naturally extended to low-dimensional systems such as line or interface/surface defects. Thus, all thermodynamic concepts including the construction and interpretation of thermodynamic phase diagrams can be directly extended to thermodynamic defect phase diagrams.
While the theoretical framework for describing defect phases, their coexistence and transitions is known, the extension of these considerations to complete defect phase diagrams is largely missing. Conceptional work in this direction has been performed under the label nano-Calphad by Kaptay [Citation72]. Starting from a consideration of the Gibbs phase rule, he highlighted that the meaning of tie lines needs to be changed for defect phase diagrams. That discussion is, however, focused on droplet formation on substrates and their specific geometric features. The most extensive attempts to extend the concept of phase diagrams towards defects have been performed in the context of grain boundary premelting, as for example summarised by Zhou and Luo [Citation73]. One of the first examples is the construction of so-called lambda diagrams [Citation74], which describe the thickness of intergranular films on the local composition. Those diagrams are modifications of bulk phase diagrams, where the limit of large intergranular film thickness corresponds to the presence of the liquid phase.
Modelling is a critical component in successfully leveraging the concept of defect phase diagrams. Work explicitly concerned with transitions between defect phases at surfaces is abundant [Citation75–80], but limited when it comes to the transition between defect phases in the bulk. For example in grain boundaries, the seminal simulation work of Frolov and co-authors on split kite/filled kite transitions [Citation34,Citation81], discussed also in ‘Grain boundaries in metals' in the last section of this review, was published less than ten years ago. One of the few examples is the use of defect phase diagrams for grain boundaries to study the onset of liquid metal embrittlement of Fe by Zn [Citation82].
However, there is a rich body of computational and theoretical work on the interaction of chemistry and structural defects. For example, the spectral nature of solute - grain boundary interaction [Citation83–85] has been explored by Zhou and Luo [Citation73], who provide efficient descriptions relevant for the stabilisation of boundaries in nanocrystalline materials [Citation86,Citation87] and also the high solute concentration regime where solute-solute interactions become extremely relevant [Citation88,Citation89]. Meanwhile, Mishin showed that, due to a mechanism like solute drag, the stability of grain boundary phases and their motion are strongly correlated [Citation90].
At the same time, the interaction of grain boundaries with dislocations has been identified in previous works as an important mechanism [Citation2–4,Citation53]. To study these interactions in detail, large scale simulations using molecular dynamics (MD) and phase field crystal have been employed [Citation91]. For example, Olmstedt et al. [Citation92] revealed that the pairing of individual dislocations can trigger a structural phase transformation in grain boundaries in bcc Fe.
The mention of defect phase diagrams in the literature is also not limited to planar defects. The experimental observation of linear (1D) defect phases has triggered computational studies on the phase stability of dislocation lines and dislocation segregation zones [Citation2,Citation53].
In the case of point defects, such as the doping in semiconductors, the objective is often a visualisation of the defect concentrations in bulk phases [Citation73,Citation93]. Similar to lambda diagrams for intergranular films discussed above, this is distinct from the concept of defect phase stability discussed in the present article. Nazarov et al. [Citation94,Citation95] have demonstrated that point defects can exist in different defect states, depending on the chemical potential of alloying elements. Similarly, defect phase diagrams have been also used to identify dominant point defect states that control the growth and dissolution of the oxide barrier layer on metal surfaces in contact with an aqueous electrolyte and to discuss consequences for corrosion, as well as strategies for its suppression [Citation96].
The modelling of atomic interactions in structural materials, including their underlying lattice defects, is of course a much broader topic in the field of crystal plasticity and phase transformations [Citation97–99]. In the context of defect phase diagrams, high throughput methods are particularly relevant to sample the multitude of different atomic configurations giving rise to the different defect states that develop under variable conditions such as changes in chemistry, underlying defect type and structure, temperature etc.
A high-throughput approach in computational materials science is driven by Beyerlein et al. [Citation97,Citation100], who are studying defect interactions with grain boundaries, as well as deformation mechanisms. Similar statistical approaches and computational frameworks to analyse the relationship between materials properties and microstructure from a thermodynamic and kinetic point of view have been developed by several groups [Citation101,Citation102]. Many of these predictive, high-throughput activities have been triggered by the ‘The Materials Genome’ initiative [Citation103], which includes the development of both computational and experimental tools for the development of novel material systems. These activities have covered a wide variety of applications, but so far these are dominated by functional rather than structural materials.
Defect phase diagrams: fundamental concepts, construction and application
As part of this review, we introduce and critically discuss the concept of defect phase diagrams, which form the natural link between the atomic scale knowledge of the structure and chemistry of defects and their resulting properties. We start from the well-known concept of bulk phase diagrams, which are one of the most powerful tools for alloy design available. Here, we aim to illustrate how defect phase diagrams may be understood as a fundamental concept, how they may be constructed and finally applied in alloy design. We will focus on highlighting the key concepts. For a detailed discussion on the underlying thermodynamic equations that quantitatively describe phenomena such as segregation or Gibbs adsorption at defects, we refer to Refs. [Citation36,Citation50,Citation104].
A comparison: bulk versus defect phase diagrams
Bulk phase diagrams predict the bulk phases that exist in a material at given temperature, pressure, electrode potential and chemical alloy composition in thermodynamic equilibrium. Measuring the occurrence of the various bulk phases in a given sample together with thermodynamic concepts enables the construction of phase diagrams. They link the complex phase information of advanced materials to these few easily accessible and controllable engineering variables. In this way, phase diagrams can be used to identify phases that relate to a particular mechanical or corrosive response, for example to relate reduced fracture toughness to the presence of an undesired phase. However, material properties are not only determined by the occurrence of specific phases and their spatial arrangement. In engineering materials, the crystal defects contained in and between phases, such as dislocations and grain boundaries, are similarly critical for the response to mechanical loads, corrosive attack or electric currents – and such defects are omnipresent.
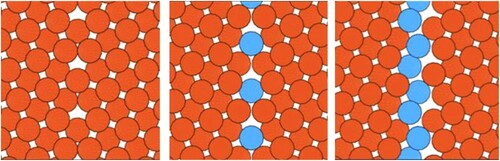
Defects can exist in different states characterised by chemical composition and structure at the atomic scale (). There is an ongoing discussion whether stable defect states should be termed defect phases in analogy to bulk phases. Arguments against this terminology are that they do not meet the conventional definition of a bulk phase [Citation50]: They are (i) spatially inhomogeneous (large concentration gradients), (ii) stable only at a given defect and cannot exist away from it, and (iii) may be confused with secondary bulk phases that may form in the vicinity of the defect. Thus, since the introduction of the term complexion [Citation46] for grain boundary states the term complexion has been the preferred expression.
Figure 2. Defect in different states given by its chemical and structural atomic complexity. Left: ‘textbook’ symmetrical tilt boundary without chemical complexity. From middle to right: Increasing structural and chemical atomic complexity giving rise to different defect states or phases as a second atom species is added.
However, there are also strong arguments in favour of calling them defect phases. First, the treatment of these confined states as true thermodynamic phases was provided by Frolov and Mishin [Citation36], who developed a rigorous mathematical framework for treating 1D, 2D, and 3D phases with a unified thermodynamic description. This demonstrates that the difference between the term ‘complexion’ and ‘phase’ in these lower dimensions is fundamentally semantic. Thinking directly in terms of Gibbsian phases, they do not only provide Gibbs adsorption isotherms for low-dimensional phases, but they also extend the Gibbs phase rule to treat phase coexistence for planar, line, and point defects. This work was performed for simple fluids, but the same authors have also developed the Gibbs-Duhem equation for the more complex case of coherent solid–solid interfaces under non-hydrostatic stress [Citation105] and thus provide a path for extending these principles to include the complex crystallographic considerations necessary for treating metallic systems. Second, for a specific set of defects – namely, surfaces – transitions between various thermodynamically stable surface structures were identified early on by experimental observations, e.g. on (100) surfaces in silicon [Citation106], and in ab initio calculations [Citation60,Citation75,Citation106]. Consequently, in research related to surface science or epitaxial and crystal growth, this analogy to bulk phase diagrams is well established and intensively used. Indeed, in publications related to surfaces the terms surface phases and surface phase diagrams are used frequently.
To maximally exploit the vast knowledge of conventional bulk thermodynamics, as well as to emphasise the unifying approach for all defect types (including surfaces and point defects), we will systematically employ the terms defect phase and defect phase diagram. This allows us to more easily analyse which experimental and computational methodologies are available and which further tools need to be developed to provide a framework for constructing defect phase diagrams, i.e. in what continuous region of controlvariables a specific defect state is thermodynamically stable.
For surfaces, a special notation for defect states is commonly used. If the surface state conserves the symmetry of the bulk truncated surface, it is called relaxation, and reconstruction if the symmetry is lowered. As outlined below, this classification automatically implies that each defect comes with its own phase diagram.
Defect phases, as defined above, are spatially confined to the vicinity of the defect and characterised by a discontinuous change of the atomic structure and/or composition when modifying local or global thermodynamic control variables such as temperature, mechanical stresses, or chemical potentials.
Because of this intrinsic connection to the defect geometry, we emphasise that separate defect phase diagrams are necessary not just for each defect type, but also for each character within these types. One effective way to represent information across multiple defect characters is the Wulff construction [Citation107], which is conventionally utilised in the realm of surfaces [Citation108, Citation109], but is also easily extendable to other defect types. The Wulff method provides equilibrium crystal shapes subject to the environmental conditions by utilising the surface energy and surface normal of each surface orientation (i.e. defect character, cf. ) associated with the surface (i.e. defect type, cf. ) of a material. In the context of defect phase diagrams, the chemical state of each defect character must also be considered (discussed in detail in the following section), analogously to the Wulff dependence on pH and potential, e.g. in Ref. [Citation108]. The Wulff construction is also limited to describing competition between defects of different character but the same type, and new representations will be needed to efficiently describe competition across defect types.
Table 1. Essential keywords in the context of defect phase diagrams.
Systematically identifying defect phases and constructing their diagrams poses severe and fundamental challenges that need to be addressed and overcome:
Experimental tools to identify defect phases in the bulk or in corrosive environment and resolve their chemistry and structure concurrently at the atomic scale are still in their infancy.
In contrast to the bulk, where only a single phase diagram exists, many more defect phase diagrams are required:
o a separate phase diagram needs to be constructed for each defect type and character (see also ). This applies to every orientation of a surface, grain or phase boundary and character of a dislocation.
o the same defect character in one bulk phase requires a separate phase diagram in another bulk phase. For example, the atomic structure of a dislocation in a solid solution and an intermetallic phase of the same (binary or higher order) system is different, even in the undecorated state.
For bulk phase diagrams, sophisticated thermodynamic concepts have been developed that allow us to construct these diagrams from a rather small number of experimentally measured data points. An example is CALPHAD, which enables materials engineers to construct phase diagrams even for alloys consisting of five or more elements. Analogous concepts and tools for defect phase diagrams are lacking.
Ab initio computational techniques have evolved into powerful tools to augment and support the construction of bulk phase diagrams at finite temperatures. However, these methods are limited to small supercells containing merely a few hundred atoms, which prevents them from identifying many defect phases.
The local concentration of each element can vary significantly among the defect phases. Because various defects with their respective defect phases are distributed throughout the sample, chemical concentration is spatially inhomogeneous. This makes concentration unsuitable as a thermodynamic state variable for defect phase diagrams.
The chemical potential as key variable
Replacing the concentration of an element by its chemical potential as the thermodynamic state variable allows us to overcome many of the limitations addressed in the last point above [Citation110,Citation111].
First, in thermodynamic equilibrium, the chemical potential is a constant and identical at the defect, in the bulk, and in the environment, which can be a reactive atmosphere or a corrosive liquid. This characteristic is identical for the temperature, whereas the chemical composition can vary over several orders of magnitude. Thus, the chemical potential provides a convenient and direct comparison between various defect types, the bulk, and the environment [Citation112].
We note that for substitutional configurations the chemical potential difference (sometimes called the diffusion potential [Citation50]) is the correct intrinsic quantity, in contrast to fluid systems where the chemical potential is the correct one. This important distinction has first been made by Larche and Cahn [Citation104] and can be easily understood. When substituting element on a given site by element
, the system cannot probe the two chemical potentials
and
separately but only together. Keeping in mind that the interaction with the chemical potentials is described by
and that for the above substitution
(atom
has to be removed from the site) and
(atom
is taken from its reservoir and added on this site) only the difference
appears. Thus, rather than having two independent intensive control variables
and
, only a single variable
remains. For multicomponent systems the above discussion can be easily extended by referencing all potentials with respect to the first one:
with
.
The chemical potential is constant across any defect phase, its matrix and surroundings and intrinsically includes temperature dependence in thermodynamic equilibrium. It therefore presents an identical coordinate system (µ-space) for all defect phase diagrams.
Second, the principal part of the temperature dependence is implicitly included in the chemical potential via configurational entropy. Only temperature-induced differences in the electronic, magnetic and vibrational entropies, which are commonly small and second order effects, will give rise to an additional (smaller) explicit temperature dependence.
Third, the concept of chemical potentials is straightforwardly extended to phase transitions involving electronic charge transfer or protonation [Citation113]. The corresponding potentials are the electron chemical potential (Fermi energy) and the pH value. These generalisations allow a direct connection of the defect phase diagrams to corrosion science in liquid and gaseous environments.
Alongside the chemical potential, the strain is also an intensive variable that has a strong impact on defect stability and state. The reason is that the defect is geometrically confined in the bulk matrix, which thus enforces its lattice constant on the defect. For example, in general a surface or a coherent interface will be laterally strained. This is in direct contrast to bulk phase diagrams where, for many practical applications, the impact of pressure can be disregarded. Indeed, several studies highlight the importance of strain on the stability and coexistence of defect phases. Examples include the strain-mediated coexistence of the (1 × 1) and (7 × 7) Si(111) surface phases [Citation114], the concept of disconnections for interfaces [Citation115], or the recently described Kosterlitz-Thouless topological phase-transition in the context of grain boundaries [Citation116]. Therefore, any accurate description of defect energetics and thermodynamics requires an explicit inclusion of strain effects due to geometric confinement. However, the impact of strain is expected to be substantially smaller than the impact due to changes in the chemical potential.
We therefore propose to use the chemical potential as the central variable: It is constant across any defect phase, its matrix and surroundings and intrinsically includes temperature dependence. It therefore presents an identical coordinate system (which we will refer to as µ-space) for all defect phase diagrams.
Construction of defect phase diagrams and their relation to mechanisms and properties
A major advantage of the constancy of the chemical potential is that all defect phase diagrams have an identical coordinate system (μ-space, see also ). Thus, for a given experimental sample, knowing its internal (chemical composition) and external (environment) chemical potentials and temperature is sufficient to identify its location in any of the defect phase diagrams. Furthermore, the concept of an identical coordinate system can be applied not only to phase diagrams but also to what we refer to as ‘mechanism-property diagrams’. These diagrams have the same coordinate system as defect phase diagrams, but do not show transitions between phases. Instead, they indicate disruptive changes in mechanisms, e.g. change of the dominant slip system or oxide formed during corrosion. Since the coordinate system in μ-space is identical, causalities and correlations between the formation of specific defect phases and abrupt changes in the mechanism-property diagrams can be detected straightforwardly. For example, a discontinuous transition from a dislocation defect phase with low to high solute incorporation may make these dislocations immobile, changing the mechanical response from ductile to brittle.
Table 2. Definitions of suitable ‘spaces’ connecting fundamental experiments, the underlying defect phase and the resulting engineering properties.
While the common coordinates in μ-space are very convenient for constructing and comparing (defect) phase diagrams, the actual experiments in the laboratory and in silico are performed using different quantities: samples are characterised by the global and also local chemical compositions (experimental space, cf. ) and bulk material properties considered by engineers are commonly given as a function of physical quantities such as uniaxial stress, strain rate, pH or temperature (engineering space, cf. ). Therefore, the different parameters used in the scientific communities need to be connected. The chemical potential is the common fundamental variable that allows a seamless transfer and unification of these quantities. The chemical potential is identical for all defects, the bulk and the environment in equilibrium. Therefore, a subsystem in which it becomes experimentally easily accessible can always be chosen. In the bulk, the chemical potential is given by the temperature and chemical composition that is accessible at different scales. Similarly, at the surface, the chemical potential of extrinsic impurities such as oxygen or hydrogen can be determined by measuring the oxygen or hydrogen partial pressure in the gas phase or the pH-value in the solvent that is in contact with the sample. Conversely, the chemical potential can be translated back into parameters that are applicable in engineering processes, such as annealing temperature, bulk composition, and pH of the environment.
Practical construction of defect phase and mechanism-property diagrams
In this section, we use the example of dislocation-mediated plasticity to illustrate how the comprehensive framework discussed above might be realised in a practical scenario. With this example, we will demonstrate the connection of the different experimental and computational variables with the chemical potential and the underlying defect phases. This work-flow could apply in the same manner to any type of defect and the related physical mechanisms in corrosion and mechanics.
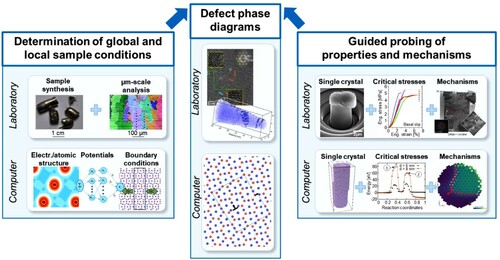
A key element enabling the construction of defect phase diagrams is the characterisation of defect phases at the atomic scale (). To achieve this, the samples first have to be defined (in computations) or characterised (in experiments) to determine the global and local sample conditions. In the experiments, this involves the measurement of the crystallographic phases and orientations with the chemical compositions resolved at the µm-scale. In computations, the boundary conditions of the supercell, structure and potentials need to be defined.
Figure 3. Construction of defect phase diagrams using dislocations in intermetallic phases as an example. Theory and experiment work together synergistically to create defect phase diagrams.
Following these initial steps, the work-flow in experiment and computation would differ:
In computations, the energies of different defect states can be computed and compared to identify the stable defect phase, e.g. the structure and chemistry of an 〈 a 〉 type dislocation core in a hexagonal lattice structure. Once the stable defect phase has been identified, dynamic simulations can be used to investigate its mechanisms and the resulting properties. In the example of dislocation-mediated plasticity, this would involve the identification of the mechanisms of motion of the dislocation defect phase and the related critical stresses.
In experiments, the atomic scale characterisation of the defect phase can be realised by high resolution methods like APT and HR-(S)TEM. However, these are time-intensive and can only be applied to carefully selected samples. For this reason, a strategy enabling ‘guided probing’ seems wise. For this, abrupt changes in the properties or mechanisms could be used as guidance to select samples for high resolution analysis of the underlying defect phases.
In the case of dislocation-mediated plasticity, as a first step, conducting mechanical testing of single crystals with selected crystallographic orientations towards the loading direction would allow the determination of critical stresses for dislocation glide. In ductile metals, these may be done by conventional crystal growth and uniaxial testing, while in brittle materials, compression of micron-sized specimens yields the same information ().
An abrupt change in the measured stresses with changing chemical potential (defined by composition and testing temperature) would then indicate a change in either the prevalent dislocation defect phase or the active mechanism of the same defect phase, for example a transition from glide on basal to glide on pyramidal planes. Scanning electron microscopy (SEM) and conventional TEM may be used to assess the presence of dislocation defect phases, their glide planes and mechanisms of motion. Where abrupt changes of properties and/or mechanisms are observed, subsequent high-resolution experiments (HR-(S)TEM, APT) can be used to measure the local structure and chemical composition of the dislocation defect phase and its surroundings.
With the same kind of data – structure and chemistry of defect phases, their mechanisms and related properties – now available in experiment and computation, defect phase diagrams could be populated. Similarly, the identified mechanisms could be used to populate the corresponding mechanism-property diagrams. For this, the measured local composition and temperature must be translated into the local chemical potential, unifying all defect phases, mechanisms and properties on a single set of coordinates.
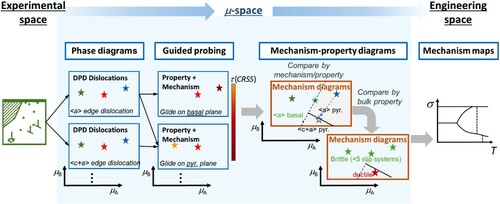
The defect phase diagrams are then linked to one or several mechanism-property diagrams that identify the possible defect phase mechanisms. Following the example given above, these may be (i) glide of one dislocation type (e.g. 〈 a 〉) on two potential glide planes (basal or pyramidal), or (ii) glide of two dislocation types (〈 a 〉 and 〈 c+a 〉) on one glide plane (pyramidal). Based on these mechanism-property diagrams, the prevalent mechanisms observed under given conditions may be identified and predicted from the competition of all possible defect phase mechanisms (). For example, one might compare in one diagram the prevalence of individual glide planes, or, in another diagram, the resulting polycrystalline deformation behaviour, e.g. in terms of ductile isotropic deformation or more brittle and anisotropic deformation. Similarly, the competition between brittle failure by cracking and ductile deformation may be considered by comparison of the respective energies of crack growth and dislocation motion. Ultimately, the identified mechanisms and related energies can be translated into the engineering space in the form of application-specific maps for materials selection, e.g. Ashby deformation mechanism maps [Citation117].
Figure 4. Continuous translation from experimental space to µ-space
to engineering space using the same example as above, dislocations in a hexagonal structure. The defect phase diagrams (DPDs) (µ-space) are connected with the mechanism maps (engineering space) via mechanism-property-diagrams (µ-space). The latter can be generated from the defect phases and their measured and computed properties and mechanisms (obtained by guided probing) to reflect a competition of choice between different mechanisms (here the competition between different slip systems and the resulting deformation behaviour).
We hope that this formulation of the challenges in linking and describing defect phases and the resulting mechanisms and properties in a general way is a useful step towards a comprehensive framework containing all types of defect phases and related mechanisms in terms of mechanics and corrosion. The structure of this proposed framework is illustrated in .
Figure 5. Visualisation of the complete framework linking all types of defect phase diagrams and defect phase properties from experimental space across µ-space to engineering space. DPD: defect phase diagram; µ: chemical potential.
Defect phase diagrams for materials design: from equilibrium to transients
A fundamental prerequisite for constructing phase diagrams is that, for a given set of state variables, we can identify the energetically most stable defect state. In simulations, this requires the development of computationally efficient tools to systematically scan over the extensive range of possible defect structures and compute for each structure its Gibbs energy as function of chemical potentials, temperature, pressure etc. In experiments, to ensure that the defect is in its thermodynamic ground state, this requires that the sample is thermodynamically equilibrated, i.e. that the sample is exposed sufficiently long to the targeted temperature that further annealing will not change its defect structure. A complication when considering defects like dislocations or interfaces is that they are non-thermodynamic defects, i.e. in contrast to vacancies they should, theoretically, completely disappear in a fully equilibrated sample, although of course this state is not usually observed in reality.
Conceptionally, the various stages a defect undergoes and its phases are sketched in . In the initial state, undecorated defects provide energetically favourable positions for solute atoms. The resulting energetic driving force facilitates solute atoms to accumulate/segregate at the defects. This stage is a ‘transient state’, as sketched in the potential energy landscape in . Diffusion of the alloying atoms towards the defects makes the system energetically more stable. When the alloying elements at the defect reach a critical concentration, a metastable equilibrium between atoms at the defect and atoms in the matrix is established (termed ‘chemically equilibrated defects’ in ). This equilibrium is spatially localised in a region given by the diffusion length of the solute atoms and will be referred to as ‘local equilibrium’. In this region, the chemical potentials of all alloying element species are constant.
Figure 6. Schematic represerntation of the stages of defect equilibration: potential energy vs. reaction coordinate.
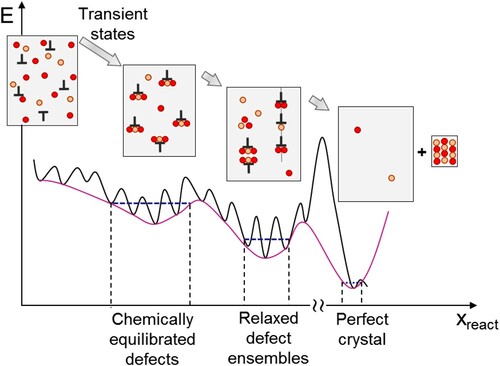
The presence of a metastable local equilibrium indicates that the system has sufficient time to equilibrate and realise a condition of constant chemical potential around the defect. Since this stage is only metastable, at long time scales and/or at higher annealing temperatures the system can gain energy by eliminating some of the defects (e.g. annihilation of dislocations with opposite Burgers vectors or reduction of grain boundaries by coarsening) or by aggregating multiple defects into defect ensembles (e.g. dislocations forming a low angle grain boundary). These relaxed structures again represent defect phases, each of which may have a different local chemical structure. The final stage comprises the thermodynamic ground state (single crystals with equilibrium concentration of point defects; last box in ). Experimentally, this stage is usually irrelevant in structural materials, as it is not reached.
An important consequence of focusing on individual defect equilibration is that the concept of defect phase diagrams can be applied even if the sample is not in full thermodynamic equilibrium. The only condition needed is that the defect is locally equilibrated with its surrounding matrix. Employing this concept of local equilibrium not only relaxes the effort to achieve fully equilibrated samples but also opens the way to describe non-equilibrium phenomena and transient states. This ability is crucial in order to apply any framework to real world structural materials, which are commonly far away from global equilibration. The description of local equilibrium and transient state is then conceptionally equivalent, if we consider the atomic scale of defects, to the use of conventional (equilibrium) phase diagrams in conjunction with TTT-diagrams in the bulk.
This bottom-up engineering from the atomic scale of defects should not remain an abstract concept, as it can be directly applied to challenging situations in materials design and selection where multiple physical mechanisms have to be considered. Furthermore, the strict kinetic and thermodynamic link between global composition and local defect phases would make most of the defect phases accessible by ordinary processing methods available to the materials scientists and engineers, such as deformation and heat treatment.
Specific examples of defect phases and their thermodynamics
In the following, selected examples of the interaction of solute atoms with structural defects will be presented. We will start with an overview of the diversity of concepts for defect phase diagrams – or often called complexion diagrams – reported in the literature. Afterwards, we will use two examples to explain the concepts of defect phase diagrams underlying the considerations in the previous section in more detail. Here, we will review the local hydride formation at dislocations in nickel as an example of the formation of 1-D defect phases. As examples for 2-D structural defects we will focus on surfaces, where different structures have been considered for a long time, taking Pd and Zn surfaces and their interaction with oxygen as examples.
Examples of defect phase diagrams
As already mentioned in the ‘Review of experimental and computational evidence of defect phases and associated theoretical concepts' above, the term defect phase diagram is occasionally used in the literature in order to visualise the concentration of defects (mainly point defects) in certain bulk phases [Citation93], which is not the approach discussed here. Furthermore, a common way to discuss the stability of defect phases as a function of composition is to overlay bulk phase diagrams with corresponding data for the phases. This is often used for grain boundary complexions, as in the example of Cantwell et al. [Citation18] shown in (A). A generalisation of such an approach has various disadvantages. One of them is that the large number of thermodynamic degrees of freedom for certain defect characters can hardly be represented in a single two-dimensional diagram. Averaging over different defect characters often imposes a generalisation that is not valid. It is, for example, possible that certain defect types are only relevant in one selected bulk phase. The technique of overlaying bulk phase diagrams has been refined by Shi and Luo [Citation74] for binary as well as by Zhou and Luo [Citation73] for ternary systems, in their study of premelting-like grain boundaries. Using as a parameter for the effective interfacial width, lines of constant
have been constructed starting with single-phase properties and extending the concept subsequently to secondary precipitate phases ((B, C).
Figure 7. Selected approaches to visualise defect phase diagrams. (A) Experimental phase diagram for the Al2O3-Y2O3 system indicating stability regions of low T and high T complexions as well as their coexistence [Citation18]. Computed diagrams for effective grain boundary (GB) width (GB λ diagram) in (B) the Mo-Ni [Citation74] and (C) the W-Ni-Fe systems [Citation73]. (D) Phase diagram of the Cu-Zr system highlighting the stability of ordered (yellow) and disordered (magenta) linear complexions as function of global and local composition [Citation5]. (E) Phase diagram for the WC/Co interface where different stackings have been distinguished. The diagram is plotted as function of the chemical potential of cubic VC doping [Citation119]. Images reprinted with permission from Elsevier, Wiley and the American Physical Society from A [Citation18], B [Citation74], C [Citation73], D [Citation5], E [Citation119]. Reuse not permitted.
![Figure 7. Selected approaches to visualise defect phase diagrams. (A) Experimental phase diagram for the Al2O3-Y2O3 system indicating stability regions of low T and high T complexions as well as their coexistence [Citation18]. Computed diagrams for effective grain boundary (GB) width (GB λ diagram) in (B) the Mo-Ni [Citation74] and (C) the W-Ni-Fe systems [Citation73]. (D) Phase diagram of the Cu-Zr system highlighting the stability of ordered (yellow) and disordered (magenta) linear complexions as function of global and local composition [Citation5]. (E) Phase diagram for the WC/Co interface where different stackings have been distinguished. The diagram is plotted as function of the chemical potential of cubic VC doping [Citation119]. Images reprinted with permission from Elsevier, Wiley and the American Physical Society from A [Citation18], B [Citation74], C [Citation73], D [Citation5], E [Citation119]. Reuse not permitted.](/cms/asset/e12d0ff1-628e-4b9a-be96-47b75c87826a/yimr_a_1930734_f0007_oc.jpg)
Several publications focussed on a single bulk phase and distinguish different defect phases of the same type therein. One example is the discussion of linear defect phases connected to dislocations by Turlo and Rupert [Citation5]. The principal concept is similar to the discussion of Ni hydrides in the next section. Noteworthy is, however, that within this example the better representation of the diagram in terms of local chemistry has already been highlighted ((D)). An equilibrium of global and local chemistry is obtained, if the chemical potential is used as intrinsic thermodynamic variable. Indeed, this concept has already been emphasised in several conceptional works [Citation70,Citation118]. However, there have been only a few examples in the literature, where a defect phase diagram of a real material system has been plotted as a function of chemical potential. One example is given in (D), where the chemical potential corresponds to a doping level of VC in WC [Citation119].
In summary, the concept of defect phase diagrams has been successfully applied and further developed by several groups for different defect types. We therefore suggest that a comprehensive framework must now be within reach, as outlined above in section 3 on ‘Defect phase diagrams: fundamental concepts, construction and application', that considers all types of defects in competition and which could therefore be used for materials design in the future.
Local hydride formation at dislocations in nickel
A major challenge in studying and characterising dislocations by experimental techniques is their 1-dimensional character. Due to the experimental challenges, our understanding and insight into defect phases at dislocations is still in its infancy. The main concept, which is still used today, has been developed and pioneered in 1949 by Cottrell and Bilby [Citation52]. This concept builds on the assumption that alloying elements experience a stronger binding and thus an attractive interaction in the elastically strained regions around a dislocation. This enhanced concentration forms an atmosphere around the dislocation – the well-known Cottrell atmosphere. This pioneering concept had a tremendous impact on qualitatively explaining phenomena related to dislocation kinetics. However, since it is based on the assumption that the Cottrell atmosphere is a solid solution, it lacks, by its very construction principles, all aspects related to phases, such as the presence of various crystallographic structures or chemically ordered line-compounds.
Modern ab initio and atomic scale techniques allow the systematic exploration of thermodynamic phases and phase stability not only for crystalline bulk systems but also for defects [Citation4,Citation5,Citation120]. While the number of such studies is still very limited, the first examples already show that, even for line defects, the chemical and structural complexity can be very involved. As a prototypical example, here we will discuss the defect phases that emerge at an edge dislocation in fcc Ni-bulk in the presence of H. Similar to a bulk phase diagram, where the thermodynamically stable phase is shown for contiguous regions of composition and temperature, the dislocation defect phase diagram shows the thermodynamically stable defect phases. There are several reasons for choosing this system: its bulk phase diagram is available, as are detailed calculations on the defect structure, and it is technologically relevant as an example for hydrogen embrittlement.
Consider the bulk phase diagram of x-T-Ni-H () which has been constructed from ref. [Citation121]. This diagram shows only two phases: a solid-solution phase, where H is interstitially dissolved in fcc-bulk Ni, and at high H concentrations a miscibility gap, where bulk Ni coexists with a H2 gas. Note that Ni-hydrides are not present in the equilibrium bulk phase diagram, implying that they are thermodynamically unstable at ambient pressure.
Figure 8. Combined defect and bulk phase diagram of Ni-H. The insets show the bulk and defect phases at the atomistic scale. The data for the bulk phase diagram are taken from [Citation121] and for the defect phase diagram from [Citation120].
![Figure 8. Combined defect and bulk phase diagram of Ni-H. The insets show the bulk and defect phases at the atomistic scale. The data for the bulk phase diagram are taken from [Citation121] and for the defect phase diagram from [Citation120].](/cms/asset/0c49a1d9-0a17-43b3-9213-9d48cd2595ad/yimr_a_1930734_f0008_oc.jpg)
Having discussed the bulk phase diagram, let us now consider the interaction of H with dislocations. Since interstitial H interacts with dislocations predominantly via hydrostatic dilatational strain, we focus on edge dislocations [Citation122,Citation123]. Due to its relevance as prototypical system for studying and understanding H embrittlement, this system has been extensively studied. Early computational studies were based on continuum models and assumed the formation of a Cottrell atmosphere resulting in H concentrations that are up to an order of magnitude higher than in the bulk [Citation124]. Subsequent atomistic studies included not only impurity-dislocation interactions, as in the continuum model, but also impurity-impurity interactions [Citation120,Citation125]. For the Ni-H system these studies revealed an attractive H-H interaction resulting in the formation of defect phases that had so far not been considered or assumed to be possible. The results of these studies are shown in combined with the bulk Ni-H phase diagram.
At low H concentrations (green shaded region), the local H concentration is enhanced but the H atoms are on average still separated by a few lattice constants. This behaviour is the atomistic representation of a Cottrell atmosphere. With increasing H concentration, or going towards lower temperatures, an abrupt phase change occurs. In this concentration-temperature region, which is marked by red dashes, the attractive H-H interaction dominates, leading to the formation of a local hydride around the dislocation core. In this spatial region, the H concentration can be more than 5 orders of magnitude higher than in the bulk. Such a huge enhancement of H is also several orders of magnitude higher than what can be explained by a Cottrell cloud. Thus, in full analogy to a gas-bulk phase transition, here we see the transition from a lattice gas of interstitial H atoms into a bulk-like hydride phase.
It is tempting to conclude that the local hydride is not a defect phase but simply a (heterogeneous) nucleus of a hydride. However, as can be seen from the Ni-H bulk phase diagram, hydrides are completely absent and thus thermodynamically unstable. Indeed, when removing the edge dislocation but initially keeping the local hydride, it quickly dissolves and forms a homogeneous lattice gas.
Looking at the atomistic structure of the two defect states it becomes obvious that it is not just the arrangement of impurities that changes (from a lattice gas to a hydride), but the structure of the defect itself can dramatically change. While in the case of a Cottrell atmosphere the two dislocation partials show a large separation, after the transition to the hydride state, this separation is distinctly reduced. Thus, for a realistic description of defect states, it is not sufficient to only optimise the energy with respect to the distribution of the solutes, but to also simultaneously consider changes in the defect geometry. The dramatic variations in the defect state with respect to chemistry and structure can substantially modify the formation and kinetics of such defects [Citation126].
To combine the defect phase diagram with a conventional binary bulk x-T phase diagram, we have used the conventional state variables temperature and concentration. As pointed out in the section above on 'The chemical potential as key variable', a better state variable to express defect phase diagrams is the chemical potential. Indeed, the curved boundary between the lattice gas and the hydride phase represents a line of constant H chemical potential . Thus, the 2-dimensional phase diagram shown in collapses into a 1-dimensional phase diagram in µ-space ().
The above example nicely demonstrates all the features of a defect phase diagram: (i) An abrupt transition in structural/chemical configuration when continuously changing the state variables, (ii) the presence of structures that are absent (thermodynamically unstable) in the bulk phase diagram, (iii) the structural/chemical changes are spatially confined to the vicinity of the defect and do not grow with time and (iv) the conceptual advantages one gains when expressing these diagrams in µ-space. While we have focused in the above discussion on a specific example – the defect phase diagram of an edge dislocation in Ni-H – the described concepts are general and valid for arbitrary materials with crystalline structure.
Surfaces in oxidising environment
Surfaces are the materials defects where periodic atomic arrangements deviating from the bulk environment have been observed for decades. Such reconstructions, i.e. surface states, have been discussed during the last 30 years in the context of defect phase diagrams [Citation60,Citation75,Citation127]. Reconstructions, which are observed at the pristine surface (i.e. the surface contains only atoms that are present in the bulk, but not as contaminants) can be lifted or altered following interactions with the environment (be it gas phase or electrolyte), with which the surface is in close contact. As a consequence of such interactions, different surface states may be stabilised under different environmental conditions, forming surface phases. Combining density functional theory calculations with thermodynamic concepts to construct surface phase diagrams has been extremely successful in revealing the conditions under which given surface phases form [Citation60,Citation128,Citation129]. Occasional deviations between calculated surface phase diagrams and experimentally measured phases usually reveal the presence of metastable or kinetically stabilised surface reconstructions [Citation129,Citation130].
At the base of any calculated surface phase diagram lies the evaluation of differences in the Gibbs free energy between two surface states, i.e. the considered surface reconstruction α and a reference phase, which is usually chosen to be the pristine surface. This difference ΔG is evaluated in dependence on the environmental conditions (e.g. partial pressure of a gas phase, temperature, electrode potential, pH …), which are characterised by the chemical potentials, μ, of the respective species i:
The unit cell associated with one surface reconstruction may be vastly different from the unit cell associated with another one. For this reason, the change in Gibbs free energy is normalised per surface area. Then ni is the number of chemical species i in the considered surface area, which have been exchanged with the reservoir μi.
To be more specific, we will focus on metal surfaces in oxidising environment. In particular, we discuss several scenarios and possible surface reconstructions which are encountered as the chemical potential is varied over the experimentally accessible range. We first consider Pd surfaces in contact with an oxygen atmosphere. Evaluating the Gibbs free energies for surface reconstructions on both the Pd(111) and the Pd(100) surfaces we construct the corresponding surface phase diagrams – one for each surface orientation, as eluded to in the preceding. In both diagrams seen in , the change in the Gibbs free energy, ΔG, is plotted as a function of the oxygen chemical potential, μO. The surface phases correspond to the surface states with the lowest Gibbs free energy. Thus, the envelope (red line) depicts the respective surface phase diagram. The respective pristine relaxed surface is taken, in each case, as reference. Since it contains no oxygen atoms, the line characterising this surface state is found at ΔG = 0 meV Å−2 and shows no dependence on μO. As the oxygen chemical potential increases, which corresponds to an increase in the oxygen partial pressure in the environment (at a given temperature), oxygen containing surface states become stable.
Figure 9. Change in the Gibbs free energy with oxygen chemical potential for Pd surfaces in contact with an oxygen atmosphere. Red lines depict the respective surface phase diagrams.
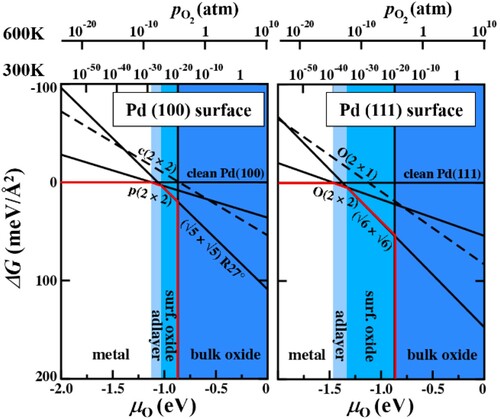
On both Pd surfaces a low coverage oxygen adsorbate structure appears in the phase diagram. This is a 0.25 monolayer (ML) O structure, in which the Pd atoms in the first surface layer remain in the lateral positions they occupy on the pristine surface, the number of Pd atoms is conserved, but due to the 0.25 ML (i.e. ¼ of the amount of Pd atoms in the surface layer) oxygen atoms adsorbed in the fcc hollow position in a regular pattern the surface periodicity is changed. As the oxygen chemical potential is increased further, a surface oxide phase forms. In these reconstructions, the Pd atoms in the surface layer no longer occupy the same lateral positions, as in the pristine surface, and their number is not necessarily conserved. Together with the adsorbed O atoms they form a PdO-structure which does not resemble a surface facet of PdO bulk (as is the case for the surface oxide on the Pd(111) surface [Citation131]) or resembles a high energy surface facet of the PdO (as in the case of the surface oxide on the Pd(100) surface [Citation132]). At even higher oxygen chemical potentials we enter the region in which the bulk oxide phase becomes the most stable phase. Within this region we enter the realm in which a separate surface phase diagram needs to be constructed to investigate the stable surface phases forming at the oxide surface, in particular also because the respective metal surface is no longer a good reference state.
Surface phase diagrams of oxides are often incredibly rich, as seen by the example of a surface phase diagram for the (0001) surface of ZnO in contact with a humid oxygen atmosphere. Here, we consider the variation of two chemical potentials, μH and μO. The calculated surface phase diagram is shown in and depicts the most stable surface phase at any given condition, each shown as a region with a different colour. To facilitate easy comparison to experiment, it is often convenient to convert the chemical potential axis to experimentally easy to access quantities such as temperature and pressure, as discussed above in the section on ‘Construction of defect phase diagrams and their relation to mechanisms and properties'.
Figure 10. Surface phase diagrams for a ZnO(0001) surface in contact with a humid oxygen atmosphere. Differently coloured regions mark the stability regions of different surface reconstructions. The white dashed area indicates the region where water condensates at the surface. Geometries of the stable surface structures are shown as insets. Adapted from [Citation133] with permission from the American Physical Society. Reuse not permitted.
![Figure 10. Surface phase diagrams for a ZnO(0001) surface in contact with a humid oxygen atmosphere. Differently coloured regions mark the stability regions of different surface reconstructions. The white dashed area indicates the region where water condensates at the surface. Geometries of the stable surface structures are shown as insets. Adapted from [Citation133] with permission from the American Physical Society. Reuse not permitted.](/cms/asset/cfe2f287-9059-431d-b735-e834f801f63d/yimr_a_1930734_f0010_oc.jpg)
Vibrational entropy contributions from the surface atoms are usually negligible compared to the large translational, rotational, configurational entropy contribution from gas phase atoms (cf. section ‘The chemical potential as key variable'), which are accounted for via the chemical potential. This allows us to substitute, e.g. the respective µ-value by the pressure at a given T, but the phases appearing within the phase diagram remain unchanged, as seen in . There are, however, exceptions: In the case of ZnO, the vibrational entropy contributions of the surface atoms have a qualitative impact on the stability of surface defect phases. As a consequence, the surface defect phase diagrams become explicitly temperature dependent, as seen in .
Specific examples of defect phases and their impact on material properties and potential in materials design
As discussed above, we expect the formation of defect phases with their structural and chemical atomic complexity to be the norm rather than the exception in alloys of both metallic and non-metallic systems. In many cases, evidence for structural and chemical atomic complexity has been observed, but so far, only a rather small selection of these defects has been considered thermodynamically as defect phases. Here, we therefore also present a selection of cases in which complex defects have been observed and present great potential for future materials design – even more so if their formation is systematically unravelled, described, understood, and ideally predicted within a conceptual framework like defect phase diagrams.
Local transformations of dislocation cores in Fe-Mn steel
Metals derive their characteristic formability primarily from the formation and motion of dislocations. Recently, it was observed that the cores of these linear lattice defects are not only characterised by their well-known complex structural distortion fields but that they can also undergo structural transitions, driven by their chemical decoration [Citation2,Citation3], . These transitions create characteristic dislocation core structures that differ from those in undecorated dislocations [Citation4,Citation5,Citation53].
Figure 11. Fe–9 atomic % Mn solid solution, 50% cold-rolled and annealed at 450°C for 6 h to trigger Mn segregation. (A) Bright-field STEM image. (B) Correlative atom probe tomography results of the same tip shown in (A) using 12.5 atomic % Mn isoconcentration surfaces (12.5 atomic % Mn was chosen as a threshold value to highlight Mn-enriched regions). The blue arrows mark grain boundaries and dislocation lines that are visible in both the STEM micrograph and the atom probe tomography map. Not all dislocations visible in STEM are also visible in the atom probe data and vice versa (red arrows). (C) Overlay of (A) and (B). (D) Magnification of two subregions taken from (B). (E) 1D compositional profiles along 1 (perpendicular to dislocation line) and 2 (along dislocation line). Reprinted with permission from AAAS, Ref. [Citation3].Reuse not permitted.
![Figure 11. Fe–9 atomic % Mn solid solution, 50% cold-rolled and annealed at 450°C for 6 h to trigger Mn segregation. (A) Bright-field STEM image. (B) Correlative atom probe tomography results of the same tip shown in (A) using 12.5 atomic % Mn isoconcentration surfaces (12.5 atomic % Mn was chosen as a threshold value to highlight Mn-enriched regions). The blue arrows mark grain boundaries and dislocation lines that are visible in both the STEM micrograph and the atom probe tomography map. Not all dislocations visible in STEM are also visible in the atom probe data and vice versa (red arrows). (C) Overlay of (A) and (B). (D) Magnification of two subregions taken from (B). (E) 1D compositional profiles along 1 (perpendicular to dislocation line) and 2 (along dislocation line). Reprinted with permission from AAAS, Ref. [Citation3].Reuse not permitted.](/cms/asset/26711992-854c-485d-9d1f-bf7eba1c13e7/yimr_a_1930734_f0011_oc.jpg)
Cases where such chemical–structural states exist only in the inner regions of the dislocations and cannot expand into the adjacent matrix are 1D defect phases, frequently referred to as ‘linear complexions’ [Citation3]. This means that the chemically induced structural transformation is only occurring at the defect, but it is not in reach for the matrix. The origin of such confined, low-dimensional transitions is similar for the other defect transitions discussed in this article: first, when allowing diffusion in an otherwise homogenous solid solution, the dislocation cores attract solutes, a process that lowers the system energy. In a grand-canonical scheme, the decoration proceeds until the same chemical potential is reached for the solutes inside and outside of the dislocation core region. The energy gain for solutes to decorate dislocation cores is usually high, particularly for solutes with larger size relative to the matrix atoms, owing to the strong distortion fields inside of the line defects. Second, when saturation is reached it can, in certain cases, be energetically preferential to transform the core of the dislocation into a different structural state, because of the local high solute concentration [Citation2].
Dislocation defect phases were experimentally observed in Fe-9 at.-% Mn steels. The materials were first homogenised at 1100°C and subsequently water quenched, followed by cold-rolling to 50% thickness reduction. This treatment lead to a homogeneous solid solution and a sufficiently high dislocation density.
To drive chemical decoration, the material was heat treated at 450°C for 6 h. It was then analysed with a correlative approach using atom probe tomography to quantify the chemical decoration state of the dislocations and transmission electron microscopy to probe them for structural changes. This correlative analysis was conducted on the same portion of material, i.e. first cono-spherically shaped APT tips with about 250 nm length and 60 nm apex curvature were prepared by focused ion beam (FIB) milling, then these tips were placed on a grid holder that can be mounted in both the TEM and the APT. The sample was first imaged by TEM to reveal the positions of single dislocations and low angle grain boundaries and subsequently the same tip was evaporated and analysed by APT [Citation89].
The local Mn composition at the dislocations was extracted according to a profile computed from a linearly extended 1 nm3 voxelisation of the three-dimensional atom map. Several such Mn-decorated dislocations were analysed, all displaying a very similar compositional pattern of adsorption: the segregation of Mn to the dislocations was as high as 15 at.-% Mn (relative to the 9 at.-% Mn content of the matrix) with fluctuations ranging between 15 at.-% Mn and 25–30 at.-% Mn, . These compositional fluctuation patterns along the dislocation lines were identified as low-dimensional spinodal decomposition phenomena [Citation134]. This demonstrates that dislocations can have interesting defect states not only with rapidly diffusing interstitial solutes, as shown above, but also where the chemical complexity arises from substitutional defects.
Figure 12. Atom probe tomography analysis along Mn-decorated dislocation cores, revealing low-dimensional spinodal decomposition patterns along the dislocation lines. From Kwiatkowski et al. [Citation134], published under a Creative Commons Attribution 4.0 license.
![Figure 12. Atom probe tomography analysis along Mn-decorated dislocation cores, revealing low-dimensional spinodal decomposition patterns along the dislocation lines. From Kwiatkowski et al. [Citation134], published under a Creative Commons Attribution 4.0 license.](/cms/asset/dc68c305-4191-4d13-8ef1-0e3ae145b8e8/yimr_a_1930734_f0012_oc.jpg)
Stacking faults and dislocations in magnesium solid solutions
One example for a material system in which already much smaller variations in the chemical composition dramatically change the activation of slip systems and consequently the deformation behaviour is Mg. Widespread commercial application of sheet Mg is still profoundly hampered by its poor room temperature formability, which is caused by preferred basal slip and a strong basal-type texture [Citation135]. According to this kinematic limitation, the von Mises criterion, expressing the requirement for five independent deformation modes to satisfy an arbitrary shape change, cannot be met for general load cases [Citation136,Citation137]. In hcp crystals, strain along the crystal c-axis can only be accommodated by the activation of non-basal slip and deformation twinning. Therefore, fulfilling the von Mises criterion requires the activation of non-basal dislocation slip [Citation136,Citation137].
Nevertheless, a mechanism map as anticipated in and does not yet exist for Mg. The understanding achieved so far, showed that single-phase solid-solution Mg-Y alloys with 3% Y exhibit an increase in the room-temperature ductility by about 5 times as compared to pure Mg, while maintaining comparable strength and well-balanced work hardening [Citation138]. By joint transmission electron microscopy (TEM) measurements and ab initio calculations, it was shown that the ductility increase in Mg-Y alloys is caused by an increased activity of 〈c + a〉 dislocation slip [Citation138,Citation139]. It is assumed that this is connected to a modified stability of defect phases responsible for the out-of-basal-plane shear modes, through the addition of Y to Mg.
Such a modification of the defect phase stability by addition of Y to Mg has been observed for the intrinsic stacking fault ( SF) [Citation139]. Here, the
SF energy is decreasing with increasing Y concentration, i.e. the stability of the I1 SF is enhanced. It is proposed that both stabilisations are correlated and that the reduction of the
SF energy can therefore also be used as an intrinsic alloy design parameter (among other extrinsic factors such as crystallographic texture and grain size). The connection with the ductility increase in the Mg-Y system is additionally based on the observation that the sessile and Y stabilised SF
is bound by pyramidal partial dislocations. This dislocation arrangement enables the formation of dislocation structures on pyramidal planes. In line with the nucleation source configuration, it is therefore suggested that the SF
acts as heterogeneous nucleation source for pyramidal 〈c + a〉 dislocations [Citation139]. As outlined above, this is the critical step for providing out-of-basal-plane shear.
These observations were further used as a guideline for identifying other less costly solid solution alloying elements that might facilitate similar ductilisation. The idea was to start from an Mg-Y alloy that is ductile, yet is still not commercially attractive, and then to search for alloy compositions matching the reference system as closely as possible using selected element-specific properties. This proximity between two alloys is expressed by a similarity index where the subscript c describes the chemical composition of the new alloy,
describes a selected set of element-specific properties and
are the weighting factors. This proximity factor,
is referred to as yttrium-similarity index, YSI.
To determine a set of elemental properties and weighting factors, density functional theory was used to compute reference quantities for a set of solid-solution binary Mg alloys [Citation140,Citation141]. A statistical analysis of this data reveals three prominent correlations: the atomic volume of pure solutes, their electronegativity and their bulk modulus. The correlation coefficients were used for the weights. Screening 2850 ternary combinations ((a)) reveals 17 ternary alloys highlighted in (b) with YSI values ≥0.95.
Figure 13. Yttrium-similarity index, YSI for the 2850 solute pairs computed in this study and visualised in the form of a symmetric matrix (a) with yellow indicating a high similarity and blue a low one. Solute pairs that have a high index (YSI>0.95) are shown in the upper triangular part in (b). Applying a cost and solubility filter only a single pair, Al-Ca, remains (c). From [Citation141], published under a Creative Commons Attribution 4.0 International License by Springer Nature.
![Figure 13. Yttrium-similarity index, YSI for the 2850 solute pairs computed in this study and visualised in the form of a symmetric matrix (a) with yellow indicating a high similarity and blue a low one. Solute pairs that have a high index (YSI>0.95) are shown in the upper triangular part in (b). Applying a cost and solubility filter only a single pair, Al-Ca, remains (c). From [Citation141], published under a Creative Commons Attribution 4.0 International License by Springer Nature.](/cms/asset/1c153abf-eb99-4cc0-b6e7-7d39a33ce8cf/yimr_a_1930734_f0013_oc.jpg)
(a) shows a symmetric matrix of all 2850 solute pairs computed, where the respective solutes are given on the x- and y-axes. The intersection points of each solute pair of the y- and x-axis are marked by a coloured point indicating the similarity of that pair to Y. Yellow colour corresponds to a high similarity to Y (high YSI) and blue to a low YSI. In the upper triangle of (b) only those solute pairs with an YSI above 0.95 (i.e. 95% or higher similarity to Y) are shown. The solutes are listed at the x- and y-axis in (b). From this list, 11 alloys are RE/Y-free. A second filter rules out element pairs that are incompatible with recycling constraints, toxic, not sufficiently soluble in Mg or too expensive. In the end, only one alloy system remains, viz. Mg-Al-Ca [Citation141]. With this result a new material was synthesised, namely, Mg–1Al–0.1Ca (wt-%), .
Figure 14. (a) Engineering stress-strain curves of the discussed Mg-Al-Ca alloy in comparison with not engineered (other than simple homogenisation treatment) solid solution Mg-Y, Mg-RE, pure Mg and Mg-Al-0.3Ca [Citation141]. The inset shows the ultimate tensile strength – uniform elongation diagram of the same alloys displaying the superior mechanical properties of the alloy developed using the YSI. RD: rolling direction; TD: transverse direction. Compositions are in weight %. (b) Pure Mg fractured along macroscopic shear bands when cold rolled to 10% thickness reduction whereas Mg–1Al–0.1Ca could be cold rolled to 54% thickness reduction in several rolling passes of 8% thickness reduction per rolling pass; small sheet sections cut from the rolled sheet after each consecutive rolling pass are presented. From [Citation141], published under a Creative Commons Attribution 4.0 International License by Springer Nature.
![Figure 14. (a) Engineering stress-strain curves of the discussed Mg-Al-Ca alloy in comparison with not engineered (other than simple homogenisation treatment) solid solution Mg-Y, Mg-RE, pure Mg and Mg-Al-0.3Ca [Citation141]. The inset shows the ultimate tensile strength – uniform elongation diagram of the same alloys displaying the superior mechanical properties of the alloy developed using the YSI. RD: rolling direction; TD: transverse direction. Compositions are in weight %. (b) Pure Mg fractured along macroscopic shear bands when cold rolled to 10% thickness reduction whereas Mg–1Al–0.1Ca could be cold rolled to 54% thickness reduction in several rolling passes of 8% thickness reduction per rolling pass; small sheet sections cut from the rolled sheet after each consecutive rolling pass are presented. From [Citation141], published under a Creative Commons Attribution 4.0 International License by Springer Nature.](/cms/asset/1aafce44-fd84-4e2c-91da-53272c97d3bd/yimr_a_1930734_f0014_oc.jpg)
shows the tensile stress–strain behaviour of the new alloy in comparison with pure Mg and binary solid solution Mg-RE and Mg-Y alloys revealing superior mechanical properties. First experimental observations show that this material does indeed possess increased pyramidal 〈c + a〉 dislocation slip activity, facilitating enhanced ductility. The exact mechanisms of this ductility increase remain open [Citation141,Citation142].
Defects in ordered crystals
The formation of defect phases with structurally and chemically complex arrangements of atoms around a lattice defect do not only occur in the presence of alloying atoms. In ordered crystals, this occurs naturally even in perfect stoichiometry. Intermetallics are the most closely related crystals to the metallic materials discussed elsewhere in this review, however, many other non-metallic material systems, such as transition metal carbides [Citation143–146] and perovskites [Citation147,Citation148], show similarly ordered crystal structures and complex defects. Examples from the literature for dislocations, grain and phase boundaries are shown in .
Figure 15. One- and two-dimensional examples of defects with structural and chemical atomic complexity in intermetallics, metals, oxides and carbide-metal composites observed in experiments (A–D) and simulations (E–H). Images in B and F reprinted from [Citation180], published under a Creative Commons Attribution 4.0 International License. The other images are reprinted with permission from Elsevier from the following references: A [Citation154], C [Citation18], D [Citation181], E [Citation151], G [Citation18], H [Citation119]. Reuse not permitted.
![Figure 15. One- and two-dimensional examples of defects with structural and chemical atomic complexity in intermetallics, metals, oxides and carbide-metal composites observed in experiments (A–D) and simulations (E–H). Images in B and F reprinted from [Citation180], published under a Creative Commons Attribution 4.0 International License. The other images are reprinted with permission from Elsevier from the following references: A [Citation154], C [Citation18], D [Citation181], E [Citation151], G [Citation18], H [Citation119]. Reuse not permitted.](/cms/asset/7188d1e5-e46b-4321-8f8e-10242a6cc5cb/yimr_a_1930734_f0015_oc.jpg)
The crystal structures of intermetallics range from simple ordering of the present atomic species in an originally fcc or bcc structure, e.g. in the Ni3Al phase of nickel-based superalloys, to quasi-crystal approximants and phases with unit cells containing hundreds of atoms. Accordingly, the atomic structures of the underlying defects vary in their complexity from the well-studied super-partial dislocations in the L12 phase [Citation149] to the large cores of metadislocations in quasi-crystal approximants [Citation150]. For the latter, basic symmetries have been identified, but a metadislocation core remains to be resolved experimentally and their mechanisms of motion are not understood [Citation151]. However, using nanomechanical testing to suppress fracture [Citation152,Citation153], it has been shown that even the giant metadislocations appear mobile at low temperatures [Citation154], where their motion is unlikely to be carried by diffusional processes alone, (a,e).
While a true understanding of these defects may remain out of reach for now, we can now push to expand our understanding of dislocation plasticity beyond those of the simplest crystal structures to the very common but more complex topologically close packed intermetallics, such as Laves phases. From early high temperature experiments using conventional mechanical testing on these very common intermetallic phases [Citation155], we know that several different slip systems can be activated, with vastly different atomic arrangements on each. The first one of these to have been connected with a distinct mechanism relates to the triple layer characteristic of the Laves (and other related) phases. In these, synchroshear [Citation156,Citation157] has been suggested to occur for which the motion of a dislocation involves the synchronous movement of what can be thought of as two partial dislocations in adjacent planes with different Burgers vectors. Or, more simply put, as the motion of a dislocation formed in the layer with the larger atomic species that forces the smaller atoms in the adjacent atomic layer to jump out of its way sideways. The associated stacking faults were first imaged at high resolution in 2005 [Citation158], but it was not until 2019 that, after several studies using DFT calculations only [Citation159,Citation160], the motion of a synchroshear dislocation was confirmed in atomistic simulations [Citation156].
This now puts us into a position to form a better understanding of how such crystals deform and ultimately to select and design phases, or composites containing these phases [Citation161,Citation162], with tailored and superior properties. The use of nanomechanical testing now allows us to record highly resolved and specific mechanical data, including indentation hardness and modulus as well as estimates of the theoretical strength and continuity of yielding from initial and continuous pop-ins [Citation163,Citation164], respectively, thermal activation from rate jump testing [Citation165] and experiments at temperatures ranging from well below zero centigrade up to 1000°C [Citation166,Citation167]. In addition, the use of small-scale uniaxial testing (microcompression) now also allows these parameters to be resolved onto individual slip systems [Citation152]. In (potentially) anisotropic crystals, such as the majority of complex phases, this has been an essential expansion of experimental reach. It is particularly powerful in the case of intermetallics and the reduction in size leads to a suppression of cracking by making plasticity energetically more favourable and excluding the effects of flaws initiating fracture in macroscopic testing [Citation152,Citation153].
As a result, even brittle phases with unknown plasticity mechanisms can now be characterised comprehensively by nanomechanical testing and the underlying lattice defects and, where applicable, defect phases accommodating plasticity analysed using transmission electron microscopy [Citation164,Citation168–173]. Employing aberration corrected high resolution TEM now allows us to resolve the formed dislocations and stacking faults in atomic scale detail [Citation154,Citation174]. In this way, a direct bridge between experiment and simulation is formed at the atomic scale, , where possible defect structures can be modelled and compared using state-of-the-art ab initio and molecular statics calculations. The availability of appropriate interatomic potentials then also enables the computational observation of complex defects in motion, providing a direct link back to the mechanical measurements [Citation156].
Figure 16. Combination of experimental and computation nanomechanics enables scale-bridging study of deformation mechanisms in ordered crystals, which tend to be brittle at the macroscopic scale and low temperature, enabling the population of defect phase and mechanism-property diagrams in the future. Measurement of critical stresses for yielding (A) and energy barriers for different deformation mechanisms (F) from experimental (C) and computational (D) nanomechanical studies. Observation of both static and moving dislocations at the same level of resolution is made possible by HR-TEM (B) and molecular dynamics simulations (E). Images reprinted with permission from Elsevier and Wiley from references A [Citation168], B [Citation174], C [Citation182], D [Citation156], E [Citation183], F [Citation156]. Reuse not permitted.
![Figure 16. Combination of experimental and computation nanomechanics enables scale-bridging study of deformation mechanisms in ordered crystals, which tend to be brittle at the macroscopic scale and low temperature, enabling the population of defect phase and mechanism-property diagrams in the future. Measurement of critical stresses for yielding (A) and energy barriers for different deformation mechanisms (F) from experimental (C) and computational (D) nanomechanical studies. Observation of both static and moving dislocations at the same level of resolution is made possible by HR-TEM (B) and molecular dynamics simulations (E). Images reprinted with permission from Elsevier and Wiley from references A [Citation168], B [Citation174], C [Citation182], D [Citation156], E [Citation183], F [Citation156]. Reuse not permitted.](/cms/asset/337553d7-acae-49ae-b4cc-00dcbba7cc90/yimr_a_1930734_f0016_oc.jpg)
While resolving the fundamental mechanisms and lattice defects allowing plastic flow in ordered crystals may be moving just within our reach of experimental and computational capabilities, many more challenging questions will arise: What is the role of diffusion in the case of perfect and imperfect stoichiometry? How do local variations in chemical order affect structure and motion of dislocation defect phases? Which other mechanisms (in addition to synchroshear) exist beyond our picture of ideal and planar dislocation glide? And how can the active mechanisms and critical stresses be predicted and manipulated for ordered crystals and their structurally and chemically complex lattice defects?
Extending our understanding of dislocation defect phases in ordered crystals, their interaction with 2D defect phases, in particular those at phase boundaries where metals are reinforced with ordered crystals in engineering alloys, will be essential to driving materials design.
Grain boundaries in metals
One of the challenges in the case of grain boundaries (GB) is differentiating which of the many GB states are true defect phases. According to the definition above, this requires the determination of the stability over a region of thermodynamic state variables, such as temperature, stress, alloy composition, chemical potential, etc. A prominent example is the paper of Frolov et al. on structural transformations of grain boundaries in Cu [Citation34]. Published in 2013, this study is one of the first simulations of this kind, indicating that this research field has just started a few years ago. In this work, the GB thickness has been used to distinguish different structures. As a function of temperature, Frolov et al. observed a clear transformation between two defect states, the normal and the split kite. Their stability over larger temperature regions indicates that both states are defect phases in fcc metals.
In the case of hcp metals such as Mg, twin boundaries (TBs) a competition between reflection TBs and glide TBs has been reported for and
twins [Citation175]. In order to identify them as defect states, a first step is to study their energetics. visualises the energy surface of
tensile twins in Mg as function of two structural parameters. The shear parameter
and the shuffle parameter
are suitable to characterise the defect state of
twins in hcp metals. We observe that the reflection TB (
) and the glide TB (
) correspond to two minima on this surface that are separated by a clear barrier. Hence, they seem to be distinct states, which are energetically almost degenerate. For the energies presented here, an EAM potential [Citation176] has been employed.
Figure 17. (a) Atomic structures and energy surface for the tensile twins in pure Mg. (b) Visualisation of the shear parameter
in units of half the Burgers vector
and the shuffle parameter
in units of the atomic plane distance
describing the state of the TB. The energy minima correspond to the reflection TB (
) and the glide TB (
). The energies have been determined by an EAM potential. Figure adapted from Ref. [Citation175], published under a Creative Commons Attribution 4.0 International License by Springer Nature.
![Figure 17. (a) Atomic structures and energy surface for the {101¯2} tensile twins in pure Mg. (b) Visualisation of the shear parameter ϵ in units of half the Burgers vector b and the shuffle parameter s in units of the atomic plane distance d describing the state of the TB. The energy minima correspond to the reflection TB (ϵ=0,s=0) and the glide TB (ϵ=1,s=1). The energies have been determined by an EAM potential. Figure adapted from Ref. [Citation175], published under a Creative Commons Attribution 4.0 International License by Springer Nature.](/cms/asset/ea1a1200-a801-4c4b-ab68-568177681857/yimr_a_1930734_f0017_oc.jpg)
However, it is unclear if these GB states are really both defect phases. For this purpose, the dependence on thermodynamic state variables needs to be investigated. In order to test the chemical degree of freedom, the impact of a dilute concentration of solute atoms can be studied. The solute destroys the symmetry of the system, triggering structural transformations when relaxing the atomic positions. For example, the impact of a single Y atom in a Mg TB has been studied [Citation175], since the size mismatch between both atoms makes the intended effect particularly large. The solute-induced relaxation had little impact on the structure of the reflection TBs. However, the relaxation of Y-containing glide TBs indicated a spontaneous transformation to reflection TBs both in the case of and
twins. The achieved segregation profile is in good agreement with an experimental HR-(S)TEM study, showing the periodic segregation of rare earth elements (Gd in this case) to TBs in Mg [Citation177].
Similarly, if the impact of the thermodynamic state variable temperature is considered, the extension of the Gibbs energies to finite temperatures requires the calculation of lattice vibrations. Performing ab initio phonon calculations, only positive vibrational excitation energies are observed in the case of the reflection TB, while the
glide TB shows soft phonon modes. A more detailed analysis of the soft phonon mode revealed that mainly atoms one layer above the glide TB are affected by this dynamical instability. Their displacement results in the formation of a reflection TB, making the transformation barrier free. This result can further be confirmed by nudged elastic band calculations. As a conclusion, in the case of
TBs in Mg, only the reflection TBs can be called a defect phase, while the glide TB does not fulfil the conditions of thermodynamic stability.
In the case of Al, we demonstrate the intrinsically atomistic nature of chemical-structure interaction by demonstrating how different [001]Σ5 grain boundaries can exhibit stark differences in behaviour despite the fact that their characters differ only in the boundary normal plane. In a very simple approximation, we can think of the defect state for a particular grain boundary in a binary alloy as a sum of individual interactions between a segregating atom and some local area of the GB, ignoring solute-solute interactions or the influence of elevated solute concentrations on the GB structure. In a grain boundary, unlike a dislocation with its long-range elastic field, the interaction of structure and chemistry is truly short-ranged. In this dilute-limit approximation, we can then describe the GB state by filling up the density of states (DOS) available to the segregating atoms.
(a,b) shows such a DOS for the segregation of Mg at two [001]5 tilt boundaries in Al [Citation85]. The highly symmetric (130) boundary has only four unique sites, which is reflected by the distinct peaks in the DOS, two of which are doubly degenerate. More sites farther from the GB plane exist in principle, but in practice segregation energies typically drop off quickly with increasing distance from the GB plane and these are ignored here. In contrast, the more disorderly (430) boundary has a much wider variety of local environments for the solute to interact with and the resulting DOS is much richer.
Figure 18. (a) and (b) show the DOS available to dilutely segregating Mg atoms at (130) and (430) [001]5 Al GBs, respectively, calculated at 0 K with an empirical potential. Yellow (red) curves show Fermi-Dirac occupation of these states at 100 K (700 K). (c) and (d) ((e) and (f)) show the resulting structure predictions for these boundaries at low (high) temperature. Structures are projected onto the (001) plane and coloured according to Mg occupation probability (Al = grey, Mg = blue). For the disorderly (430) boundary, translucency is used to indicate atomic density in the [001] direction.
![Figure 18. (a) and (b) show the DOS available to dilutely segregating Mg atoms at (130) and (430) [001]Σ5 Al GBs, respectively, calculated at 0 K with an empirical potential. Yellow (red) curves show Fermi-Dirac occupation of these states at 100 K (700 K). (c) and (d) ((e) and (f)) show the resulting structure predictions for these boundaries at low (high) temperature. Structures are projected onto the (001) plane and coloured according to Mg occupation probability (Al = grey, Mg = blue). For the disorderly (430) boundary, translucency is used to indicate atomic density in the [001] direction.](/cms/asset/957d8e83-a20a-4a04-92f8-262e1cc59cdd/yimr_a_1930734_f0018_oc.jpg)
Overlaid on these DOS are Fermi occupation curves at two different temperatures, 100 and 700 K, which indicate the occupation probabilities for sites with a given energy at those temperatures. (c–f) shows the predicted GB states at the low and high temperature, respectively, looking down the shared [001] misorientation axis, where the colour (blueness) indicates the probability of the site being occupied by a Mg atom, and translucency indicates decreased density in the columnar direction. The highly symmetric (130) boundary, which has a large ‘bandgap’ in its DOS analogous to an electronic insulator, shows two clear GB states which will each persist over certain temperature ranges. The more disorderly (430) boundary also shows more segregation at lower temperatures, but in contrast the transition to a less-decorated state at high temperatures occurs nearly continuously. In this simplified picture with the DOS constructed from non-interacting microstates, the (130) boundary is a good candidate for finding a GB phase transition, while the (430) boundary is not.
The reality of GB defect states is, of course, much more complex. Not only do the segregating solutes interact with each other, but higher concentrations of an alloying element at a boundary can cause the structure of the boundary itself to change. The first of these effects means that the triangular GB site occupation predicted in (c) may not be the actual configuration assumed under these conditions – in this specific case, once the highly favourable planar sites are occupied, solute-solute interactions alter the surrounding energy landscape. Higher segregant concentrations, meanwhile, can lead to a complex co-evolution of the chemical and structural configuration of the boundaries, e.g. GB faceting or local kite rearrangement [Citation81]. Finally, temperature effects must also be considered. Constructing a complete DOS outside this non-interacting 0 K limit is thus very challenging. However, we have other tools available to probe the fully-interacting finite-T domain.
One of these tools is the so-called Variance Constrained Semi-Grand Canonical Molecular Dynamics/Monte Carlo (MD/MC) approach [Citation178]. With this technique, a finite temperature MD run is interspersed with semi-grand canonical Monte Carlo swaps where the species of an atom is transmuted while the total concentration of each species in the simulation domain is constrained to lie within a certain (typically narrow) window. Continuing with the example of tilt boundaries in an Al-rich Al-Mg binary alloy, shows the evolution of coupled MD/MC simulations at room temperature, where colour indicates the fraction of the eight layers in each atomic column which are occupied by Mg (blue). Results are shown for the symmetric (210) and symmetric (130) boundaries [Citation179].
Figure 19. Coupled Molecular Dynamics/Monte Carlo simulations for Al-Mg at room temperature for increasing time/Monte Carlo steps. Positions are projected onto the (001) plane and grouped by column, with colour indicating species (grey = Al, blue = Mg). Red and yellow circles indicate areas of special interest (see text). Figure adapted from [Citation179], published under a Creative Commons International 4.0 Attribution license.
![Figure 19. Coupled Molecular Dynamics/Monte Carlo simulations for Al-Mg at room temperature for increasing time/Monte Carlo steps. Positions are projected onto the (001) plane and grouped by column, with colour indicating species (grey = Al, blue = Mg). Red and yellow circles indicate areas of special interest (see text). Figure adapted from [Citation179], published under a Creative Commons International 4.0 Attribution license.](/cms/asset/0a52159c-0040-4874-848f-8bbf173f5546/yimr_a_1930734_f0019_oc.jpg)
The empirical potential used favours the formation of a columnar phase. The first hint of this phase can be seen even at an early time for the (130) boundary, circled in red in . At this point, the most attractive planar sites of both boundaries are already fully saturated with Mg. As time proceeds, Mg-Mg and Mg-GB interactions together lead to the formation of the secondary
phase near the boundary whence it grows outwards. Since the chemical potential difference between Al and Mg was chosen to encourage the growth of this phase, precipitation happens in both systems, and in both cases it nucleates at the boundaries. However, the underlying energy landscape of the (210) boundary drives the precipitate to grow in perfect coherence with the decorated GB plane. In contrast, at the (130) boundary the precipitate retains double-Al-layer defects even after many MC swaps. These computational predictions are analogous to recent APT and STEM work on the Al–Mg–Zn–Cu system [Citation179], which shows the [001]
boundary decomposing into
and
facets. These experimental measurements show that large Mg-rich S-phase precipitates form at each
facet, while the
facets experience only local segregation enrichment.
The examples above show the intrinsically atomistic scale of chemical–structural interactions. They also demonstrate the importance of considering defect phases on a per-defect level, as different defect characters can exhibit very different behaviour. This is even the case for defects whose character differences are sometimes glossed over – here both boundaries are [001] boundaries, but very different behaviour can be observed and rationalised based only on the orientation of the boundary normal direction.
Summary and conclusions
Recent experimental and computational investigations have shown that confined defect states exist in a broad range of ceramic, metallic and intermetallic materials. We call a specific atomic structure and chemistry of a defect a ‘defect phase’ when it is thermodynamically stable. Each lattice defect can have (multiple) distinct defect phases, which can be controlled by the global chemical composition and applied processing parameters.
Using advanced high-resolution experimental methods, such as aberration corrected HR-(S)TEM and APT, changes between defect phases can be resolved. Advanced computational methods such as DFT and MD enable further the prediction of defect phases in dependence of temperature and composition. Transitions of the prevalent defect phases can induce discontinuous changes in the mechanical and corrosion properties on the engineering scale. Therefore, guided probing of defect phases – with use of high-resolution characterisation focusing on conditions where macroscopic changes in the properties are observed – is a strategy to unravel defect phase transitions and to relate them to the mechanisms by which they control the macroscopic material properties.
In this article, we reviewed the literature on defect phases and introduced the concept of defect phase diagrams as a systematic and unified framework to describe the stable types of defect phases of a whole range of lattice defects and their transitions upon changes in the (local) chemical potential at the defects.
Knowing (i) the available defect phases in a given material and their dependence on the chemical potential (and therefore temperature and composition) and (ii) the mechanisms and properties related to these defect phases, will enable material scientists to create a new toolbox for materials design. Importantly, the bottom-up relations of defect phases and properties will allow a multi-physics design for competing properties controlled by the same defect phases, for example plasticity and corrosion of solid solutions and composites of different phases.
We therefore foresee that, in the future, defect phase diagrams will play the same role in designing materials as bulk phase diagrams do now. Their use in a coherent framework may well cause a paradigm change in our descriptions of lattice defects and give rise to much more powerful, knowledge-based design strategies for future engineering materials.
Acknowledgements
The topic of this review is at the heart of SFB1394 ‘Structural and chemical atomic complexity – from defect phase diagrams to material properties’.
Disclosure statement
No potential conflict of interest was reported by the author(s).
Additional information
Funding
References
- Le Chatelier A. Influence du temps et de la température sur les essais au choc. Revue de métallurgie. 1909;6(8):914–917.
- Kwiatkowski da Silva A, Leyson G, Kuzmina M, et al. Confined chemical and structural states at dislocations in Fe-9wt% Mn steels: a correlative TEM-atom probe study combined with multiscale modelling. Acta Mater. 2017;124:305–315.
- Kuzmina M, Herbig M, Ponge D, et al. Linear complexions: confined chemical and structural states at dislocations. Science. 2015;349(6252):1080–1083.
- Turlo V, Rupert TJ. Dislocation-assisted linear complexion formation driven by segregation. Scr Mater. 2018;154:25–29.
- Turlo V, Rupert TJ. Prediction of a wide variety of linear complexions in face centered cubic alloys. Acta Mater. 2020;185:129–141.
- Martin F, Bataillon C, Cousty J. In situ AFM detection of pit onset location on a 304L stainless steel. Corros Sci. 2008;50(1):84–92.
- Turnbull A. Corrosion pitting and environmentally assisted small crack growth. Proc R Soc London Ser A Math Phys Sci. 2014;470(2169):20140254.
- Hickel T, Sandlöbes S, Marceau RK, et al. Impact of nanodiffusion on the stacking fault energy in high-strength steels. Acta Mater. 2014;75:147–155.
- Suzuki H. Segregation of solute atoms to stacking faults. J Phys Soc Jpn. 1962;17(2):322–325.
- Heyn E. Internal strains in cold-wrought metals, and some troubles caused thereby. J Inst Met. 1914;12:1–37.
- Huntington A. Embrittlement of brass by mercury. J Inst Met. 1914;11:108–112.
- Joseph B, Picat M, Barbier F. Liquid metal embrittlement: a state-of-the-art appraisal. The European Physical Journal-Applied Physics. 1999;5(1):19–31.
- Nicholas M, Old C. Liquid metal embrittlement. J Mater Sci. 1979;14(1):1–18.
- Wilson F. Mechanism of intergranular corrosion of austenitic stainless steels—literature review. Br Corros J. 1971;6(3):100–108.
- Raabe D, Ponge D, Kirchheim R, et al. Interface segregation in advanced steels studied at the atomic scale. In: DA Molodov, editor. Microstructural design of advanced engineering materials. Weinheim: Wiley-VCH Verlag GmbH & Co. KGaA; 2013. p. 267–298.
- Kuzmina M, Ponge D, Raabe D. Grain boundary segregation engineering and austenite reversion turn embrittlement into toughness: example of a 9 wt.% medium Mn steel. Acta Mater. 2015;86:182–192.
- Tytko D, Choi P-P, Klöwer J, et al. Microstructural evolution of a Ni-based superalloy (617B) at 700 C studied by electron microscopy and atom probe tomography. Acta Mater. 2012;60(4):1731–1740.
- Cantwell PR, Tang M, Dillon SJ, et al. Grain boundary complexions. Acta Mater. 2014;62:1–48.
- Dillon SJ, Tang M, Carter WC, et al. Complexion: A new concept for kinetic engineering in materials science. Acta Mater. 2007;55(18):6208–6218.
- Luo J, Cheng H, Asl KM, et al. The role of a bilayer interfacial phase on liquid metal embrittlement. Science. 2011;333(6050):1730–1733.
- Tang M, Carter WC, Cannon RM. Grain boundary order-disorder transitions. J Mater Sci. 2006;41(23):7691–7695.
- Landolt D. Contributions of surface analysis to corrosion science: selective dissolution and oxidation phenomena in alloy corrosion. Surf Interface Anal. 1990;15(7):395–404.
- Hagan J, Swain MV. The origin of median and lateral cracks around plastic indents in brittle materials. J Phys D Appl Phys. 1978;11(15):2091.
- Lawn B, Evans A. A model for crack initiation in elastic/plastic indentation fields. J Mater Sci. 1977;12(11):2195–2199.
- Stroh A. The formation of cracks as a result of plastic flow. Proc R Soc London Ser A Math Phys Sci. 1954;223(1154):404–414.
- Howie P, Thompson R, Korte-Kerzel S, et al. Softening non-metallic crystals by inhomogeneous elasticity. Sci Rep. 2017;7:11602.
- Yin L, Jin Y, Leygraf C, et al. Numerical simulation of micro-galvanic corrosion of Al alloys: effect of chemical factors. J Electrochem Soc. 2017;164(13):C768–C778.
- Zhao H, De Geuser F, Kwiatkowski da Silva A, et al. Segregation assisted grain boundary precipitation in a model Al-Zn-Mg-Cu alloy. Acta Mater. 2018;156:318–329.
- Li L, Li Z, Kwiatkowski da Silva A, et al. Segregation-driven grain boundary spinodal decomposition as a pathway for phase nucleation in a high-entropy alloy. Acta Mater. 2019;178:1–9.
- Kaplan WD, Chatain D, Wynblatt P, et al. A review of wetting versus adsorption, complexions, and related phenomena: the rosetta stone of wetting. J Mater Sci. 2013;48(17):5681–5717.
- Baram M, Chatain D, Kaplan WD. Nanometer-thick equilibrium films: the interface between thermodynamics and atomistics. Science. 2011;332(6026):206–209.
- Meiners T, Frolov T, Rudd RE, et al. Observations of grain-boundary phase transformations in an elemental metal. Nature. 2020;579(7799):375–378.
- Herbig M, Raabe D, Li YJ, et al. Atomic-Scale quantification of grain boundary segregation in nanocrystalline material. Phys Rev Lett. 2014;112(12):126103.
- Frolov T, Olmsted DL, Asta M, et al. Structural phase transformations in metallic grain boundaries. Nat Commun. 2013;4(1):1–7.
- Liebscher CH, Yao M, Dey P, et al. Tetragonal fcc-Fe induced by κ-carbide precipitates: atomic scale insights from correlative electron microscopy, atom probe tomography, and density functional theory. Phys Rev Mater. 2018;2(2):023804.
- Frolov T, Mishin Y. Phases, phase equilibria, and phase rules in low-dimensional systems. J Chem Phys. 2015;143(4):044706.
- Hillert M. Phase equilibria, phase diagrams and phase transformations: their thermodynamic basis. Cambridge: Cambridge University Press; 2007.
- Liu Z-K, Wang Y. Computational thermodynamics of materials. Cambridge: Cambridge University Press; 2016.
- Liu Z-K. Computational thermodynamics and its applications. Acta Mater. 2020;200:745–792.
- Cahn J. Transitions and phase equilibria among grain boundary structures. Le Journal de Physique Colloques. 1982;43(C6):C6-199-C196-213.
- Erb U, Gleiter H. The effect of temperature on the energy and structure of grain boundaries. Scr Metall. 1979;13(1):61–64.
- Hart EW. Grain boundary phase transformations. In: Hsun Hu and Anning Hu, editors. The nature and behavior of grain boundaries. New York: Springer; 1972. p. 155–170.
- Meiser H, Gleiter H, Mirwald R. The effect of hydrostatic pressure on the energy of grain boundaries—structural transformations. Scr Metall. 1980;14(1):95–99.
- Rottman C. Theory of phase transitions at internal interfaces. Le Journal de Physique Colloques. 1988;49(C5):C5–313. -C315-326.
- Krause AR, Cantwell PR, Marvel CJ, et al. Review of grain boundary complexion engineering: know your boundaries. J Am Ceram Soc. 2019;102(2):778–800.
- Tang M, Carter WC, Cannon RM. Diffuse interface model for structural transitions of grain boundaries. Phys Rev B. 2006;73(2):024102.
- Tang M, Carter WC, Cannon RM. Grain boundary transitions in binary alloys. Phys Rev Lett. 2006;97(7):075502.
- Harmer MP. The phase behavior of interfaces. Science. 2011;332(6026):182–183.
- Zhang J, Tasan CC, Lai M, et al. Complexion-mediated martensitic phase transformation in titanium. Nat Commun. 2017;8(1):1–8.
- Cantwell PR, Frolov T, Rupert TJ, et al. Grain boundary complexion Transitions. Annu Rev Mater Res. 2020;50(1). null.
- Schumacher O, Marvel CJ, Kelly MN, et al. Complexion time-temperature-transformation (TTT) diagrams: opportunities and challenges. Curr Opin Solid State Mater Sci. 2016;20(5):316–323.
- Cottrell AH, Bilby B. Dislocation theory of yielding and strain ageing of iron. Proc Phys Soc London Sect A. 1949;62(1):49.
- Turlo V, Rupert TJ. Linear complexions: metastable phase formation and coexistence at dislocations. Phys Rev Lett. 2019;122(12):126102.
- Bracco G, Holst B (ed.). Surface science techniques (Springer series in surface science, 51). Berlin: Springer; 2013.
- Smith AR, Feenstra RM, Greve DW, et al. Reconstructions of the GaN(000−1) surface. Phys Rev Lett. 1997;79(20):3934–3937.
- Dulub O, Diebold U, Kresse G. Novel stabilization mechanism on polar surfaces: ZnO(0001)-Zn. Phys Rev Lett. 2003;90(1):016102.
- King DA, Woodruff DP. Phase transitions and adsorbate restructuring at metal surfaces (The chemical physics of solid surfaces). Amsterdam: Elsevier; 1994.
- Felice RD, Northrup JE, Neugebauer J. Energetics of AlN thin films and the implications for epitaxial growth on SiC. Phys Rev B. 1996;54(24):R17351–R17354.
- Kim I-H, Park H-S, Park Y-J, et al. Formation of V-shaped pits in InGaN/GaN multiquantum wells and bulk InGaN films. Appl Phys Lett. 1998;73(12):1634–1636.
- Van de Walle CG, Neugebauer J. First-principles surface phase diagram for hydrogen on GaN surfaces. Phys Rev Lett. 2002;88(6):066103.
- Maurice V, Yang WP, Marcus P. XPS and STM investigation of the passive film formed on Cr(110) single-crystal surfaces. J Electrochem Soc. 1994;141(11):3016–3027.
- Stampfl C, Veronica Ganduglia-Pirovano M, Reuter K, et al. Catalysis and corrosion: the theoretical surface-science context. Surf Sci. 2002;500(1):368–394.
- Ralston KD, Birbilis N, Cavanaugh MK, et al. Role of nanostructure in pitting of Al–Cu–Mg alloys. Electrochim Acta. 2010;55(27):7834–7842.
- Maurice V, Marcus P. Passive films at the nanoscale. Electrochim Acta. 2012;84:129–138.
- Smoluchowski R. Anisotropy of the electronic work function of metals. Phys Rev. 1941;60(9):661.
- Narasimhan S, Vanderbilt D. Elastic stress domains and the herringbone reconstruction on Au(111). Phys Rev Lett. 1992;69(10):1564–1567.
- Schlier R, Farnsworth H. Structure and adsorption characteristics of clean surfaces of germanium and silicon. J Chem Phys. 1959;30(4):917–926.
- Maurice V, Marcus P. Current developments of nanoscale insight into corrosion protection by passive oxide films. Curr Opin Solid State Mater Sci. 2018;22(4):156–167.
- Davis JR. Stainless steels. Materials Park: ASM International; 1994.
- Kirchheim R. Reducing grain boundary, dislocation line and vacancy formation energies by solute segregation. I. Theoretical background. Acta Mater. 2007;55(15):5129–5138.
- Weissmüller J. Alloy effects in nanostructures. Nanostruct Mater. 1993;3(1-6):261–272.
- Kaptay G. Nano-Calphad: extension of the Calphad method to systems with nano-phases and complexions. J Mater Sci. 2012;47(24):8320–8335.
- Zhou N, Luo J. Developing grain boundary diagrams for multicomponent alloys. Acta Mater. 2015;91:202–216.
- Shi X, Luo J. Developing grain boundary diagrams as a materials science tool: a case study of nickel-doped molybdenum. Phys Rev B. 2011;84(1):014105.
- Qian G-X, Martin RM, Chadi DJ. First-principles study of the atomic reconstructions and energies of Ga- and As-stabilized GaAs(100) surfaces. Phys Rev B. 1988;38(11):7649–7663.
- Northrup JE, Froyen S. Energetics of GaAs(100)-(2×4) and -(4×2) reconstructions. Phys Rev Lett. 1993;71(14):2276–2279.
- Northrup JE, Neugebauer J. Theory of GaN(10¯10) and (11¯20) surfaces. Phys Rev B. 1996;53(16):R10477–R10480.
- Finnis MW, Lozovoi AY, Alavi A. The oxidation of nial: what can we learn from ab initio calculations? Annu Rev Mater Res. 2005;35(1):167–207.
- Xu H, Cheng D. First-principles-aided thermodynamic modeling of transition-metal heterogeneous catalysts: a review. Green Energy & Environment. 2020;5(3):286–302.
- Rogal J, Reuter K. Ab initio atomistic thermodynamics for surfaces: a primer. Berlin: Max-Planck-Gesellschaft zur Förderung der Wissenschaften eV; 2006.
- Frolov T, Asta M, Mishin Y. Segregation-induced phase transformations in grain boundaries. Phys Rev B. 2015;92(2):020103.
- Bauer K-D, Todorova M, Hingerl K, et al. A first principles investigation of zinc induced embrittlement at grain boundaries in bcc iron. Acta Mater. 2015;90:69–76.
- White C, Coghlan W. The spectrum of binding energies approach to grain boundary segregation. Metall Trans A. 1977;8(9):1403–1412.
- Lejček P, Šob M. An analysis of segregation-induced changes in grain boundary cohesion in bcc iron. J Mater Sci. 2014;49(6):2477–2482.
- Huber L, Hadian R, Grabowski B, et al. A machine learning approach to model solute grain boundary segregation. NPJ Computat Mater. 2018;4(1):64.
- Wagih M, Schuh CA. Spectrum of grain boundary segregation energies in a polycrystal. Acta Mater. 2019;181:228–237.
- Detor AJ, Schuh CA. Grain boundary segregation, chemical ordering and stability of nanocrystalline alloys: atomistic computer simulations in the Ni–W system. Acta Mater. 2007;55(12):4221–4232.
- Wagih M, Schuh CA. Grain boundary segregation beyond the dilute limit: separating the Two contributions of site spectrality and solute interactions. Acta Mater. 2020;199:63–72.
- Kwiatkowski da Silva A, Kamachali RD, Ponge D, et al. Thermodynamics of grain boundary segregation, interfacial spinodal and their relevance for nucleation during solid-solid phase transitions. Acta Mater. 2019;168:109–120.
- Mishin Y. Solute drag and dynamic phase transformations in moving grain boundaries. Acta Mater. 2019;179:383–395.
- Jin ZH, Gumbsch P, Albe K, et al. Interactions between non-screw lattice dislocations and coherent twin boundaries in face-centered cubic metals. Acta Mater. 2008;56(5):1126–1135.
- Olmsted DL, Buta D, Adland A, et al. Dislocation-pairing transitions in hot grain boundaries. Phys Rev Lett. 2011;106(4):046101.
- Lany S. Defect phase diagram for doping of Ga2O3. APL Mater. 2018;6(4):046103.
- Nazarov R, Hickel T, Neugebauer J. First-principles study of the thermodynamics of hydrogen-vacancy interaction in fcc iron. Phys Rev B. 2010;82(22):224104.
- Nazarov R, Hickel T, Neugebauer J. Ab initio study of H-vacancy interactions in fcc metals: implications for the formation of superabundant vacancies. Phys Rev B. 2014;89(14):144108.
- Todorova M, Neugebauer J. Identification of bulk oxide defects in an electrochemical environment. Faraday Discuss. 2015;180:97–112.
- Beyerlein IJ, Demkowicz MJ, Misra A, et al. Defect-interface interactions. Prog Mater Sci. 2015;74:125–210.
- Kalidindi SR, Niezgoda SR, Salem AA. Microstructure informatics using higher-order statistics and efficient data-mining protocols. JOM. 2011;63(4):34–41.
- Yasi JA, Hector Jr LG, Trinkle DR. Prediction of thermal cross-slip stress in magnesium alloys from a geometric interaction model. Acta Mater. 2012;60(5):2350–2358.
- Beyerlein I, Capolungo L, Marshall P, et al. Statistical analyses of deformation twinning in magnesium. Philos Mag. 2010;90(16):2161–2190.
- Cogswell DA. Toward quantitative phase-field modeling of dendritic electrodeposition. arXiv preprint arXiv:1411.6615, 2014.
- Heo TW, Tang M, Chen LQ, et al. Defects, entropy, and the stabilization of alternative phase boundary orientations in battery electrode particles. Adv Energy Mater. 2016;6(6):1501759.
- Jain A, Castelli IE, Hautier G, et al. Performance of genetic algorithms in search for water splitting perovskites. J Mater Sci. 2013;48(19):6519–6534.
- Larche FC, Cahn JW. Thermochemical equilibrium of multiphase solids under stress. Acta Metall. 1978;26(10):1579–1589.
- Frolov T, Mishin Y. Thermodynamics of coherent interfaces under mechanical stresses. I. Theory. Phys Rev B. 2012;85(22):224106.
- Alerhand OL, Berker AN, Joannopoulos JD, et al. Finite-temperature phase diagram of vicinal Si(100) surfaces. Phys Rev Lett. 1990;64(20):2406–2409.
- Wulff G. Zur Frage der Geschwindigkeit des Wachstums und der Auflösung der Kristallflächen. Zeitschrift für Kristallographie und Mineralogie. 1901;34:449–530.
- Tang L, Han B, Persson K, et al. Electrochemical stability of nanometer-scale Pt particles in acidic environments. J Am Chem Soc. 2010;132(2):596–600.
- Rogal J, Reuter K, Scheffler M. Thermodynamic stability of PdO surfaces. Phys Rev B. 2004;69(7):075421.
- Baierlein R. The elusive chemical potential. Am J Phys. 2001;69(4):423–434.
- Chen L-Q. Chemical potential and Gibbs free energy. MRS Bull. 2019;44(7):520–523.
- Job G, Herrmann F. Chemical potential—a quantity in search of recognition. Eur J Phys. 2006;27(2):353–371.
- Todorova M, Neugebauer J. Extending the concept of defect chemistry from semiconductor physics to electrochemistry. Phys Rev Appl. 2014;1(1):014001.
- Hannon JB, J F, Heringdorf Mz, et al. Phase coexistence during surface phase transitions. Phys Rev Lett. 2001;86(21):4871–4874.
- Pond RC, Ma X, Hirth JP, et al. Disconnections in simple and complex structures. Philos Mag. 2007;87(33):5289–5307.
- Chen K, Srolovitz DJ, Han J. Grain-boundary topological phase transitions. Proc Natl Acad Sci USA. 2020;117(52):33077–33083.
- Frost HJ, Ashby MF. Deformation-mechanism map. Oxford: Pergaman Press; 1982.
- Kaptay G. A new paradigm on the chemical potentials of components in multi-component nano-phases within multi-phase systems. RSC Adv. 2017;7(65):41241–41253.
- Johansson SAE, Wahnström G. First-principles derived complexion diagrams for phase boundaries in doped cemented carbides. Curr Opin Solid State Mater Sci. 2016;20(5):299–307.
- Leyson G, Grabowski B, Neugebauer J. Multiscale description of dislocation induced nano-hydrides. Acta Mater. 2015;89:50–59.
- Fukai Y, Yamatomo S, Harada S, et al. The phase diagram of the Ni· H system revisited. J Alloys Compd. 2004;372(1-2):L4–L5.
- Eshelby JD. The determination of the elastic field of an ellipsoidal inclusion, and related problems. Proc R Soc Lond A Math Phys Sci. 1957;241(1226):376–396.
- Lassila D, Birnbaum H. The effect of diffusive hydrogen segregation on fracture of polycrystalline nickel. Acta Metall. 1986;34(7):1237–1243.
- Sofronis P, Robertson I. Transmission electron microscopy observations and micromechanical/continuum models for the effect of hydrogen on the mechanical behaviour of metals. Philos Mag A. 2002;82(17-18):3405–3413.
- Von Pezold J, Lymperakis L, Neugebeauer J. Hydrogen-enhanced local plasticity at dilute bulk H concentrations: The role of H–H interactions and the formation of local hydrides. Acta Mater. 2011;59(8):2969–2980.
- Leyson G, Grabowski B, Neugebauer J. Multiscale modeling of hydrogen enhanced homogeneous dislocation nucleation. Acta Mater. 2016;107:144–151.
- Kley A, Neugebauer J. Atomic and electronic structure of the GaAs/ZnSe (001) interface. Phys Rev B. 1994;50(12):8616.
- Reuter K, Scheffler M. Composition, structure, and stability of RuO 2 (110) as a function of oxygen pressure. Phys Rev B. 2001;65(3):035406.
- Valtiner M, Todorova M, Neugebauer J. Hydrogen adsorption on polar ZnO (0001)-Zn: extending equilibrium surface phase diagrams to kinetically stabilized structures. Phys Rev B. 2010;82(16):165418.
- Lundgren E, Gustafson J, Mikkelsen A, et al. Kinetic hindrance during the initial oxidation of Pd (100) at ambient pressures. Phys Rev Lett. 2004;92(4):046101.
- Lundgren E, Kresse G, Klein C, et al. Two-dimensional oxide on Pd (111). Phys Rev Lett. 2002;88(24):246103.
- Todorova M, Lundgren E, Blum V, et al. The Pd(100)–(5×5)R27°-O surface oxide revisited. Surf Sci. 2003;541(1):101–112.
- Valtiner M, Todorova M, Grundmeier V, et al. Temperature Stabilized Surface Reconstructions at Polar ZnO(0001). Phys. Rev. Lett. 2009;103(6):065502.
- Kwiatkowski da Silva A, Ponge D, Peng Z, et al. Phase nucleation through confined spinodal fluctuations at crystal defects evidenced in Fe-Mn alloys. Nat Commun. 2018;9(1):1137.
- Bohlen J, Letzig D, Kainer KU. New perspectives for wrought magnesium alloys. Mater Sci Forum. 2007;546:1–10.
- Partridge P. The crystallography and deformation modes of hexagonal close-packed metals. Metall Rev. 1967;12(1):169–194.
- Yoo M. Slip, twinning, and fracture in hexagonal close-packed metals. Metall Trans A. 1981;12(3):409–418.
- Sandlöbes S, Zaefferer S, Schestakow I, et al. On the role of non-basal deformation mechanisms for the ductility of Mg and Mg–Y alloys. Acta Mater. 2011;59(2):429–439.
- Sandlöbes S, Friák M, Zaefferer S, et al. The relation between ductility and stacking fault energies in Mg and Mg–Y alloys. Acta Mater. 2012;60(6):3011–3021.
- Pei Z, Friák M, Sandlöbes S, et al. Rapid theory-guided prototyping of ductile Mg alloys: from binary to multi-component materials. New J Phys. 2015;17(9):093009.
- Sandlöbes S, Friák M, Korte-Kerzel S, et al. A rare-earth free magnesium alloy with improved intrinsic ductility. Sci Rep. 2017;7(1):10458.
- Zeng ZR, Bian MZ, Xu SW, et al. Effects of dilute additions of Zn and Ca on ductility of magnesium alloy sheet. Mater Sci Eng A. 2016;674:459–471.
- Weinberger CR, Thompson GB. Review of phase stability in the group IVB and VB transition-metal carbides. J Am Ceram Soc. 2018;101(10):4401–4424.
- Xie C, Oganov AR, Li D, et al. Effects of carbon vacancies on the structures, mechanical properties, and chemical bonding of zirconium carbides: a first-principles study. Phys Chem Chem Phys. 2016;18(17):12299–12306.
- Hu W, Xiang J, Zhang Y, et al. Superstructural nanodomains of ordered carbon vacancies in nonstoichiometric ZrC0. 61. J Mater Res. 2012;27(9):1230.
- Zhang Y, Wang J, Liu B, et al. Understanding the behavior of native point defects in ZrC by first-principles calculations. J Am Ceram Soc. 2014;97(12):4024–4030.
- Du H, Jia C-L, Mayer J. Local crystallographic shear structures in a [201] extended mixed dislocations of SrTiO3 unraveled by atomic-scale imaging using transmission electron microscopy and spectroscopy. Faraday Discuss. 2019;213:245–258.
- Batuk M, Turner S, Abakumov AM, et al. Atomic structure of defects in anion-deficient perovskite-based ferrites with a crystallographic shear structure. Inorg Chem. 2014;53(4):2171–2180.
- Müller J, Eggeler G, Spiecker E. On the identification of superdislocations in the γ′-phase of single-crystal Ni-base superalloys – An application of the LACBED method to complex microstructures. Acta Mater. 2015;87:34–44.
- Heggen M, Houben L, Feuerbacher M. Plastic-deformation mechanism in complex solids. Nat Mater. 2010;9(4):332–336.
- Heidelmann M, Heggen M, Dwyer C, et al. Comprehensive model of metadislocation movement in Al13Co4. Scr Mater. 2015;98:24–27.
- Korte-Kerzel S. Microcompression of brittle and anisotropic crystals: recent advances and current challenges in studying plasticity in hard materials. MRS Commun. 2017;7:109–120.
- Östlund F, Howie PR, Ghisleni R, et al. Ductile–brittle transition in micropillar compression of GaAs at room temperature. Philos Mag. 2011;91(7-9):1190–1199.
- Korte-Kerzel S, Schnabel V, Clegg WJ, et al. Room temperature plasticity in m-Al13Co4 studied by microcompression and high resolution scanning transmission electron microscopy. Scr Mater. 2018;146:327–330.
- Paufler P. Early work on Laves phases in East Germany. Intermetallics. 2011;19(4):599–612.
- Guénolé J, Mouhib F-Z, Huber L, et al. Basal slip in Laves phases: the synchroshear dislocation. Scr Mater. 2019;166:134–138.
- Hazzledine PM, Pirouz P. Synchroshear transformations in Laves phases. Scr Metall Mater. 1993;28(10):1277–1282.
- Chisholm MF, Kumar S, Hazzledine P. Dislocations in complex materials. Science. 2005;307(5710):701–703.
- Zhou Y, Xue Y, Chen D, et al. Atomic-scale configurations of synchroshear-induced deformation twins in the ionic MnS crystal. Sci Rep. 2014;4:5118.
- Vedmedenko O, Rösch F, Elsässer C. First-principles density functional theory study of phase transformations in NbCr2 and TaCr2. Acta Mater. 2008;56(18):4984–4992.
- Zubair M, Sandlöbes S, Wollenweber M, et al. On the role of Laves phases on the mechanical properties of Mg-Al-Ca alloys. Mater Sci Eng A. 2019;756:272–283.
- Zubair M, Sandlöbes-Haut S, Wollenweber MA, et al. Strain heterogeneity and micro-damage nucleation under tensile stresses in an Mg–5Al–3Ca alloy with an intermetallic skeleton. Mater Sci Eng A. 2019;767:138414.
- Maaß R, Derlet PM. Micro-plasticity and recent insights from intermittent and small-scale plasticity. Acta Mater. 2018;143:338–363.
- Mathur H, Maier-Kiener V, Korte-Kerzel S. Deformation in the γ-Mg17Al12 phase at 25–278° C. Acta Mater. 2016;113:221–229.
- Durst K, Maier V. Dynamic nanoindentation testing for studying thermally activated processes from single to nanocrystalline metals. Curr Opin Solid State Mater Sci. 2015;19(6):340–353.
- Barnoush A, Hosemann P, Molina-Aldareguia J, et al. In situ small-scale mechanical testing under extreme environments. MRS Bull. 2019;44(6):471–477.
- Gibson JSKL, Schröders S, Zehnder C, et al. On extracting mechanical properties from nanoindentation at temperatures up to 1000°C. Extreme Mech Lett. 2017;17:43–49.
- Schröders S, Sandlöbes S, Birke C, et al. Room temperature deformation in Fe7Mo6 µ-phase. Int J Plast. 2018;108:125–143.
- Takata N, Ghassemi Armaki H, Terada Y, et al. Plastic deformation of the C14 Laves phase (Fe,Ni)2Nb. Scr Mater. 2013;68(8):615–618.
- Chen R, Sandlöbes S, Zehnder C, et al. Deformation mechanisms, activated slip systems and critical resolved shear stresses in an Mg-LPSO alloy studied by micro-pillar compression. Mater Des. 2018;154:203–216.
- Kishida K, Shinkai Y, Inui H. Room temperature deformation of 6H–SiC single crystals investigated by micropillar compression. Acta Mater. 2020;187:19–28.
- Zhao C, Chu K, Mei Q, et al. Laves phase strengthening in ultrafine-grained Co–Cr–Ta micropillars under uniaxial compression at modest temperature. Mater Sci Eng A. 2020;791:139782.
- Korte S, Barnard JS, Stearn RJ, et al. Deformation of silicon – insights from microcompression testing at 25–500 °C. Int J Plast. 2011;27(11):1853–1866.
- Schröders S, Sandlöbes S, Berkels B, et al. On the structure of defects in the Fe7Mo6 μ-phase. Acta Mater. 2019;167:257–266.
- Pei Z, Zhang X, Hickel T, et al. Atomic structures of twin boundaries in hexagonal close-packed metallic crystals with particular focus on Mg. NPJ Comput Mater. 2017;3(1):1–7.
- Pei Z, Zhu L-F, Friák M, et al. Ab initio and atomistic study of generalized stacking fault energies in Mg and Mg–Y alloys. New J Phys. 2013;15(4):043020.
- Nie JF, Zhu Y, Liu J, et al. Periodic segregation of solute atoms in fully coherent twin boundaries. Science. 2013;340(6135):957–960.
- Sadigh B, Erhart P, Stukowski A, et al. Scalable parallel Monte Carlo algorithm for atomistic simulations of precipitation in alloys. Phys Rev B. 2012;85(18):184203.
- Zhao H, Huber L, Lu W, et al. Interplay of chemistry and faceting at grain boundaries in a model Al Alloy. Phys Rev Lett. 2020;124(10):106102.
- Yang Z, Zhang L, Chisholm MF, et al. Precipitation of binary quasicrystals along dislocations. Nat Commun. 2018;9(1):1–7.
- Liu X, Song X, Wang H, et al. Complexions in WC-Co cemented carbides. Acta Mater. 2018;149:164–178.
- Korte S, Clegg WJ. Studying plasticity in hard and soft Nb-Co intermetallics. Adv Eng Mater. 2012;14(11):991–997.
- Guénolé J, Zubair M, Roy S, et al. Exploring the transfer of plasticity across Laves phase interfaces in a dual phase magnesium alloy. Mater Des. 2021;202:109572.