
 ?Mathematical formulae have been encoded as MathML and are displayed in this HTML version using MathJax in order to improve their display. Uncheck the box to turn MathJax off. This feature requires Javascript. Click on a formula to zoom.
ABSTRACT
The bioeconomy encompasses the extraction, processing and transformation of renewable biological resources and waste streams, connected to activities as diverse as food, feed, energy and manufacturing. Under the auspices of the European Union’s ‘Green Deal' strategy, this broad collective of sectors is promoted as a cornerstone for achieving sustainable growth. Progress in developing ex-ante tools of economy-wide modelling analysis to assess its performance is, however, hindered by a paucity of consistent and comprehensive data. To overcome this shortcoming, the construction steps for a new set of open access social accounting matrices (dubbed ‘BioSAMs’) is described for a detailed and comprehensive selection of traditional and contemporary bio-based accounts for each of the EU member states. To illustrate its potential, a structural analysis based on three different and complementary methods (Rasmussen-Jones, hypothetical extraction method and eigenvector) is performed to classify bio-based sector wealth generating properties and to identify high performance (‘key') sectors.
1. Introduction
The European Green Deal (EC, Citation2019a) is the flagship growth strategy that seeks to transform the economic, social and environmental landscape in the European Union, to ensure a resource responsible and sustainable model of human development. As a basis for realising this goal, the Circular Economy Action Plan (EC, Citation2019b) promotes (inter alia) the reuse of primary resources and waste, the decoupling of economic growth from energy usage and the ambition of climate neutrality by 2050. As part of this ambitious vision, the EU bioeconomy strategy (EC, Citation2012; EC, Citation2018) formalises a traditional model of human development focussing on biomass (i.e. biologically renewable resources and biological waste) as a source of prosperity. As a building block of the ‘circular economy’ (Carus & Dammer, Citation2018; Georgescu-Roegen, Citation1977), the multidimensionality of sustainable growth requires a bioeconomy that can reconcile itself with our planet’s biophysical boundaries and deliver desirable outcomes on a number of fronts (e.g. employment, growth, climate change, biodiversity, energy and food self-sufficiency). In principle, these challenges can be navigated with the help of biotechnological advancements and sensibly targeted public policies, although there remains considerable debate and associated literature on how best to achieve these goals (e.g. OECD, Citation2012; The Bell et al., Citation2018; Pfau et al., Citation2014; White House, Citation2012).
Against this background, evidence-based economic insights on this broad and diverse sector form an invaluable part of the policy debate. Examples in the economic literature discuss the merits of biomass allocation choices through the lens of appropriately designed indicators, the stages of economic development within the bioeconomy or the identification of synergies and/or trade-offs in the achievement of policy goals. For example, McCormick and Kautto (Citation2013) and Swinnen and Weersink (Citation2013) discuss the EU and global bioeconomy, respectively, and the subsequent challenges in policy design and implementation; Fritsche and Iriarte (Citation2014) analyse the practical implementation of different framework analyses in different EU regions based on different concepts of high-value sectors; and M'barek et al. (Citation2014) describe the first attempts to obtain valid socio-economic indicators for the analysis of the bioeconomy in the EU.
Furthermore, whilst secondary data coverage of traditional bioeconomy activities is ‘relatively’ accessible, data inventories of more-contemporary biomass sources and bio-based activities are scarce, which severely hampers the estimation of the economic importance of these evolving sectors within national economies. Of the few available examples, Ronzon et al. (Citation2017) estimate indicators of production and employment for 16 NACE Rev.2 sectors (related to bioeconomy) for 2014; Camia et al. (Citation2018) assess EU biomass production for primary sector bioeconomy activities, between 2004 and 2015; Spekreijse et al. (Citation2019) focus on different biochemical indicators (production, turnover, trade and price data) in the EU for ten different chemical product categories for 2018, with an extrapolation to 2025.
These studies, whilst valuable to the policy debate, only take a partial approach to measure the performance of the bioeconomy. The key aim of this study, however, is to contribute to the pressing need for systems-wide databases that fully integrate detailed food, feed, energy and material bio-based activities within established national accounts data. In this regard, the input–output (IO) framework has emerged as a key candidate. In the context of the policy discussion above, this class of data not only provides easily accessible information for descriptive economic analysis, but also facilitates direct short-run comparisons of relative economic performance with non-biobased (rival) activities, as candidates for promoting growth and employment. Moreover, in medium- to long-term simulation experiments, such data constitutes an essential starting point for quantifying the synergies, trade-offs and rebound effects from an array of economic, social and environmental indicators when exploring alternate bioeconomy transition pathways consistent with visions of sustainable growth.Footnote1
A first major step in the construction of such a database was initiated by the Joint Research Centre (JRC) of the social accounting matrices (SAMs) were estimated for each member state (MS), called ‘AgroSAMs’ for the year 2000, with a detailed disaggregated split of primary agricultural accounts (Müller et al., Citation2009).Footnote2 The AgroSAMs were subsequently updated to 2007 and employed to examine the structural properties of said sectors (Philippidis et al., Citation2014). Elsewhere, Budzinski et al. (Citation2017) estimated a multiregional input – output (IO) model for Germany with detailed splits focussed on analysing the forestry supply chain, whilst Escobar et al. (Citation2018) examined the bioplastics sector modifying the structure of a global model.
Taking a further step in this direction, this paper presents a new set of estimated SAMs for 2010 for each of the EU member states, dubbed ´BioSAMs`, which consolidates and significantly deepens the representation of the bioeconomy. More specifically, as with the AgroSAMs, the definition of non biobased manufacturing and services activities in the BioSAMs is consistent with national accounts data, whilst both databases follow the same nomenclature for the coverage of primary agriculture and food sector accounts. In addition, however, the BioSAMs extend the treatment of bioeconomy activities to encompass further sources of wood based and lignocellulosic biomass, a representative breakdown of liquid biofuels types, solid biomass for electricity and biochemicals. In this way, whilst non-exhaustive, the BioSAMs exhibit a considerably broader representation of biobased sectors beyond the typical feed and food representation found in most economy-wide databases of this type. As is typical to the SAM structure, the BioSAMs extend the inter-industry and final demand relationships found in IO tables, by capturing the complete circular flow of the economic system through explicit linkages between the productive factors and institutional accounts. To the best of our knowledge, this database represents the most detailed, consistent and comprehensive set of EU member states SAM tables for the bioeconomy.Footnote3
The rest of this paper is as follows. Section two discusses the structure of the SAM table and details the steps employed to open the biobased activity accounts within the BioSAMs. Section three presents an analytical application of the structural properties of the biobased activities within the BioSAMs employing a sensitivity analysis of three complementary linear multiplier techniques to identify ‘key sectors’. The study concludes that there is considerable relative wealth generating potential within cereals and livestock activities and commodities as well as contemporary bioindustrial activities. Section 4 provides some critical discussion of the database and suggests recommendations for further research directions.
2. Material and Methods
2.1. Social Accounting Matrices: Concept and general issues.
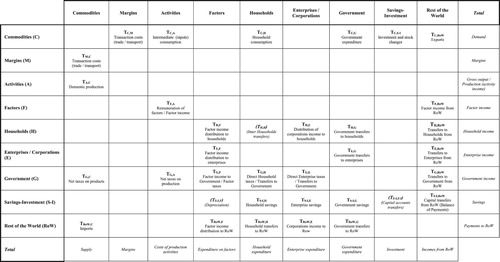
A SAM is a square matrix in which activities, commodities, factors or institutions are represented through accounts that are presented by rows and columns. Each cell in the matrix shows the payment from the column account to the row account, so the resources of one account are shown along the row and the uses in the column and, due to the double entry system, total resources of each account match exactly its total uses. Indeed, the SAM can be considered as a natural extension of IO tables. Moreover, the SAM structure overcomes some limitations of the IO tables by internalising the complete process of production, trade, income generation and redistribution among institutional sectors (Pyatt & Round, Citation1985; Pyatt & Thorbecke, Citation1976), which not only enables the analysis of inter-industrial relations, but also social and environmental issues.Footnote4
In general, the elaboration of a SAM requires an important volume of statistical information, of which the IO framework provides the core, since it contains the interrelationships between activities and commodities and, at least at the aggregated level, the values of the links with the institutional sectors.Footnote5 This key information can be derived from the traditional symmetric table or from the more detailed Supply-Use Tables (SUT). In both cases, it is possible to build a SAM that distinguishes between activities and commoditiesFootnote6 or that defines the productive sectors based on only one of the two concepts.
A Social Accounting Matrix has six basic groups of accounts (see Figure ): Activities and/or Commodities, Factors, Private Institutions – (Households and Corporations/Enterprises), Government (public institutions), Capital accounts (usually combined) and an account for the Rest of the World. The final dimension of the matrix is determined by the level of disaggregation of these six groups. Subject to data availability, this structure can be modified to provide a more explicit representation of specific socioeconomic issues.Footnote7
FIGURE 1. A Social Accounting Matrix (SAM) structure.
2.2. Estimation of ‘first-stage’ SAMs
The construction of the BioSAMs for each of the member states consists of two main stages, each with three steps. This section discusses the first stage, which consists of the construction of ‘MacroSAMs’, ‘MicroSAMs’ and finally ‘first-stage’ SAMs. Thus, in the first step, an auxiliary matrix called a MacroSAM is populated with aggregates for the main sub-matrices of the SAM, employing official macro-economic data. The main data source for this is the non-financial annual sector accounts (Eurostat, Citation2016a). These accounts provide values paid and received, by institutions, for the main macro-variables of the economy. shows the relationship between institutions and SAM accounts and contains the macro-variables used to characterise the MacroSAMs.Footnote8 Data from this statistical operation are used for aggregate production, supply and demand, primary factors (labour and capital), taxes and institutional accounts (i.e. ‘household’, ‘government’, ‘corporations’ and ‘rest of the world’). Having populated these cells, a so-called closure matrix (cells containing links between institutions) that maintains a strict equality between the aggregate data row and column targets, is estimated employing the bi-proportional RAS method (Miller & Blair, Citation2009).
TABLE 1. Institutional sectors correspondence in Eurostat and SAM accounts.
TABLE 2. Macro-variables used to build MacroSAMs.
In the second step, the MacroSAM structure is converted into a MicroSAM, with a full coverage of the specific branches of the activities and commodity accounts. In our application, the procedure of estimation of these extended submatrices from the MacroSAM consists of entering information from the 2010 SUTs (Eurostat, Citation2016b), with their original structure of 65 sectors/products. In this context, there are also previous examples in the literature showing the construction of SAMs from IO frameworks (either symmetric IO tables or Supply-Use tables). Examples, among others, include Breisinger et al. (Citation2009) and more recently, Alvarez-Martinez and López-Cobo (Citation2018), who build SAMs for the member states of the EU from the multiregional WIOD tables (Dietzenbacher et al., Citation2013; Timmer, Citation2012).
Thus, using Eurostat’s SUT structure, it is possible to depict production and transactions processes of the national economy, describing the structure of the costs of production, the value added generated and the flows of goods and services, both domestically produced and from foreign trade. With reference to Figure , the Supply table provides values for sub-matrix TA,C (domestic production), imports, taxes less subsidies on products and margins. The Use table is used to populate submatrix TC,A (intermediate consumption), submatrix TF,A (labour and capital remuneration), final consumption (of households and government), gross capital formation, exports and taxes less subsidies on production.
With the Eurostat SUT as a key source, the initial set of MicroSAMs follow the activity classifications of Eurostat NACE Rev. 2 (Statistical classification of economic activities in the European Community, revised version 2) (Eurostat, Citation2008b) and the commodity Classification of Products by Activity (CPA) (Eurostat, Citation2008c). These MicroSAMs are finalised by correcting (where necessary) minor differences arising from different concepts in the SUT (consumption by residents abroad, payments to labour and indirect taxes and others).
In the final step, ‘first-stage’ SAMs are generating by mapping and aggregating all non-primary agriculture and food (activity and commodity) accounts in the MicroSAM to the classifications in version 9 of the Global Trade Analysis Project (GTAP) database (Aguiar et al., Citation2016). On the one hand, this allows for a quality check on the coherence of the results with other existing approaches. More crucially, the redefining of the MicroSAMs based on the GTAP products classification facilitates the subsequent opening of additional accounts through the use of other compatible databases (see next sections) and their subsequent reconciliation within a more complete and detailed accounts structure for the BioSAMs (i.e. higher disaggregation of agricultural sectors and the inclusion of institutional accounts). Thus, at the end of this step, provides the classification of activities and commodities (largely following version 9 of the GTAP nomenclature) used in the final estimated ‘first-stage’ SAMs.
TABLE 3. Sectors (activities and commodities) classification in the first-stage SAMs.
2.3 Estimation of the EU-28 BIOSAMS
Starting with the first-stage SAMs which mainly follow the GTAP nomenclature of sectors (32) and products (32) (), the final major stage is the disaggregation of two groups of bio-based sectors. Firstly, a further split of the aggregate agricultural (arable and livestock activities and products) and food industry accounts. Secondly, a split of select contemporary biobased energy and industrial accounts and their feedstocks, which remain hidden within the Eurostat SUT or standard GTAP accounts definitions. Thus, to facilitate this step, the sectors and products that require further splits are Agriculture (includind livestock); Forestry; Food industry; Petroleum, coal; Chemicals, rubber and plastics; Wood products and Electricity and gas. This major stage consists of three steps described in the following subsections.
2.3.1. Splitting out ‘Agriculture’ and ‘Food’ accounts.
The information needed to perform the disaggregationFootnote9 of agricultural activities (and livestock activities and products) and food industry activities, comes from two main databases. Tables and below show the primary sector and food industry final disaggregation. The Complete and Consistent (CoCo) database from the Common Agricultural Policy Regionalised Impacts (CAPRI) modelling system (Britz & Witzke, Citation2014) for each of the MSFootnote10 is exploited following the procedure described in Müller et al. (Citation2009) to obtain AgroSAMs, with updated values to 2010. The adapted data from CoCo provides information for intermediate and final consumption of agricultural commodities by institutional sectors (households, government and investment) and for the estimation of the production coefficients and value added of agricultural activities. This step therefore enables the agricultural sector splits within the submatricesFootnote11 TC,-, T-,C, TA,- and T-,A in Figure .
TABLE 4a. Biobased activities/commodities classification in BioSAMS.
TABLE 4b. Non-biobased activities/commodities classification in BioSAMS
The Economic Accounts for Agriculture (EAA) from Eurostat (Eurostat, Citation2016c), provides information to check the previous estimations and for additional balances. In this sense, data from the EEA are used as a quality check for primary sectors’ aggregate values (monetary flows) and is used as a proxy for extrapolation in case of data gaps or inconsistencies in specific activities and/or countries. Also, the EEA gives highly disaggregated information for crops and livestock activities on production, taxes and subsidies, and aggregate agriculture values of output, intermediate consumption, gross and net value added, gross fixed capital formation (GFCF), compensation of employees, other taxes and subsidies on production, net operating surplus or net mixed income, property income and net entrepreneurial income in current prices.
2.3.2. Disaggregation of Non-primary biobased sectors
Subject to available data for each of the EU member states, this step consists of separating contemporary bioenergy and bioindustry sectors, and their relevant feedstocks from their parent industries. To perform this step, it is assumed that ‘biochemicals’ and ‘biofuels’ activities (four types) are split from the chemicals sector,Footnote12 energy crops are disaggregated from forestry, pellets are extracted from wood products, and bioelectricity is taken from electricity and gas. For interindustry flows, the MAGNET (Woltjer et al., Citation2014) database provides a basis for the technical coefficients of these industries, which are refined with the addition of Eurostat data on labour (Eurostat, Citation2016d) and JRC specific bioeconomy datasets (JRC, Citation2017). This enables the split of the submatrices (TC,-, T-C, TA,- and T-,A) for activities and commodities of biobased sectors (see for final disaggregation).
2.3.3. Final estimation of the BioSAMsFootnote13
As discrepancies from previous account splits arise when reconciling different sources of data, the third major step to obtain BioSAMs is the correction and balance of the resulting BioSAMs. Previously, in addition to the aforementioned databases used to disaggregate the bioeconomy accounts in their technical and production areas, it has been necessary to resort to household budget surveys, specific databases for member states and / or sectors and opinions of experts to obtain, in a coherent way with previous technical estimates, an adequate estimation of the vectors of consumption, margins, taxes and foreign trade. When it has not been possible to obtain reliable information, approximations have been made based on the available data of explanatory variables.Footnote14
For the final balancing and estimation, accepted tools such as bi-proportional estimation (RASFootnote15) and Cross Entropy methods are employed (McDougall, Citation1999; Robinson et al., Citation2001) to ensure a smooth adjustment of the matrices cells, subject both to macroeconomic targets, and cells aggregations targets where additional information of actual values was available.
2.4. Key sectors analysis
2.4.1. Structural multipliers
To demonstrate the usefulness of the BioSAMs, this study performs a structural analysis of the bio-economy sectors. In the IO literature, such an analysis is carried out using systems-wide linear multipliers that identify and assess the sphere and strength of inter-sectoral influence between those activities of interest and the rest of the economy. In this way, the structural analysis reveals those activities that show promise as major motors of growth and wealth generation. To this end, the detection of ‘key sectors’ is a frequently-used tool in the IO and SAM literature (Cardenete & Sancho, Citation2006; Dietzenbacher, Citation1992; Miller & Blair, Citation2009; Sonis et al., Citation1995). The ‘key sectors’ of an economic system, as defined by Hirschman (Citation1958), are those activities that generate growth effects in the rest of the system that are above the normalised average.
It is noted, however, that amongst the toolbox of multiplier techniques, there is no consensus on a single ‘best’ approach (Iraizoz, Citation2006; Leung & Pooley, Citation2001). Indeed, each method interprets and computes structural influence under a different criterion, with the result that there can often be a deviation in their outcomes. Accordingly, one is led to the conclusion that each of the approaches should be considered as complementary to one other (Cardenete & Sancho, Citation2006; Kay et al., Citation2007).
This study therefore performs a class of sensitivity analysis of three recognised approaches to obtain backward and forward linkages: Rasmussen-Jones method (Jones, Citation1976), the hypothetical extraction method (HEM) (Dietzenbacher & van der Linden, Citation1997) and the eigenvector method (Dietzenbacher, Citation1992). All three techniques come originally from IO models and here are extended to the BioSAMs.Footnote16
The Rasmussen-Jones method considers the whole structure of inter-sectoral flows, using an approach based on changes in final demand, maintaining the structure unaltered (Leung & Pooley, Citation2001), but doesn't take into account the total production values or total demand, that is, the size of the sector (Alcántara, Citation1995; Alcántara & Padilla, Citation2003; Iraizoz, Citation2006; Sonis et al., Citation1995). The HEM is especially pertinent for questions of ex-ante analysis (i.e. ‘what if’ questions) (Kay et al., Citation2007; Leung & Pooley, Citation2001), estimating the impact of what would occur if the economic contribution of a given industry ‘i’ was removed from the accounts, whilst maintaining the rest of the system’s industrial structure unaltered (Dietzenbacher & van der Linden, Citation1997). Finally, the eigenvalue method has the ability to detect clusters of sectors that work more or less independently from the rest of the economic structure (Dietzenbacher, Citation1992).
In this exercise, the determination of key sectors will be based on the Rasmussen criterion (Rasmussen, Citation1956), using backward and forward linkages. Therefore, normalising all multipliers by the corresponding average value, backward and forward linkages are converted into relative measures, summarised in .
TABLE 5. Classification of sectors according to their backward and forward linkages
In the three methods, backward linkages have been estimated from the Leontief model (Leontief, Citation1941) and the Ghosh model (Ghosh, Citation1958). Based on the demand driven Leontief model applied to the SAM, x = Ax + y, where x is the vector of output of endogenousFootnote17 accounts, y the vector of final demand and A the so-called technical coefficients matrix, whose elements are the elements of the SAM divided by the total of their corresponding column. The Leontief-type multipliers matrix L=(I–A)-1 is obtained, satisfying the condition x = Ly. Meanwhile, following the supply driven Ghosh model (Ghosh, Citation1958), x’=x’B + v’, where v is value added or primary factors and B is the distribution coefficients matrix, calculated by the elements of the SAM divided by the total of their corresponding row. The Ghosh- multipliers matrix is therefore derived as G=(I–B)-1.
2.4.2. Three multiplier methods
Jones (Citation1976) modified the original Rasmussen approach to determine key sectors calculating forward linkages using the output matrix of the Ghosh model instead of the input matrix (as done in Leontief model). The resulting expressions for total backward (BLRJ) and forward (FLRJ) linkages (weighted and unweighted) are:
(1)
(1)
(2)
(2)
where n is the number of endogenous accounts, lk,i is an element of the multipliers matrix L, gi,k is an element of matrix G and αk the weight of account i. Thus, the backward (forward) linkages are simply the sum of the corresponding multipliers in columns (rows), which captures the total pull (absorption) capacity of each account Normalized backward (birj) and forward (firj) linkages are obtained dividing BLiRJ and FLiRJ by the corresponding average value of the backward-, or forward linkage multiplier for endogenous sectors.
The second method proposed by Schultz (Citation1977) determines the importance of a sector i, by deleting its corresponding row and columns in the input coefficients matrix A and calculating the resulting reduced output with the Leontief model. The difference between total outputs with and without the presence of sector i indicates its sphere of influence. Dietzenbacher and van der Linden (Citation1997) proposed a variant of this methodFootnote18 distinguishing between backward and forward HEM linkages and using both, input matrix A and output matrix B. The backward linkage of sector i (BLihem) is obtained by collapsing the i-th column of A (Ac-i), applying the Leontief model calculating output differences and rescaling (to avoid measure units issues) per unit of output:
(3)
(3)
with
y.
Forward linkage of sector i (FLihem) is obtained analogously, but now collapsing i-th row of B (Br-i) in the Ghosh model:
(4)
(4)
with
.
Again, a relative measure of backward (bihem) and forward (fihem) linkages is obtained by normalising with respect to the average value.
Finally, following Dietzenbacher (Citation1992), the eigenvector method uses the left-hand Perron vector (q) of technical coefficients matrix A as a measure of normalised backward linkages (bev) and the right-hand Perron vector (z) of distribution coefficients matrix B as a proxy of normalised forward linkages (fev):
(5)
(5)
(6)
(6)
λ being the dominant eigenvalue of matrices A and B and n the number of endogenous accounts.
3 Results
The final result is a set of 28 EU MS BioSAMs for 2010, which contain 171 accounts, including 80 activity/commodity accounts (see Table S1 in the supplementary material). There are 21 accounts for crop activities, six for livestock and their products, 14 for food processing (including processed animal feed and oilcake feed by-product from biodiesel), three biomass supply accounts (forestry, energy crops and pellets), five for bioenergy (first–generation bioethanol and biodiesel, second-generation biochemical- and thermochemical biomass conversion technologies, and bioelectricity), three other bioindustrial accounts (textiles, wood and biochemical) and one fishing account. The remaining 27 sectors/commodities cover natural resources (three accounts covering coal mining, fossil fuels and raw minerals), manufacturing (ten accounts), energy (one composite account for electricity and gas) and services (13 accounts). In addition, the BioSAMs include two production factors (labour and capital), a single account for margins (trade and transportation) and three tax accounts (taxes and subsidies on production, consumption and direct taxes). Finally, row and column accounts for the private household, corporate activities, central government, investments-savings and the rest of the world are each identified separately. The BioSAMs are publically available and can be downloaded from the JRC DataM portal together with a summary of their methodology and structure.Footnote19 The results of the key sector analysis for aggregate EU bioeconomy activities and commodities (aggregated as shown in Table A1 of the annex) are summarised in Tables and , for the EU28 aggregate and the number of member states in which they are specifically classified as ‘key’.Footnote20
TABLE 6. Classification of the bioeconomy activities and commodities for the EU28 aggregate.
As primary sectors, ‘cereals’, ‘livestock’ (intensive and extensive) and ‘raw milk’ are the bioeconomy accounts that are classified as key sectors across the three multiplier methods, both as an activity, as well as a commodity. The primary sectors of ‘fishing’, ‘other crops’ and ‘other animal products’, both as activities and commodities, are also considered as key according to the HEM approach, whilst the latter is also categorised as key for activities and commodities under the eigenvector method.
Elsewhere, ‘food’ as an activity is key across the three methods used. As a commodity, ‘food’ is only classified as key according to the eigenvector, backward oriented according to HEM and forward oriented according to Rasmussen (although in both cases close to ‘key’ status). Similar results can be observed for ‘dairy’, although in this case a greater importance is observed from the perspective of being a forward oriented sector.
Regarding non-primary bioeconomy sectors, ‘biomass’ is clearly identified as a forward oriented activity, although this sector’s commodities are key according to the HEM and eigenvector method. The activities of the ‘bioindustry’ are key according to the three methods, but, the commodities of the sector are classified differently according to the method used. For example, the bioindustry commodity is forward oriented according to Rasmussen-Jones, backward oriented in accordance with eigenvector and without significantly high linkages according to the HEM method. This is perhaps because of the wide range of commodities falling under this heading, which may confound the effects. On the other hand, as a multi-commodity industry, bioindustry technologies meet common characteristics that grant it the status of a key sector. Finally, the bioenergy sectors, although not found to be significant by the Rasmussen-Jones methodology, (probably due to their small relative output and demand value), do show evidence of exhibiting a clear backward trend according to the other methods, both as activities and commodities, and is even considered as a key activity in the HEM approach.
Figure shows the frequency of the 28 member states where a given sector is classified as key according to each of the methods proposed. As a general observation, both the HEM and the eigenvector methods (in this case with the exception of agricultural activities) consider that bioeconomy sectors are key in a larger number of member states. ‘Livestock’ and ‘raw milk’ are classified as key sectors, both as activities and commodities, in a large number of member states, although agri-food activities (‘food’ and ‘dairy’) are key to almost all member states across the three methods (except ‘dairy’ under the Rasmussen-Jones method). Agricultural activities are also key in many MS, although the number of related commodities considered key is certainly smaller, with the slight exception of ‘cereals’.
FIGURE 2. Frequency of key bioeconomy activities/commodities by alternative multipliers (number of EU member states).
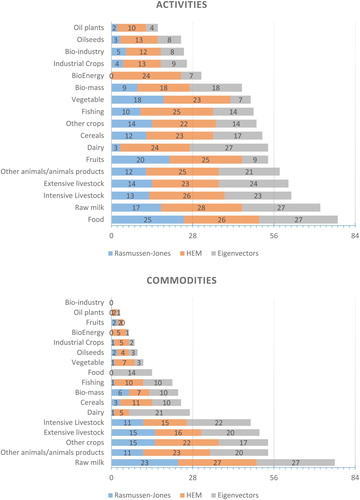
‘Bioindustry’ commodity accounts are not key for any MS under any of the three criteria used, although the activities of the sector are determined as key for 12 and 8 MS according to the HEM and eigenvector methods, respectively. In the case of ‘bioenergy’, according to HEM its activities are key for 24 of the 28 MS. The eigenvector method counts ‘bioenergy’ as key in only seven MS, whilst there are no MS examples recorded under the Rasmussen-Jones method, once again largely due to the effect of the scale of these sectors on national economies. Finally, ‘biomass’ presents similar behaviour, classified as a key activity in 18 member states according to the HEM and eigenvector methods and nine according to the Rasmussen-Jones method, while respective results for the ‘biomass’ commodity account are seven, ten and six member states, respectively.
4. Discussion
The EU policy agenda has been radically reformed by the launch in 2019 of the ‘Green Deal’. This umbrella strategy seeks to roadmap an equitable, climate-neutral, and sustainable model of economic development. In promoting fossil-substituting technologies and through the reusage of waste and residue biomass streams, the bioeconomy, which permeates many aspects of the modern economy, forms a core part of the Green Deal. As a basis for conducting policy relevant impact assessments, there is therefore a clear and present need for consistent and comprehensive economy-wide frameworks that explicitly represent the interdependences between the bioeconomy and the broader macroeconomy.
This paper is a first attempt to bridge that gap by describing the steps to integrate a detailed representation of the biobased and natural resources economy for each of the EU member states, within the official structure of the national accounts for the statistical offices of the European Union. To the best of our knowledge, the resulting social accounting matrices (BioSAMs) are currently the most complete multisectorial database of the bioeconomy that exists for each of the EU member states, with a comprehensive and detailed coverage of bio-based sectors and their links with the rest of the economic activity accounts and institutional accounts (Households, Government and Corporations).
Whilst it is expected that the coverage of specific biobased technologies or value chains into respective secondary databases will steadily improve over time, the introduction of new NACE and PRODCOM classifications typically requires many years to come to fruition. Thus, for tackling the immediate pertinent research questions for the EU bioeconomy from an economy-wide perspective, it is hoped that the ‘BioSAMs’ will be a de facto resource for useful descriptive analysis, the application of structural linear multiplier models, or as a basis for calibrating computable general equilibrium foresight studies. In addition, in combination with additional socio-economic or environmental satellite data, they can be used (inter alia) in the detailed analysis of job and value added creation, sustainable growth and use of resources or environmental impacts.
A general caveat of the work relates to the paucity of detailed available data to open specific biobased accounts in the BioSAM (Budzinski et al., Citation2017), which necessitated the need, in some cases, to resort to restrictive assumptions. Thus, whilst the initial construction of the standard SAMs is highly reliable and verifiable due to the direct use of statistical information on the national accounts compiled by Eurostat (subject to publication delays), the subsequent splitting of agricultural and non-food/feed biobased accounts requires, especially in the case of the latter, the use of information from dispersed and even non-published sources of data and expert insights.Footnote21
As an illustration of the potential of this database, a structural analysis of the bioeconomy to identify the main motors of biobased growth, denominated as key sectors, has been carried out. As a definitive economy-wide ex-ante quantitative descriptor of the structure of an economy, key sector analysis offers an insightful and easily interpretable summary of the economic performance of a single activity, or collective of activities. For example, to assess the relative (short-run) impacts on wealth generation or employment generation arising from a given demand-driven economic shock. As a result, this class of analysis has garnered considerable interest in policy circles to pinpoint potential ‘champion’ sectors, which could serve as a key input into a better understanding of structural economic change and even policy design.
Based on the Rasmussen criterion, a series of three recognised and respected complementary structural multiplier approaches are performed (Rasmussen-Jones, hypothetical extraction method and eigenvector method). The three methods converge on the conclusion that primary bioeconomy sectors ‘cereals’, ‘intensive’ and ‘extensive livestock’ and ‘raw milk’ are strong key sectors for the EU28 aggregate, ‘bioindustry’ activities are also key. As a result, each of these sectors, in relative terms, is capable of generating a cumulative demand driven (backward-linkage) and supply driven (forward-linkage) wealth effect, which exceeds the value of the initial impetus in the economic system. For example, raw milk has diverse outputs (e.g. butter, cheese, skimmed milk, whey) and multiple inputs (feeds, veterinary costs, chemicals, energy etc.), which generate proportionally larger ripple effects throughout the economy. Moreover, ‘biomass’ is revealed as a forward oriented sector, which confirms the notion that the uses of biomass are particularly varied (food, feed, energy, industry), resulting in considerable supply driven effects as biomass is transformed into alternate processed products. Elsewhere, ‘bioenergy’ sectors are not detected as key, but have a significant backward capacity, which indicates that there is a considerable portfolio in the structure of inputs (types of biomass, energy, chemicals) required in the production of biofuels that generate above-average demand driven effects
The results obtained are coherent with previous approximations based on the analysis of multipliers and backward and forward linkages (Fuentes-Saguar et al., Citation2017; Philippidis & Sanjuán-López, Citation2018). In Fuentes-Saguar et al. (Citation2017) the multipliers of output are specified by large groups of bioeconomic activities, although their characterization is not developed as a key sectors analysis within the economic structures of the MS (although their main features can be inferred). Meanwhile, in Philippidis and Sanjuán-López (Citation2018) a more appropriate sectorial disaggregation is used, based on the properties of the backward and forward linkages, although unlike the current paper, they do not consider variations in outcomes that may arise from the use of different structural multipliers to verify the robustness and coherence of the results.
From a policy perspective, the illustrative application in the current paper provides direct input into the fifth pillar of the EU’s bioeconomy strategy (EC, Citation2018).Footnote22 Biomass represents a biologically renewable, albeit not unlimited, specific resource for biobased activity. Thus, in seeking to guide member state and EU public policy decisions on how best to allocate biomass, our results already provide an initial (short-run) picture of the relative return from different biobased applications. For example, on the activity accounts of the BioSAM, the three multiplier techniques indicate that bioindustry may be capable of generating greater relative wealth than bioenergy. This is consistent with the ‘cascading principle’ (EC, Citation2012), which prioritises higher value added biomass reuse prior to burning for energy. On the other hand, this is not aligned with current EU policy practise that currently promotes biomass for energy over material use (OECD, Citation2012, Vis et al., Citation2016), which further runs the risk of crowding out private sector investments in promising nascent bioindustrial technologies (Carus et al., Citation2011).
The policy usefulness of the database itself, is further reaching for the Bioeconomy Strategy and by extension, the Green Deal. This becomes apparent when considering the quantification of the trade-offs and synergies between all five pillars of the Bioeconomy Strategy. For example, European Commission annual agricultural market outlooks (EC, Citation2019c) already exist to examine issues of food security (pillar 1) and competitiveness (pillar five). On the other hand, only a systems-wide macroeconomic market model calibrated to the BioSAMs is able to address pertinent policy questions that combine outcomes for all five pillars at EU and member state level. This could include public policy support initiatives, targeted investments in contemporary bioindustrial activity, or market shocks arising from changing fossil fuel prices or carbon taxes. The resulting outcomes can be evaluated in terms of the pattern of biomass allocation across competing sectors (pillar two), the implications for EU food and energy self-sufficiency (pillar one and three), the role in reducing the manufacturing base’s dependence on carbon based inputs (pillar four) and indeed, market competitiveness (pillar five).
Looking ahead, there are still gaps within the bioeconomy that are not currently captured within the BioSAMs. For example, further research could be channelled into improving the representation of the forestry sector, as well as the usage of solid woody biomass for energy (i.e. bioheat), which constitutes a significant portion of biomass for bioenergy usage. Furthermore, a key element of the biobased circular economy is the activity of municipal and industrial waste collection, processing and disposal (composting, recycling, incineration for energy). To internalise to a greater degree the multidimensional policy aims of the bioeconomy, an even more ambitious line of research could seek to incorporate additional transactions accounts to capture non-market ecosystem services within the SAM structure (Vallecillo et al., Citation2019). In the same vein, a superior measurement of sustainability indicators could also be examined through the lens of material flows of physical biomass units (i.e. dry-matter, wet-matter, carbon content) and their reconciliation and verification with the value transactions in the member state accounting framework (Van Berkel & Delahaye, Citation2019).
Supplemental Material
Download MS Word (112.2 KB)Acknowledgments
The authors thank Robert M'barek and Emanuele Ferrari (Joint Research Centre-Unit D.4, Seville) who provided helpful comments on an earlier draft of the paper. The authors are also indebted to two anonymous reviewers whose thorough comments have greatly improved the quality of the paper.
Disclosure statement
No potential conflict of interest was reported by the author(s).
Additional information
Funding
Notes
1 In this paper, we take a strictly economy-wide approach to the assessment of the bioeconomy. As a result, we do not consider micro-scale non-economic sustainability assessment tools of, such as, for example, life cycle assessment models.
2 The availability of the AgroSAMs also served as a crucial input for the compilation of the agricultural accounts in the EU-funded EXIOBASE (see Stadler et al., Citation2018). A table describing the AgroSAM activities and commodities is included in the supplementary materials document.
3 There are several IO type databases worldwide, with national and/or international or interregional flows: EORA (Lenzen et al., Citation2012, Citation2013), EXIOBASE (Stadler et al., Citation2018), GTAP (Aguiar et al., Citation2016) or WIOD (Timmer, Citation2012; Dietzenbacher et al., Citation2013). All of these are respected and tremendously useful. The contribution of BioSAMs, however, is not only the incorporation of this detailed disaggregation of biobased sectors into a SAM scheme for all EU member states, but the use of the activities by commodities structure and a complete coherence with national accounts data.
4 The concept of a SAM begins with Stone (Citation1947), whose pioneering work includes most of the conventions that would later be adopted by economic and statistical organisations developing this tool. Pyatt and Thorbecke (Citation1976) subsequently formalised the concept of a SAM, which paved the way for its use as a framework for economic analysis and planning (see also Pyatt & Round, Citation1985) in areas including employment, poverty, growth and income distribution and trade.
5 Due to this dependence, most of the SAMs are estimated for the same base year as relevant existing IO frameworks.
6 The distinction between productive sectors (activities) and the goods and services produced (commodities) is proposed in the current guidelines of national accounts (i.e. the European System of National and Regional Accounts, ESA 2010 - EC, Citation2013).
7 The general characteristic of this structure, as well as specific issues of its definition and composition can be found in Eurostat (Citation2008a), Miller and Blair (Citation2009), EC (Citation2013) and Mainar-Causapé et al. (Citation2018).
8 Note that the MacroSAMs do not include domestic margins.
9 For the interested reader, in the literature there are several methodological papers describing the disaggregation of IO tables: Aislabie and Gordon (Citation1990), Barrera-Lozano et al. (Citation2015), Lindner et al. (Citation2012) or Wenz et al. (Citation2015) among others.
10 The incorporation of the CoCo into the agricultural accounts of the BioSAMs follows the approach of Müller et al., (Citation2009) for the AgroSAMs. Thus for a fuller technical description of the CoCo and EAA data sources and their reconciliation within the accounts, the reader is advised to consult sections 3.7, 3.8 and 7 of their (open access) report. This CoCo database does not include data for Croatia, so values for this country were estimated using its aggregates from Eurostat and the CoCo average neighbourhood values as proxies.
11 TC,- and T-,C (TA,- and T-,A) refer to submatrices with commodities (activities) accounts in rows and columns, respectively.
12 Also, fertilizer products are split here.
13 In Table A2 of the appendix, a list of BioSAM summary statistics for four example member states are provided, following the sectoral definitions employed in the multiplier analysis in section 2.4.
14 The subsequent modelling of activities that use biobased products could show some potential shortcomings in some specific sectors (e.g., only one representative animal feed sector for the multitude of feed types to cattle). Given data restrictions, this remains a shortcoming of the BioSAM database, although compared with current databases of this type, the detail provided still provides a valuable information base for assessment and analysis.
15 There KRAS method (Lenzen et al, Citation2009) or other RAS variants (Lenzen et al., Citation2014; Wiebe and Lenzen, Citation2016) apply RAS with negative values, with restrictions in isolated cells or with aggregate values of previously known parts of the matrix. Nevertheless, although it is clear that the application of a method such as KRAS is recommendable, especially in an automated application, it is also possible to apply RAS and act manually on restrictions of this type. This is the case for the BioSAMs, since the variations in the data between specific sectors and specific countries make the known restrictions vary between one estimate and another, with the result that it was desirable to control the restrictions manually (also, in the application here, there were no negatives in the sub-matrices balanced with RAS).
16 IO multipliers and their extension to SAMs can be found in Pyatt and Round (Citation1979) or Miiler and Blair (Citation2009), among many others.
17 In this application, the accounts 'government', 'saving-investment' and 'rest of the world', are held exogenous. This implies that, in the Leontief model, final demand (y) refers to the sum of government expenditure, investments and export; whilst in the Ghosh model, the vector v is the sum of payments to government (as total values of taxes and/or others), savings, and imports.
18 This method is the so-called non-complete HEM (Temurshoev and Oosterhaven, Citation2010).
20 In the supplementary information document, Tables S2-S4 show detailed results for all member states.
21 At the time of writing, work has already begun to estimate and construct BioSAMs for the year 2015, with a possible update for 2017. The key issue is the availability of coherent, consistent and updated data to perform the split of the non-agricultural/food bio-based sectors from their ‘parent’ activities. This remains a challenge. For agriculture, work to open the agricultural accounts is already underway employing the CoCo database as the principal source, along with Eurostat’s EAA.
22 The five pillars are: (i) Ensuring food and nutrition security; (ii) managing natural resources sustainably; (iii) reducing dependence on non renewable, unsustainable resources; (iv) mitigating and adapting to climate change and (v) strengthening European competitiveness and creating jobs.
References
- Aguiar, A., Narayanan, B., & McDougall, R. (2016). An overview of the GTAP 9 data base. Journal of Global Economic Analysis, 1(1), 181–208. https://doi.org/10.21642/JGEA.010103AF
- Aislabie, C., & Gordon, M. (1990). Input-output in Practice: Sector Disaggregation in Regional Input-Output Tables. Economic Systems Research, 2(4), 407–420. https://doi.org/10.1080/09535319000000030
- Alcántara, V. (1995). Economía y contaminación atmosférica: hacia un nuevo enfoque desde el análisis input–output [Doctoral thesis]. University of Barcelona.
- Alcántara, V., & Padilla, E. (2003). Key sectors in final energy consumption: an input–"output application to the Spanish case. Energy Policy, 31(15), 1673–1678. https://doi.org/10.1016/S0301-4215(02)00233-1
- Alvarez-Martinez, M. T., & López-Cobo, M. (2018). WIOD SAMs adjusted with Eurostat data for the EU-27. Economic Systems Research, 30(4), 521–544. https://doi.org/10.1080/09535314.2018.1448758
- Barrera-Lozano, M., Mainar-Causapé, A., & Vallés, J. (2015). Disaggregation of sectors in Social Accounting Matrices using a customized Wolsky method. Applied Economics Letters, 22(13), 1020–1024. https://doi.org/10.1080/13504851.2014.995357
- Bell, J., Paula, L., Dodd, T., Németh, S., Nanou, C., Mega, V., & Campos, P. (2018). EU ambition to build the world’s leading bioeconomy—Uncertain times demand innovative and sustainable solutions. New Biotechnology, 40, 25–30. https://doi.org/10.1016/j.nbt.2017.06.010
- Breisinger, C., Thomas, M., & Thurlow, J. (2009). Social accounting matrices and multiplier analysis. International Food Policy Research Institute (IFPRI).
- Britz, W., & Witzke, P. (2014). CAPRI model documentation. Retrieved October 18, 2017 from http://www.capri-model.org/docs/capri_documentation.pdf.
- Budzinski, M., Bezama, A., & Thrän, D. (2017). Monitoring the progress towards bioeconomy using multi-regional input-output analysis: The example of wood use in Germany. Journal of Cleaner Production, 161, 1–11. https://doi.org/10.1016/j.jclepro.2017.05.090
- Camia, A., Robert, N., Jonsson, R., Pilli, R., García-Condado, S., López-Lozano, R., van der Velde, M., Ronzon, T., Gurría, P., M’Barek, R., Tamosiunas, S., Fiore, G., Araujo, R., Hoepffner, N., Marelli, L., & Giuntoli, J. (2018). Biomass production, supply, uses and flows in the European Union. First results from an integrated assessment. EUR 28993 EN, Publications Office of the European Union.
- Cardenete, M. A., & Sancho, F. (2006). Missing links in key sector analysis. Economic Systems Research, 18(3), 319–325. https://doi.org/10.1080/09535310600844409
- Carus, M., Carrez, D., Kaeb, H., Ravenstijn, J., & Venus, J. (2011). Level Playing Field for Biobased Chemistry and Materials. Nova Institute Policy Paper 2011-07-29, Huerth, Germany, July 2011. Retrieved December 2017, from http://bio-based.eu/download/?did=878&file=0.
- Carus, M., & Dammer, L. (2018). The Circular Bioeconomy—Concepts, Opportunities, and Limitations. Industrial Biotechnology, 14(2), 83–91. https://doi.org/10.1089/ind.2018.29121.mca
- Dietzenbacher, E. (1992). The measurement of interindustry linkages: Key sectors in the Netherlands. Economic Modelling, 9(4), 419–437. https://doi.org/10.1016/0264-9993(92)90022-T
- Dietzenbacher, E., Los, B., Stehrer, R., Timmer, M., & de Vries, G. (2013). The construction of World Input–Output Tables in the WIOD Project. Economic Systems Research, 25(1), 71–98. https://doi.org/10.1080/09535314.2012.761180
- Dietzenbacher, E., & van der Linden, J. (1997). Sectoral and spatial linkages in The EC production structure. Journal of Regional Science, 37(2), 235–257. https://doi.org/10.1111/0022-4146.00053
- EC, European Commission. (2012). Innovating for Sustainable Growth: A Bioeconomy for Europe. Communication from the Commission to the European Parliament, the Council, the European Economic and Social Committee and the Committee of the regions, 2012. European Commission, DG Research and Innovation.
- EC, European Commission. (2013). Sistema Europeo de Cuentas Nacionales y Regionales de la Unión Europea 2010. European Commission.
- EC, European Commission. (2018). A sustainable bioeconomy for Europe : strengthening the connection between economy, society and the environment. Updated Bioeconomy Strategy, https://doi.org/10.2777/478385
- EC, European Commission. (2019a). Communication from the Commission to the European Parliament, The European Council, the Council, The European and Economic Social Committee and the Committee of the Regions – the European Green Deal, COM/2019/640 final. https://eur-lex.europa.eu/legal-content/EN/TXT/?uri=COM%3A2019%3A640%3AFIN.
- EC, European Commission. (2019b). The Circular Economy Action Plan for a cleaner and more competitive Europe. https://ec.europa.eu/environment/circulareconomy/pdf/new_circular_economy_action_plan.pdf.
- EC, European Commission. (2019c). The EU agricultural outlook for markets and income 2019-2030. DG Agriculture and Rural Development. Publications Office of the European Union.
- Escobar, N., Haddad, S., Börner, J., & Britz, W. (2018). Land use mediated GHG emissions and spillovers from increased bioplastic consumption. Environmental Research Letters, 13(12), 125005. https://doi.org/10.1088/1748-9326/aaeafb
- Eurostat. (2008a). Eurostat Manual of Supply, Use and Input-Output Tables. Eurostat Methodologies and Working papers. Office for Official Publications of the European Communities.
- Eurostat. (2008b). NACE Rev.2 Statistical classification of economic activities in the European Community, Methodologies and working papers.
- Eurostat. (2008c). CPA 2008 - Statistical Classification of Products by Activity.
- Eurostat. (2016a). Non-financial transactions (nasa_10_nf_tr). http://ec.europa.eu/eurostat/cache/metadata/en/nasa_10_nf_tr_esms.htm.
- Eurostat. (2016b). Supply, use and Input-output tables (naio_10). http://ec.europa.eu/eurostat/cache/metadata/en/naio_10_esms.htm.
- Eurostat. (2016c). Economic Accounts for Agriculture (aact_eaa01). http://ec.europa.eu/eurostat/cache/metadata/en/aact_esms.htm.
- Eurostat. (2016d). Labour Force Survey (lfs_egan22d). http://ec.europa.eu/eurostat/statistics-explained/index.php/Labour_market.
- Fritsche, U., & Iriarte, L. (2014). Sustainability Criteria and Indicators for the Bio-Based Economy in Europe: State of Discussion and Way Forward. Energies, 7(11), 6825–6836. https://doi.org/10.3390/en7116825
- Fuentes-Saguar, P., Mainar-Causapé, A., & Ferrari, E. (2017). The Role of Bioeconomy Sectors and Natural Resources in EU Economies: A Social Accounting Matrix-Based Analysis Approach. Sustainability, 9(12), 2383. https://doi.org/10.3390/su9122383
- Georgescu-Roegen, N. (1977). Bioeconomics, a New Look at the Nature of Economic Activity. In L. Junker (Ed.), The Political Economy of Food and Energy (pp. 105–134). Taylor & Francis.
- Ghosh, A. (1958). Input-output approach to an allocative system. Economica, 25(97), 58–64. https://doi.org/10.2307/2550694
- Hirschman, A. (1958). The strategy of economic development. Yale University Press.
- Iraizoz, B. (2006). ¿Es determinante el método en la identificación de los sectores clave de una economía? Una aplicación al caso de las tablas Input-Output de Navarra. Estadística Española, 48, 551–585.
- Joint Research Centre (JRC). (2017). Jobs and Turnover in the European Union Bioeconomy. http://datam.jrc.ec.europa.eu/datam/public/pages/datasets.xhtml.
- Jones, L. (1976). The measurement of Hirschmanian linkages. Quarterly Journal of Economics, 90(2), 323–333. https://doi.org/10.2307/1884635
- Kay, D., Pratt, E., & Warner, M. E. (2007). Role of Services in Regional Economy Growth. Growth and Change, 38(3), 419–442. https://doi.org/10.1111/j.1468-2257.2007.00377.x
- Lenzen, M., Gallego, B., & Wood, R. (2009). Matrix balancing under conflicting information. Economic Systems Research, 21(1), 23–44. https://doi.org/10.1080/09535310802688661
- Lenzen, M., Kanemoto, K., Moran, D., & Geschke, A. (2012). Mapping the structure of the world economy. Environmental Science & Technology, 46(15), 8374–8381. https://doi.org/10.1021/es300171x
- Lenzen, M., Moran, D. D., Geschke, A., & Kanemoto, K. (2014). A non-sign-preserving RAS variant. Economic Systems Research, 26(2), 197–208. https://doi.org/10.1080/09535314.2014.897933
- Lenzen, M., Moran, D., Kanemoto, K., & Geschke, A. (2013). Building Eora: A Global Multi-regional Input-Output Database at High Country and Sector Resolution. Economic Systems Research, 25(1), 20–49. https://doi.org/10.1080/09535314.2013.769938
- Leontief, W. (1941). The Structure of American Economy, 1919–1929: An Empirical Application of Equilibrium Analysis. Cambridge University Press.
- Leung, P., & Pooley, S. (2001). Regional economic impacts of reduction in fisheries production: a supply driven approach”. Marine Resource Economics, 16(4), 251–262. https://doi.org/10.1086/mre.16.4.42629336
- Lindner, S., Legault, J., & Guan, D. (2012). Disaggregating input-output models with incomplete information. Economic Systems Research, 24(4), 329–347. https://doi.org/10.1080/09535314.2012.689954
- M'barek, R., Philippidis, G., Suta, C., Vinyes, C., Caivano, A., Ferrari, E., Ronzon, T., Sanjuan-Lopez, A., & Santini, F. (2014). Observing and analysing the bioeconomy in the EU: Adapting data and tools to new questions and challenges. Bio-based and Applied Economics, 3, 83–91. https://doi.org/10.22004/ag.econ.172417
- Mainar-Causapé, A., McDonald, S., & Ferrari, E. (2018). Social accounting matrices: basic aspects and main steps for estimation, JRC Technical Reports EUR 29297 EN. Publications Office of the European Union, Luxembourg, 2018, https://doi.org/10.2760/010600.
- McCormick, K., & Kautto, N. (2013). The Bioeconomy in Europe: An Overview. Sustainability, 5(6), 2589–2608. https://doi.org/10.3390/su5062589
- McDougall, R. A. (1999). Entropy Theory and RAS are Friends, GTAP Working Paper, 300, Department of Agricultural Economics, Purdue University.
- Miller, R., & Blair, P. (2009). Input-Output Analysis: Foundations and Extensions (2nd edition). Cambridge University Press.
- Müller, M., Perez-Dominguez, I., & Gay, S. H. (2009). Construction of social accounting matrices for the EU27 with a Disaggregated agricultural sector (AgroSAM). JRC Scientific and Technical Reports, JRC 53558, https://ec.europa.eu/jrc/en/publication/eur-scientific-and-technical-research-reports/construction-social-accounting-matrices-eu-27-disaggregated-agricultural-sector-agrosam.
- OECD. (2012). The Bioeconomy to 2030. Designing a Policy Agenda. OECD. https://www.oecd-ilibrary.org.
- Pfau, S. F., Hagens, J. E., Dankbaar, B., & Smits, A. J. M. (2014). Visions of Sustainability in Bioeconomy Research. Sustainability, 6(3), 1222–1249. https://doi.org/10.3390/su6031222
- Philippidis, G., Sanjuán, A. I., Ferrari, E., & M’barek, R. (2014). Employing social accounting matrix multipliers to profile the bioeconomy in the EU member states: is there a structural pattern? Spanish Journal of Agricultural Research, 12(4), 913–926. https://doi.org/10.5424/sjar/2014124-6192
- Philippidis, G., & Sanjuán-López, A. I. (2018). A re-examination of the structural diversity of biobased activities and regions across the EU. Sustainability, 10(11), 4325. https://doi.org/10.3390/su10114325
- Pyatt, G., & Round, J. (1979). Accounting and fixed-price multipliers in a social accounting matrix framework. The Economic Journal, 89(356), 850–873. https://doi.org/10.2307/2231503
- Pyatt, G., & Round, J. (1985). Social accounting matrices: A basis for planning. The World Bank.
- Pyatt, G., & Thorbecke, E. (1976). Planning techniques for a better future. Ginebra, International Labour Office.
- Rasmussen, P. (1956). Studies in inter-sectorial Relations. Holanda, North-Holland Publishing.
- Robinson, S., Cattaneo, A., & El-Said, M. (2001). Updating and estimating a social accounting matrix using cross entropy methods. Economic Systems Research, 13(1), 47–64. https://doi.org/10.1080/09535310120026247
- Ronzon, T., Piotrowski, S., M’Barek, R., & Carus, M. (2017). A systematic approach to understanding and quantifying the EU’s bioeconomy. Bio-Based and Applied Economics, 6, 1–17. https://doi.org/10.22004/ag.econ.276283
- Schultz, S. (1977). Approaches to Identifying Key Sectors Empirically by Means of Input-Output Analysis. Journal of Development Studies, 14(1), 77–96. https://doi.org/10.1080/00220387708421663
- Sonis, M., Guilhoto, J. M., Hewings, G. J. D., & Martins, E. B. (1995). Linkages, Key Sectors, and Structural Change: Some New Perspectives. The Developing Economics, 33, 233–270.
- Spekreijse, J., Lammens, T., Parisi, C., Ronzon, T., & Vis, M. (2019). Insights into the European market of bio-based chemicals. Analysis based on ten key product categories. EUR 29581 EN, Publications Office of the European Union, Luxembourg. https://doi.org/10.2760/549564.
- Stadler, K., Wood, R., Bulavskaya, T., Södersten, C.-J., Simas, M., Schmidt, S., Usubiaga, A., Acosta-Fernández, J., Kuenen, J., Bruckner, M., Giljum, S., Lutter, S., Merciai, S., Schmidt, J. H., Theurl, M. C., Plutzar, C., Kastner, T., Eisenmenger, N., Erb, K.-H.,…Tukker, A. (2018). EXIOBASE 3: Developing a Time Series of Detailed Environmentally Extended Multi-Regional Input-Output Tables. Journal of Industrial Ecology, 22(3), 502–515. https://doi.org/10.1111/jiec.12715
- Stone, R. (1947). Measurement of national income and the construction of social accounts. Ginebra, United Nations.
- Swinnen, J., & Weersink, A. (2013). Challenges and policy options in the global bio-economy: introduction and overview. Agricultural Economics, 44(4-5), 379–380. https://doi.org/10.1111/agec.12021
- Timmer, M., ed. (2012) TheWorld Input–Output Database (WIOD): Contents, Sources and Methods.WIODWorking Paper Number 10. http://www.wiod.org/publications/papers/wiod10.pdf.
- Temurshoev, U., & Oosterhaven, J. (2010). On Input-Output Linkage Measures. Working Papers in Input-Output Economics, WPIOX, 10-02.
- Vallecillo, S., La Notte, A., Kakoulaki, G., Roberts, N., Kamberaj, J., Dottori, F., Feyen, L., Rega, C., & Maes, J. 2019. Ecosystem services accounting. Part II-Pilot accounts for crop and timber provision, global climate regulation and flood control, EUR 29731 EN, Publications Office of the European Union, Luxembourg, 2019, ISBN 978-92-76-02905-2. https://doi.org/10.2760/631588, JRC116334.
- Van Berkel, J., & Delahaye, R. (2019). Material Flow Monitor 2016 – Technical Report, CBS, Statistics Netherlands, The Hague, February 2019.
- Vis, M., Mantau, U., & Allen, B. (eds.) (2016). CASCADES: Study on the optimised cascading use of wood. No. 394/PP/ENT/RCH/14/7689. Final Report. Brussels, Belgium.
- Wenz, L., Willner, S. N., Radebach, A., Bierkandt, R., Steckei, J. C., & Levermann, A. (2015). Regional and sectoral disaggregation of multi-regional input-output tables - a flexible algorithm. Economic Systems Research, 27(2), 194–212. https://doi.org/10.1080/09535314.2014.987731
- The White House USA. (2012). National Bioeconomy Blueprint. The White House. https://obamawhitehouse.archives.gov/sites/default/files/microsites/ostp/national_bioeconomy_blueprint_april_2012.pdf.
- Wiebe, K., & Lenzen, M. (2016). To RAS or not to RAS? What is the difference in outcomes in multi-regional input-output models? Economic Systems Research, 28(3), 383–402. https://doi.org/10.1080/09535314.2016.1192528
- Woltjer, G. B., Kuiper, M. H., & Rutten, M. (2014). The MAGNET Model: Module Description, Manual / LEI. LEI Wageningen UR Report 14-057. The Hague.