
 ?Mathematical formulae have been encoded as MathML and are displayed in this HTML version using MathJax in order to improve their display. Uncheck the box to turn MathJax off. This feature requires Javascript. Click on a formula to zoom.
Abstract
Manual evaluation could be time-consuming, unreliable and unreproducible in Chinese-English interpretation. Therefore, it is necessary to develop an automatic scoring system. This paper proposes an accurate automatic scoring model for Chinese-English interpretation via a multi-indicator assessment. From the three dimensions (i.e. keywords, content, and grammar) of the scoring rubrics, three improved attention-based BiLSTM neural models are proposed to learn the text of the transcribed responses. In the feature vectorisation stage, the pre-training model Bert is utilised to vectorise the keywords and content, and a random initialisation is used for the grammar. In addition, the fluency is also taken into account based on the speech speed. The overall holistic score is obtained by fusing the four scores using the random forest regressor. The experimental results demonstrate that the proposed scoring method is effective and can perform as good as the manual scoring.
1. Introduction
Automatic assessment of interpretation has recently become one of the hot spots in the field of Computer-Assisted Language Learning (CALL). Most of the research on automatic scoring of spoken English such as reading task, focuses on the prosodic features (e.g. oral fluency and intonation) (Cheng, Citation2018; Lin et al., Citation2020; Shi et al., Citation2020). For example, Lin et al. (Citation2020) assessed test takers’ performance in the English follow-read task using a multi-task learning framework. However, there is still a lack of effective solutions when tasks involving text features (e.g. keywords and grammar) are encountered, such as translation or question-answering. Although some studies have been carried out to address this issue, their performance of automatic scoring for large-scale oral English tests is still limited. In the following, we identify two main challenges facing the Chinese-English interpretation task:
For keyword scoring, the scores are obtained by using the keyword synonyms, since the key points of the test takers’ responses have a great impact on the scoring results. Therefore, the scoring model should consider not only the keywords of each test taker’s response, but also the keyword synonyms (Yoon & Lee, Citation2019). Neural network has unique advantages in natural language processing, pattern recognition and other fields (Diao et al., Citation2022; Fang et al., Citation2020; Liang et al., Citation2022). We therefore develop a keyword synonym corpus, and use neural network models to learn the correlation between keywords and synonyms to obtain the score of the keywords.
For content scoring, traditional methods get the scores by calculating the semantic similarity between the test takers’ responses and the reference answers. With the development of deep learning (Benkhelifa et al., Citation2020; Evanini et al., Citation2017; Li et al., Citation2020; Qian et al., Citation2018) in the field of natural language processing, the score of the content can be computed directly through deep learning methods. Qian et al. (Citation2019) used deep learning methods to study the scoring of the content, and the results showed that their Pearson correlation coefficients were higher than the previous machine learning models. The domestic Dolphin team (Liu et al., Citation2020) applied the long-head attention mechanism to address the problem of content scoring and showed good accuracy. Therefore, we employ deep learning to assess the content in the automatic scoring of Chinese-English interpretation.
In this paper, an automatic scoring model to assess the Chinese-English interpretation quality is proposed. According to the Syllabus of Higher Education Self-study Examination for Business English Interpretation and Listening (hereinafter referred to as Syllabus), the evaluation should mainly focus on the key points and sentence content, and score will be deducted if grammar and pronunciation are so poor as to be unintelligible. Following the Syllabus, we select the keywords, content, grammar and fluency as the scoring indicators to build the scoring model. Comprehensive experiments conducted on real-world data to validate the effectiveness of the proposed approach.
The main contributions of this paper are as follows:
We develop a multi-indicator assessment that combines the keywords, content, grammar and oral fluency as the scoring rubrics for Chinese-English interpretation evaluation, which is more accurate and comprehensive.
We propose an automatic scoring model based on the multi-indicator assessment. Three improved attention-based BiLSTM models are employed to evaluate the keywords, content and grammar of the response.
We conduct extensive experiments on the dataset, and the experimental results demonstrate that our proposed scoring model outperforms the other baselines.
2. Related work
Regarding automatic assessment of interpreting, researchers have tried to emulate what has been achieved in applied linguistics, machine translation, and natural language processing. A number of researchers have examined the relationship between utterance fluency measures and human raters’ perceived fluency ratings for different modes of interpreting (Christodoulides & Lenglet, Citation2014; Han et al., Citation2020; Z.-W. Wu, Citation2021; Yu & van Heuven, Citation2017). For example, Han and Lu (Citation2021) correlated eight utterance fluency features with fluency ratings of five expert raters and found that several temporal variables concerning speed and breakdown fluency had moderate-to-strong correlations with the fluency ratings.
With respect to automatic assessment based on linguistics features, Liu (Citation2021) select the criteria of information accuracy, output fluency, and audience acceptability to evaluate the interpreting quality and employed statistical modelling based on decision tree analysis to train the assessing model, the results indicated that the proposed approach was capable of distinguishing students’ interpretations of different qualities. Ouyang et al.’s (Citation2021) conducted research on 67 Chinese-to-English consecutive interpretations samples from the All China Interpreting Contest (ACIC) and assessed the spoken-language interpreting quality based purely on linguistic indices from Coh-Metrix analysis.
In terms of automatic assessment of interpreting based on machine translation metrics (e.g. BLEU), Han and Lu (Citation2021) explored to what extent machine translation metrics such as BLEU, NIST, METEOR, TER, and BERT correlate with human scores using different scoring methods, and the result showed there were moderate-to-strong correlations between most of the machine translation metrics and the human scores, which indicates the possibility to automate interpreting quality assessment based on the machine translation metrics.
In regard to automatic assessment of interpreting based on natural language processing, in Le et al.’s (Citation2018) study, an interpreting corpus of 6700 utterances was built and was then fed into several word confidence estimation systems that combine 9 automatic speech recognition features for speech transcription and 24 features related to machine translation. In Stewart et al.’s (Citation2018) study, the feature-based quality estimation model Quest++ was augmented with four additional interpreting-specific features to evaluate the interpreting quality.
Previous research shows that neutral networks have rarely been used for the automatic assessment of Chinese-English interpretation. To fill this gap, this paper proposes a neural network model based on Bert, BiLSTM and Attention mechanism (for short, Bert-BiLSTM-Attention) for the automatic scoring in the Chinese-English interpretation task.
3. The automatic scoring model for Chinese-English interpretation
This section will elaborate the proposed automatic scoring model. It first introduces the overall framework and process of the proposed model, and then describes the main components of the proposed model.
3.1. The framework
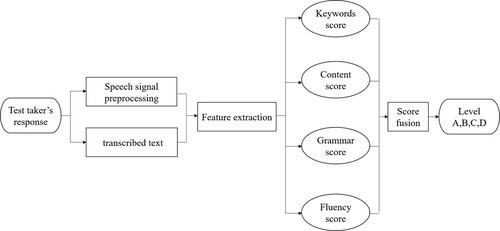
The overall process of the proposed automatic scoring model for Chinese-English interpretation is shown in Figure . First, manual transcription is performed on the test taker’s spoken response. Based on the speech signal and transcribed text, the features of text and pronunciation are extracted. Then, the scores of keywords, content, grammar and fluency are obtained respectively. Finally, the four scores are weighted and summed by the score fusion model to generate the holistic score and its corresponding level.
Figure 1. Process of the proposed automatic scoring method for Chinese-English interpretation.
3.2. Feature extraction and scoring of keywords
According to the scoring rubrics of Chinese-English interpretation (see Table 4), it is very important to assess the keywords and their synonyms in the test takers’ responses. The following two aspects must be considered in order to appropriately evaluate the keywords in the test takers’ responses: (1) the number of translated keywords in the responses. (2) The use of keywords and keyword synonyms in the responses.
The Bert-BiLSTM-Attention neural network model proposed in this paper has three features: (1) The first is the application of the Bert model, which can extract rich semantic features at the word level and the sentence level of the sequence. (2) BiLSTM model can learn contextual features. (3) The attention mechanism is used to assign weights to the features so that the model can focus on the most important semantic information in the sentence.
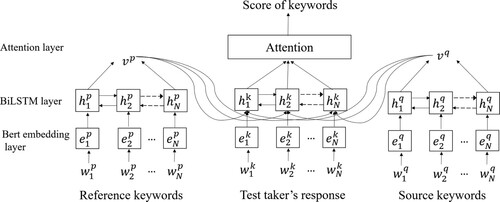
We refer the keywords to be translated in a question as source keywords and keywords in a reference answer as reference keywords. Different from the traditional method that directly inputs the responses into the neural network to get the keywords score (Chen et al., Citation2018; Liang et al., Citation2021), by referring the method used in the cross-language task (Zhou et al., Citation2018; Citation2022), we concatenate the reference keywords and the source keywords to the test takers’ response, and then train them with the neural network model in that the semantic information of the source and reference keywords can provide more semantic information and help the model to learn the relation between the keywords and the score better. Meanwhile, in the practice of human scoring, human raters will assign the score to students who use keyword synonyms. So we also build a corpus containing keywords and their frequently used synonyms for use in the experiment.
The keywords scoring model built in this work is illustrated in Figure . It consists of three layers: Bert-Embedding layer, BiLSTM layer and Attention layer. They are described in detail as follows.
Bert-Embedding layer
Figure 2. Keyword scoring model.
Pre-training models represented by BERT model combined with deep learning technology have been widely used in various research fields of natural language processing (Zhang et al., Citation2022). The task of this layer is to represent each word or character with a dense vector (Zhang et al., Citation2020). We use Bert model (Devlin et al., Citation2018) to convert the keywords into word vectors (e.g. ,
,
, etc.). Compared with Word2Vec (Grohe, Citation2020), Bert is mainly composed of a bidirectional transformer encoding structure, which can better learn contextual relation between words in a text. Based on the Bert model, we use the dimensions of {128, 256, 512} for comparison in the training process.
BiLSTM layer
For reference keywords and source keywords, we further extract their semantic feature vectors and
in the BiLSTM layer.
and
are obtained by concatenating the last hidden state from both forward and reverse direction, e.g. concatenating
to get
. This is because the last hidden state can be considered as a summary of all vocabulary features (Xu et al., Citation2019). For test takers’ responses, the input
of BiLSTM at time step N comes from three sources:
,
and the input word features of the test takers’ responses (see Equation (1)).
(1)
(1)
Attention layer
This layer assigns weights to the output feature vectors of the BiLSTM layer to highlight the features that play a key role in keywords scoring. Since the holistic score is numeric, we treat the scoring task as a regression task and use the mean square error (MSE) as a loss function when training the model, as shown in Equation (2).
(2)
(2) where
is the loss value for each batch during the training process,
is the size of each batch,
is the predicted score of the model, and
is the reference score of human raters.
3.3. Feature extraction and scoring of content
In the interpretation task, the test takers should not only translate the keywords correctly, but also should express the sentence meaning clearly. It is necessary to evaluate the sentence content. We refer the sentence to be translated as source sentence (Liu et al., Citation2020, April). Figure illustrates the content scoring model based on Bert-BiLSTM-Attention.
Figure 3. Content scoring model.
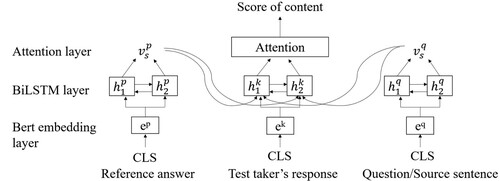
From Figure , we can see that the structure of the content scoring model is similar to that of the keywords scoring model, with two major differences: (1) In the content scoring model, the input could be not only keywords, but also word sequences in the sentence (CLS); (2) the sentence-level semantic features are extracted from the Bert model, not word-level semantic features. We incorporate the features of the reference sentence and the source sentence
into the semantic features of the test takers’ responses, and then output them to the BiLSTM layer.
3.4. Feature extraction and scoring of grammar
The word order, also known as grammar, plays a crucial role to ensure a high quality interpretation output. To evaluate the grammar of the test takers’ responses, we use the method which combines syntactic analysis tree and neural network.
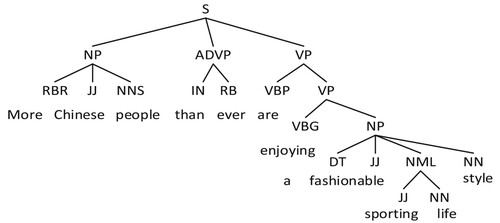
The parse tree represents the syntactic structure of a sentence in the form of a tree. The root node of the tree represents the label of the sentence, the branch node represents the label of the phrase, and the leaf node represents the part-of-speech (PoS) label of the word. For example, the source sentence is “越来越多的中国人开始享受一种时尚的运动型生活方式”, and the reference answer is “More Chinese people than ever are enjoying a fashionable sporting life style”. We generate a parse tree of the reference answer based on Stanford (De et al., Citation2006) and Parser, and then sequentially arrange the terminal nodes to form the syntactic structure of the sentence (e.g. [RBJ, JJ, NNS, … , NN]), as shown in Figure .
Figure 4. The parse tree.
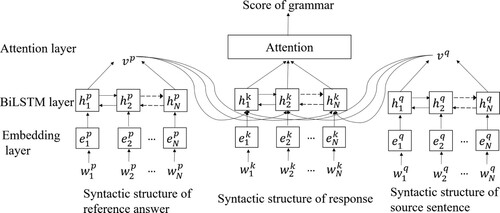
With the parse tree, we build a grammar scoring model based on BiLSTM and Attention mechanism, as shown in Figure . The differences from the keywords scoring model are as follows: (1) The input of the model is the POS of the sentence (e.g. [RBJ, JJ, NNS, … , NN]). (2) In the embedding layer, we use a random initialisation technique for the vectorisation stage. The upper network is used to learn the relation between the grammar and the score.
Figure 5. Grammar scoring model.
3.5. Feature extraction and scoring of oral fluency
Oral fluency is an important indicator of a person's oral coherence and proficiency. Fluency is usually measured by the speech speed, pronunciation time ratio, and pause duration (Liuyan, Citation2015). We assess the test takers’ oral fluency based on speech speed and define it as the average pronunciation duration of each word after removing the silent segments. The scoring process is shown in Figure .
Figure 6. The process of the oral fluency scoring.
As shown in Figure , based on short-term energy and zero-crossing rate, the number of words in the test taker's spoken response and the pronunciation duration (without the silent segments) for each word are obtained. The speech speed is then calculated using Equation (3). And the faster the speed is, the higher score the test taker gets.
(3)
(3) where
is the number of words in the test taker’s speech,
is the sequence number for each word, and
is the duration of the pronunciation after removing the silent segments.
3.6. Score fusion model
After getting the scores of the keywords, content, grammar and oral fluency, we need to fuse the four scores into one final score. We perform comparative experiments using the current mainstream regression models in machine learning: linear regression model and random forest regression model. In the linear regression model, the weight of the four feature parameters is set by human and the final score is the weighted sum of each feature. While in the random forest regression model, it uses the Bootstrap sampling (Babar et al., Citation2020), which generates k decision trees through multiple rounds of sampling, and finally averages the results of the k decision trees to get the final score. The experimental results indicate that the random forest regression model outperforms the linear regression model.
4. Data augmentation strategy
4.1. Data
The data in this paper comes from the exam data of the Chinese-English interpretation task in section A of Exam A and Exam B in the Guangdong Higher Education Examination Program for Self-study on 24 October 2015. There are a total of 10 questions. Table shows the first 3 questions and one of their reference answers with keywords highlighted in bold. We collect a total of 2734 spoken responses with accurate manual scoring and labelling, all of which are within 20s in duration and are recorded live by the test takers in the real oral test. Each response is scored on a disperse scale of 0–2 with the interval of 0.5 by two human expert raters, and we take the average score as the reference score.
Table 1. Source sentences and reference answers.
The voice data should be first converted into text data. To accurately evaluate the scoring model, we first perform manual transcription on 2734 spoken responses. At the same time, the conjunction and preposition such as “a”, “the”, “and” are eliminated in order to better extract the semantic features of the responses.
4.2. Data processing method
Since the average number of responses for each question is only 273, and it is difficult to train the neural network model with such limited data. Therefore, inspired by the work of Lun et al.(Citation2020), we employ a data augmentation strategy to enhance our training dataset. Formally, we define a piece of combined data as follows: a source sentence/a question(q), a test taker’s answer(a), a reference answer(p) and a reference score(s). For each question, there are multiple reference answers. Figure shows a toy example of data augmentation strategy. The approach is to match multiple reference answers to the test taker's response of a question. For example, if the first question has four reference answers, then one test taker's response can generate four pieces of data. Therefore, the final amount of data for the first question is 270*4 = 1080. In Figure , q is the question, p1, p2, p3 and p4 are the reference answers, a is the test taker's answer, and s is the reference score. Table shows the amount of data after the data augmentation strategy.
Figure 7. A toy example of data augmentation.
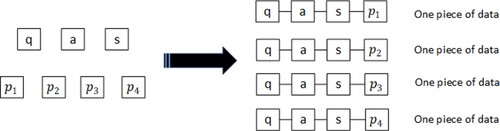
Table 2. The amount of data in the Chinese-English interpretation task after data augmentation strategy.
4.3. Scoring rubrics
Based on the Syllabus and the advice provided by the experts, we set four proficiency levels of A, B, C and D. The scoring rubrics of the human raters are shown in Table . Based on Table , we set our scoring rubrics and the corresponding level for each score in the paper, which is shown in Table . And the proportion of the responses at different levels is listed in Table .
Table 3. Scoring rubrics used by human raters.
Table 4. Scoring rubrics used in this paper.
Table 5. Proportion of the responses at different levels
4.4. Response visualisation
We visualise the spoken responses in the training set by using t-distributed Stochastic Neighbor Embedding (t-SNE), a technique of dimensionality reduction for the visualisation of high-dimensional datasets (Van der Maaten & Hinton, Citation2008). Each response is first transcribed into a word sequence and then represented by a 256-dimensional vector, i.e. the average of the word embedding vectors obtained via Bert model. Figure shows the visualisation of the responses labelled with different levels.
Figure 8. t-SNE visualisation of test takers’ responses. (a) Score A (b) Score B (c) Score C (d) Score D.
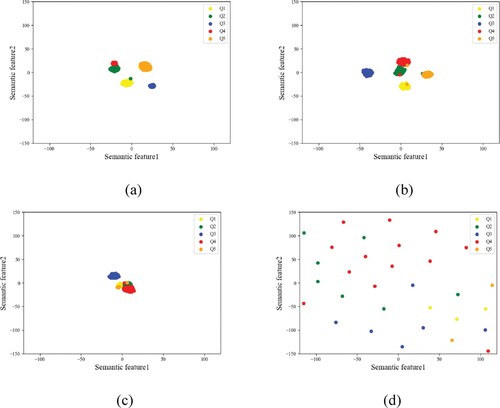
From Figure , we can see that for level A and B, the responses are highly clustered according to the question (Q1, Q2, … , Q5), whereas for level D, the responses appear to be randomly distributed. The reason of this distribution is that the responses of level A and B are excellent responses and closely related to the question, while the responses of level D are terrible responses that vary greatly and usually not related to the question. This observation motivates us to consider incorporating the questions(source sentences) into the scoring models.
5. Empirical study
5.1. Evaluation metrics
This paper uses Pearson correlation coefficient (r, see Equation (4)) and consistency rate (c, see Equation (5)) (Wu et al., Citation2020) to evaluate the performance of the model built in the paper.
(4)
(4)
(5)
(5) where
is the average value of the predicted score of the model,
is the predicted score of each response;
is the average value of reference score of human raters,
is the reference score of each response.
5.2. Experimental results and analysis
As mentioned above, this paper develops a scoring model which assesses keywords, content and grammar based on BiLSTM-Attention and evaluates fluency based on speech speed, and then uses the random forest regression to generate the final score. To evaluate the effectiveness of our proposed model, we design the following comparative experiments:
Model 1: It uses the Siamese-LSTM (Liang et al., Citation2018) model which also acquires rich semantic features to score the keywords, content and grammar, and employs the random forest regression to generate the score.
Model 2: It uses the same methods for keywords, content, grammar and fluency scoring proposed in this paper, but uses the linear regression model to fuse the scores with weights set by human. The weight is set as follows: keywords (0.6), content (0.2), grammar (0.1) and fluency (0.1).
Model 3: To verify the effectiveness of concatenating question/source sentence information to the scoring model, we built a comparative model which only concatenates response and reference answer in keywords, content and grammar scoring, and employs the random forest regression model to generate the score.
Table 6. Performance comparison between different models. (both cconsistency rate and r are the average value of the ten questions)
Table 7. The performance of the proposed model in each question
Table 8. The importance of each scoring rubric in random forest regression model. (average value of 10 question, feature importance has been normalised).
It can be seen from Table that the model used in this paper is highest both in consistency rate and Pearson correlation coefficient, which indicates the effectiveness of our proposed model. And we can also find that model 4 has improved compared with model 3, verifying that concatenating question information to the scoring model will improve the model performance.
As for the environment construction, we select the python development environment and downloads karas, sklearn and other toolkits through Anaconda. And adjust the pre-training weights of BERT. BERT’s attention layer dropout probability is 0.1. Its activation function is gelu, hidden layer dropout probability is 0.1, hidden layer size is set to 256. The total number of parameters in this model is 19,389,218. The training epoch is 80 and batch size is 8. The learning rate is 0.001 and Table shows the experimental results of 10 questions.
Table shows the performance of the proposed model in each question. From Table , we can know that both the consistency rate and correlation between human scoring and model scoring is high, which indicates that the scoring results of the model has high consistency with the human scoring. It can also be seen that the inter-human correlation is relatively low compared with the model-human correlation, this is because that the score of the human is disperse with interval of 0.5 while the score predicted by the model is continuous.
Table illustrates the importance of various scoring rubrics in random forest regression model. The feature importance is calculated with gini importance in the random forest structure. It can be seen from Table that weights of content and keywords are of high importance the value of 0.3997 and 0.4353, while the importance of grammar and oral fluency are relatively low with the value of 0.1593 and 0.0057. The above experimental results show that the importance (weight value) of different scoring rubrics in the model scoring is consistent with the manual scoring standard. Both of them pay more attention to the keywords and content, less attention to the grammar and oral fluency, which is in line with the scoring rules of the exam.
However, different from the manual scoring standard, the scoring model in this paper pays more attention to the content. This result shows that the random forest regression model relies more on the content when making decisions to predict the score of the response. Since the random forest regressor will assign higher weight to feature with high accuracy rate, we conclude that: compared to the keywords scoring, the Bert-BiLSTM-Attention model performs better in content scoring.
6. Conclusion
This paper proposes an automatic scoring model for Chinese-English interpretation based on neural network. We use three attention-based BiLSTM models with different structures to learn the features of keywords, content and grammar, respectively. In the semantic feature vectorisation stage, the pre-training model Bert is employed for the keywords and content, and the random initialisation method is utilised for the grammar. At the same time, in order to improve the accuracy of the model, we integrate the reference answers and the source sentences into the test takers’ responses, and then extract the features. In terms of pronunciation scoring, a fluency scoring method based on the speech speed is applied. The experimental results demonstrate that our proposed scoring model outperforms the other two baseline methods.
In the future, we will consider expanding the corpus data to further improve our model’s performance. We will also consider incorporating more pronunciation-level features (e.g. rhythm, intonation, etc.) into the scoring model.
Disclosure statement
No potential conflict of interest was reported by the author(s).
Additional information
Funding
References
- Babar, B., Luppino, L. T., Boström, T., & Anfinsen, S. N. (2020). Random forest regression for improved mapping of solar irradiance at high latitudes. Solar Energy, 198, 81–92. https://doi.org/10.1016/j.solener.2020.01.034.
- Benkhelifa, R., Biskri, I., Laallam, F. Z., & Aïmeur, E. (2020). User content categorisation model, a generic model that combines text mining and semantic models. International Journal of Computational Science and Engineering, 21(4), 536–555. https://doi.org/10.1504/IJCSE.2020.106867
- Chen, L., Tao, J., Ghaffarzadegan, S., & Qian, Y. (2018, April). End-to-end neural network based automated speech scoring. In 2018 IEEE International Conference on Acoustics, Speech and Signal Processing (ICASSP) (pp. 6234–6238). IEEE.
- Cheng, J. (2018). Real-time scoring of an oral reading assessment on mobile devices. Grantee Submission.
- Christodoulides, G., & Lenglet, C. (2014). Prosodic correlates of perceived quality and fluency in simultaneous interpreting. In N. Campbell, D. Gibbon, & D. Hirst (Eds.), Proceedings of the 7th speech prosody conference (pp. 1002–1006). Speech Prosody 7.
- De Marneffe, M. C., MacCartney, B., & Manning, C. D. (2006, May). Generating typed dependency parses from phrase structure parses. In Lrec (Vol. 6, pp. 449–454).
- Devlin, J., Chang, M. W., Lee, K., & Toutanova, K. (2018). Bert: Pre-training of deep bidirectional transformers for language understanding. ArXiv Preprint, 1810, 04805. https://doi.org/10.48550/arXiv.1810.04805
- Diao, C., Zhang, D., Liang, W., Li, K. C., Hong, Y., & Gaudiot, J. L. (2022). A novel spatial-temporal multi-scale alignment Graph Neural Network security model for vehicles prediction. IEEE Transactions on Intelligent Transportation Systems. 10.1109/TITS.2022.3140229
- Evanini, K., Hauck, M. C., & Hakuta, K. (2017). Approaches to automated scoring of speaking for K–12 English language proficiency assessments. ETS Research Report Series, 2017(1), 1–11. https://doi.org/10.1002/ets2.12147
- Fang, W., Jiang, T., Jiang, K., Zhang, F., Ding, Y., & Sheng, J. (2020). A method of automatic text summarisation based on long short-term memory. International Journal of Computational Science and Engineering, 22(1), 39–49. https://doi.org/10.1504/IJCSE.2020.107243
- Grohe, M. (2020, June). word2vec, node2vec, graph2vec, x2vec: Towards a theory of vector embeddings of structured data. In Proceedings of the 39th ACM SIGMOD-SIGACT-SIGAI Symposium on Principles of Database Systems (pp. 1–16).
- Han, C., Chen, S.-J., Fu, R.-B., & Fan, Q. (2020). Modeling the relationship between utterance fluency and raters’ perceived fluency of consecutive interpreting. Interpreting, 22(2), 211–237. https://doi.org/10.1075/intp.00040.han
- Han, C., & Lu, X. (2021). Interpreting quality assessment re-imagined: The synergy between human and machine scoring. Interpreting and Society, 1(1), 70–90. https://doi.org/10.1177/27523810211033670
- Le, N. T., Lecouteux, B., & Besacier, L. (2018). Automatic quality estimation for speech translation using joint ASR and MT features. Machine Translation, 32(4), 325–351. https://doi.org/10.1007/s10590-018-9218-6
- Li, Y., Zhou, D., & Zhao, W. (2020). Combining local and global features into a Siamese network for sentence similarity. IEEE Access, 8, 75437–75447. https://doi.org/10.1109/ACCESS.2020.2988918
- Liang, G., On, B. W., Jeong, D., Kim, H. C., & Choi, G. S. (2018). Automated essay scoring: A siamese bidirectional LSTM neural network architecture. Symmetry, 10(12), 682. https://doi.org/10.3390/sym10120682
- Liang, W., Li, Y., Xie, K., Zhang, D., Li, K. C., Souri, A., & Li, K. (2022). Spatial-temporal aware inductive graph neural network for C-ITS data recovery. IEEE Transactions on Intelligent Transportation Systems, 1–12. 10.1109/TITS.2022.3156266
- Liang, W., Long, J., Li, K. C., Xu, J., Ma, N., & Lei, X. (2021). A fast defogging image recognition algorithm based on bilateral hybrid filtering. ACM Transactions on Multimedia Computing, Communications, and Applications (TOMM), 17(2), 1–16. https://doi.org/10.1145/3391297
- Lin, B., Wang, L., Feng, X., & Zhang, J. (2020, October). Automatic Scoring at Multi-Granularity for L2 Pronunciation. In INTERSPEECH (pp. 3022–3026).
- Liu, J., Zhang, X., Tian, X., Wang, J., & Sangaiah, A. K. (2020). A novel domain adaption approach for neural machine translation. International Journal of Computational Science and Engineering, 22(4), 445–453. https://doi.org/10.1504/IJCSE.2020.109404
- Liu, Y. (2021). Exploring a corpus-based approach to assessing interpreting quality. In J. Chen & C. Han (Eds.), Testing and assessment of interpreting (pp. 159–178). Springer.
- Liu, Z., Xu, G., Liu, T., Fu, W., Qi, Y., Ding, W, Song, Y, Guo, C, Kong, C, Yang, S, & Huang, G (2020, April). Dolphin: A spoken language proficiency assessment system for elementary education. In Proceedings of The Web Conference 2020 (pp. 2641–2647).
- Liuyan, Y. A. N. G. (2015). An exploratory study of fluency in English output of Chinese consecutive interpreting learners. Journal of Zhejiang International Studies University, 1, 60–68.
- Lun, J., Zhu, J., Tang, Y., & Yang, M. (2020, April). Multiple data augmentation strategies for improving performance on automatic short answer scoring. In Proceedings of the AAAI Conference on Artificial Intelligence (Vol. 34, No. 09, pp. 13389–13396).
- Ouyang, L.-W., Lv, Q.-X., & Liang, J.-Y. (2021). Coh-Metrix model-based automatic assessment of interpreting quality. In Testing and assessment of interpreting: Recent developments in China (pp. 179–200). Singapore: Springer.
- Qian, Y., Lange, P., Evanini, K., Pugh, R., Ubale, R., Mulholland, R., & Wang, X. (2019). Neural approaches to automated speech scoring of monologue and dialogue responses. In ICASSP 2019-2019 IEEE International Conference on Acoustics, Speech and Signal Processing (ICASSP) (pp. 8112–8116). IEEE.
- Qian, Y., Ubale, R., Mulholland, M., Evanini, K., & Wang, X. (2018, December). A prompt-aware neural network approach to content-based scoring of non-native spontaneous speech. In 2018 IEEE Spoken Language Technology Workshop (SLT) (pp. 979–986). IEEE.
- Shi, J., Huo, N., & Jin, Q. (2020). Context-aware goodness of pronunciation for computer-assisted pronunciation training. arXiv Preprint ArXiv:2008.08647. https://doi.org/10.48550/arXiv.2008.08647
- Stewart, C., Vogler, N., Hu, J., Boyd-Graber, J., & Neubig, G. (2018). Automatic estimation of simultaneous interpreter performance. arXiv Preprint ArXiv:1805.04016. https://doi.org/10.48550/arXiv.1805.04016
- Van der Maaten, L., & Hinton, G. (2008). Visualizing data using t-SNE. Journal of Machine Learning Research, 9(11).
- Wu, X., Knill, K., Gales, M., & Malinin, A. (2020). Ensemble approaches for uncertainty in spoken language assessment.
- Wu, Z.-W. (2021). Chasing the unicorn? The feasibility of automatic assessment of interpreting fluency. In J. Chen & C. Han (Eds.), Testing and assessment of interpreting: Recent developments in China (pp. 143–158). Springer.
- Xu, G., Meng, Y., Qiu, X., Yu, Z., & Wu, X. (2019). Sentiment analysis of comment texts based on BiLSTM. Ieee Access, 7, 51522–51532. https://doi.org/10.1109/ACCESS.2019.2909919
- Yoon, S. Y., & Lee, C. (2019, August). Content modeling for automated oral proficiency scoring system. In Proceedings of the Fourteenth Workshop on innovative use of NLP for building educational applications (pp. 394–401).
- Yu, W., & van Heuven, V. J. (2017). Predicting judged fluency of consecutive interpreting from acoustic measures: Potential for automatic assessment and pedagogic implications. Interpreting, 19(1), 47–68. https://doi.org/10.1075/intp.19.1.03yu
- Zhang, S., Yu, H., & Zhu, G. (2022). An emotional classification method of Chinese short comment text based on ELECTRA. Connection Science, 34(1), 254–273. https://doi.org/10.1080/09540091.2021.1985968
- Zhang, X., Lu, W., Li, F., Zhang, R., & Cheng, J. (2020). A deep neural architecture for sentence semantic matching. International Journal of Computational Science and Engineering, 21(4), 574–582. https://doi.org/10.1504/IJCSE.2020.106870
- Zhou, D., Peng, X., Li, L., & Han, J. M. (2022). Cross-lingual embeddings with auxiliary topic models. Expert Systems with Applications, 190, 116194. https://doi.org/10.1016/j.eswa.2021.116194
- Zhou, D., Zhao, W., Wu, X., Lawless, S., & Liu, J. (2018). An iterative method for personalized results adaptation in cross-language search. Information Sciences, 430, 200–215. https://doi.org/10.1016/j.ins.2017.11.044