
ABSTRACT
A simple, rapid and cost-effective QuEChERS method for the determination of ZEN and DON by ELISA in cereals was developed. The single factor experiment was used to find the optimal QuEChERS parameters (extraction solvent, extraction method, extraction time, the QuEChERS composition, sorbent and clarification time) and extracts were analysed by ELISA. The optimised method was validated for selectivity, linearity, limits of detection, matrix effect and precision. The recovery values of ZEN and DON by ELISA were compared with a standard HPLC method and the results showed good coefficient with HPLC, which proved to be suitable for the screening of cereal samples for the presence of ZEN or DON. This is the first report of the determination of ZEN and DON in cereals after QuEChERS extraction combined with the enzyme-linked immunosorbent assay method.
1. Introduction
Mycotoxins are secondary metabolites produced mainly by a few fungi under certain conditions that colonise crops in the field or after harvest, and are mainly of the genera Fusarium, Aspergillus and Penicillium (Sherif, Salama, & Abdel, Citation2009). They are not essential for fungal growth or reproduction, but are toxic to animals or humans. The most frequently detected mycotoxins were deoxynivalenol (DON), zearalenone (ZEN) and T-2 toxin (Afsah, Jinap, Hajeb, & Radu, Citation2013). DON and ZEN are predominantly produced by the Fusarium (Glenn, Citation2007) and many commodities and products frequently contaminated with them include wheat, oats, barley, maize, rice and beans (Cortinovis, Battini, & Caloni, Citation2012).
Many previous studies have revealed that DON exerts a broad range of toxic effects on experimental animals (Pestka, Citation2010; Rena, Zhou, Deng, & Zou, Citation2014). DON has been associated with reduced food consumption, vomiting, weight loss, diarrhoea, immunological dysfunction and inhibits protein synthesis. Although DON is regarded as one of the least lethal trichothecenes, the number of reported DON contamination incidents has been constantly rising over the past 10 years, which made the development and application of various DON detection methods an important issue in the food industry (Koppen, Koch, Siegel, & Merkel, Citation2010; Zhang et al., Citation2017). ZEN is, however, known to cause estrogenic effects in humans and animals by binding to the natural estrogen receptor (Ren et al., Citation2016; Zinedine, Soriano, Molto, & Molto, Citation2007). Consumption of feed contaminated with ZEN causes reproductive disorders in mammals. ZEN is suspected to trigger central ecocious pubertal development in girls (Massart, Meucci, & Saggese, Citation2008). Due to their toxic potential, the European Union has established maximum levels for DON ranging from 200 to 1750 μg/kg in food and feed, and for ZEN ranging from 25 to 400 μg/kg in processed cereals foods and baby foods (Commission Regulation (EC) No.1881/Citation2006). In China, the maximum permissible level of DON in cereals and their products is 1000, and 60 μg/kg for ZEN in cereals and their products (GB/T 2761-Citation2011).
To minimise the risk of ZEN and DON to humans and livestock, many research groups have tried to develop detection methods to monitor ZEN and DON in grains. Currently, analytical methods for ZEN and DON such as high-performance liquid chromatography (Berthiller, Werner, Sulyok, & Krska, Citation2006; Marta et al., Citation2011; Hassen, Ayed, Oscoz, Lopez, & Bacha, Citation2007; Torrado, Blesa, Molto, & Font, Citation2010; Wu, Zhao, Chen, & Yang, Citation2011) with or without mass spectrometry detection are used, but these techniques are generally expensive, time consuming and labour intensive. Immunoassays are an alternative or complementary technique to chromatography. A variety of immunoassay methods used for ZEN and DON detection have recently been described, including: enzyme-linked immunosorbent assay (ELISA) (Gao et al., Citation2012; Wang, Luo, Cheng, Zheng, & Shen, Citation2011; Shi et al., Citation2013; Huang et al., Citation2014) immunochromatographic strip test (Shim, Kim, & Chung, Citation2009; Zhi et al., Citation2012; Duan, Chen, Xu, Fu, & Wang, Citation2015), immunosensors (Qing et al., Citation2011), time-resolved fluorescence immunoassay (Zhang et al., Citation2011) and fluorescence polarisation immunoassay (Chun, Choi, Chang, Choi, & Eremin, Citation2009) based on mAb.
Regarding preparation techniques, the analytical methods commented on before have been based mainly on immunoaffinity columns (IAC) (Kumagai, Nakajima, Tabata, Tanaka, & Sato, Citation2008), solid phase extraction (SPE) (Versilovskis, Bartkevi, & Mik, Citation2008) or extractions with different solvents (Juana, Ritieni, & Mañes, Citation2012; Maul et al., Citation2012; Spanjer, Rensen, & Scholten, Citation2008; Suchowilska, Kandler, Sulyok, Wiwart, & Krska, Citation2009). However, some of these sample treatments, as IAC, are expensive and comprise complex purification; moreover, multiclass analysis is quite limited, due to their inherent selectiveness. As a consequence, simpler, more efficient, multiclass and environmentally friendly extraction systems are demanded. Since the development of the “Quick, Easy, Cheap, Effective, Rugged and Safe” (QuEChERS) method (Anastassiades, Lehotay, Stajnbaher, & Schenck, Citation2003), it has been gaining significant popularity. It is the method of choice for food analysis because it combines several steps and extends the range of pesticides recovered over older and more tedious extraction techniques. Recent studies showed that QuEChERS can be successfully used for extraction of mycotoxins. For example, extraction of Fusarium toxins in cereals and cereal-based products, ZEN in barley, ochratoxin A in bread and DON, ZEN and actyldeoxynivalenol in wheat and maize (Paula, Simone, Teresa, Correia, & Lino, Citation2012; Vaclavik, Zachariasova, Hrbek, & Hajslova, Citation2010; Zachariasova, Lacina, Malachova, Kostelanska, & Godula, Citation2010).
In the current study, the possibility to apply QuEChERS extraction for ZEN and DON determination by ELISA in cereal samples was investigated. It is a very convenient extraction technique that due to its simplicity and rapidity is being applied in the analysis of complex matrices and replacing traditional extraction methods. A single factor experiment was designed to examine the effect on extraction efficiency of the QuEChERS conditions. The method was applied to the recovery rate experiment of cereal samples available in Wushan Market (Guangzhou) and the results were statistically confirmed by the HPLC method.
2. Materials and methods
2.1. Chemicals and reagents
DON and ZEN were purchased from Sigma-Aldrich (St Louis, MO, USA). The monoclonal anti-deoxynivalenol (DON-Ab) and anti-zearalenone (ZEN-Ab), deoxynivalenol-bovine serum albumin (DON-BSA, antigen) and zearalenone-bovine serum albumin (ZEN-BSA, antigen) were obtained from WeiKang Huihua Co. Ltd. (Beijing, China). The goat anti-mouse IgG-peroxidase conjugate was purchased from Boster Co. Ltd. (Wuhan, China). The d-SPE sorbents C18 (average particle size 57 μm) and PSA (average particle size 58 μm) were purchased from Bonna-Agela Technologies Co. Ltd. (Tianjin, China). Tween-20, acetonitrile, methanol, acetic acid and neutral alumina were obtained from Tianjin Damao Chemical Reagent Co. Ltd. (Tianjin, China). All other reagents were of analytical grade and obtained from a local chemical supplier (Yunhui Trade Co., Ltd., Guangzhou, China). Ultrapure water was used throughout the work.
2.2. Instruments and equipment
Opaque high-binding 96-well plates were purchased from Shenzhen Jincanhua Industrial Co., Ltd. (Shenzhen, China). Plates were washed in a Multiskan MK2 microplate washer (Thermo Scientific, Hudson, NY, USA) to flush unattached substance away. Absorbance value was recorded using a Multiskan FS multilabel plate counter (Thermo Scientific, Hudson, NY, USA). Sample preparation was performed with a Vortex mixer (IKA Company, Germany) and a 6K15 High Speed Freezing Centrifuge (Sartorius-Sigma, USA). HPLC analysis was carried out on the LC-20 AT HPLC system (Shimadzu, Japan).
2.3. Calibration curves for DON and ZEN
Calibration curves were prepared for quantification. ZEN standard solution (1000 ng/mL) was prepared from a 5 mg/mL stock solution in methanol and diluted with PBS to provide a series of standards containing 200, 100, 50, 20, 10, 5, 2, 1 and 0 ng/mL of ZEN, while a 1-mg/mL DON standard solution was dissolved in methanol to prepare 10 μg/mL DON standard stock solution and serial dilutions of the stock solution were prepared for calibration with concentrations of 1000, 500, 250, 125, 62.5, 31.25, 15.63, 7.81 and 0 ng/mL.
2.4. Immunoassay procedure
Plates were coated with ZEN–BSA or DON–BSA (100 µL/well) in carbonate buffer overnight at 37°C after washing two times with PBST and blocking with 5% skim milk in PBST (120 µL/well) for 3 h at 37°C. After removing the liquid, the plates were dried at 37°C overnight. Individual ZEN or DON standards or samples (50 µL/well) were added to the wells followed by the addition of the diluted anti-ZEN or anti-DON antibody (1:3000 for anti-ZEN and 1:40,000 for anti-DON, 50 µL/well). The plate was incubated for 40 min at 37°C. After washing 5 times with PBST, 100 µL of HRP-conjugated goat anti-rabbit IgG (secondary antibody; 1:2000) was added and further incubated for 30 min at 37°C. After washing 5 times with PBST, the 100 µL of homogeneous mixed liquid (50 µL of substrate solution and 50 µL of substrate buffer) was added. 10 min later, the enzyme reaction was stopped finally by adding 50 µL 2 mol/L of H2SO4. The plate was shaken gently for 1 min at room temperature and the absorbance value was recorded. Competitive curves were obtained by plotting inhibition rate against the logarithm of analyte concentration. Sigmoid curves were generated using OriginPro 8.5 software (OriginLab Corp., Northampton, MA, USA).
2.5. Sample collection and preparation
The cereal samples including rice, wheat and maize were collected from Changban market in Guangzhou. All the samples were stored at 4°C before analysis.
Each homogenised cereal sample was accurately weighed (4.0 g, precision: 0.01 mg) into 50 mL centrifuge tubes. Then, in order to extract the mycotoxins from the sample and simultaneously precipitate solid matrix, 16 mL of organic extraction solvent (methanol: acetonitrile, 80:20, v/v) was added to the centrifuge tube, shaking by vortex for 1 min. Then, the QuEChERS extraction kit was added and the tube was vortexed vigorously for 5 min. After that, the sample was centrifuged at 8000 rpm for 10 min. 8 mL aliquot of extract solution from the top layer was transferred into 15 mL centrifuge tube containing 300 mg d-SPE sorbent and 100 mg MgSO4 anhydrous and the tube was vortexed vigorously for 1 min. Subsequently, the sample was centrifuged at 8000 rpm for 3 min. And then, 4 mL of the upper organic solvent layer was transferred to a vial, evaporated to near dryness under a gentle stream of N2 and reconstituted with 1 mL of MeOH: PBS (10:90, v/v) for the ZEN and DON ELISA analysis.
2.6. Evaluation of recovery
A recovery study was carried out to test the precision of the ic-ELISA for the determination of ZEN and DON in cereal samples. 4 grams of each ZEN-free and DON-free ground cereal sample, which had been evaluated by HPLC, was spiked with ZEN at concentrations of 20, 50 and 100 ng/g and DON at concentrations of 200, 400 and 1000 ng/g. The spiking was carried out in triplicate for each concentration when the samples were subjected to pretreatment as described above. The recovery R (%) was calculated according to the following equation, where the concentration of the standard solution was equal to the concentration spiked in the sample (Maragou, Rosenberg, Thomaidis, & Koupparis, Citation2008):
2.7. Matrix effects
Different blank cereal samples such as rice, wheat and maize were selected to be extracted under the best conditions and those extracts were used to provide serial dilutions of the stock solution for ZEN and DON. Competitive curves of different extracts and PBS were obtained by plotting inhibition rate against the logarithm of analyte concentration. The extent of matrix effects can be measured in each analytical sequence by comparing calibration standards of the same concentrations in PBS-only vs. those in matrix extracts.
2.8. HPLC confirmation
HPLC method was developed on C18 column with Fluorescence detection at the wavelength of 274 nm for ZEN and UV detection at the wavelength of 218 nm for DON. For ZEN, the mobile phase consisted of acetonitrile, purified water and methanol in the ratio of 20:30:50 (v/v/v). The flow rate of the mobile phase was 1.0 mL/min and an aliquot of 100 µL of each sample was injected into the HPLC system, and the retention time is 5.816 min. For DON, the mobile phase consisted of methanol and purified water in the ratio of 20:80 (v/v). The flow rate of the mobile phase was 0.8 mL/min and an aliquot of 50 µL of each sample was injected into the HPLC system, and the retention time is 11.873 min.
Each ZEN-free and DON-free ground cereal sample, which had been evaluated by HPLC, was spiked with ZEN at concentrations of 20, 50 and 100 ng/g and DON at concentrations of 200, 400 and 1000 ng/g, respectively, for ELISA and HPLC analyses. The spiking was carried out in triplicate for each concentration. The determinations were performed for each spiked sample, and the results were compared with those obtained using the reference HPLC method.
3. Results and discussion
3.1. Standard curve for ZEN and DON
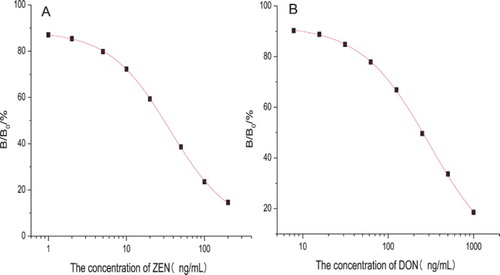
Dose-dependent inhibition rate curves of ZEN (A) and DON (B) obtained with the ELISA using the optimised conditions are presented in . In this study, the effective test range of ZEN and DON was 13.64–104.48 ng/mL and 35.65–983.52 ng/mL (corresponding to 20–80% inhibition), which was determined using a threefold confidence interval of zero analyte dose signal (Shim et al., Citation2004). The LOD for ZEN was 2.58 ng/mL and IC50 (the concentration of ZEN that caused 50% inhibition of the binding enzyme marker) value was 35.86 ng/mL. The LOD for DON was 17.31 ng/mL and IC50 value was 165.51 ng/mL.
Figure 1. Standard curve of (A) ZEN and (B) DON by ELISA (n = 3).
3.2. Optimisation of sample treatment
To obtain the optimised conditions and improve efficiency for preparation before detection, several experimental parameters, including extraction solvent, extraction method, extraction time, the QuEChERS composition, sorbent and clarification time, were investigated. For each condition, the recovery was calculated accurately to weigh extraction efficiency.
3.3. Effect of extraction solvent
In recent years, many solvents such as acetonitrile, methanol, ethyl acetate, acetone and component solvents of them were usually used to extract ZEN and DON for determination (Julie, Francesco, Hans, & Elliott, Citation2011; Pereira, Fernandes, & Cunha, Citation2014; Sospedra, Blesa, & Soriano, Citation2010). But only acetonitrile or methanol as extraction agent was greatly advantageous to extract ZEN and DON simultaneously while ethyl acetate was often applied to extract a single toxin and the extraction recovery of acetone was not good (Rodriguez, Berrada, Font, & Mañes, Citation2012; Trebstein, Lauber, & Humpf, Citation2009). Therefore, the recovery of ZEN and DON affected by different extraction solvents (methanol, acetonitrile, acid acetonitrile and methanol-acetonitrile mixed solvent) was investigated and the result is shown in . The use of different solvent extractions gives a big difference on the recovery. An effective solvent to extract ZEN and DON simultaneously was the methanol-acetonitrile mixed solvent followed by the methanol and finally the acetonitrile. It was found that the methanol concentration in acetonitrile had an influence on the extraction effect in the research. In order to further demonstrate the influence of methanol concentration in acetonitrile on the recovery, the extraction effect of different volume ratios of methanol to acetonitrile was compared. From , the best solvent to extract ZEN and DON in cereal samples is the component solvent of 80% methanol and 20% acetonitrile.
Figure 2. Evaluation of the volume ratio of methanol to acetonitrile on the recovery of ZEN and DON determined by ELISA (n = 3).
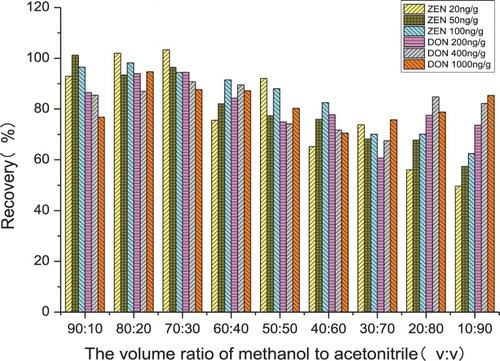
Table 1. Effect of extraction solvents on the recovery of ZEN and DON determined by ELISA (n = 3).
3.4. Effect of extraction method
The effect of three methods (vortex oscillation, ultrasonication and hand agitation) on the recovery of ZEN and DON is shown in . A significant difference is demonstrated by comparison of the recovery obtained at three extraction methods. The effect of hand agitation is the worst. Compared with ultrasonication, the recovery of ZEN is higher and there is no significant difference in the recovery of DON by vortex oscillation. Considered synthetically, the vortex oscillation is selected as the best extraction method as a result of its highest recovery.
Table 2. Effect of extraction methods on the recovery of ZEN and DON determined by ELISA (n = 3).
3.5. Effect of the QuEChERS composition
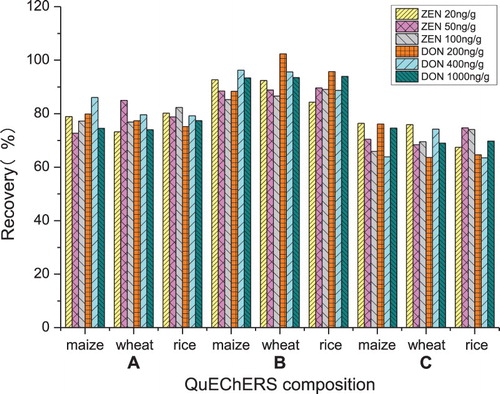
Three different types of QuEChERS were tested. Their corresponding content in the 50 mL Teflon centrifuge tubes were: QuEChERS A (6 g of magnesium sulphate and 2 g of anhydrous sodium acetate); QuEChERS B (6 g of magnesium sulphate, 1.5 g of sodium chloride, 1.5 g of sodium citrate dihydrate and 1 g of sodium citrate sesquihydrate); QuEChERS C (4 g of magnesium sulphate and 2 g of sodium chloride). As shown in , the highest extraction recoveries of ZEN and DON are obtained, by descending order, with QuEChERS B, A and C. Taking all these observations in consideration, QuEChERS B was chosen as the best composition to be used for QuEChERS extraction.
Figure 3. Effect of QuEChERS composition on the recovery of ZEN and DON determined by ELISA (n = 3).
3.6. Effect of sorbents
The efficiency of the sorbents was evaluated by its highest recovery. The comparison among the three sorbents showed PSA produced the highest recovery followed by C18 and Neutral alumina and the results are shown in . Subsequently, different PSA masses were set at 100, 200, 300, 400 and 500 mg to investigate the effect of PSA mass on the recovery. The effect of PSA mass on recovery is shown in . When PSA mass increased from 100 to 300 mg, the recovery significantly increased from 72.18% to 97.38% for ZEN and 76.84% to 94.67% for DON. The recovery of ZEN and DON remained relatively constant with PSA mass between 300 and 500 mg. Therefore, 300 mg of PSA was chosen as the best sorbent to be used for QuEChERS extraction.
Figure 4. Effect of PSA mass on the recovery of ZEN and DON determined by ELISA (n = 3).
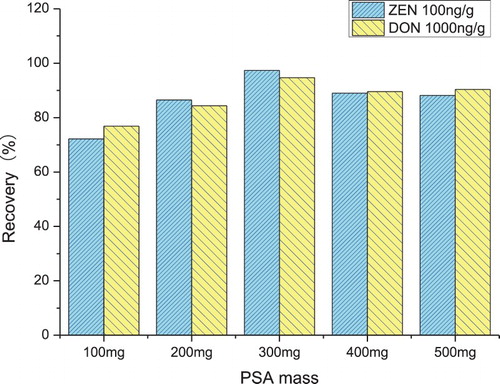
Table 3. Effect of sorbents on the recovery of ZEN and DON determined by ELISA (n = 3).
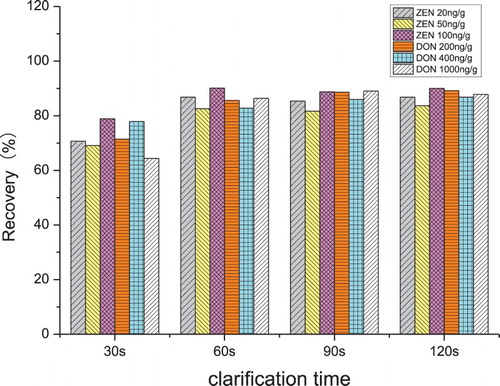
3.7. Effect of clarification time
The recoveries of ZEN and DON affected by different clarification times (30, 60, 90 and 120 s) are shown in . In the first 60 s, the more the clarification time increases, the more significant becomes the difference in ZEN and DON extraction contents and the better the recovery. But there was no significant difference on recovery with the clarification time increasing from 60 to 120 s. Therefore, 60 s was chosen as the clarification time to be used for QuEChERS extraction.
Figure 5. Effect of clarification time on the recovery of ZEN and DON determined by ELISA (n = 3).
3.8. Recovery and coefficient variation
The recovery experiment was performed by spiking “blank” maize, wheat and rice samples with ZEN and DON. The samples were treated following the procedure described. The mean value (±SD) and the coefficient of variation (CV) of the concentration of ZEN and DON in the different samples, determined from replicate analyses (n = 3) in the same run (intra-assay) and in separate runs (inter-assay) (Yang et al., Citation2013), are shown in .
Table 4. The recovery and CV of ZEN and DON determined by ELISA in maize, wheat and rice (n = 3).
The recovery values of ZEN from cereal samples ranged from 83.55% to 102.49%, and the mean recovery values of intra-assay and inter-assay were 89.80% and 93.62%, respectively. The values of CV ranged from 1.82% to 7.42%, and the mean CV values of intra-assay and inter-assay were 4.17% and 5.19%, respectively. The recovery values of DON from cereal samples ranged from 86.32 to 106.93%, and the mean recovery values of intra-assay and inter-assay were 99.44% and 98.51%, respectively. The CV values ranged from 1.11% to 4.75%, and the mean CV values of intra-assay and inter-assay were 2.76% and 2.20%, respectively. The results showed that the ci-ELISA for ZEN and DON determination was stable and reproducible. The method in the present study met the requirements of recovery values for ZEN and DON determination.
3.9. Cross-reactivity
Specificity should be considered one of the most important factors for an immunoassay. The specificity of the proposed anti-ZEN polyclonal antibody was evaluated by analysing the extent of cross-reactivity (CR) with two structurally related compounds and five analogues: α-Zearalenol, β-Zearalenol, ochratoxin A (OTA), T-2 toxin, aflatoxin B1 (AFB1), fumonisin and DON. The specificity of the proposed anti-DON polyclonal antibody was evaluated by analysing the extent of CR with three structurally related compounds and four analogues: 3-Ac-DON, 15-Ac-DON, T-2 toxin, ochratoxin A (OTA), aflatoxin B1 (AFB1), fumonisin and ZEN. The results are shown in . The lower the CR, the more specific the antibody is; consequently the immunoassay becomes more reliable and acceptable. The anti-ZEN polyclonal antibody showed some CR with α-Zearalenol (73.26%) and β-Zearalenol (6.95%), but negligible CR with other analogues. The anti-DON polyclonal antibody showed some CR with 3-Ac-DON (197.58%) and 15-Ac-DON (18.82%), but negligible CR with other analogues. In this case, the antibodies of ZEN and DON obtained showed high specificity for ZEN and DON, respectively.
Table 5. Specificity of the anti-ZEN mAb and anti-DON mAb.
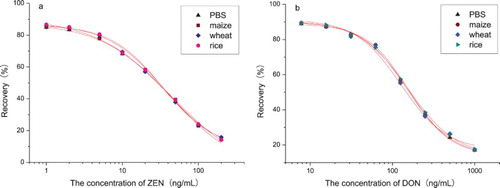
3.10. Matrix effects
Competitive curves of different extracts distilled from several blank cereal samples such as maize, wheat and rice and PBS were obtained by plotting inhibition rate against the logarithm of analyte concentration. As shown in , the obtained standard curves were nearly coincident, which indicated that the extracts of different samples distilled by the method in this study had no effect on the recovery of ZEN and DON detected by ELISA.
Figure 6. Competitive curves of PBS and other three extracts distilled from maize, wheat and rice for (a) ZEN and (b) DON under optimised conditions.
3.11. HPLC confirmation
The ELISA method for determination of ZEN and DON was investigated compared with a standard HPLC method. As shown in , the chromatograms were obtained by injecting aliquots of a ZEN standard solution (100 ng/mL) (A) and an extract of a cereal sample spiked with 100 μg/kg of ZEN (B) into the HPLC system. And shows the chromatogram of the DON standard solution (1000 ng/mL) (A) and a cereal sample spiked with 1000 μg/kg of DON (B) using HPLC–UVD. The values obtained from the two detection systems for ZEN and DON entirely fit an excellent linear relationship (), with a regression equation of y = 1.0281x−0.2897 (correlation coefficient is 0.9955) for ZEN and a regression equation of y = 0.9952x + 4.4193 (correlation coefficient is 0.9984) for DON, further confirming the reliability of ELISA.
Figure 7. Analysis of ZEN using HPLC–FLD. The chromatogram of ZEN standard solution (100 ng/mL) (A) and an extract of a cereal sample spiked with 100 μg/kg of ZEN (B).
Figure 8. Analysis of DON using HPLC–UVD. The chromatogram of DON standard solution (1000 ng/mL) (A) and an extract of a cereal sample spiked with 1000 μg/kg of DON (B).
Table 6. Analytical result of ELISA and HPLC methods (n = 3).
4. Conclusions
A simple, rapid and cost-effective QuEChERS method for the determination of ZEN and DON by ELISA in cereals was developed. The method is time-saving, cost-cutting and propitious for simultaneous detection of various samples with good recovery. The sensitive and specific ELISA was applied to the determination of ZEN and DON in cereal. For ZEN, the linear range was 13.64−104.48 ng/mL, the LOD was 2.58 ng/mL, and the IC50 value was 35.86 ng/mL. And for DON, the linear range was 35.65−983.52 ng/mL, the LOD was 17.31 ng/mL and the IC50 value was 165.51 ng/mL. The determination of ZEN by ELISA showed some CR with α-Zearalenol (73.26%) and β-Zearalenol (6.95%), but negligible CR with OTA, T-2 toxin, AFB1, fumonisin and DON. The determination of DON by ELISA showed some CR with 3-Ac-DON (197.59%) and 15-Ac-DON (18.82%), but negligible CR with other analogues. The recovery values of ZEN for spiked cereal samples ranged from 83.55% to 102.49%, the CV values ranged from 1.82% to 7.42% and the mean CV values of the intra-assay and inter-assay were 4.17% and 5.19%, respectively. And the recovery values of DON for spiked cereal samples ranged from 86.32% to 106.93%, the CV values ranged from 1.11% to 4.75% and the mean CV values of the intra-assay and inter-assay were 2.76% and 2.20%, respectively. Good agreement was obtained between the ELISA and HPLC methods for screening ZEN and DON. The QuEChERS method combined with the enzyme-linked immunosorbent assay developed should prove useful for the real-time, large-scale screening of trace levels of mycotoxins ZEN and DON in cereals.
Disclosure statement
No potential conflict of interest was reported by the authors.
Notes on contributors
Qiurong He works in GuangDong Food and Drug Administration.
Hongwei Peng is a student of South China Agriculture University. His major subject is food safety.
Jinyi Yang Yang is a postdoctoral. His main research direction is the food quality and safety. He has outstanding ability in the high-quality antigen, antibody preparation, high sensitivity of the new immunoassay technology established, immunization test product industrialization and application promotion.
Zhenlin Xu is a young professor and doctoral tutor. He is Guangdong province natural science outstanding youth fund winner, Guangdong province special branch plan science and technology innovation youth top-notch talent, Guangdong province high school outstanding young teacher plan is selected, Guangzhou Zhujiang science and technology star. He mainly engaged in food and the environment of small molecules chemical detection technology research and application.
Congcong Fan is a student of South China Agriculture University. His major subject is food safety.
Yuanming Sun is the South China Agricultural University secondary professor and doctoral tutor. He is currently the vice chairman of the Teaching Guideline Committee of the Food Science and Engineering Specialty of the Ministry of Education, the director of the Guangdong Provincial Food Quality and Safety Laboratory, the Ministry of Agriculture, the Director of the Quality and Safety Assessment Laboratory for Quality and Safety of Agricultural Products, and the Vice President of the Food Safety Society of Guangdong Province , Vice chairman of the Guangdong Provincial Nutrition Society, served as dean of the College of Food Science, South China Agricultural University. He has long been engaged in food safety and nutrition in the field of teaching and research work, with remarkable results.
Additional information
Funding
References
- Afsah, H. L., Jinap, S., Hajeb, P., Radu, S., & Shakibazadeh, Sh. (2013). A review on mycotoxins in food and feed: Malaysia Case study. Comprehensive Reviews in Food Science and Food Safety, 12, 629–651. doi: 10.1111/1541-4337.12029
- Anastassiades, M., Lehotay, S. J., Stajnbaher, D., & Schenck, F. J. (2003). Fast and easy multiresidue method employing acetonitrile extraction/partitioning and “dispersive solid-phase extraction” for the determination of pesticide residues in produce. Journal of AOAC International, 86, 412–431.
- Berthiller, F., Werner, U., Sulyok, M., Krska, R., Hauser, M.-T., & Schuhmacher, R. (2006). Liquid chromatography coupled to tandem mass spectrometry (LC-MS/MS) determination of phase II metabolites of the mycotoxin zearalenone in the model plant Arabidopsis thaliana. Food Additives and Contaminants, 23(11), 1194–1200. doi: 10.1080/02652030600778728
- Chun, H. S., Choi, E. H., Chang, H. J., Choi, S. W., & Eremin, S. A. (2009). A fluorescence polarization immunoassay for the detection of zearalenone in corn. Analytica Chimica Acta, 639, 83–89. doi: 10.1016/j.aca.2009.02.048
- Cortinovis, C., Battini, M., & Caloni, F. (2012). Deoxynivalenol and T-2 toxin in raw feeds for horses. Journal of Equine Veterinary Science, 32, 72–74. doi: 10.1016/j.jevs.2011.08.002
- Duan, H., Chen, X. L., Xu, W., Fu, J. H., & Wang, A. (2015). Quantum-DoT submicrobead-based immunochromatographic assay for quantitative and sensitive detection of zearalenone. Talanta, 132, 126–131. doi: 10.1016/j.talanta.2014.08.076
- European Commission. (2006). Commission regulation (EC) No.1881/2006 of 19 December, 2006. Setting maximum levels for certain contaminants in foodstuffs. Official Journal of the European Union, L 364/5, 24.
- Gao, Y., Yang, M., Peng, C., Li, X. H., Cai, R. L., & Qi, Y. (2012). Preparation of highly specific anti-zearalenone antibodies by using the cationic protein conjugate and development of an indirect competitive enzyme-linked immunosorbent assay. The Analyst, 137, 229–236. doi: 10.1039/c1an15487g
- Glenn, A. E. (2007). Mycotoxigenic Fusarium species in animal feed. Animal Feed Science and Technology, 137, 213–240. doi: 10.1016/j.anifeedsci.2007.06.003
- Hassen, W., Ayed, B. I., Oscoz, A. A., Lopez, A. D. C., & Bacha, H. (2007). The role of oxidative stress in zearalenone-mediated toxicity in Hep G2 cells: Oxidative DNA damage, gluthatione depletion and stress proteins induction. Toxicology, 232(3), 294–302. doi: 10.1016/j.tox.2007.01.015
- Huang, Y. H., Xu, Y., He, Q. H., Chu, J. S., Du, B. B., & Liu, J. (2014). Determination of zearalenone in corn based on a biotin-avidin amplified enzyme-linked immunosorbent assay. Food and Agricultural Immunology, 25(2), 186–199. doi: 10.1080/09540105.2012.759540
- Juana, C., Ritieni, A., & Mañes, J. (2012). Determination of trichothecenes and zearalenones in grain cereal, flour and bread by liquid chromatography tandem mass spectrometry. Food Chemistry, 134, 2389–2397. doi: 10.1016/j.foodchem.2012.04.051
- Julie, P. M., Francesco, R., Hans, P. E., & Elliott, C. (2011). Current methods of analysis for the determination of trichothecene mycotoxins in food. TrAC Trends in Analytical Chemistry, 30(2), 192–203. doi: 10.1016/j.trac.2010.06.012
- Koppen, R., Koch, M., Siegel, D., Merkel, S., Maul, R., & Nehis, I. (2010). Determination of mycotoxins in foods: Current state of analytical methods and limitations. Applied Microbiology and Biotechnology, 86, 1595–1612. doi: 10.1007/s00253-010-2535-1
- Kumagai, S., Nakajima, M., Tabata, S., Ishikuro, E., Tanaka, T., Norizuki, H., … Suqita-Konishi, Y. (2008). Aflatoxin and ochratoxin A contamination of retail foods and intake of these mycotoxins in Japan. Food Additive and Contaminants Part A, 25, 1101–1106. doi: 10.1080/02652030802226187
- Maragou, N. C., Rosenberg, E., Thomaidis, N. S., & Koupparis, M. A. (2008). Direct determination of the estrogenic compounds 8-prenylnaringenin, zearalenone, α- and β-zearalenol in beer by liquid chromatography–mass spectrometry. Journal of Chromatography A, 1202(1), 47–57. doi: 10.1016/j.chroma.2008.06.042
- Marta, K., Milena, Z., Ondrej, L., Fenclova, M., Kollos, A., & Hajslova, J. (2011). The study of deoxynivalenol and its masked metabolites fate during the brewing process realised by UPLC–TOFMS method. Food Chemistry, 126, 1870–1876. doi: 10.1016/j.foodchem.2010.12.008
- Massart, F., Meucci, V., & Saggese, G. (2008) High growth rate of girls with precocious puberty exposed to estrogenic mycotoxins. The Journal of Pediatrics, 152(5), 690–695.e1. doi: 10.1016/j.jpeds.2007.10.020
- Maul, R., Müller, C., Rieß, S., Koch, M., Methner, F. J., & Irene, N. (2012). Germination induces the glucosylation of the Fusarium mycotoxin deoxynivalenol in various grains. Food Chemistry, 131, 274–279. doi: 10.1016/j.foodchem.2011.08.077
- National Criterion of China. (2011). Maximum levels of mycotoxins in foods. GB/T 2761-2011.
- Paula, P., Simone, M., Teresa, O. T., Correia, M., Cristina, D.-M., & Duarte, S. C., … Lino, C. M. (2012). Extraction of ochratoxin A in bread samples by the QuEChERS methodology. Food Chemistry, 135, 2522–2528. doi: 10.1016/j.foodchem.2012.06.045
- Pereira, V. L., Fernandes, J. O., & Cunha, S. C. (2014). Mycotoxins in cereals and related foodstuffs: A review on occurrence and recent methods of analysis. Trends in Food Science & Technology, 36, 96–136. doi: 10.1016/j.tifs.2014.01.005
- Pestka, J. J. (2010). Deoxynivalenol: Mechanisms of action, human exposure, and toxicological relevance. Archives of Toxicology, 84, 663–679. doi: 10.1007/s00204-010-0579-8
- Qing, H. H., Yang, X., Huang, Y. H., Liu, R. R., Huang, Z. B., & Li, Y. P. (2011). Phage-displayed peptides that mimic zearalenone and its application in immunoassay. Food Chemistry, 126, 1312–1315. doi: 10.1016/j.foodchem.2010.11.085
- Ren, Z. H., Deng, T., Wang, Y. C., Zhou, R., Deng, D., & Deng, J. L. (2016). Effects of the Fusarium toxin zearalenone and/or deoxynivalenol on the serum IL-1, IL-4, and C3 levels in mice. Food and Agricultural Immunology, 27(3), 414–421. doi: 10.1080/09540105.2015.1118019
- Ren, Z. H., Zhou, R., Deng, J. L., Zuo, Z. C., Peng, X., Wang, Y. C., … Fang, J. (2014). Effects of the Fusarium toxin zearalenone (ZEA) and/or deoxynivalenol (DON) on the serum IgA, IgG and IgM levels in mice. Food and Agricultural Immunology, 25(4), 600–606. doi: 10.1080/09540105.2013.867928
- Rodriguez, C. Y., Berrada, H., Font, G., & Mañes, J. (2012). Multi-mycotoxin analysis in wheat semolina using an acetonitrile-based extraction procedure and gas chromatography–tandem mass spectrometry. Journal of Chromatography A, 1270, 28–40. doi: 10.1016/j.chroma.2012.10.061
- Sherif, S. O., Salama, E. E., & Abdel, M. A. (2009). Mycotoxins and child health: The need for health risk assessment. International Journal of Hygiene and Environmental Health, 212, 347–368. doi: 10.1016/j.ijheh.2008.08.002
- Shim, W. B., Kim, K. Y., & Chung, D. H. (2009). Development and validation of a gold nanoparticle immunochromatographic assay (ICG) for the detection of zearalenone. Journal of Agricultural and Food Chemistry, 57, 4035–4041. doi: 10.1021/jf900075h
- Shim, W. B., Kolosova, A. Y., Kim, Y. J., Yang, Z. Y., Park, S. J., Eremin, S. A., … Chung, D. H. (2004). Fluorescence polarization immunoassay based on a monoclonal antibody for the detection of ochratoxin A. International Journal of Food Science and Technology, 39, 829–837. doi: 10.1111/j.1365-2621.2004.00856.x
- Shi, C. P., Won, J. L., Gai, P. Z., Hu, X. F., Eremin, S. A., & Zhang, L. J. (2013). Development of anti-zearalenone monoclonal antibody and detection of zearalenone in corn products from China by ELISA. Food Control, 31, 65–70. doi: 10.1016/j.foodcont.2012.09.006 doi: 10.1016/j.foodcont.2012.11.008
- Sospedra, I., Blesa, J., & Soriano, J. M. (2010). Use of the modified quick easy cheap effective rugged and safe sample preparation approach for the simultaneous analysis of type A- and B-trichothecenes in wheat flour. Journal of Chromatography A, 1217(9), 1437–1440. doi: 10.1016/j.chroma.2009.12.047
- Spanjer, M. C., Rensen, P. M., & Scholten, J. M. (2008). LC–MS/MS multi-method for mycotoxins after single extraction, with validation data for peanut, pistachio, wheat, maize, cornflakes, raisins and figs. Food Additives and Contaminants, 25, 472–489. doi: 10.1080/02652030701552964
- Suchowilska, E., Kandler, W., Sulyok, M., Wiwart, M., & Krska, R. (2009). Mycotoxin profiles in the grain of Triticum monococcum, Triticum dicoccum and Triticum spelta after head infection with Fusarium culmorum. Journal of the Science of Food and Agriculture, 90, 556–565. doi: 10.1002/jsfa.3844
- Torrado, E. P., Blesa, J., Molto, J. C., & Font, G. (2010). Pressurized liquid extraction followed by liquid chromatography–mass spectrometry for determination of zearalenone in cereal flours. Food Control, 21(4), 399–402. doi: 10.1016/j.foodcont.2009.06.016
- Trebstein, A., Lauber, U., & Humpf, H. U. (2009). Analysis of fusarium toxins via HPLC-MS/MS multimethods: Matrix effects and strategies for compensation. Mycotoxin Research, 25(4), 201–213. doi: 10.1007/s12550-009-0029-8
- Vaclavik, L., Zachariasova, M., Hrbek, V., & Hajslova, J. (2010). Analysis of multiple mycotoxins in cereals under ambient conditions using direct analysis in real time (DART) ionization coupled to high resolution mass spectrometry. Talanta, 82(5), 1950–1957. doi: 10.1016/j.talanta.2010.08.029
- Versilovskis, A., Bartkevi, V., & Mik, V. (2008). Sterigmatocystin presence in typical Latvian grains. Food Chemistry, 109, 243–248. doi: 10.1016/j.foodchem.2007.12.066
- Wang, Z., Luo, P., Cheng, L., Zheng, S. X., & Shen, J. Z. (2011). Hapten-antibody recognition studies in competitive immunoassay of α-zearalanol analogs by computational chemistry and Pearson correlation analysis. Journal of Molecular Recognition, 24, 815–823. doi: 10.1002/jmr.1121
- Wu, J. W., Zhao, R. H., Chen, B., & Yang, M. H. (2011). Determination of zearalenone in barley by high-performance liquid chromatography coupled with evaporative light scattering detection and natural occurrence of zearalenone in functional food. Food and Agricultural Immunology, 126(3), 1508–1511. doi: 10.1016/j.foodchem.2010.11.159
- Yang, J. Y., Zhang, Y., Lei, H. T., Wang, H., Xu, Z. L., Shen, Y. D., & Sun, Y. M. (2013). Development of an ultra-sensitive chemiluminescence enzyme immunoassay for the determination of diethylstilbestrol in seafood. Analytical Letters, 46, 2189–2202. doi: 10.1080/00032719.2013.798794
- Zachariasova, M., Lacina, O., Malachova, A., Kostelanska, M., … Godula, M. (2010). Novel approaches in analysis of Fusarium mycotoxins in cereals employing ultra performance liquid chromatography coupled with high resolution mass spectrometry. Analytica Chimica Acta, 662(1), 51–61. doi: 10.1016/j.aca.2009.12.034
- Zhang, X. F., Liu, W. K., Logrieco, A. F., Yang, M. H., Wang, X., & Guo, Q. (2011). Determination of zearalenone in traditional Chinese medicinal plants and related products by HPLC-FLD. Food Additives and Contaminants, 28(7), 885–893. doi: 10.1080/19440049.2011.563429
- Zhang, Y., Yang, J., Lu, Y., Ma, D. Y., Qi, M. G., & Wang, S. (2017). A competitive direct enzyme-linked immunosorbent assay for the rapid detection of deoxynivalenol: Development and application in agricultural products and feedstuff. Food and Agricultural Immunology, 28(3), 516–527. doi: 10.1080/09540105.2017.1306491
- Zhi, B. H., Yang, X., Lai, S. L., Li, Y. P., Zhang, H., & He, Q. H. (2012). Development of an immunochromatographic strip test for the rapid simultaneous detection of deoxynivalenol and zearalenone in wheat and maize. Food Control, 28, 7–12. doi: 10.1016/j.foodcont.2012.04.035
- Zinedine, A., Soriano, J. M., Molto, J. C., Molto, J. C., & Mañes, J. (2007). Review on the toxicity, occurrence, metabolism, detoxification, regulations and intake of zearalenone: An oestrogenic mycotoxin. Food and Chemical Toxicology, 45, 1–18. doi: 10.1016/j.fct.2006.07.030