
 ?Mathematical formulae have been encoded as MathML and are displayed in this HTML version using MathJax in order to improve their display. Uncheck the box to turn MathJax off. This feature requires Javascript. Click on a formula to zoom.
ABSTRACT
The presence of pesticide residues in crops is a significant public concern. Due to the large number of samples and pesticides, a reliable, simple, cost-effective, and high-throughput analytic method is required. In this study, we developed a gold nanoparticle (GNP) immunochromatographic assay (ICA) for the rapid detection of 6-benzylaminopurine (6-BA) residues in bean sprouts. A monoclonal antibody against 6-BA, having a half-maximum inhibition concentration of 2.25 ng/mL, was labeled with GNPs and fixed onto a glass fiber membrane to create a conjugate pad. Coating antigen and goat anti-mouse antibody were sprayed onto a nitrocellulose membrane to form the test line and control line, respectively. The visual limit of detection and cutoff limit of ICA were 10 and 80 ng/g in bean sprouts, respectively. The results of ICA were obtained within 10 min with the naked eye. Therefore, ICA is a rapid tool for the on-site screening and detection of 6-BA in bean sprouts.
Introduction
Bean sprouts are mainly made from soybeans and mung beans. Bean sprouts, which are rich in vitamin C (Guo, Li, Tang, & Liu, Citation2012), free amino acids (Wongsiri, Ohshima, & Duangmal, Citation2015), and dietary fiber (Tiansawang, Luangpituksa, Varanyanond, & Hansawasdi, Citation2016), have antioxidant (Okumura, Hosoya, Kawarazaki, Izawa, & Kumazawa, Citation2016; Romero et al., Citation2014), hypotensive (Hsu, Lu, Chang, & Hsu, Citation2011), and blood-vessel softening (Purwandhono & Rormasari, Citation2015) effects. Due to their nutritional value and ease of digestion, bean sprouts are widely consumed.
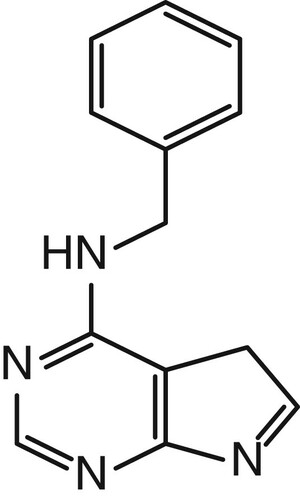
6-Benzylaminopurine (6-BA, ), a first-generation synthetic cytokinin, is a plant growth regulator. Its efficiency, stability, and affordability have contributed to its widespread application on sprout vegetables. Specifically, 6-BA increases seed yield (Mohammadi, Tavakoli, & Saba, Citation2014; Zheng, Zhu, Wang, Guo, & He, Citation2016), inhibits chlorophyll degradation, and retards leaf senescence (Xu et al., Citation2012). However, when overused, 6-BA accumulates in sprout vegetables and causes adverse health effects in humans, including increased skin, eye, and respiratory irritation and esophageal and gastric mucosal damage (http://www.epa.gov/pesticides/pestlabels/). In Korea, the maximum residue limit of 6-BA has been established at 0.1 mg/kg in fruits (The Ministry of Food and Drug Safety, Citation2009), while in China, the use of 6-BA in sprout vegetables is prohibited (GB2760-2011).
Figure 1. Chemical structure of 6-Benzylaminopurine.
Currently, 6-BA detection methods include chromatography (Lee et al., Citation2014; Man et al., Citation2016), electrochemistry (Gan et al., Citation2015), voltammetry (Lu et al., Citation2015), Raman spectroscopy (Wang et al., Citation2016; Zhang et al., Citation2012), enzyme-linked immunosorbent assay (ELISA; Zhang et al., Citation2016), and biosensor techniques (Lee, Kim, & Moon, Citation2013). In spite of their high accuracy and sensitivity, instrumental analyses are time consuming, expensive, and require highly trained personnel. In addition, electrochemical, voltammetric, and biosensor techniques based on the oxidation or reduction of purine are very intricate when functionalized electrodes are produced. Therefore, these methods are not adequate for the rapid analysis of 6-BA.
Immunoassays such as ELISA, immunochip, immunoblotting, and immunochromatographic assay (ICA) are reliable and simple for high-throughput applications (Jiang et al., Citation2013; Karginov & Agaphonov, Citation2016; Li et al., Citation2015). Among these methods, ICA is the easiest to use because it is time effective and cost efficient (Wang et al., Citation2017).
In this study, we developed a gold nanoparticle (GNP) immunochromatographic strip using a specific monoclonal antibody (mAb) against 6-BA. Our findings revealed that ICA is a rapid tool for the on-site detection of 6-BA in bean sprouts.
Materials and methods
Reagents and materials
6-BA, kinetin (KT), N6-dimethylallyladenine (2iP), trans-zeatin (t-Zea), N6-benzyladenosine (6-BAR), adenine (Ade), 6-chloro-7H-purine, and 4-(aminomethyl) benzoic acid were purchased from J&K Scientific Ltd. (Beijing, China). Bovine serum albumin (BSA), ovalbumin (OVA), N-hydroxysuccinimide (NHS), 1-ethyl-3-(3-dimethylaminopropyl) carbodiimide hydrochloride (EDC), 3,3′,5,5′-tetramethylbenzidine (TMB), Freund’s complete adjuvant, and Freund’s incomplete adjuvant were acquired from Sigma-Aldrich (St. Louis, MO, USA). Enzyme immunoassay-grade horseradish peroxidase-labeled goat anti-mouse immunoglobulin (IgG) was supplied by Hua Mei Co. (Shanghai, China). Cell culture media were obtained from Life Technologies Corporation (Shanghai, China). Bean sprouts were purchased at a local supermarket. All other reagents were of analytical reagent grade and obtained from the National Pharmaceutical Group Chemical Reagent Co., Ltd. (Shanghai, China).
Nitrocellulose (NC) membrane was acquired from Sartorius Stedim Biotech GmbH (Goettingen, Germany). Sample pad (glass fiber membrane, GL-b01), absorption pad (H5079), and polyvinylchloride backing card were supplied by JieYi Biotechnology Co., Ltd. (Shanghai, China). The dispensing platform and CM4000 guillotine-cutting module were purchased from Kinbio Tech Co., Ltd. (Shanghai, China). A BioDot TSR3000 Membrane Strip Reader was obtained from Gene Co., Ltd, Shanghai Branch (Shanghai, China).
Animals
Female BALB/c mice (8–10 weeks of age) were provided by Jess Jie Laboratory Animal Co., Ltd. (Shanghai, China). The animal breeding environment and experimental procedures met the guidelines and regulations of the Animal Laboratory Center of Jiangnan University.
Buffers
The buffers used in this study were prepared with Millipore-Q water. The buffers included phosphate buffer saline (PBS, 0.01 M, pH 7.2), sodium borate buffer (BB, 0.01M, pH 8.4), coating buffer consisting of 0.05 M carbonate bicarbonate buffer (CBS, pH 9.6), blocking buffer consisting of 0.05 M CBS containing 0.2% (m/v) gelatin, washing buffer consisting of 0.05% (v/v) Tween-20 in 0.01 M PBS, antibody dilution solution consisting of 0.1% (m/v) gelatin in 0.01 M PBS, substrate solution consisting of solution A (Na2HPO4, citric acid, and H2O2) and solution B (glycol containing 0.06% v/v TMB) at a ratio of 5/1, and termination solution consisting of 2 M H2SO4.
Hapten synthesis
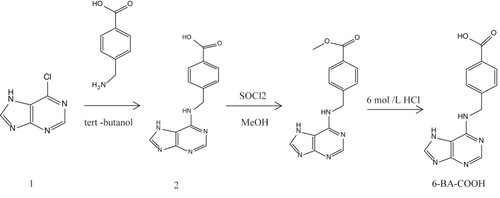
The 6-BA hapten (6-BA-COOH) was synthesized as shown in . A solution of 6-chloro-7H-purine (compound 1) (2.00 g, 12.9 mmol) and Et3N (2.60 g, 25.6 mmol) in tert-butanol (20 mL) was added 4-(aminomethyl) benzoic acid (1.96 g, 12.9 mmol) under N2 and refluxed for 72 h. The solution was allowed to cool to room temperature and filtered, resulting in the formation of a yellow solid (compound 2). Subsequently, thionyl chloride (0.85 mL, 11.7 mmol) was added dropwise to compound 2 (1.70 g, 6.32 mmol) in methanol (20 mL) at 0°C, warmed to room temperature, and stirred overnight. The mixture was concentrated under reduced pressure and purified using a silica gel column, thereby resulting in the formation of a white solid (compound 3). Compound 3 (300 mg, 1.05 mmol) dissolved in 6 M HCl (3 mL) was stirred overnight at 80°C. Finally, the solvent was removed under reduced pressure, resulting in the pure hapten (6-BA-COOH, 140 mg, 95%) as a white solid. 6-BA-COOH was identified by 1H NMR and MS.
Figure 2. The synthesis route of the hapten 6-BA-COOH.
Protein–hapten conjugate preparation
Immunogen and coating antigen were synthesized by conjugating 6-BA-COOH with BSA and OVA, respectively, using a modification of the carbodiimide method previously reported (Duan & Yuan, Citation2001; Liu, Yan, Zhang, Kuang, & Xu, Citation2015). 6-BA-COOH (2.5 mg) was dissolved in N,N-dimethyl formamide at 3 mg/mL, mixed with NHS (3 mg) and EDC (5.5 mg), and stirred for 7–8 h at room temperature. The resulting mixture was gradually added to 2 mL protein solution (10 mg of BSA or OVA dissolved in 0.01 M BB), and the pH was constantly adjusted to 9.0 with 1 M NaOH. Subsequently, the reaction solution was stirred for 8 h at room temperature or stirred overnight at 4°C. Finally, the reaction mixture was dialyzed against 0.01 M PBS for 3 days with a change of 0.01 M PBS every 6 h. The conjugates (6-BA-COOH-BSA and 6-BA-COOH-OVA) were characterized by UV spectroscopy and stored at −20°C.
Production of mAb against 6-BA
Female BALB/c mice were subcutaneously immunized with 6-BA-COOH-BSA emulsified in Freund’s complete adjuvant. After 4 weeks, three boosters were administered to the mice at triweekly intervals with the same immunogen emulsified in Freund’s incomplete adjuvant. Seven days following the third booster, the titer and inhibition rates against 6-BA of the antisera were evaluated by indirect competitive enzyme-linked immunosorbent assay (icELISA). On the 21st day after the final injection, immunogen mixed with normal saline was administered into the abdominal cavities of the mouse with the highest titer and inhibition rate. Three days later, the mouse was used for cell fusion. Hybridoma cells were screened by icELISA and subcloned three times by the limiting dilution method (Liu, Xing, Yan, Kuang, & Xu, Citation2014; Yin, Liu, Song, Kuang, & Xu, Citation2015). The target cell (3D3) was expanded in BALB/c mice and antibodies were purified using the caprylic acid-ammonium sulfate method (Feng et al., Citation2013; Kuang et al., Citation2013).
icELISA
IcELISA was performed as previously reported (Liu et al., Citation2017), among them, only the coating antigen and antibody were changed for 6-BA-COOH-OVA and anti-6-BA antibody, respectively.
We evaluated the cross-reactivity (CR) of mAb against other structural analogues (KT, 2iP, t-Zea, 6-BAR, and Ade) to assess the specificity of the antibody. CR was calculated using the following formula (Kong, Liu, Song, Kuang, & Xu, Citation2017), in this formula, IC50 means a half-maximum inhibition concentration of 6-BA standard,
Labeling mAb with GNPs
Prefabricated GNPs were directly used to label mAb. GNP solution (10 mL) was adjusted to pH 9.0 with 0.1 M potassium carbonate solution. Anti-6-BA mAb (0.25 mL) was added dropwise and incubated at room temperature for 1 h. To stabilize the conjugates, blocking solution (0.5% w/v BSA, 1 mL) was subsequently mixed with GNPs and shaken for another 2 h at room temperature. Following centrifugation at 7000×g for 50 min, the pellet was washed by centrifuging three times with 0.02 M phosphate buffer (containing 5% sucrose, 1% BSA, and 0.5% PEG-6000, pH 7.4) to remove excess mAb and blocking agent. Finally, the sediment was resuspended in 1 mL of 0.02 M phosphate buffer containing 0.02% NaN3 and stored at 4°C (Guo et al., Citation2015; Xu, Xu et al., Citation2015).
Assembly of the immunochromatographic strip
The immunochromatographic strip consists of a conjugate pad, a NC membrane, a sample pad, and an absorption pad (Chen et al., Citation2017; Xing et al., Citation2015). The conjugate pad was obtained by spraying a limited amount of GNPs-mAb conjugates onto a glass fiber membrane. The sample and absorption pads were attached to both ends of the polyvinylchloride backing card. The goat anti-mouse antibody and coating antigen were sprayed onto the NC membrane to create a control line (C line) and test line (T line), respectively. The strips were stored in a desiccator.
Principle of ICA
Sample solution added to the sample pad diffuses towards the absorption pad by capillary action. When the sample reaches the conjugate pad, GNPs-mAb conjugates are released. If target analyte is present in the sample, the analyte couples with a limited amount of conjugates. Coating antigen present on the T line captures the remaining conjugates, thereby leading to a weak T line color. If the target analyte is not present in the sample, the GNPs-mAb conjugates are only captured by the stable coating antigen, which in turn results in a red T line. Regardless of the presence or absence of target analyte, the sample reaches the C line (Chen, Liu, Kuang, Song, & Xu, Citation2013; Le, He, Niu, Chen, & Xu, Citation2013). The T line is indicative of the presence or absence of target analyte, while the C line indicates that the strip has been effectively assembled (Eltzov et al., Citation2015).
Analysis of 6-BA in bean sprout samples
First, ICA sensitivity was assessed by analyzing 6-BA standard in 0.01M PBS. The 6-BA standard was serially diluted to 0, 2.5, 5, 10, 25, 50, and 75 ng/mL. Six replicates of each concentration were used in the analysis.
Bean sprout samples were confirmed to be 6-BA negative by LC-MS. Bean sprouts (20 g) were spiked with different amounts of 6-BA standard resulting in final concentrations of 0, 10, 20, 50, 80, and 100 ng/g. Subsequently, the samples were centrifuged at 6000×g for 30 min. The resulting supernatant (six replicates per sample) was used for immunochromatographic strip analysis.
Results and discussion
Characterization of hapten and antigen
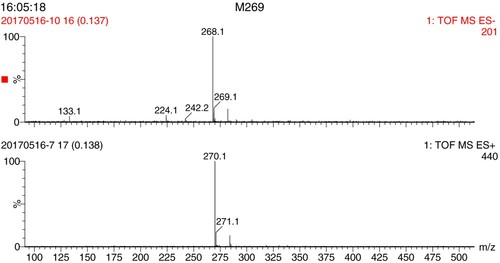
The hapten was identified by 1H NMR and MS (). 1H NMR results (400 MHz, DMSO-d6) were: δ 8.55 (s, 2H), 7.89–7.91 (d, 2H), 7.50–7.52 (d, 2H), 4.92 (s, 2H). The molecular weight of the hapten (6-BA-COOH) is 269.101 g/mol. In the MS negative ion mode, the analyte forms [M – H]−, resulting in an ion fragment with a molecular weight of 268.1 g/mol. In the MS positive ion mode, the analyte forms [M + H]+, resulting in an ion fragment with molecular weight of 270.1 g/mol. Therefore, the hapten was successfully synthesized.
Figure 3. MS spectrum of hapten (6-BA-COOH).
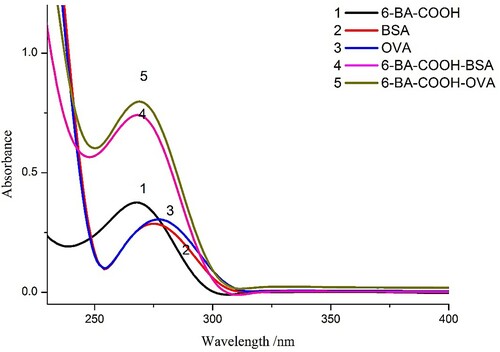
The conjugates of hapten and carrier proteins (BSA and OVA) were prepared by the EDC method and confirmed by UV-visible spectroscopy (). The absorption peaks of 6-BA-COOH, BSA, and OVA were obtained at 269, 280, and 280 nm, respectively, while the absorption peaks of 6-BA-COOH-BSA and 6-BA-COOH-OVA were between 269 and 280 nm, which revealed that the conjugation reactions were successful.
Figure 4. UV–Vis spectra of 6-BA-COOH, proteins and antigens.
Production and characterization of anti-6-BA mAb
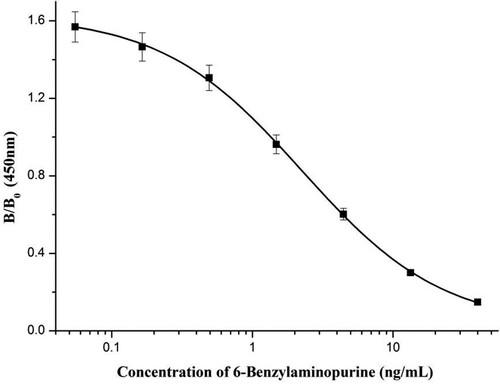
Following mice immunization, cell fusion, and screening, we obtained mAb 3D3, which had the lowest IC50. This mAb was used in the development of the immunochromatographic strip for 6-BA analysis. The IC50, limit of detection (LOD), and CR values of mAb 3D3 were assessed by icELISA. The standard sigmoidal inhibition curve (R2 = 0.999; ) showed that the IC50, LOD, and linear range were 2.25 ng/mL, 0.12 ng/mL, and 0.455–11.16 ng/mL, respectively.
Figure 5. Standard inhibition curve of mAb 3D3 for 6-benzylaminopurine.
shows the CR values of mAb 3D3 with 6-BA and its structural analogues. The CR values of mAb 3D3 with KT, 2iP, and t-Zea were 63.03%, 10.35%, 3.53%, respectively. There was no CR with 6-BAR or Ade.
Table 1. Cross-reactivities of 6-BA and related analytes.
Optimization of the immunochromatographic strip
The type and concentration of coating antigen affect the ability of the T line to capture GNPs-labeled mAbs, thereby affecting ICA sensitivity (Kong, Song, Liu, Kuang, & Xu, Citation2016). In this study, the type and concentration of coating antigen were optimized to obtain the desired color intensity of the T line and the lowest detection limit of the assay. Each test was replicated six times.
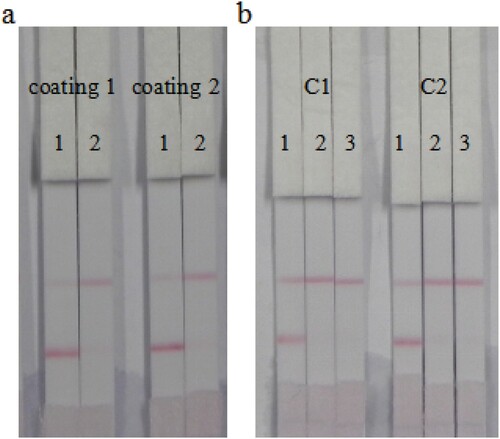
Two types of coating antigen (reaction molar ratio of 6-BA-COOH to OVA of 30:1 and 60:1) at a concentration of 0.3 mg/mL were evaluated by analyzing 6-BA standard diluted in 0.01 M PBS ((a)). Even though both coating antigens contributed to a lighter T line color at 50 ng/mL of 6-BA standard, a deeper T line color was observed with coating antigen 2 at 0 ng/mL. Therefore, the 60:1 reaction molar ratio of 6-BA-COOH to OVA was selected for subsequent experiments. Different coating antigen concentrations (0.1 and 0.25 mg/mL) were assessed. As shown in (b), at 50 and 70 ng/mL of 6-BA standard, the color intensity of T line at both 0.1 and 0.25 mg/mL coating antigen was significantly weaker than at 0 ng/mL of 6-BA standard. The results revealed that both concentrations of coating antigen achieved adequate results. From a cost-effective perspective, 0.1 mg/mL coating antigen was selected for subsequent experiments. Therefore, the optimum conditions consisted of a reaction molar ratio of coating antigen of 60 and a coating antigen concentration of 0.1 ng/mL.
Figure 6. Optimization of immunochromatographic strip: (a) coating antigens with different reaction molar ratio of hapten to OVA. Coating 1 = 30:1; coating 2 = 60:1; 1= 0 ng/mL; 2 = 50 ng/mL. (b) Concentration optimized of coating 2. C1 = 0.1 mg/mL; C2 = 0.25 mg/mL; 1 = 0 ng/mL; 2 = 50 ng/mL; 3 = 70 ng/mL, n = 6.
Sensitivity of the immunochromatographic strip
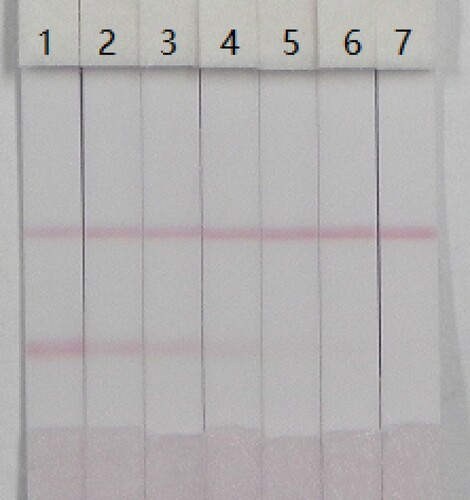
Under optimum conditions, the sensitivity of the strip was evaluated at 0–75 ng/mL 6-BA in 0.01 M PBS. With increasing 6-BA concentration, the color of the T line was weaker. The lowest detection limit was 5 ng/mL with the naked eye. At the lowest detection limit, there was a distinct visible difference in the color intensity of the T line between the sample and the blank (no 6-BA). At 50 ng/mL 6-BA, there was no color on the T line ().
Figure 7. The sensitivity of the immunochromatographic strip (n = 6). 1 = 0 ng/mL; 2 = 2.5 ng/mL, 3 = 5 ng/mL, 4 = 10 ng/mL, 5 = 25 ng/mL, 6 = 50 ng/mL, and 7 = 75 ng/mL.
Sample analyses
Bean sprout samples spiked with 6-BA were analyzed by ICA. If the color of the T line was similar to that of the negative control sample, the sample was regarded as 6-BA negative. If the color intensity of the T line was somewhere in between that of the control samples, the 6-BA concentration was somewhere in between the two control samples (Liu, Luo, et al., Citation2014).
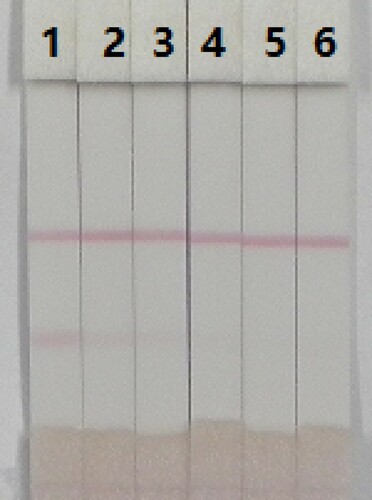
Bean sprouts were spiked with different levels of 6-BA resulting in final concentrations of 0–100 ng/g 6-BA. The samples were analyzed by the optimized ICA. shows that 10 ng/g 6-BA contributed to a weaker T line than the negative sample. In addition, the color intensity of the T line disappeared at 80 ng/g. The results revealed that the visual LOD and cutoff values of the strip were 10 ng/g and 80 ng/g, respectively.
Figure 8. 6-BA detection in bean sprout using the ICA strip (n = 6). 1 = 0 ng/g; 2 = 10 ng/g, 3 = 20 ng/g, 4 = 50 ng/g, 5 = 80 ng/g and 6 = 100 ng/g.
Conclusions
A colloidal gold ICA based on icELISA was developed to detect 6-BA residues in bean sprouts. The visual LOD and cutoff values of ICA were 10 and 80 ng/g, respectively, in bean sprouts. Results from ICA can be obtained by the naked eye within 10 min; therefore, ICA is a rapid tool for the on-site analysis and mass sample screening of residual 6-BA in bean sprouts.
Disclosure statement
No potential conflict of interest was reported by the authors.
Additional information
Funding
Notes on contributors
Yue Li
Yue Li She got her bachelor from Hainan University, Haikou, China in 2015 and then she began to study in Jiangnan University (Wuxi, China) for her Master Degree in food science. Her research interests are immunoassay development for veterinary drugs.
Liqiang Liu
Liqiang Liu He got his Ph.D. in Food science in 2014 from Jiangnan University, Wuxi, China and then became a faculty in college of Food science and technology of Jiangnan University. His research interests are immunochromatographic strip design and application.
Shanshan Song
Shanshan Song She got her Master degree in Food science in 2012 from Jiangnan University, Wuxi, China and then became a research assistant in college of Food science and technology of Jiangnan University. Her research interests are monoclonal antibody development.
Hua Kuang
Hua Kuang She got her Ph.D. from China Agricultural University in 2009 and then began to work as a faculty in college of Food science and technology of Jiangnan University. She is currently a full professor in food safety. Her research interests are biosensor development.
Related Research Data
References
- Chen, X., Liu, L., Kuang, H., Song, S., & Xu, C. (2013). A strip-based immunoassay for rapid determination of fenpropathrin. Analytical Methods, 5(21), 6234–6239. doi: https://doi.org/10.1039/c3ay41030g
- Chen, Y., Liu, L., Xu, L., Song, S., Kuang, H., Cui, G., & Xu, C. (2017). Gold immunochromatographic sensor for the rapid detection of twenty-six sulfonamides in foods. Nano Research, 1–12. doi: https://doi.org/10.1007/s12274-016-1283-7
- Duan, J., & Yuan, Z. (2001). Development of an indirect competitive ELISA for ciprofloxacin residues in food animal edible tissues. Journal of Agricultural & Food Chemistry, 49(3), 1087–1089. doi: https://doi.org/10.1021/jf000091j
- Eltzov, E., Guttel, S., Kei, A. L. Y., Sinawang, P. D., Ionescu, R. E., & Marks, R. S. (2015). Lateral flow immunoassays – From paper strip to smartphone technology. Electroanalysis, 27(9), 2116–2130. doi: https://doi.org/10.1002/elan.201500237
- Feng, M., Yong, Q., Wang, W., Kuang, H., Wang, L., & Xu, C. (2013). Development of a monoclonal antibody-based ELISA to detect O157:H7. Food & Agricultural Immunology, 24(4), 481–487. doi: https://doi.org/10.1080/09540105.2012.716026
- Gan, T., Shi, Z. X., Liu, N., Lv, Z., Sun, J. Y., & Wang, H. B. (2015). A novel electrochemical sensing strategy for rapid and ultrasensitive detection of 6-benzylaminopurine in sprout vegetables by hollow core/shell-structured CuO@SiO2 microspheres. Food Analytical Methods, 8(10), 2504–2514. doi: https://doi.org/10.1007/s12161-015-0140-8
- Guo, X., Li, T., Tang, K., & Liu, R. H. (2012). Effect of germination on phytochemical profiles and antioxidant activity of mung bean sprouts (Vigna radiata). Journal of Agricultural & Food Chemistry, 60(44), 11050–11055. doi: https://doi.org/10.1021/jf304443u
- Guo, J., Liu, L., Xue, F., Xing, C., Song, S., Kuang, H., & Xu, C. (2015). Development of a monoclonal antibody-based immunochromatographic strip for cephalexin. Food & Agricultural Immunology, 26(2), 282–292. doi: https://doi.org/10.1080/09540105.2014.907242
- Hsu, G., Lu, Y. F., Chang, S. H., & Hsu, S. Y. (2011). Antihypertensive effect of mung bean sprout extracts in spontaneously hypertensive rats. Journal of Food Biochemistry, 35(1), 278–288. doi: https://doi.org/10.1111/j.1745-4514.2010.00381.x
- Jiang, W., Wang, Z., Beier, R. C., Jiang, H., Wu, Y., & Shen, J. (2013). Simultaneous determination of 13 fluoroquinolone and 22 sulfonamide residues in milk by a dual-colorimetric enzyme-linked immunosorbent assay. Analytical Chemistry, 85(4), 1995–1999. doi: https://doi.org/10.1021/ac303606h
- Karginov, A., & Agaphonov, M. (2016). A simple enrichment procedure improves detection of membrane proteins by immunoblotting. Biotechniques, 61(5), 260–261. doi: https://doi.org/10.2144/000114474
- Kong, D., Liu, L., Song, S., Kuang, H., & Xu, C. (2017). Development of sensitive, rapid, and effective immunoassays for the detection of vitamin B12 in fortified food and nutritional supplements. Food Analytical Methods, 10(1), 10–18. doi: https://doi.org/10.1007/s12161-016-0543-1
- Kong, D., Song, S., Liu, L., Kuang, H., & Xu, C. (2016). Development of an immunochromatographic strip for the semi-quantitative and quantitative detection of biotin in milk and milk products. Analytical Methods, 8(7), 1595–1601. doi: https://doi.org/10.1039/C5AY02659H
- Kuang, H., Xing, C., Hao, C., Liu, L., Wang, L., & Xu, C. (2013). Rapid and highly sensitive detection of lead ions in drinking water based on a strip immunosensor. Sensors, 13(4), 4214–4224. doi: https://doi.org/10.3390/s130404214
- Lee, S. M., Kim, J. Y., Lee, H. J., Chang, M. I., Chae, Y. S., & Rhee, G. S. (2014). Establishment of analytical method for 6-benzylaminopurine residue, a plant growth regulator for brown rice, mandarin, pepper, potato, and soybean by using GC/NPD. Applied Biological Chemistry, 57(1), 83–89. doi: https://doi.org/10.3839/jabc.2014.013
- Lee, S., Kim, G. Y., & Moon, J. H. (2013). Detection of 6-benzylaminopurine plant growth regulator in bean sprouts using OFRR biosensor and QuEChERS method. Analytical Methods, 5(4), 961–966. doi: https://doi.org/10.1039/C2AY26136G
- Le, T., He, H., Niu, X., Chen, Y., & Xu, J. (2013). Development of an immunochromatographic assay for detection of tylosin and tilmicosin in muscle, liver, fish and eggs. Food & Agricultural Immunology, 24(4), 467–480. doi: https://doi.org/10.1080/09540105.2012.716025
- Li, C., Li, J., Jiang, W., Zhang, S., Shen, J., Wen, K., & Wang, Z. (2015). Development and application of a gel-based immunoassay for rapid screening of salbutamol and ractopamine residues in pork. Journal of Agricultural & Food Chemistry, 63(48), 10556–10561. doi: https://doi.org/10.1021/acs.jafc.5b04203
- Liu, L., Luo, L., Suryoprabowo, S., Peng, J., Hua, K., & Xu, C. (2014). Development of an immunochromatographic strip test for rapid detection of ciprofloxacin in milk samples. Sensors, 14(9), 16785–16798. doi: https://doi.org/10.3390/s140916785
- Liu, L., Peng, J., Xie, Z., Song, S., Kuang, H., & Xu, C. (2017). Development of an icELISA and immunochromatographic assay for methyl-3-quinoxaline-2-carboxylic acid residues in fish. Food Analytical Methods, doi:https://doi.org/10.1007/s12161-017-0888-0.
- Liu, L., Xing, C., Yan, H., Kuang, H., & Xu, C. (2014). Development of an ELISA and immunochromatographic strip for highly sensitive detection of microcystin-LR. Sensors, 14(8), 14672–14685. doi: https://doi.org/10.3390/s140814672
- Liu, L., Yan, H., Zhang, X., Kuang, H., & Xu, C. (2015). Development of an anti-chlorothalonil monoclonal antibody based on a novel designed hapten. Food & Agricultural Immunology, 26(3), 410–419. doi: https://doi.org/10.1080/09540105.2014.938319
- Lu, S., Wen, Y., Bai, L., Liu, G., Chen, Y., Du, H., & Wang, X. (2015). pH-controlled voltammetric behaviors and detection of phytohormone 6-benzylaminopurine using MWCNT/GCE. Journal of Electroanalytical Chemistry, 750, 89–99. doi: https://doi.org/10.1016/j.jelechem.2015.05.019
- Man, Y., Shu, M., Wang, D., Luan, F., Liu, H., & Gao, Y. (2016). Determination of 6-benzylaminopurine in bean sprouts by capillary electrophoresis compared with HPLC. Food Analytical Methods, 9(11), 1–7. doi: https://doi.org/10.1007/s12161-016-0496-4
- Mohammadi, M., Tavakoli, A., & Saba, J. (2014). Effects of foliar application of 6-benzylaminopurine on yield and oil content in two spring safflower (Carthamus tinctorius L.) cultivars. Plant Growth Regulation, 73(3), 219–226. doi: https://doi.org/10.1007/s10725-013-9882-8
- Okumura, K., Hosoya, T., Kawarazaki, K., Izawa, N., & Kumazawa, S. (2016). Antioxidant activity of phenolic compounds from fava bean sprouts. Journal of Food Science, 81(6), C1394–C1398. doi: https://doi.org/10.1111/1750-3841.13330
- Purwandhono, A., & Rormasari, R. (2015). Effect of mung bean sprout (Vigna radiata (L.)) extract on physical stress-induced atherosclerosis of male Wistar Rat.pdf. Journal of Agromedicine and Medical Sciences, 1(2), 26–30.
- Romero, M. C., Garro, O. A., Romero, A. M., Michaluk, A. G., Doval, M. M., & Judis, M. A. (2014). Assessment of the quality and shelf-life in enriched n3 PUFA raw beef patties using dry soybean sprouts as antioxidant. Food & Nutrition Sciences, 5(7), 658–670. doi: https://doi.org/10.4236/fns.2014.57077
- The Ministry of Food and Drug Safety. (2009). MRLs for pesticides in foods. Seoul, Korea.
- Tiansawang, K., Luangpituksa, P., Varanyanond, W., & Hansawasdi, C. (2016). GABA (γ-aminobutyric acid) production, antioxidant activity in some germinated dietary seeds and the effect of cooking on their GABA content. Journal of Food Science and Technology, 36(2), 311–321.
- Wang, D., Liang, F., Ma, P., Yang, Q., Gao, D., Song, D., & Wang, X. (2016). Determination of 6-benzylaminopurine and hg 2+ in bean sprouts and drinking mineral water by surface-enhanced Raman spectroscopy. Food Analytical Methods, 9(4), 934–941. doi: https://doi.org/10.1007/s12161-015-0268-6
- Wang, C., Li, X., Peng, T., Wang, Z., Wen, K., & Jiang, H. (2017). Latex bead and colloidal gold applied in a multiplex immunochromatographic assay for high-throughput detection of three classes of antibiotic residues in milk. Food Control, 77, 1–7. doi: https://doi.org/10.1016/j.foodcont.2017.01.016
- Wongsiri, S., Ohshima, T., & Duangmal, K. (2015). Chemical composition, amino acid profile and antioxidant activities of germinated mung beans (Vigna radiata). Journal of Food Processing & Preservation, 39(6), 1956–1964. doi: https://doi.org/10.1111/jfpp.12434
- Xing, C., Liu, L., Song, S., Feng, M., Kuang, H., & Xu, C. (2015). Ultrasensitive immunochromatographic assay for the simultaneous detection of five chemicals in drinking water. Biosensors & Bioelectronics, 66(66C), 445–453. doi: https://doi.org/10.1016/j.bios.2014.12.004
- Xu, N., Xu, L., Ma, W., Liu, L., Kuang, H., & Xu, C. (2015). An ultrasensitive immunochromatographic assay for non-pretreatment monitoring of chloramphenicol in raw milk. Food & Agricultural Immunology, 26(5), 635–644. doi: https://doi.org/10.1080/09540105.2014.998640
- Xu, F., Yang, Z., Chen, X., Jin, P., Wang, X., & Zheng, Y. (2012). 6-Benzylaminopurine delays senescence and enhances health-promoting compounds of harvested broccoli. Journal of Agricultural & Food Chemistry, 60(1), 234–240. doi: https://doi.org/10.1021/jf2040884
- Yin, Y., Liu, L., Song, S., Kuang, H., & Xu, C. (2015). Development of a highly sensitive icELISA to detect semicarbazide based on a monoclonal antibody. Food & Agricultural Immunology, 26(3), 356–365. doi: https://doi.org/10.1080/09540105.2014.914891
- Zhang, W., He, L., Zhang, R., Guo, S., Yue, H., Ning, X., … Wang, B. (2016). Development of a monoclonal antibody-based enzyme-linked immunosorbent assay for the analysis of 6-benzylaminopurine and its ribose adduct in bean sprouts. Food Chemistry, 207, 233–238. doi: https://doi.org/10.1016/j.foodchem.2016.03.103
- Zhang, P., Zheng, D. W., Liu, J., Zhong, R. G., Liu, C. W., Guo, X., & Wang, H. (2012). Rapid detection of 6-benzylaminopurine residues in sprout beans by surface-enhanced Raman spectroscopy. Spectroscopy and Spectral Analysis, 32(5), 1266.
- Zheng, C., Zhu, Y., Wang, C., Guo, T., & He, G. (2016). Wheat grain yield increase in response to pre-anthesis foliar application of 6-benzylaminopurine is dependent on floret development. Plos One, 11(6), e0156627. doi: https://doi.org/10.1371/journal.pone.0156627