
ABSTRACT
Gly m 4 is one of important soybean allergens, which has property to cross-react with birch pollen allergen. However, a universal method for quantifying soybean allergen is unavailable. We aimed to develop an LC-MS/MS-based method for Gly m 4 quantification. A recombinant Gly m 4 (rGly m 4) was used to plot a standard curve and conduct a recovery test. The recovery of rGly m 4 from soybean grain extracts was 128% and the intra- and inter-day coefficients of variation were 12.8% and 13.2%, respectively. The method had a limit of quantification of 0.1 µg/mL. Using a validated method, Gly m 4 content was found to range from 309 to 421 µg/g in soybean grains and 2.7–67 µg/g in soybean processed foods. The newly developed method demonstrated sufficient reproducibility, sensitivity and accuracy, and might be helpful for individuals with soybean allergy to control Gly m 4 intake from food products.
Introduction
Soybeans (Glycine max) are one of the most popular and important legumes in the human diet in Asia (Ma et al., Citation2015). Soybeans have long been a part of the Japanese diet and have been consumed in the form of Japanese traditional processed foods such as soymilk, tofu, miso, soy sauce and natto. Although soybeans comprise several healthy and important nutrients such as isoflavones, saponins and dietary fibres (Ma et al., Citation2015), they are one of the most frequently reported allergic foods (Ebisawa, Ito, & Fujisawa, Citation2017). As recommended by the Japanese authorities, since 2002, the presence of soybeans in food products should be indicated on the label (Ebisawa et al., Citation2017).
Until now, six soybean allergens – Gly m 3–8 – have been officially confirmed as food allergen according to the official allergen database of the Allergen Nomenclature Subcommittee of the World Health Organization and International Union of Immunological Societies (WHO/IUIS Allergen Nomenclature Sub-Committee, Citation2018). Among them, Gly m 4 is considered to be an important allergen causing soybean allergy. Gly m 4 was initially known as SAM 22 (starvation-associated message 22) (Berkner et al., Citation2009), the production of which was induced in soybean under stress conditions such as starvation and worm wounding (Hanafusa et al., Citation2018). Subsequently, it has been classified into the pathogenesis-related protein (PR protein) family, which plays a role in biological defence (Radauer & Breiteneder, Citation2007). In 2013, the National Consumer Affairs Center of Japan provided information regarding a risk of occurrence of an adverse food reaction after consuming a drink mainly prepared from soymilk containing Gly m 4 (Kosma, Sjolander, Landgren, Borres, & Hedlin, Citation2011; National Consumer Affairs Center of Japan, Citation2014).
Gly m 4 shows high amino acid sequence identity and cross-reactivity to Bet v 1, a birch pollen allergen, which causes soybean-pollen allergy (Ma, Wang, Nie, & Yin, Citation2017; Minami et al., Citation2015). The association between soybean and pollen allergies has been reported (Kosma et al., Citation2011); Gly m 4 is known to be a potent trigger of allergic syndrome in Japanese individuals with birch pollen allergy, an allergic response to the pollen of a common tree in Japan, as birch trees are common in Japan. Since Gly m 4, in contrast to other Bet v 1 homologous proteins such as Mal d 1, provokes severe food adverse reactions (Berneder, Bublin, Hoffmann-Sommergruber, Hawranek, & Lang, Citation2013), it has been used as a diagnostic marker for severe food allergic reactions to soybean (Berneder et al., Citation2013).
To avoid the development of food allergic symptoms, controlling the intake of the allergens is important for allergic individuals. The content of Gly m 4 in the soybean processed food products is not known in detail; therefore, development of appropriate analytical methods is highly necessary. Previously, several studies on the quantification of Gly m 4, employing methods such as a sandwich ELISA (Geng et al., Citation2015) and western blotting (Mittag et al., Citation2004) using anti-Gly m 4 antibodies were reported. However, it is difficult for other institutions to reproduce these methods as the antibodies are not commercially available. In addition, a two-dimensional liquid chromatography approach with ultraviolet and mass spectrometry detection (Julka et al., Citation2012) was reported. However, the method involved complicated operations with a high limit of quantification, 12.5 µg/mL. Gly m 4 in soybean processed foods could be more efficiently quantified with high specificity and sensitivity by liquid chromatography-tandem mass spectrometry (LC-MS/MS).
This study aimed to develop a more sensitive and universal LC-MS/MS-based method for the quantification of the soybean allergen, Gly m 4. Using the newly developed method, we assessed Gly m 4 levels in soybean grains and processed foods, such as soybean milk and flour.
Materials and methods
Chemicals and reagents
Tris(hydroxymethyl)aminomethane, urea and sodium bicarbonate were purchased from Sigma-Aldrich Co. LLC. (St. Louis, MO, USA). Formic acid was purchased from Fluka (Sleinheim, Germany). Tris(hydroxymethyl)aminomethane hydrochloride (Tris-HCl), dithiothreitol (DTT), 2-iodoacetamide (IAA), acetonitrile, formic acid, acetic acid and ammonia were purchased from Wako Pure Chemical Industries, Ltd. (Osaka, Japan). Trypsin was purchased from Agilent Technologies Inc. (Santa Clara, CA, USA). Synthesised standard peptide (ALVTDADNVIPK) was obtained from Hokkaido System Science Co., Ltd. (Hokkaido, Japan). Recombinant Gly m 4 (rGly m 4) was from Cusabio Biotech Co., Ltd. (China). Ultrapure water was used in all experiments.
Sample extraction
All the samples, soybean grain, roasted soybean flour, soybean milk, adzuki bean, red kidney bean, chickpea, lentil, corn grain, cow milk and mixed juice of fruits and vegetables, were purchased from local stores in Osaka, Japan.
Sample extraction was carried out as reported previously (Agilent Technologies Inc., Citation2010; Heick, Fischer, Kerbach, Tamm, & Popping, Citation2011; Mittag et al., Citation2004). Briefly, grain samples (2 g) such as soybean grain, roasted soybean flour, adzuki bean, red kidney bean, chickpea, lentil and corn grain were ground to a fine powder using a grinder (MX-X52, Panasonic Corporation, Osaka, Japan) and extracted with 20 mL of 50 mmol/L Tris-HCl (pH 8.0) at 4°C for 1 h under shaking conditions. After centrifugation at 10,000 × g and 4°C for 10 min, the supernatants were stored as extracts at −20°C until further use. Liquid samples (500 µL) such as soybean milk, cow milk and mixed juice of fruits and vegetables were extracted. After centrifugation at 12,300 × g and 20°C for 5 min, the supernatants were stored as extracts at −20°C until further use.
Enzymatic digestion and cleaning
Hundred microliters of the extract were mixed with 50 μL urea (8 mol/L), 2.5 µL Tris-HCl (1 mol/L, pH 8.0) and 0.75 µL DTT (1 mol/L), and incubated at 55°C for 1 h. After adding 3 µL of IAA (1 mol/L), the extracts were incubated at room temperature under dark conditions for 1 h, followed by adding 1.5 µL DTT (1 mol/L); the extracts were incubated at room temperature for 30 min to degrade IAA. For enzymatic digestion, the extracts were mixed with 321 µL of sodium bicarbonate (50 mmol/L) and 1 µL of trypsin solution (1 µg/µL) (Agilent Technologies Inc.), followed by incubation at 37°C for 16 h. Further, extracts were mixed with 20 µL of formic acid to stop the digestion, and purified using Oasis MCX SPE cartridges (1 cc/30 mg, Waters Co. Ltd., Milford, MA, USA). Purification was performed as follows: conditioning with 1 mL acetonitrile, equilibrating with 1 mL 2% formic acid, loading of 250 µL sample extract and washing with 1 mL 2% formic acid and 1 mL acetonitrile. Finally, elution was conducted with 1 mL of 80% acetonitrile and 5% ammonia, the extracts were concentrated by using a rotary evaporator, and the volume was adjusted to 100 µL with ultrapure water. Purified extracts were diluted 2–10 fold with ultrapure water, 5 μL acetonitrile was added and the volume was adjusted to 50 µL. After centrifugation at 20,000 × g and 20°C for 10 min with Nanosep® Centrifugal Devices with Omega™ Membrane (MWCO: 10,000; PALL Corporation, Port Washington, NY, USA), the elute was stored at −20°C until further use for LC-MS/MS quantification.
rGly m 4 was used as a standard for preparing the calibration curve and digestion purification, and it was stored under the same conditions as sample extracts. To plot the calibration curve, the digested Gly m 4 was diluted with ultrapure water to concentrations between 0.1 and 10 µg/µL, each containing 10% acetonitrile. The concentration of rGly m 4 was determined by using the Bradford assay kit (Thermo Fisher Scientific Inc., Waltham, MA, USA).
LC-MS/MS methods
The LC-MS/MS system consisting of a 3200QTRAP mass spectrometer (AB SCIEX, Framingham, MA, USA) coupled with a Shimadzu prominence LC (Shimadzu Co. Ltd., Kyoto, Japan) was carried out in ESI positive ionisation mode. First, 10 µL of the extract was injected into the column (AdvanceBio Peptide Map, 2.1 × 150 mm, 2.7 µm, Agilent Technologies Inc.) at 40°C. The mobile phase gradient consisted of water containing 0.1% formic acid (A) and acetonitrile containing 0.1% formic acid (B), setting the flow rate to 0.2 mL/min. The column was initially eluted with 98% (A) and 2% (B) for 10 min, followed by a linear gradient to 40% (A) and 60% (B) for 20 min, and a linear gradient to 2% (A) and 98% (B) for 10 min, and was maintained for 5 min. Prior to subsequent analyses, the column was eluted under the initial conditions for 10 min. The LC-MS/MS parameters are shown in .
Table 1. List of peptide sequences and ions used for the MRM transitions.
Selection of the targeting peptide for analysis
For selection of the targeting peptide, information-dependent acquisition (IDA) was applied as reported elsewhere (Heick et al., Citation2011). MS/MS data of the digested extracts were analysed by MASCOT database search tool (Matrix Science, London, UK). Since the peptide, ALVTDADNVIPK with the most intensive signals from the product ion, was specific to Gly m 4, it was measured for quantification by the MRM method.
Recovery testing
Here, 10 mg of the soybean extracts was spiked with 1 µg of rGly m 4. The concentrations of each spiked extract were measured twice per analysis for five independent experiments. The recovery average was evaluated, and repeatability and reproducibility were calculated using one-way analysis of variance (one-way ANOVA). The limit of quantification was determined by calculating 10- folds SD of blank.
Results and discussion
LC-MS/MS method development
Japanese individuals typically consume soybean products as traditional foods. Owing to the health benefits of soybean, it is also attracting a great deal of attention in Europe (Mittag et al., Citation2004). Gly m 4 is a key soybean allergen because of its cross-reactivity with Bet v 1, a major birch pollen allergen. Thus, analytical tools need to be developed to facilitate the detection of Gly m 4 in processed foods in order to provide useful information to allergic individuals, regulatory authorities and soybean food manufacturers.
In this study, we developed an LC-MS/MS method for quantifying Gly m 4 using a specific peptide indicator post trypsin digestion. MRM chromatograms revealed peaks of Gly m 4 in soybean grains and processed foods (). Using ALVTDADNVIPK () for quantification, the y2 fragment of the digested rGly m 4, the digested soybean samples and the synthesised standard peptide ALVTDADNVIPK was detected in the product ion scan mass spectrum at the same elution time (data not shown). Although rGly m 4, expressed in Escherichia coli, had no sugar chain modification, the mass spectra of ALVTDADNVIPK of the tryptic digested rGly m 4, soybean grain, soybean milk, and roasted soybean flour, the synthesised standard peptide ALVTDADNVIPK were the same in the developed method. Therefore, we used ALVTDADNVIPK of the tryptic digested rGly m 4 as a calibrator. The peptide was detected specifically in soybeans after trypsin digestion and not in other samples. A calibration curve, ranging from 0.1 to 10 µg/mL, for quantification was generated with excellent linearity using the digested rGly m 4 with ALVTDADNVIPK as a calibrator (). In five independent experiments, the recovery of rGly m 4 spiked to soybean grain extract at 10 µg/mL was determined to be 128% with 12.8% intra-day precision (RSD %) and 13.2% inter-day precision (RSD %) (). Finally, we tested the specificity of the method using 5 bean grains, such as adzuki bean grain, red kidney bean grain, chickpea grain, lentil grain and corn grain, and mixed juice of fruits and vegetables, containing Gly m 4 homologues. Gly m 4 homologues were not detected (concentration of less than 0.5 µg/g) in the samples using the LC-MS/MS-based method (). These results were indicative of the successful repeatability, reproducibility and specificity of our LC-MS/MS-based Gly m 4 detection method.
Figure 1. LC-MRM chromatograms of the ALVTDADNVIPK peptide of representative trypsin digested samples. Chromatograms show the selectivity for (a) 10 µg/mL of Gly m 4, (b) soybean grain, (c) roasted soybean flour and (d) soybean milk.
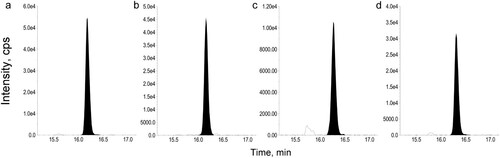
Figure 2. A representative calibration curve of trypsin-digested rGly m 4.
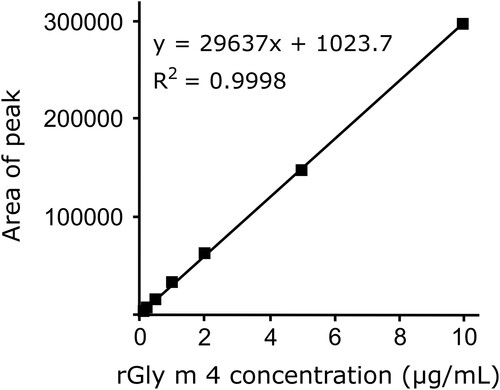
Table 2. Percent of recovery and the coefficients of variation.
Table 3. Specificity of the LC-MS/MS-based method.
Gly m 4 concentration measurements
Gly m 4 concentrations in soybean grains and processed foods were measured using the LC-MS/MS method, and the results are summarised in . In five soybean grain extracts, the concentration of Gly m 4 ranged from 309 ± 6.6 to 421 ± 4.4 µg/g and was not detected in other bean grains (<0.5 µg/g). In processed soybean food samples, Gly m 4 concentrations were 45 ± 1.4 µg/g and 2.7 ± 0.14 µg/g for roasted soybean flour and 60 ± 2.0 µg/g, 67 ± 2.0 µg/g and 45 ± 2.2 µg/g for soybean milk.
Table 4. Levels of Gly m 4 in soybean grains and soybean processed foods.
Mittag et al. (Citation2004) reported that the content of Gly m 4 was 256 ± 30 µg/g in soybean grain, using immunoblotting for quantification, suggesting that the contents tended to decrease or were not detected in processed soybean related foods. In addition, Geng et al. (Citation2015) reported that contents of soybean ranged from 24 to 311 µg/g, measured by a sandwich ELISA. Compared with these reports and considering that Gly m 4 contents vary depending on the degree of dryness, ripening of soybeans (Mittag et al., Citation2004) and possibly postharvest storage as Mal d 1, a Gly m 4 homologue (Sancho et al., Citation2006), the Gly m 4 concentrations measured in this study were within an accepted range. Furthermore, we assessed the Gly m 4 levels in soybean milk and roasted flour, and the levels tended to be lower than that of grains (less than approximately a quarter of its content in grains). Although soybean milk was diluted by water during food processing, these results suggested that Gly m 4 was degraded by food processing, possibly via heat treatment, as described previously (Mittag et al., Citation2004); however, there remained potential to cause allergy (Kosma et al., Citation2011). The minimum soybean quantity to elicit allergic symptoms was determined to be 10 mg of soy flour, corresponding to 5.3 mg of soybean protein, in double-blind placebo-controlled food challenge (DBPCFC) results (Ballmer-Weber et al., Citation2007). Considering soybean grains contain 36% protein (United States Department of Agriculture Agricultural Research Service, Citation2018), we speculate the Gly m 4 allergy-inducing threshold to be as follows: 5.3 × 100/36 = 14.7 (mg). Because the minimum Gly m 4 content obtained in this study was 309 µg/g, we can calculate the threshold of Gly m 4 as 309 × 14.7/1000 = 4.5 (µg). This value could serve as a signpost for allergists to treat allergies and for manufacturers to develop hypoallergenic soybean processed foods, making it possible for individuals with soybean and birch allergies to consume more soybean food products. The developed method will serve as a useful tool for screening of processed soybean foods containing Gly m 4. However, we must consider the fact that allergic individuals can respond to one or more allergic components (Holzhauser et al., Citation2009) and that the susceptibilities to soybean allergenic components will differ among individuals (Ballmer-Weber et al., Citation2007). That said, the developed method is useful for diagnosis of soybean allergenic individuals because Gly m 4 is an important marker allergen (Berneder et al., Citation2013) in allergy test materials, used in a skin prick test or oral food challenge. In order to obtain more reliable diagnoses, Gly m 4 contents in the test materials should be standardised using a common method.
In conclusion, we developed an LC-MS/MS-based method for quantifying Gly m 4, a soybean allergen. This method demonstrated sufficient repeatability and reproducibility for Gly m 4 quantification as well as an acceptable low limit of quantification. Gly m 4 levels in processed soybean foods, such as soymilk and soy flour, were less than a quarter of what was detected in soybean grains. This newly developed method may facilitate the development of safer, hypoallergenic foods for individuals with soybean and related allergies.
Acknowledgements
The authors would like to thank all the people who provided valuable advice and technical support.
Disclosure statement
No potential conflict of interest was reported by the authors.
Additional information
Funding
Related Research Data
References
- Agilent Technologies Inc. (2010). Proteomics grade trypsin. Retrieved from www.chem-agilent.com/pdf/strata/204310.pdf
- Ballmer-Weber, B. K., Holzhauser, T., Scibilia, J., Mittag, D., Zisa, G., Ortolani, C., … Bindslev-Jensen, C. (2007). Clinical characteristics of soybean allergy in Europe: A double-blind, placebo-controlled food challenge study. Journal of Allergy and Clinical Immunology, 119(6), 1489–1496. doi: 10.1016/j.jaci.2007.01.049
- Berkner, H., Neudecker, P., Mittag, D., Ballmer-Weber, B. K., Schweimer, K., Vieths, S., & Rosch, P. (2009). Cross-reactivity of pollen and food allergens: Soybean Gly m 4 is a member of the Bet v 1 superfamily and closely resembles yellow lupine proteins. Bioscience Reports, 29(3), 183–192. doi:10.1042/BSR20080117
- Berneder, M., Bublin, M., Hoffmann-Sommergruber, K., Hawranek, T., & Lang, R. (2013). Allergen chip diagnosis for soy-allergic patients: Gly m 4 as a marker for severe food-allergic reactions to soy. International Archives of Allergy and Immunology, 161(3), 229–233. doi: 10.1159/000345970
- Ebisawa, M., Ito, K., & Fujisawa, T. (2017). Japanese guidelines for food allergy 2017. Allergology International, 66(2), 248–264. doi: 10.1016/j.alit.2017.02.001
- Geng, T., Liu, K., Frazier, R., Shi, L., Bell, E., Glenn, K., & Ward, J. M. (2015). Development of a sandwich ELISA for quantification of Gly m 4, a soybean allergen. Journal of Agricultural and Food Chemistry, 63(20), 4947–4953. doi: 10.1021/acs.jafc.5b00792
- Hanafusa, K., Murakami, H., Ueda, T., Yano, E., Zaima, N., & Moriyama, T. (2018). Worm wounding increases levels of pollen-related food allergens in soybean (Glycine max). Bioscience, Biotechnology, and Biochemistry, 1–9. doi: 10.1080/09168451.2018.1456319
- Heick, J., Fischer, M., Kerbach, S., Tamm, U., & Popping, B. (2011). Application of a liquid chromatography tandem mass spectrometry method for the simultaneous detection of seven allergenic foods in flour and bread and comparison of the method with commercially available ELISA test kits. Journal of AOAC International, 94(4), 1060–1068.
- Holzhauser, T., Wackermann, O., Ballmer-Weber, B. K., Bindslev-Jensen, C., Scibilia, J., Perono-Garoffo, L., … Vieths, S. (2009). Soybean (Glycine max) allergy in Europe: Gly m 5 (β-conglycinin) and Gly m 6 (glycinin) are potential diagnostic markers for severe allergic reactions to soy. Journal of Allergy and Clinical Immunology, 123(2), 452–458.e4. doi: 10.1016/j.jaci.2008.09.034
- Julka, S., Kuppannan, K., Karnoup, A., Dielman, D., Schafer, B., & Young, S. A. (2012). Quantification of Gly m 4 protein, a major soybean allergen, by two-dimensional liquid chromatography with ultraviolet and mass spectrometry detection. Analytical Chemistry, 84(22), 10019–10030. doi: 10.1021/ac3024685
- Kosma, P., Sjolander, S., Landgren, E., Borres, M. P., & Hedlin, G. (2011). Severe reactions after the intake of soy drink in birch pollen-allergic children sensitized to Gly m 4. Acta Paediatrica, 100(2), 305–306. doi: 10.1111/j.1651-2227.2010.02049.x
- Ma, L., Li, B., Han, F., Yan, S., Wang, L., & Sun, J. (2015). Evaluation of the chemical quality traits of soybean seeds, as related to sensory attributes of soymilk. Food Chemistry, 173, 694–701. doi: 10.1016/j.foodchem.2014.10.096
- Ma, S., Wang, R., Nie, L., & Yin, J. (2017). Pollen-food allergy syndrome in China. Food and Agricultural Immunology, 29(1), 182–192. doi: 10.1080/09540105.2017.1372372
- Minami, T., Fukutomi, Y., Saito, A., Sekiya, K., Tsuburai, T., Taniguchi, M., & Akiyama, K. (2015). Frequent episodes of adult soybean allergy during and following the pollen season. The Journal of Allergy and Clinical Immunology: In Practice, 3(3), 441–442.e1. doi: 10.1016/j.jaip.2014.11.024
- Mittag, D., Vieths, S., Vogel, L., Becker, W. M., Rihs, H. P., Helbling, A., … Ballmer-Weber, B. K. (2004). Soybean allergy in patients allergic to birch pollen: Clinical investigation and molecular characterization of allergens. Journal of Allergy and Clinical Immunology, 113(1), 148–154. doi: 10.1016/j.jaci.2003.09.030
- National Consumer Affairs Center of Japan. (2014). NCAC news. Retrieved from http://www.kokusen.go.jp/e-hello/news/pdf/ncac_news25_6.pdf
- Radauer, C., & Breiteneder, H. (2007). Evolutionary biology of plant food allergens. Journal of Allergy and Clinical Immunology, 120(3), 518–525. doi: 10.1016/j.jaci.2007.07.024
- Sancho, A. I., Foxall, R., Browne, T., Dey, R., Zuidmeer, L., Marzban, G., … Mills, E. N. C. (2006). Effect of postharvest storage on the expression of the apple allergen mal d 1. Journal of Agricultural and Food Chemistry, 54(16), 5917–5923. doi: 10.1021/jf060880m
- United States Department of Agriculture Agricultural Research Service. (2018). USDA food composition databases, no. 16108. Retrieved from https://ndb.nal.usda.gov/ndb/search/list?ds=Standard+Reference
- WHO/IUIS Allergen Nomenclature Sub-Committee. (2018). Allergen nomenclature. Retrieved from http://www.allergen.org/search.php